

Abstract
Background:
Influenza vaccination is the most effective way to prevent influenza and influenza-associated complications including those leading to hospitalization. Resources otherwise used for influenza could support caring for patients with Coronavirus Disease 2019 (COVID-19). The Health Resources and Services Administration (HRSA) Health Center Program serves 30 million people annually by providing comprehensive primary health care, including influenza vaccination, to demographically diverse and historically underserved communities. As racial and ethnic minority groups have been disproportionately impacted by COVID-19, the objective of this analysis was to assess disparities in influenza vaccination at HRSA-funded health centers during the COVID-19 pandemic.
Methods:
The Centers for Disease Control and Prevention (CDC) and HRSA analyzed cross-sectional data on influenza vaccinations from a weekly, voluntary Health Center COVID-19 survey after addition of an influenza-related question covering November 7–27, 2020.
Results:
During the three-week period, 1,126 (81%) of 1385 health centers responded to the survey. Most of the 811,738 influenza vaccinations took place in urban areas and in the Western US Region. There were disproportionately more health center influenza vaccinations among racial and ethnic minorities in comparison with county demographics, except among Non-Hispanic Blacks and American Indian/Alaska Natives.
Conclusions:
HRSA-funded health centers were able to quickly vaccinate large numbers of mostly racial or ethnic minority populations, disproportionately more than county demographics. However, additional efforts might be needed to reach specific racial populations and persons in rural areas. Success in influenza vaccination efforts can support success in SARS-CoV-2 vaccination efforts.
Keywords: COVID-19, influenza, vaccination
Introduction
With the exception of the 2020–2021 influenza season, every year, it is estimated that tens of millions of people in the United States become ill with seasonal influenza, resulting in hundreds of thousands of hospitalizations and tens of thousands of deaths(1). Signs and symptoms of influenza resemble those of Coronavirus Disease 2019 (COVID-19), including fever, chills, cough, difficulty breathing, fatigue, sore throat, runny or stuffy nose, body aches, and headache. As a result, it is challenging to differentiate between the diseases based on symptoms alone without diagnostic testing(2). Both influenza and COVID-19 can lead to serious complications. Some populations are at increased risk for serious influenza-related complications (e.g., pneumonia, myocarditis, encephalitis, multiple organ failure). This includes those 65 years or older, those with certain chronic medical conditions (e.g., asthma, diabetes, heart disease), pregnant women, and individuals younger than 5 years of age(3). Further, co-infection with influenza virus and SARS-CoV-2, the virus that causes COVID-19, can result in poorer outcomes than with SARS-CoV-2 infection alone(4).
Influenza vaccination is the most effective way to prevent influenza, reduce influenza severity, limit influenza-associated complications, and to reduce the burden on the healthcare system, allowing for utilization of medical resources to care for patients with COVID-19. Nationally, influenza vaccinations in the 2019—2020 influenza season prevented an estimated 7.5 (5.8–9.4) million cases of influenza, 3.7 (2.8–4.6) million influenza-associated medical visits, 105,000 (59,000–160,000) influenza-associated hospitalizations, and 6,300 (2,800–11,400) influenza-associated deaths(1). Influenza vaccination is associated with improved health due to the prevention of influenza-related complications for people with pre-existing heart disease, chronic lung disease, diabetes, and for those who are pregnant(5–8). Additionally, influenza vaccination of pregnant people can prevent influenza in their newborns for several months after birth(9). While CDC recommends that all people aged ≥6 months in the United States get an influenza vaccine by the end of October each year, there are still benefits of late-season vaccination into January or later, for as long as influenza viruses typically circulate(10).
The Health Resources and Services Administration (HRSA) Health Center Program (HCP) serves 30 million people annually by providing comprehensive primary health care, including influenza vaccination, to demographically diverse and historically underserved populations. The HCP supports 1,385 health centers that provide comprehensive primary health care (e.g., medical, dental, vision, behavioral health, and enabling services), including influenza vaccination, through 14,000 service delivery sites across the United States. “Health center” refers to both Federally Qualified Health Centers (FQHCs) and HCP Look-Alikes (which meet all HCP requirements but do not receive Section 330 award funding). During the COVID-19 pandemic, HRSA provided one-time COVID-19 funding to health centers to purchase, administer, and expand capacity for SARS-CoV-2 testing and to monitor COVID-19 response related activities, which included influenza vaccination efforts to avoid concomitant outbreaks of influenza during the COVID-19 pandemic.
Health centers serve diverse populations, many of whom are at high risk for many diseases or disease complications associated with poverty(11.) However, it was unknown how influenza vaccinations were reaching populations served by health centers during the COVID-19 pandemic. Moreover, identifying successes achieved in influenza vaccination reach could support success in SARS-CoV-2 vaccination, which was not yet available during the analysis period. The objective of this analysis was to assess successes and disparities in influenza vaccination at HRSA-funded health centers during the COVID-19 pandemic.
Methods
In April 2020, HRSA instituted a voluntary weekly survey to collect information on SARS-CoV-2 testing and related activities in health centers(12). During the week ending November 13, 2020, HRSA added a question about seasonal influenza vaccination (“By race and ethnicity, how many flu vaccinations did your health center administer in the last week?”) about seasonal influenza vaccination. In this cross-sectional analysis, CDC and HRSA analyzed data from health centers reporting on the total number of influenza vaccinations during November 7–27, 2020. Race and ethnicity variables were collapsed into eight mutually exclusive race/ethnicity categories: Hispanic/Latino, and non-Hispanic white, Asian, Black, American Indian/Alaska Native, Native Hawaiian/Other Pacific Islander, multiracial, and unreported. The number of vaccinations were summed across all reporting health centers, and percentages of vaccinations calculated by race/ethnicity, urbanicity (i.e., urban or rural), and US Census Region for all reporting areas. Additional stratifications were calculated by race/ethnicity for each US Census region. Ninety-five percent confidence intervals (Cis) are included, along with vaccination percentages. Comparison percentages used two separate measures: the percentage of each race/ethnic population in the county where health centers were located (i.e., the health center catchment area, obtained from the 2019 American Community Survey [ACS][13]), and the percentage of the population served (obtained from the 2019 HCP Uniform Data System annual patient population [14]).
Results
Eighty-one percent (N=1,126) of 1,385 health centers responded to the influenza vaccination question on the Health Center COVID-19 Survey during the three-week period. Three or more health centers responded from each US state and the District of Columbia, 20 in Puerto Rico, and 7 collectively in other US territories or Freely Associated States (American Samoa, Guam, Republic of the Marshall Islands, Federated States of Micronesia, Northern Mariana Islands, and the US Virgin Islands). During the three-week period, an estimated 3.3% (N=811,738) of health center patients (the number having medical records in 2019) received influenza vaccinations at HRSA health centers.
Health centers in urban areas administered most (82.0% CI: 81.9–82.1) of the 811,738 influenza vaccinations and represented 58% of the 1,126 health centers that responded to the COVID-19 Health Center Survey (Table 1). When characterized by US Census Region, 43.8% (CI: 43.7–43.9) of all vaccinations in the United States occurred in the Western Region, which included 28% of responding health centers (Table 1). The Midwestern region reported the lowest percentage (13.0%, CI: 12.9–13.1) of vaccinations and made up 21% of responding health centers (Table 1). By state, health centers in California administered nearly 29.8% (CI: 29.7–29.9) of influenza vaccinations, followed by New York at 11.1% (CI: 11.0–11.2), and 3%–4% (CI: 2.9–4.2) of influenza vaccinations in Texas, Illinois, Massachusetts, New Jersey, Oregon, and Michigan (data not shown).
Table 1.
Number and Percentage of Responding HRSA-funded Health Centers, and Number and Percentage of Influenza Vaccinations Administered, By US Census Region, Urbanicity, and Race/ethnicity - Health Center COVID-19 Survey, November 7—27, 2020
| Geographic characteristic | Number of health centers that responded to a weekly survey at least once, N | Percentage of health centers that responded to a weekly survey at least once | Number of influenza vaccinations administered, N | Percentage of influenza vaccinations administered | Percentage of vaccinations administered to Hispanic/Latinos | Percentage of county population that is Hispanic/Latino | Percentage of health center population that is Hispanic/Latino | Percentage of vaccinations administered to Non-Hispanic Whites | Percentage of county population that is Non-Hispanic White | Percentage of health center population that is Non-Hispanic White | Percentage of vaccinations administered to Non-Hispanic Asians | Percentage of county population that is Non-Hispanic Asian | Percentage of health center population that is Non-Hispanic Asian | Percentage of vaccinations administered to Non-Hispanic Blacks | Percentage of county population that is Non-Hispanic Black | Percentage of health center population that is Non-Hispanic Black | Percentage of vaccinations administered to Non-Hispanic American Indian/Alaska Natives | Percentage of county population that is Non-Hispanic American Indian/Alaska Native | Percentage of health center population that is Non-Hispanic American Indian/Alaska Native | Percentage of vaccinations administered to Non-Hispanic Native Hawaiian/Other Pacific Islander | Percentage of county population that is Non-Hispanic Native Hawaiian/Other Pacific Islander | Percentage of health center population that is Non-Hispanic Native Hawaiian/Other Pacific Islander | Percentage of vaccinations administered to Multiracial persons | Percentage of county population that is
Multiracial |
Percentage of health center population that is Multiracial |
|---|---|---|---|---|---|---|---|---|---|---|---|---|---|---|---|---|---|---|---|---|---|---|---|---|---|
| U.S. Census Region | |||||||||||||||||||||||||
| Northeast | 181 | 16% | 210,966 | 26% | |||||||||||||||||||||
| Midwest | 228 | 21% | 104,548 | 13% | 35.7% | 3.0% | 16.6% | 0.5% | |||||||||||||||||
| South | 385 | 35% | 136,977 | 17% | 28.0% | 33.6% | 36.0% | 1.6% | 1.4% | 23.1% | 31.0% | 0.5% | 0.8% | 0.2% | 0.4% | 2.4% | 2.4% | ||||||||
| West | 305 | 28% | 352,569 | 44% | 32.0% | 20.4% | 8.3% | 5.1% | 0.8% | ||||||||||||||||
| Total, United States | 1,099 | 100% | 805,060 | 100% | 24.4% | 11.8% | 10.9% | 0.5% | 0.5% | ||||||||||||||||
| U.S. Territories and Freely Associated States | |||||||||||||||||||||||||
| Puerto Rico | 20 | 74% | 5,620 | 17% | |||||||||||||||||||||
| Other areas* | 7 | 26% | 1,058 | 44% | |||||||||||||||||||||
| Total, U.S. Territories and Freely Associated States | 27 | 100% | 6678 | 100% | |||||||||||||||||||||
| Urbanicity | |||||||||||||||||||||||||
| Urban | 651 | 58% | 665,789 | 82% | |||||||||||||||||||||
| Rural | 475 | 42% | 145,949 | 18% | |||||||||||||||||||||
| Total, United States, U.S. Territories and Freely Associated States | 1,126 | 100% | 811,738 | 100% |
Based on those vaccinated in the United States who reported ethnicity or race (n=755,591), 49.2% (CI:49.1–49.3) were Hispanic/Latino, 11.8% (CI: 11.7–11.9) were Non-Hispanic Asian, 10.9% (CI: 10.8–10.9) were Non-Hispanic Black, and 0.5% (CI:0.4–0.6) were Non-Hispanic American Indian/Alaska Native, compared with 22.6% (CI: 22.6–22.6), 7.3% (CI: 7.3–7.3), 13.7% (CI:13.7–13.7), and 0.56% (CI:0.56–0.56) of ACS county population, respectively (Figure 1). When comparing percentage vaccinated for influenza with patients enrolled at the health centers, Non-Hispanic blacks (10.9% [CI: 10.8–10.9] vs. 18.0% [CI:17.9–18.1]) and American Indian/Alaska Natives (0.5% [CI:0.4–0.6] vs. 0.7% [CI: 0.69–0.71) were similarly underrepresented (Table 1). Non-Hispanic blacks were only underrepresented in vaccinations compared to county population in the Northeast (10.0% [CI: 9.9–10.1] vs. 13.3% [CI: 13.3–13.3]) and not in other regions. However, compared to the health center patient population, Non-Hispanic blacks were underrepresented in vaccinations in all US Census regions (Table 1). This was also true for Non-Hispanic American Indian/Alaska Native populations, with influenza vaccination underrepresentation only occurring in the West compared with county population, but underrepresentation in all regions compared with health center patient population. Influenza vaccination of Non-Hispanic Asians in the Northeast overwhelmed their vaccinations in other regions where they were underrepresented. Non-Hispanic whites were underrepresented in health center influenza vaccinations in all US regions compared with both county and health center patient populations.
Figure 1. Comparison of the Percentage of County Population and the Percentage of Influenza Vaccinations at HRSA-funded Health Centers, by Race/Ethnicity, November 7–27, 2020.
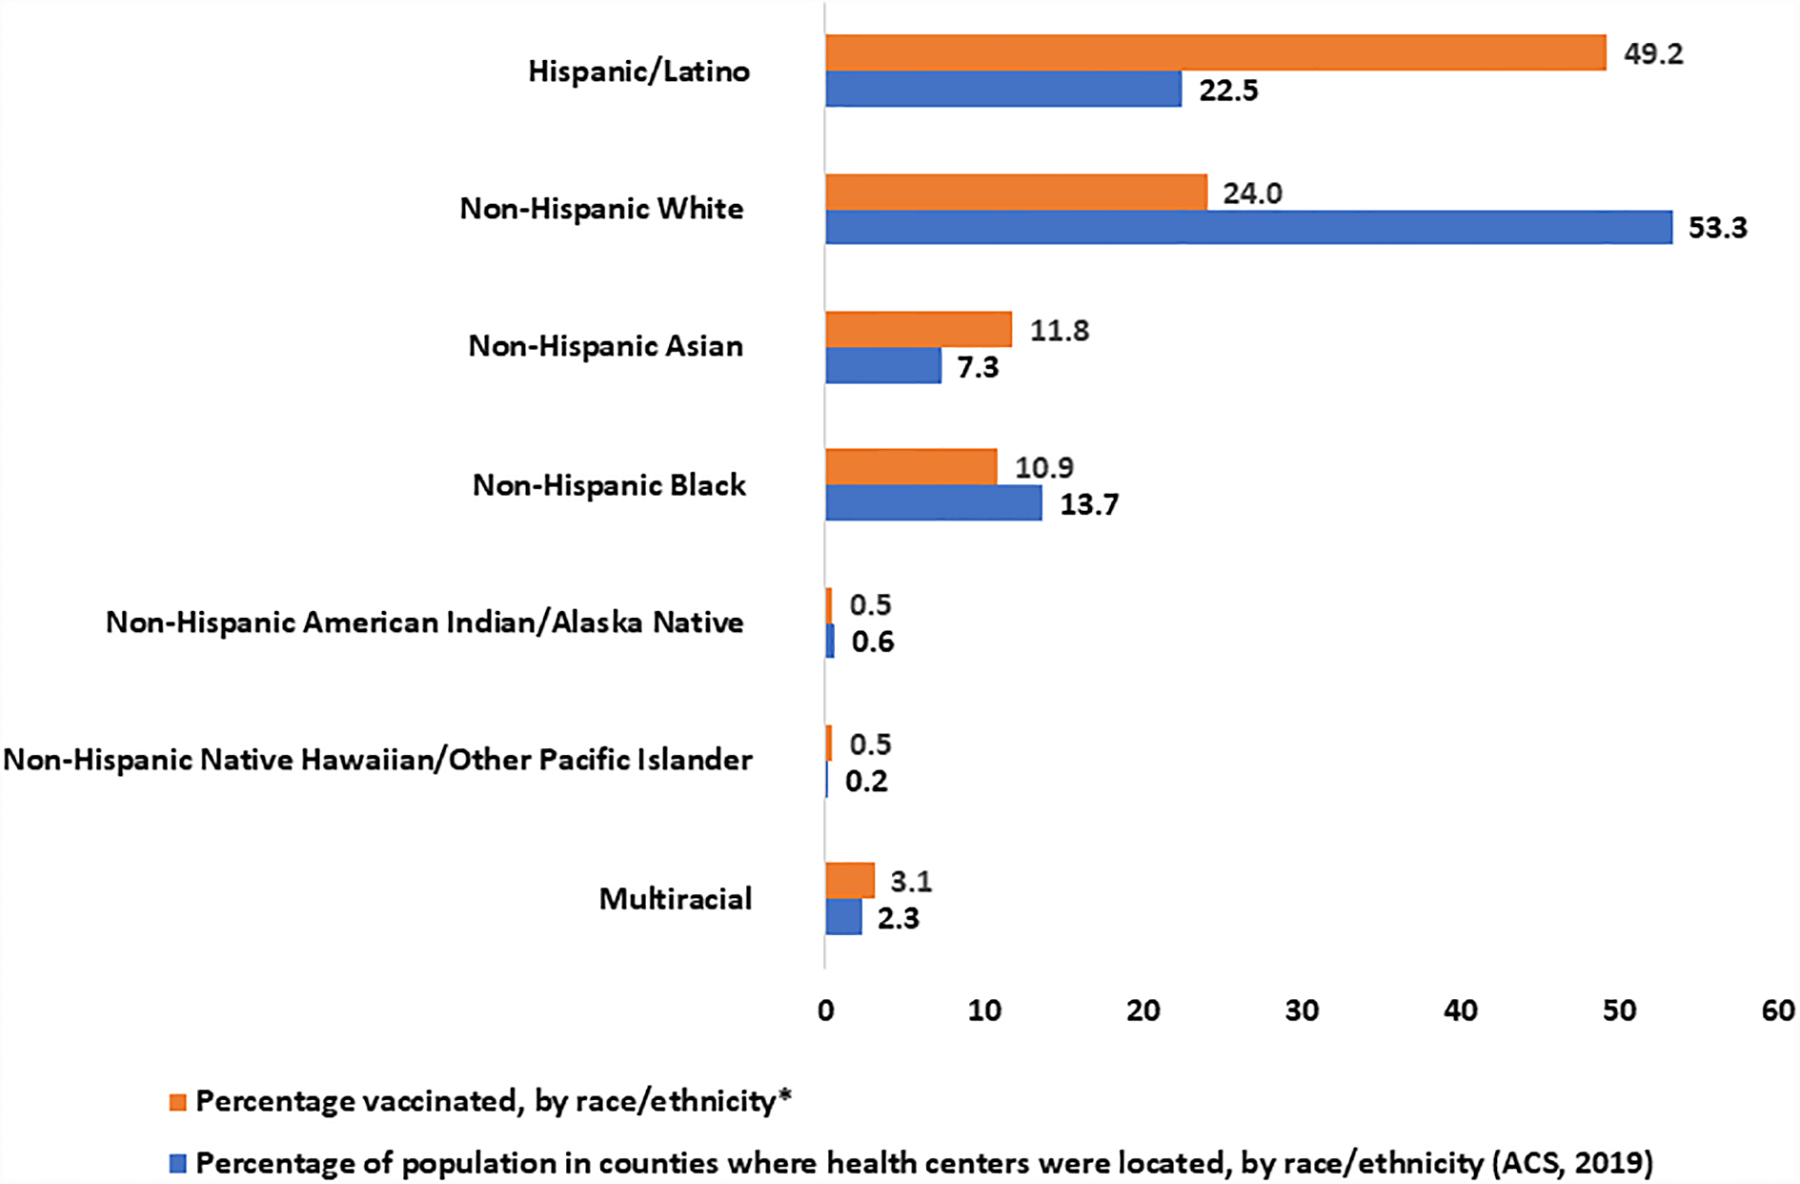
* County population data was obtained from the American Community Survey for the counties in which health centers were located that responded to the survey. The number of influenza vaccinations administered by HRSA-funded Health Centers in US states, excluding 6,678 in the US territories, during the period was 805,060. Patients having unknown race and ethnicity data (6% of vaccinations, n=49,469) were excluded from the displayed percentages (new N=755,591). Non-Hispanics with unreported race were included within the Multiracial category for comparison purposes. Percentages may not equal 100% due to rounding.
Discussion
During the 2019—2020 season, 48% of the US adult population (18 years and older) received influenza vaccination at all healthcare settings(15). During the three-week analysis period in November 2020, over 3% (811,738) of patients at 1,126 HRSA-funded health centers that responded to the survey received influenza vaccinations, including approximately 612,000 persons of race/ethnic minorities.
One disparity was in provision of services to rural areas. The analysis found that over 80% of influenza vaccinations took place in urban areas, compared with 58% of centers located there. Part of this is due to the fact that urban health centers serve larger patient populations than do rural health centers. Health centers operating in rural areas made up only 42% of responding centers and in the Midwest made up only 21% of responding centers, compared with their 18% and 13%, respectively, of vaccinations. Additional investigation of challenges encountered by health centers operating in rural areas and in the Midwest is warranted to further understand the barriers to vaccinating their communities and populations.
One noteworthy success was the vaccination of hundreds of thousands of persons of racial and ethnic minorities, many of whom consider HRSA-funded health centers their medical homes. Except among Non-Hispanic Blacks and American Indians/Alaska Natives, there were disproportionately more influenza vaccinations among racial and ethnic minorities in comparison with county racial/ethnic demographics. Hispanics/Latinos were well represented in the populations receiving influenza vaccinations, both compared to county population and to health center patient population. However, for non-Hispanic Blacks and American Indians/Alaska Natives, influenza vaccinations were only underrepresented in the Northeast and the West compared with the population in the counties where the health centers were located, but were underrepresented in all US regions when using health center patient population as the comparator. These results can guide where and to whom to target additional HRSA health center outreach in future vaccination efforts. Such outreach should address social risk factors, including vaccine hesitancy, financial, and logistical barriers to support community vaccination uptake.
Many HRSA-funded health centers already have policies to address some social risk factors and to ensure that services provided are culturally responsive for the communities served(16). Health centers provide high-quality, patient-centered, comprehensive primary health care services regardless of patients’ ability to pay. These services include supporting patients to stay up to date on vaccinations, following recommendations of CDC’s Advisory Committee on Immunization Practices (ACIP)(17), and leveraging best practices. To support vaccinations for uninsured patients, health centers collaborate with state and local public health departments to provide vaccinations at little to no cost to health center patients. Online scheduling, walk-in services, and drive-through vaccinations are offered to increase access. Health center staff review data to see who is being vaccinated and who is not, so that they can offer targeted services, outreach, and frequent prompts for current patients to encourage vaccination and completion of vaccination series. Messaging to patients is culturally responsive, based on assessments of patients’ health beliefs and barriers. Health center staff are trained in trauma-informed care, and motivational interviewing to address patient barriers and to support staff resiliency. Standing orders for vaccinations are used to facilitate health centers’ ability to vaccinate patients without requiring physician approval for each encounter and to enhance team-based care. Some health centers are also using dedicated vaccination rooms to increase patient and staff safety.
This analysis has implications for the provision of SARS-CoV-2 vaccinations, which will be ongoing at HRSA-funded health centers for many more months in 2021 and possibly into 2022. These health centers serve millions of racial and ethnic minorities who have been identified to be at high risk for SARS-CoV-2 infection and COVID-19 disease(18). COVID-19 incidence has been consistently higher than in Non-Hispanic White persons among Native Hawaiian/Pacific Islander, non-Hispanic American Indian or Alaska Native, and Hispanic/Latino persons(18). There is also elevated SARS-CoV-2 vaccine hesitancy among US racial/ethnic minorities, particularly among Blacks(19). Recently, $6 billion was awarded through the American Rescue Plan Act to HRSA-funded health centers for SARS-CoV-2 testing, vaccination, and treatment, and for expansion of operational capacity, including adding of mobile units(20).
The findings of this analysis are subject to some limitations. This analysis used data voluntarily reported by health centers to the weekly Health Center COVID-19 Survey during the analysis period and might not be representative of all health centers in the United States, its territories, and Freely Associated States, or during other periods. Health center vaccination data exclude patients who received vaccinations elsewhere, which might have varied by race and ethnicity. Moreover, health centers might have faced unique challenges in service provision or reporting during a pandemic. Race and ethnicity data were missing for approximately 6% of patients vaccinated for influenza. Health center patient population data underestimate the total population served by each center, because large numbers of walk-in clients come for specific services but are not entered into health centers’ electronic medical record systems and reported in the Uniform Data System. Finally, each health center reported aggregated data. Therefore, patient-level factors associated with influenza vaccination are not discernable.
HRSA-funded health centers were able to quickly vaccinate large numbers of mostly racial or ethnic minority populations, disproportionately more than county demographics. However, additional efforts might be needed to reach specific racial populations and persons in rural areas. Strong collaboration among local, state, and federal health agencies and health centers is essential to ensure vaccination success. In addition to potentially preventing seasonal influenza and its associated resource use, success in influenza vaccination efforts can support success in SARS-CoV-2 vaccination efforts and for future public health emergencies.
Acknowledgements
The authors acknowledge the hard work of the staff at HRSA-funded health centers who provided healthcare services and who completed the weekly Health Center COVID-19 Survey.
Footnotes
The findings and conclusions in this report are those of the authors and do not necessarily represent the official position of the CDC or other authors’ affiliated institutions.
References
- 1.CDC. Estimated Influenza Illnesses, Medical visits, and Hospitalizations Averted by Vaccination in the United States — 2019–2020 Influenza Season. https://www.cdc.gov/flu/about/burden-averted/2019-2020.htm. Accessed December 22, 2020.
- 2.CDC. Similarities and Differences between Flu and COVID-19. https://www.cdc.gov/flu/symptoms/flu-vs-covid19.htm. Accessed December 16, 2020.
- 3.CDC. Flu Symptoms & Complications. https://www.cdc.gov/flu/symptoms/symptoms.htm. Accessed December 16, 2020.
- 4.Yue H, Zhang M, Xing L, Wang K, Rao X, Liu H, Tian J, Zhou P, Deng Y, Shang J. The epidemiology and clinical characteristics of co-infection of SARS-CoV-2 and influenza viruses in patients during COVID-19 outbreak. J Med Virol. 2020; 92(11):2870–2873. [DOI] [PMC free article] [PubMed] [Google Scholar]
- 5.Udell JA, Zawi R, Bhatt DL, Keshtkar-Jahromi M, Gaughran F, Phrommintikul A, Ciszewski A, Vakili H, Hoffman EB, Farkouh ME, Cannon CP. Association between influenza vaccination and cardiovascular outcomes in high-risk patients: a meta-analysis. JAMA. 2013. October 23;310(16):1711–20. doi: 10.1001/jama.2013.279206. [DOI] [PubMed] [Google Scholar]
- 6.Bekkat-Berkani R, Wilkinson T, Buchy P, Dos Santos G, Stefanidis D, Devaster JM, Meyer N. Seasonal influenza vaccination in patients with COPD: a systematic literature review. BMC Pulm Med. 2017; 17(1):79. [DOI] [PMC free article] [PubMed] [Google Scholar]
- 7.Colquhoun AJ, Nicholson KG, Botha JL, Raymond NT. Effectiveness of influenza vaccine in reducing hospital admissions in people with diabetes. Epidemiol Infect. 1997; 119(3):335–341. [DOI] [PMC free article] [PubMed] [Google Scholar]
- 8.Thompson MG, Kwong JC, Regan AK, et al. Influenza Vaccine Effectiveness in Preventing Influenza-associated Hospitalizations During Pregnancy: A Multi-country Retrospective Test Negative Design Study, 2010–2016, Clinical Infectious Diseases. 2019; 68 (9);1444–1453. [DOI] [PubMed] [Google Scholar]
- 9.Madhi SA, Cutland CL, Kuwanda L, Weinberg A, Hugo A, Jones S, Adrian PV, van Niekerk N, Treurnicht F, Ortiz JR, Venter M, Violari A, Neuzil KM, Simões EA, Klugman KP, Nunes MC; Maternal Flu Trial (Matflu) Team. Influenza vaccination of pregnant women and protection of their infants. N Engl J Med. 2014; 371(10):918–31. [DOI] [PubMed] [Google Scholar]
- 10.Grohskopf LA, Alyanak E, Broder KR, et al. Prevention and Control of Seasonal Influenza with Vaccines: Recommendations of the Advisory Committee on Immunization Practices — United States, 2019–20 Influenza Season. MMWR Recommendations and Reports. 2019; 68(3); 1–21. [DOI] [PMC free article] [PubMed] [Google Scholar]
- 11.HRSA. HRSA Health Center Program. https://bphc.hrsa.gov/sites/default/files/bphc/about/healthcenterfactsheet.pdf Accessed December 22, 2020.
- 12.HRSA Health Center COVID-19 Survey. https://bphc.hrsa.gov/emergency-response/coronavirus-health-center-data/ Accessed December 22, 2020.
- 13.US Census Bureau. The 2019 American Community Survey: United States Profile, Race and Ethnicity. https://www.census.gov/programs-surveys/acs Accessed December 10, 2020.
- 14.HRSA Uniform Data System. https://bphc.hrsa.gov/datareporting/reporting/index.html Accessed December 22, 2020.
- 15.CDC. Flu Vaccination Coverage, United States, 2019–20 Influenza Season. https://www.cdc.gov/flu/fluvaxview/coverage-1920estimates.htm. Accessed December 22, 2020.
- 16.National Association of Community Health Centers vignettes. https://www.nachc.org/wp-content/uploads/2020/12/CallenLorde_vignette_4.pdf; https://www.nachc.org/wp-content/uploads/2020/12/SWChicago_vignette_4.pdf; https://www.nachc.org/wp-content/uploads/2020/12/CHCInc_vignette_4.pdf
- 17.National Vaccine Advisory Committee. Recommendations from the National Vaccine Advisory committee: standards for adult immunization practice. Public Health Rep. 2014; 129(2):115–23. [DOI] [PMC free article] [PubMed] [Google Scholar]
- 18.Van Dyke ME, Mendoza MCB, Li W, Parker EM, Belay B, Davis EM, Quint JJ, Penman-Aguilar A, Clarke KEN. Racial and Ethnic Disparities in COVID-19 Incidence by Age, Sex, and Period Among Persons Aged <25 Years - 16 U.S. Jurisdictions, January 1-December 31, 2020. MMWR Morb Mortal Wkly Rep. 2021; 70(11):382–388. [DOI] [PMC free article] [PubMed] [Google Scholar]
- 19.Nguyen LH, Joshi AD, Drew DA, Merino J, Ma W, Lo CH, Kwon S, Wang K, Graham MS, Polidori L, Menni C, Sudre CH, Anyane-Yeboa A, Astley CM, Warner ET, Hu CY, Selvachandran S, Davies R, Nash D, Franks PW, Wolf J, Ourselin S, Steves CJ, Spector TD, Chan AT. Racial and ethnic differences in COVID-19 vaccine hesitancy and uptake. medRxiv [Preprint]. 2021. doi: 10.1101/2021.02.25.21252402. [DOI] [Google Scholar]
- 20.White House Briefing Room Statements and Releases. March 25, 2021. https://www.whitehouse.gov/briefing-room/statements-releases/2021/03/25/fact-sheet-biden-administration-announces-historic-10-billion-investment-to-expand-access-to-covid-19-vaccines-and-build-vaccine-confidence-in-hardest-hit-and-highest-risk-communities/ Accessed April 4, 2021.