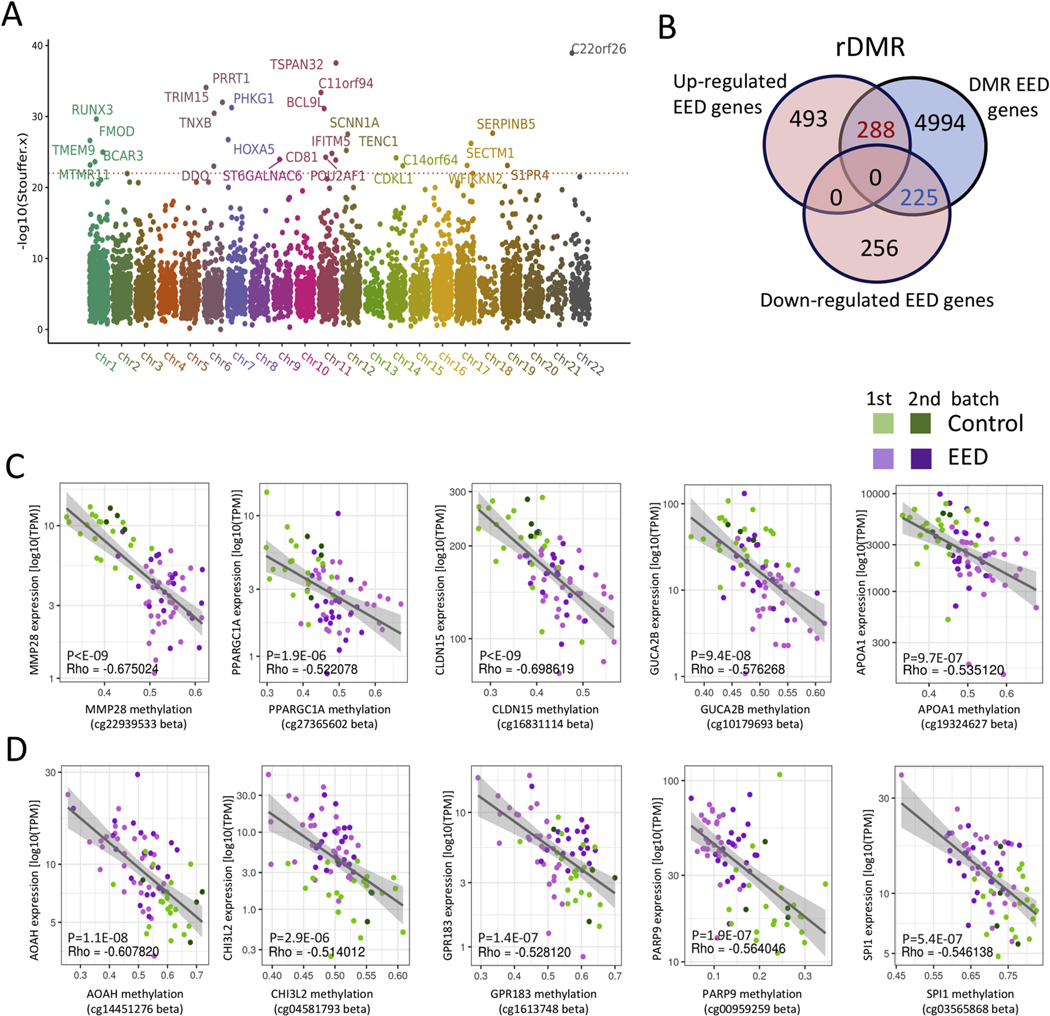
Figure 3.
Variation in DNAm associated with expression of immune and metabolic genes in EED. Genome-wide intestinal DNAm was profiled in DNA prepared from duodenal biopsy specimens using the Illumina Infinium MethylationEPIC BeadChip platform. (A) A Manhattan plot is shown displaying the overlapping DMRs associated with EED in 2 methylation profile batches including 31 malnourished AKU-EED cases compared with 21 well-nourished Cincinnati controls in batch 1, and 33 malnourished AKU-EED cases compared with 9 well-nourished Cincinnati controls in batch 2, of which 12 AKU-EED cases and 5 Cincinnati controls were tested in both batches. The corrected P values (−log10 Stouffer) of each DMR are plotted against their respective positions on each chromosome. (B) The Venn diagram shows the overlap between 481 down- and 781 up-regulated genes in the EED transcriptome and DMRs highlighting 453 rDMR including genes that show evidence for both differential methylation (DM) and differential expression (DE). Beta-value methylation levels of differentially methylated points within rDMR showing a significant relationship (P < 1E-6) between methylation levels and expression (TPM) of specific down- (C) and up-regulated (D) genes as indicated. We highlight genes that are expressed in intestinal epithelial cells based upon a previous isolated ileal epithelial cell dataset13 and single-cell datasets.22 The gray lines illustrate a linear model fit, whereas rho values indicate the Spearman correlation coefficients.

