Abstract
The primary objective of this research was to model and understand the chelate-modified Fenton reaction for the destruction of trichloroethylene (TCE) present in both the aqueous and organic (in the form of droplets) phases. The addition of a nontoxic chelate (L), such as citrate or gluconic acid, allows for operation at near-neutral pH and controlled release of Fe(II)/Fe(III). For the standard Fenton reaction at low pH in two-phase systems, an optimum H2O2:Fe(II) molar ratio was found to be between 1:1 and 2:1. Experimentation proved the chelate-modified Fenton reaction effectively dechlorinated TCE in both the aqueous and organic phases at pH 6–7 using low H2O2:Fe(II) molar ratios (4:1 to 8:1). Increasing the L:Fe ratio was found to decrease the rate of H2O2 degradation in both Fe(II) and Fe(III) systems at near-neutral pH. Generalized models were developed to predict the concentration of TCE in the aqueous phase and TCE droplet radius as a function of time using literature-reported hydroxyl radical reaction kinetics and mass transfer relationships. Additional aspects of this work include the reusability of the Fe–citrate complex under repeated H2O2 injections in real water systems as well as packed column studies for simulated groundwater injection.
Keywords: iron, citrate, TCE droplet, DNAPL, groundwater, hydroxyl radical
Introduction
Groundwater remediation of trichloroethylene
Contamination of groundwater by toxic organic compounds is an issue that deserves much attention. Trichloroethylene (TCE) is a volatile, halogenated organic compound that was once a widely used degreasing agent. Two decades ago, over 200 million pounds of TCE were produced in the United States each year (Vogel et al., 1987). Although the majority of TCE lost to the environment is via volatization, large plumes of TCE have been reported in various groundwater systems (Rivett et al., 2001). Since concentrations of TCE can be above the solubility limit in water (1,000–1,100 ppm), a majority of the TCE is often present in the form of a dense, nonaqueous phase liquid (DNAPL), particularly at high depth (Russell et al., 1992). Several current remediation techniques successfully treat the dissolved TCE, but are unable to treat the DNAPL itself, eventually resulting in a rebound of TCE in the groundwater. Over the years, much effort has been put into the cleanup of TCE and other contaminants using various remediation technologies. An efficient and cost effective procedure is required for removing toxic organic compounds from groundwater.
Many different strategies have been used for the removal of toxic organic compounds from the subsurface. Pump-and-treat methods have long been used for groundwater remediation, but are very expensive for the amount of contaminant removed and require long periods of time to treat the affected area. In air-stripping operations, TCE is transferred from groundwater to air, but not destroyed. Biological remediation can be performed under both aerobic and anaerobic conditions, and is capable of completely mineralizing TCE (Russell et al., 1992; Laine and Cheng, 2007), but these methods have limited applicability. Degrading TCE through the use of chemicals via oxidative and reductive pathways has been proven to be an effective groundwater remediation technology (Laine and Cheng, 2007).
It was once thought that since TCE is already in an oxidized state, attempting to further oxidize the compound would not be an effective remediation strategy (Russell et al., 1992). However, several powerful oxidants are able to effectively degrade TCE and many other organic contaminants. Various advanced oxidative processes (AOPs) have been used for in situ chemical oxidation (ISCO). Currently, the three main oxidants in use for ISCO are permanganate (KMnO4 NaMnO4), ozone (O3), and Fenton’s reagent.
Permanganate, usually in the form of KMnO4, has the slowest reaction rate of the three oxidants, but also has the highest stability. It has been proven effective from a pH of 3.5 to 12 and, depending on the pH, degrades pollutants by either direct oxidation or hydroxyl radical (OH·) generation (Siegrist et al., 2000). Although it can treat a wide variety of pollutants, it has proven ineffective on BTEX, diesel fuel, and gasoline (Amarante, 2000). Ozone (O3) is also capable of oxidizing pollutants by either direct oxidation or hydroxyl radical generation, but mainly under acidic conditions (Brunet et al., 1984; Masten and Hoigne, 1992; Yasunaga and Hirotsuji, 2008). It is very unstable in the subsurface and requires expensive on-site generation (Amarante, 2000).
Standard Fenton reaction
The mechanism for the standard Fenton reaction (Fenton’s reagent) was first proposed by Haber and Weiss in 1934. The reaction of hydrogen peroxide with Fe(II) proceeds as follows (De Laat and Gallard, 1999):
| (1) |
The reactants used for the standard Fenton reaction are environmentally friendly and inexpensive, especially when compared to other oxidative techniques. As shown, Reaction 1 generates the hydroxyl radical, an electrophile and strong oxidizing agent (E0 = 2.73 V), which reacts with most organic contaminants (Haber and Weiss, 1934; Walling, 1975). The rate constant of this reaction is widely reported as 63M−1s−1, but varies with pH due to Fe(II) speciation (Kwan and Voelker, 1996). Through a series of propagation reactions [Equations (2–10)] at acidic pH, ferric iron is reduced to ferrous iron then reacts to form more hydroxyl radicals via Reaction 1 (Lin and Gurol, 1998; Ravikumar and Gurol, 1994; DeLaat and Gallard, 1999; Wang and Lemley, 2001; Pignatello et al., 2006). Iron is said to be catalytic in this respect. It should also be noted that the rate constant for Reaction 8 is four orders of magnitude lower than that of Reaction 1, and therefore is the rate-limiting step in this catalytic cycle.
| (2) |
| (3) |
| (4) |
| (5) |
| (6) |
| (7) |
| (8) |
| (9) |
| (10) |
Several problems arise for application of this process in situ. The high buffering capacity of groundwater systems maintains a near-neutral pH, resulting in the precipitation of Fe(III) as Fe(OH)3 (Watts and Teel, 2005). Lowering the groundwater pH may be feasible for small treatment areas, but not for larger areas. Fe(OH)3 precipitation not only prevents Fe(III) from reducing to Fe(II), but can also cause injection-well plugging. Other problems include rapid heat generation, limited mobility of the reactants, and the hazards of transporting highly concentrated hydrogen peroxide. The hydroxyl radical’s reaction rate with most organic contaminants is on the order of 108−1010M−1s−1 and is therefore diffusion limited (~1010 M−1s−1 in water) (Watts and Teel, 2005).
Chelate-modified Fenton reaction
The problems related to the application of the standard Fenton reaction for ISCO can be alleviated through the use of the chelate-modified Fenton reaction. This involves the addition of a nontoxic chelate (L) such as citrate or gluconic acid. Gluconic acid and hydrogen peroxide can be generated on site, eliminating the need for transportation of highly concentrated hydrogen peroxide (Ahuja et al., 2007). The chelate is capable of binding ferrous and ferric iron, reducing concentrations of Fe(II) and Fe(III) in solution. This limits the amounts of Fe(II) and Fe(III) available for reaction with H2O2, thus controlling the rate of hydroxyl radical generation. The use of a chelate for remediation in aerobic environments minimizes Fe(II) oxidation by O2. Li et al. (2007b) demonstrated that dissolved oxygen has no effect on the degradation of trichlorophenol (TCP) by the chelate-modified Fenton reaction using polyacrylic acid (PAA) as the chelating agent. Sun and Pignatello (1992) documented the interactions of dozens of chelating agents, such as EDTA and catechol, with Fe(III) as well as their effect on the reactivity of the Fe(III)–chelate complexes with H2O2 for 2,4-D oxidation.
TCE degradation
Hydroxyl radical degradation of TCE is second order in nature (kTCE = 4×10⁹M−1s−1) and generally forms intermediates such as di- and trichloroacetic acids, which are more easily degraded by microbes (Pignatello et al., 1999; Watts and Teel, 2005; Li et al., 2007a). These are then oxidized further by hydroxyl radicals and, if run to completion, the final products are expected to be organic acids and carbon dioxide. On the fringes of the reactive zone in real systems, the intermediates and some TCE may not be fully oxidized. In the subsurface, most hydrophobic organic contaminants present in concentrations higher than their solubility limits are in droplet form (Roy-Perreault et al., 2005; Yaron-Marcovich et al., 2007). These droplets are generally trapped within the soil, making them very difficult to treat and impeding their dissolution into the aqueous phase (Kennedy and Lennox, 1997). Figure 1 illustrates a possible distribution of TCE in the subsurface.
FIG. 1.
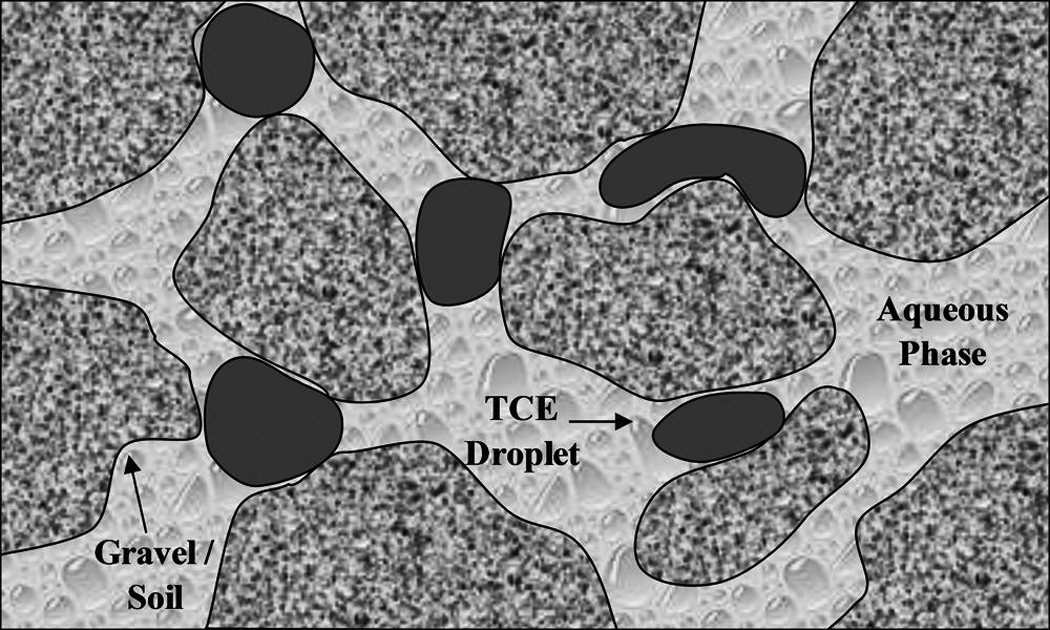
Illustrative example of DNAPL distribution in aquifer (adapted from Kennedy and Lennox, 1997).
Sorption of contaminants to soil surfaces could also affect in situ degradation by limiting their availability to free radical attack. Watts et al. (1994) showed that hexachlorobenzene sorbed to silica sand surfaces exhibits greater rates of degradation using a Fenton-like system than was lost by desorption. In addition to direct contaminant destruction, Morgan and Watkinson (1992) showed the addition of hydrogen peroxide aids in the bioremediation of groundwater.
Considerable research on Fenton-like reactions for the destruction of organic contaminants present in the aqueous phase has been done. However, in order to effectively treat DNAPLs, information regarding the destruction of contaminants in both aqueous and organic phases is essential. To our knowledge, fundamental studies dealing with TCE droplet degradation by hydroxyl radical reactions have not been reported in the literature. Objectives of this research include:
Determine the effect of chelate (citrate):Fe(II) ratio on the rate of H2O2 degradation
Determine the effect of H2O2 dosing on TCE dechlorination
Study the destruction of TCE droplets via standard and chelate-modified Fenton reactions
Develop a kinetic model to describe the destruction of TCE in both aqueous and nonaqueous phases.
Experimental Methods
Chemicals
All chemicals used were of reagent grade. TCE, ferrous sulfate, sodium citrate, sodium phosphate, hydrogen peroxide (30 wt%), pentane, sodium hydroxide, sulfuric acid, and deionized ultrafiltered (DIUF ) water were all purchased from Fisher Scientific. (Fairlane, NJ ). Copper(II) sulfate was purchased from EM Science. (Gibbstown, NJ ). 2,9-Dimethyl-1,10-phenanthroline (DMP) and 1,2-dibromoethane (EDB) were purchased from Sigma-Aldrich. (St. Louis, MO). Chloride reference solution (1,000 ppm) was purchased from Thermo Electron Corporation. (Pittsburgh, PA). Sodium nitrate was purchased from LabChem Inc. (Pittsburgh, PA).
Experimental procedure
For standard Fenton reactions, ferrous sulfate was added to deoxygenated DIUF water and the pH was adjusted to ~3. For chelate-modified Fenton reactions, sodium citrate was added to deoxygenated DIUF water, the pH was adjusted to ~3, followed by the addition of ferrous salt and adjustment of the pH to neutral. TCE was added to these solutions, which were then sealed and allowed to mix for certain reaction times. For experiments with TCE present in both aqueous and organic (droplet) phases, saturated solutions of TCE were prepared overnight and excess TCE constituting the organic phase was added before initiating the reaction. For batch experimentation, reactions were conducted in 500mL flasks with continuous mixing at 600 rpm and N2 in the headspace (~75 mL) at room temperature (22–25°C). The spherical flasks had three ports in the top of the vessel, which were sealed with glass fittings: one contained an inlet for a pH probe, one contained a septum for sampling, and the final port contained either an inlet for a thermometer or a glass plug. Samples (4.5–5.0 mL) were taken using a syringe inserted through the septum. H2O2 was injected through a septum to initiate the reaction in either one dose for lower concentrations or six doses over 10 min for higher concentrations. The temperature of the reaction solution was found to increase a maximum of 3°C for experiments using the highest concentrations of reactants used (8 mmol/L Fe2+ and 32 mmol/L H2O2). In control experiments, some loss of TCE occurred due to volatization over the reaction time. Adjustments to pH were made using 4N H2SO4 and 6.25N NaOH. Experiments used for kinetic modeling were conducted in triplicate.
As part of this study, site-specific RGA aquifer materials were collected from a location identified by Sexton (2005) as an outcrop of the Regional Gravel Aquifer (RGA). Groundwater samples for experiments using natural water were collected from a local residential well outside of the TCE contaminant plumes from areas surrounding the Paducah Gaseous Diffusion Plant (PGDP) and supplied by the Kentucky Research Consortium for Energy and Environment (KRCEE) in cooperation with the Kentucky Water Resources Research Institute (KWRRI). When received, this water contained no TCE. The groundwater properties are shown in Table 1.
Table 1.
DOE Site Average Water Quality Based on 10 Monitoring Wells
| Alkalinity | 82 mg L−1 |
| Ca2+ | 24 mg L−1 |
| Cl− | 55 mg L−1 |
| Dissolved oxygen (DO) | 3 mg L−1 |
| Fe(II)/Fe(III) | 0.3 mg L−1 |
| NO3− | 3 mg L−1 |
| PO43− | 2 mg L−1 |
| SO42− | 13 mg L−1 |
| Total dissolved solids (TDS) | 293 mg L−1 |
| Total organic carbon (TOC) | 1.2 mg L−1 |
H2O2 measurement
Hydrogen peroxide concentrations were measured using the method described by Kosaka et al. (1998). One milliliter each of 0.01M copper(II) sulfate, 2,9-Dimethyl-1,10-phenanthroline (DMP) solution, and 0.1M phosphate buffer (pH 7) were added to 3mL of diluted sample. DMP solution was prepared by dissolving 1 g DMP in 100mL ethanol. The absorbance of the solution was measured at wavelength 454nm using a Varian Cary 300 Spectrophotometer. The calibration curve was created using 12 concentrations ranging from 10 to 300 µM with R2 = 0.9997 and average analytical error of 2.0%.
GC/MS analysis
After a sample from the reaction vessel was taken, TCE was extracted with pentane previously spiked with an internal standard of 100ppm EDB. TCE concentrations were measured by manually injecting a 1-µL liquid sample in a 60m×0.25mm×1.4 µm film thickness Supelco SPB-624 fused silica capillary column installed in a Hewlett Packard 5890 Series II Gas Chromatography and Mass Spectrometer, model number 5971. The column was operated at 35°C for 2 min, raised to a final temperature of 190°C at a rate of 10°C/min, and held for 2 min. The carrier gas used was ultrahigh purity helium. The calibration curve was created using seven concentrations ranging from 0.035 to 2.77 mmol/L TCE with R2 = 0.9982 and average analytical error of 5.3%.
Cl− analysis
Either a Thermo Orion ion-selective electrode or an Accumet Chloride Combination Electrode was used for measuring Cl− concentrations. The calibration curve was created using six concentrations ranging from 0.14 to 5.6 mmol/L Cl−. In agreement with previous Cl− analysis by our group, multiple calibrations were produced with different concentrations of citrate to account for citrate interference (Li et al., 2005). R2 values ranged from 0.9933 to 0.9987 with average analytical error from 3.8% to 8.6%. Calibration curves were checked with standards before measuring samples.
Results and Discussion
This section first focuses on the destruction of TCE droplets using the standard Fenton reaction. Then, the chelate’s effect on Fe(II) concentration in solution is quantified using equilibrium values of Fe-hyroxide species and Fe–citrate complexes reported in the literature. The effects of the resulting Fe–chelate equilibiria and of iron speciation on hydrogen peroxide degradation are then discussed. The applicability of the chelate-modified Fenton reaction to groundwater systems is tested using natural water and, separately, a packed column for simulated groundwater flow. A model for the degradation of TCE in both the aqueous and nonaqueous phases is developed.
TCE droplet degradation with standard Fenton reaction
The standard Fenton reaction operates most efficiently at pH below 3 (Pignatello et al., 2006). However, as discussed earlier, application of Fenton processes at low pH in large groundwater systems is highly impractical. A series of experiments using a 1:1 TCE:Fe(II) molar ratio were conducted to determine the optimum amount of hydrogen peroxide for complete dechlorination of both TCE droplets and TCE in the aqueous phase. These experiments were conducted at a low initial pH of approximately 2.5 and allowed to continue without pH adjustment as the pH did not vary significantly as the reaction proceeded. Twenty hours after adding the hydrogen peroxide, the quantities of TCE and Cl− were analyzed, as shown in Fig. 2. The 1:1 H2O2:Fe(II) molar ratio resulted in the formation of 47% of the maximum possible Cl− concentration and an 81% reduction in the amount of TCE present. The higher H2O2:Fe(II) ratios degraded almost 100% of the available TCE and formed approximately 82% of the maximum possible Cl−. In the control, in which no H2O2 was added, a 29% loss of TCE was observed. To analyze the amount of TCE present in the droplet phase via extraction, the reactor vessel was opened, therefore contributing to TCE loss due to volatility. Because no droplets were present when the analysis of TCE was performed on the vessels containing H2O2, this problem was only encountered in the control run. This loss is the largest contributor to the deviations between the actual and theoretical chloride formation. Another contributing factor is the presence of chlorinated organic intermediates. This data indicates the optimum H2O2:Fe(II) molar ratio for dechlorination of TCE in both droplet and dissolved form at pH 2.5 is between 1:1 and 2:1. Teel et al. (2001) found the optimum H2O2:Fe(II) molar ratio to be 1:1 for TCE degradation in the aqueous phase. H2O2 in excess of this 1:1 ratio is required to degrade the TCE present in droplet form.
FIG. 2.
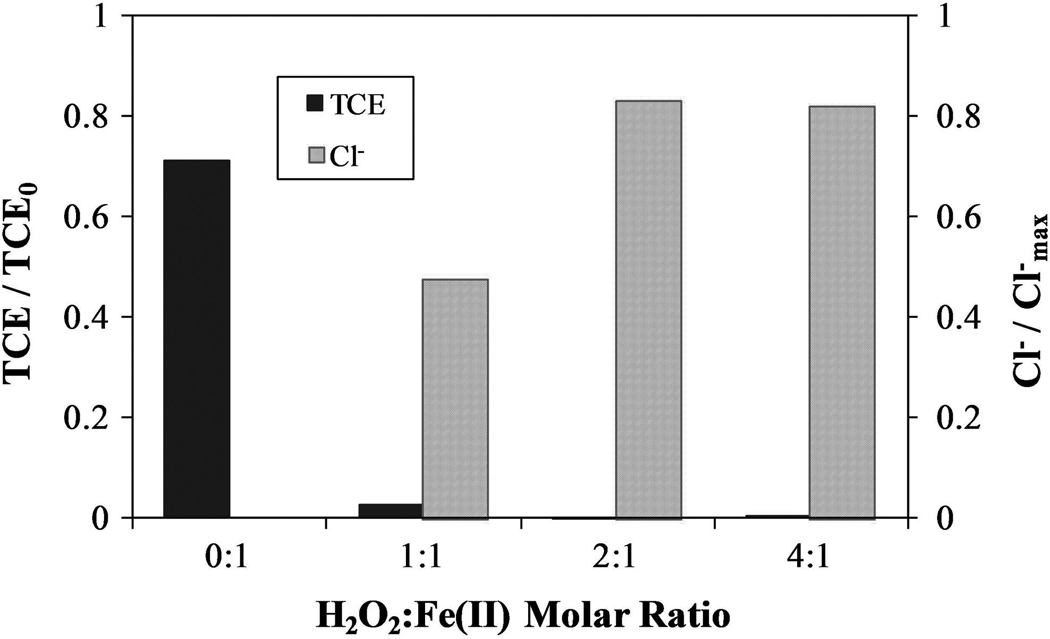
TCE reacted and Cl− formed at 20 h for varying Fe(II):H2O2 molar ratios with equivalent initial TCE concentration of 15.2 mmol/L and TCE:Fe(II) molar ratio of 1:1. TCE present in both aqueous and organic phases. Control experiment conducted with no addition of H2O2. pH ~ 2.5.
When similar reactions are performed (without chelate) at near-neutral or high pH, the amount of TCE degraded drops dramatically. Thus, this process must be modified to perform efficiently at near-neutral pH.
Iron–chelate equilibria
The use of a chelate reduces the amount of free Fe(II) and Fe(III) in solution, but is pH dependent. The equilibrium reactions associated with citrate as well as the complexation of Fe species with citrate are given in Equations (11–20), where L = L4− (Inczedy, 1976; Brady and Humiston, 1982; Li et al., 2005).
| (11) |
| (12) |
| (13) |
| (14) |
| (15) |
| (16) |
| (17) |
| (18) |
| (19) |
| (20) |
Using Equations (12–20) and those associated with the hydrolysis of Fe2+ and Fe3+ [Equations (21–27)], the speciation of virtually any Fe–citrate solution can be computed for a given pH (Baes and Mesmer, 1976). The speciation of ferrous iron is shown in Figure 3. As pH approaches neutral, only a small amount of Fe is in an uncomplexed form. As pH decreases, more iron is released from this complex, which results in an increase in the overall rate of reaction. Similar calculations for ferric iron have been made, but are not shown here.
| (21) |
| (22) |
| (23) |
| (24) |
| (25) |
| (26) |
| (27) |
FIG. 3.
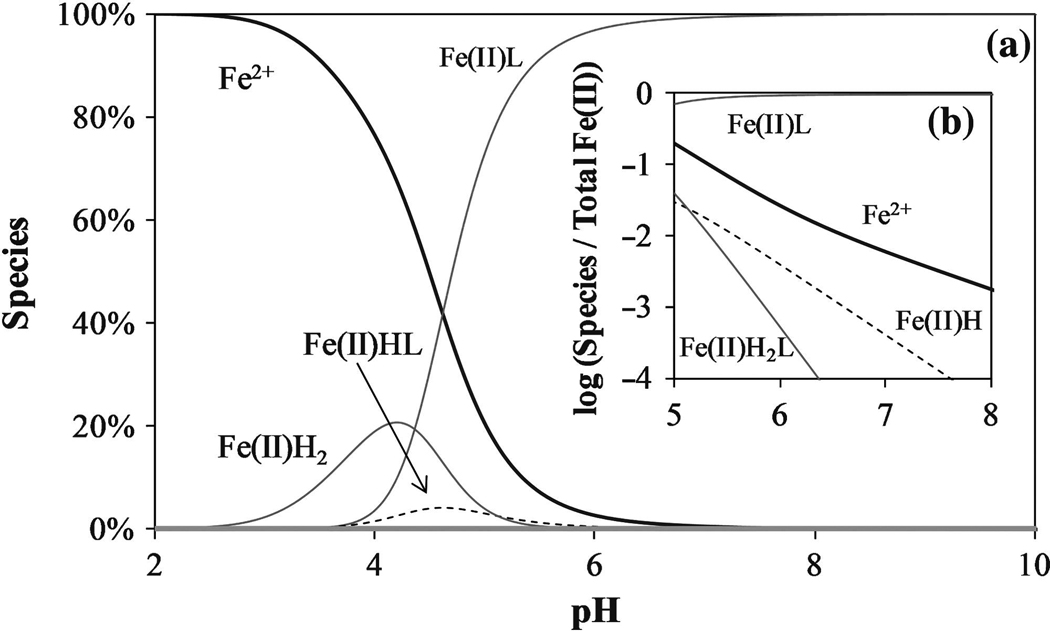
(a) Fe(II) species distribution as a function of pH. Total [Fe(II)] = 10 mmol/L, L/[Fe(II)] = 1, L = citrate. (b) Fe(II) species distribution for pH = 5 to 8.
Adjusting the [L]:[Fe] ratio allows one to control the amount of Fe(II) and Fe(III) in solution and alter the generation of hydroxyl radicals as desired. To correctly determine the rates of free radical generation, quantification of the equilibrium distribution of iron is necessary.
Effect of L:Fe ratio and Fe speciation on H2O2 decomposition
The initial reaction rate of Fe(II) with H2O2 is very rapid, but as more Fe(II) is oxidized to Fe(III), the decomposition of H2O2 slows significantly due to the higher reaction rate of H2O2 with Fe(II) compared to Fe(III) [Equations (1) and (8), respectively]. Figures 4 and 5 illustrate the decomposition of H2O2 in the presence of ferrous and ferric iron, respectively, with varying [L]:[Fe] molar ratios (L = citrate). When ferrous iron is used, the initial rate of H2O2 decomposition is very rapid. However, when ferric iron is used, the decomposition is much slower and almost linear, indicating a zero-order reaction. As expected, the rate-limiting step in the reactions between ferrous/ferric iron and H2O2 is Reaction 8, and thus confirms the rate of the reaction depends mostly on the concentration of Fe(II). In addition to the speciation of iron, the [L]:[Fe] ratio plays an important role in determining the rate of H2O2 degradation. This rate decreases as this molar ratio is increase from 1:1 to 4:1 and, in conjunction with other findings, indicates Fe–citrate complexes are nonreactive with H2O2 when compared to uncomplexed iron (Li et al., 2007b). Increasing the L:Fe ratio increases the efficiency of H2O2 consumption by reducing the rate of hydroxyl radical production. Lowering the concentration of uncomplexed Fe species should reduce the quantities of H2O2 and hydroxyl radicals consumed in Reactions 3–5, and 7, leaving more hydroxyl radicals available for reaction with TCE. Depending on the conditions present at a given groundwater site, the [L]:[Fe] and [Fe(II)]:[Fe(III)] ratios can be adjusted to allow for the optimization of H2O2 consumption and TCE degradation.
FIG. 4.
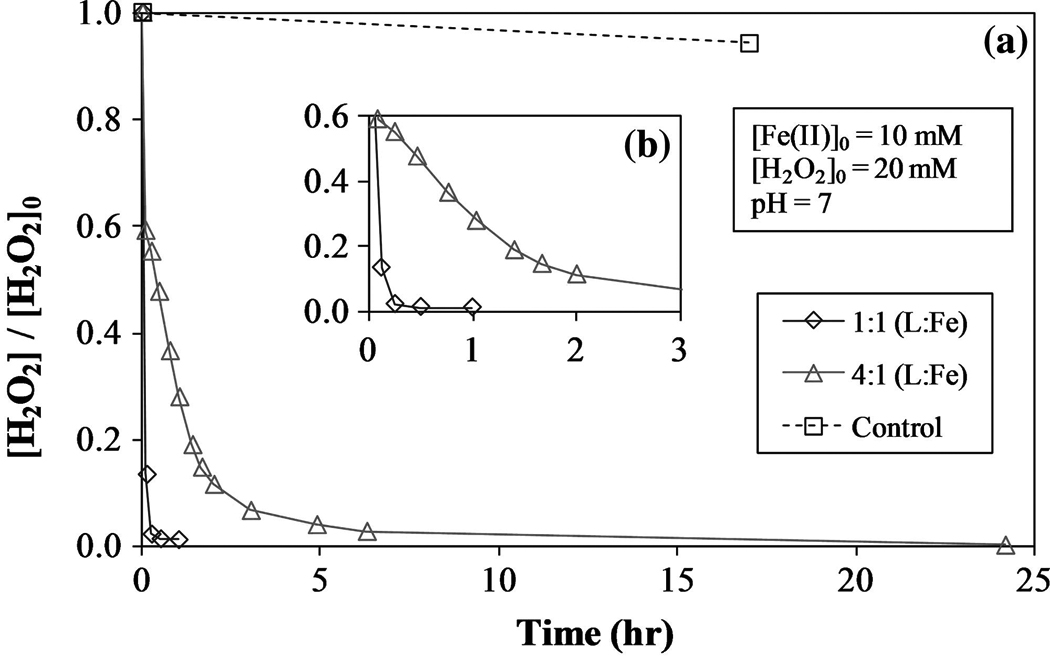
(a) Role of ferrous iron (Fe(II)) on H2O2 decomposition with varying [L]:[Fe] molar ratio. L = citrate. (b) H2O2 decomposition for t = 0 to 3h.
FIG. 5.
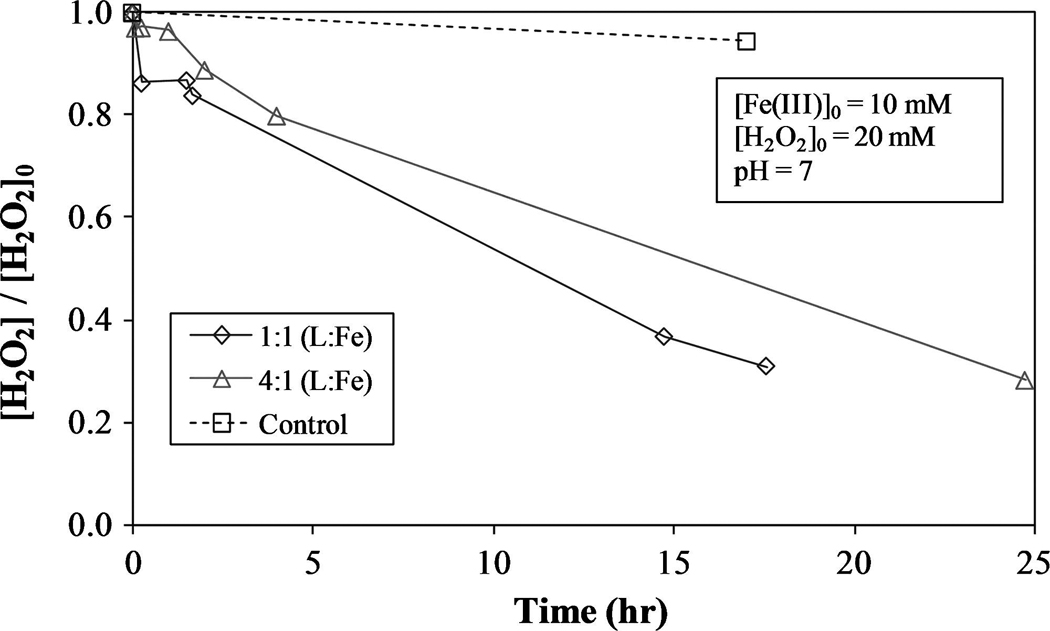
Role of ferric iron (Fe(III)) on H2O2 decomposition with varying [L]:[Fe] molar ratio. L = citrate.
TCE degradation with chelate-modified Fenton reaction in natural water
At near-neutral pH, both Fe(II) and Fe(III) are almost entirely complexed with citrate as Fe(II)L and Fe(III)L, respectively. Due to this chelation, H2O2 decomposition and TCE degradation take place at much lower rates than without a chelate. Regardless, these chelate-modified Fenton reactions are still capable of degrading greater than 80% of TCE in natural water using a Fe(II):L:H2O2 molar ratio of 1:1:8 with initial Fe(II) concentration of 1.5 mmol/L and initial TCE concentration of 1.1 mmol/L, as shown in Fig. 6. These experiments were conducted to quantify the degradation of TCE in the water containing a representative chemical background for the contaminated area. These chelate-modified Fenton reaction experiments ([L]:[Fe] = 1:1) were spiked with 1.1 mmol/L TCE and conducted at an initial pH of 7 and allowed to continue without pH adjustment, reaching a final pH of approximately 5. The 4:1 H2O2:Fe(II) molar ratio resulted in the formation of 33% of the maximum possible Cl− concentration and a 52% reduction in the amount of TCE present. Doubling the quantity of H2O2 resulted in the degradation of 87% of the available TCE and formed 59% of the maximum possible Cl−. A 13% loss of TCE was observed in the control. Although doubling the amount of H2O2 increased the amount of TCE degraded, it did not do so proportionately. Thus, the same amount of H2O2 applied periodically over a longer time should increase the efficiency of this process. Seol and Javandel (2008) found that high H2O2:Fe2+ ratios (greater than 330:1) may reduce the efficiency of contaminant degradation in solutions acidified with citric acid (pH ~3).
FIG. 6.
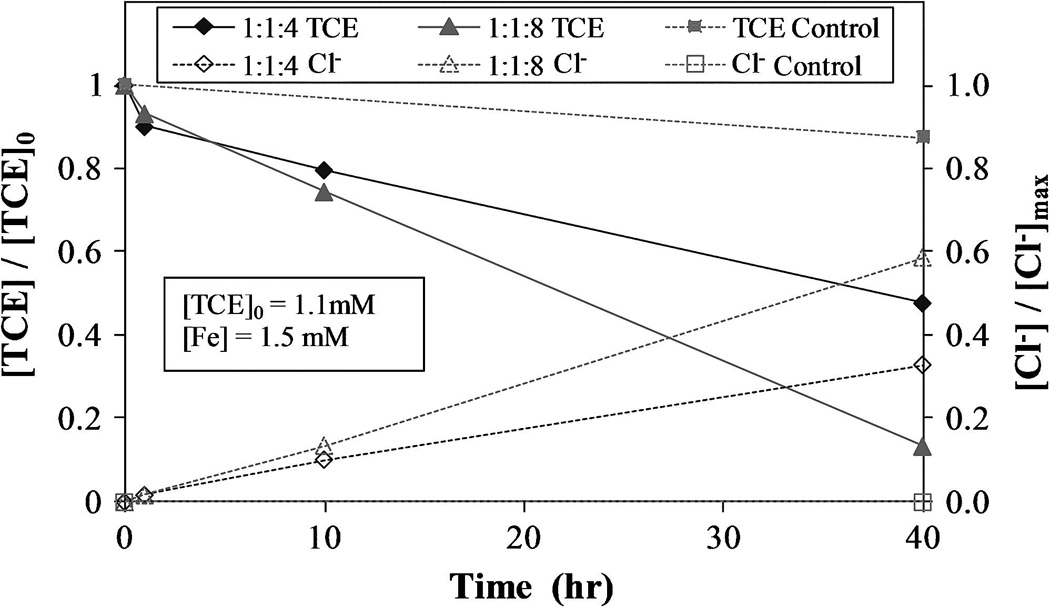
TCE reacted and Cl− formed for varying Fe(II): L:H2O2 molar ratio with initial TCE concentration of 1.1mM, where L is citrate. Conducted in natural water obtained from the DOE site. Control experiment conducted without H2O2. Initial pH = 7.
Aqueous phase (no droplets) kinetic modeling of TCE degradation
The governing rate law for the second-order reaction of TCE with OH· is shown in Equation (28), where [TCE]aq is the concentration of TCE in the aqueous phase (mmol/L) and [OH·] is the concentration of hydroxyl radicals (mmol/L).
| (28) |
If [OH·] is assumed to be constant and small, this reaction becomes first order. Substituting the observed rate constant, k′TCE = kTCE × [OH·] into Equation (28) and solving for [TCE]aq yields Equation (29).
| (29) |
For the kinetic data in Fig. 7 ([L]:[Fe] = 1:1, pH = 6), k′TCE = 0.614 h−1(R2 = 0.916, SSE = 0.18 mmol2). The steady-state value of [OH·] = 4.26 × 10⁻¹¹ mmol/L was obtained by dividing the observed rate constant by the intrinsic rate constant reported in literature. Li et al. (2005) calculated a steady-state [OH·] = (1.68±0.10) × 10−10 mmol/L for pH = 6 in the presence of trichlorophenol (TCP) (kTCP = 5.48×10⁹ M−1s−1). Although the reaction conditions for these studies are not identical, similar concentrations of reactants were used, yielding comparable results. Li et al. noted that their reported value of [OH·] is greater than the actual value due to intermediate compounds competing for hydroxyl radicals.
FIG. 7.
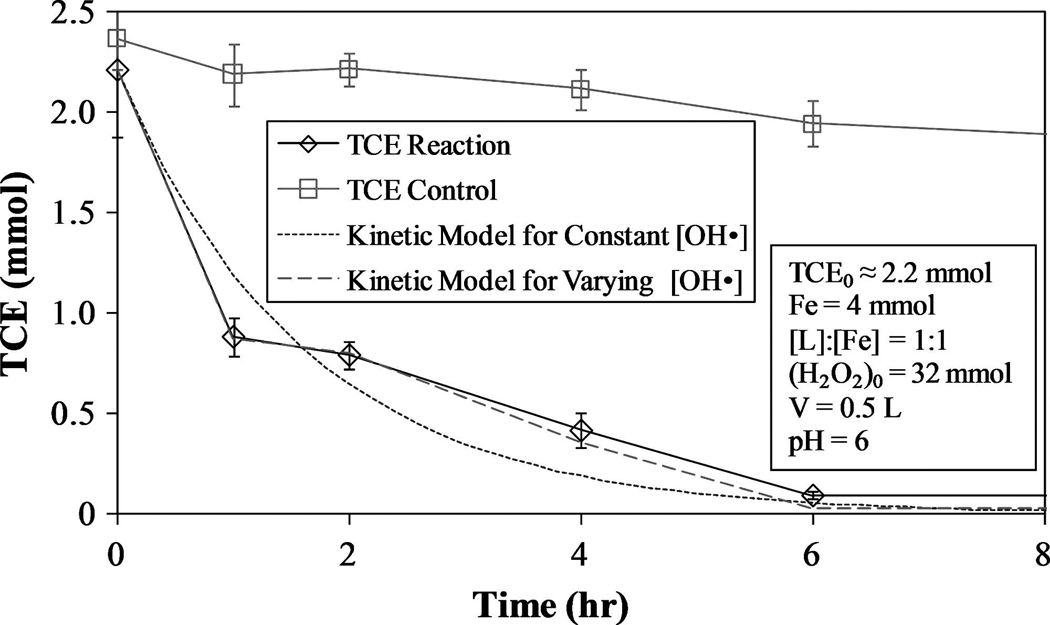
TCE degradation and proposed kinetic models using constant [OH·] [Equation (29)] and varying [OH·] [Equation (32)]. Control experiment conducted with no addition of H2O2.
Although this assumption is effective, it fails to consider the dependence of [OH·] on hydrogen peroxide concentration. For instance, after the addition of hydrogen peroxide to a system containing mostly Fe(II), there will be a large drop in [H2O2] due to its rapid reaction with Fe2+ to form Fe3+. The result is a large increase in [OH·] and a corresponding drop in pollutant concentration followed by a reduction in the rate of reaction, given the appropriate conditions. Improvements to the constant [OH·] model can be made by assuming the quantity of OH· formed is proportional to the rate of hydrogen peroxide decomposition. Substituting Equations (30) and (31) into Equation (28) and solving for [TCE]aq yields Equation (32).
| (30) |
| (31) |
| (32) |
This model, shown in Fig. 7, yields (R2 = 0.965; SSE = 0.012 mmol2). The quantity of TCE lost due to volatization was considered to be small (about 12%) in relation to the quantity of TCE degraded via reaction with hydroxyl radicals and therefore not included in the calculation for the rate constant of TCE. The experimental H2O2 values and calculated [OH·] for this model are shown in Fig. 8.
FIG. 8.
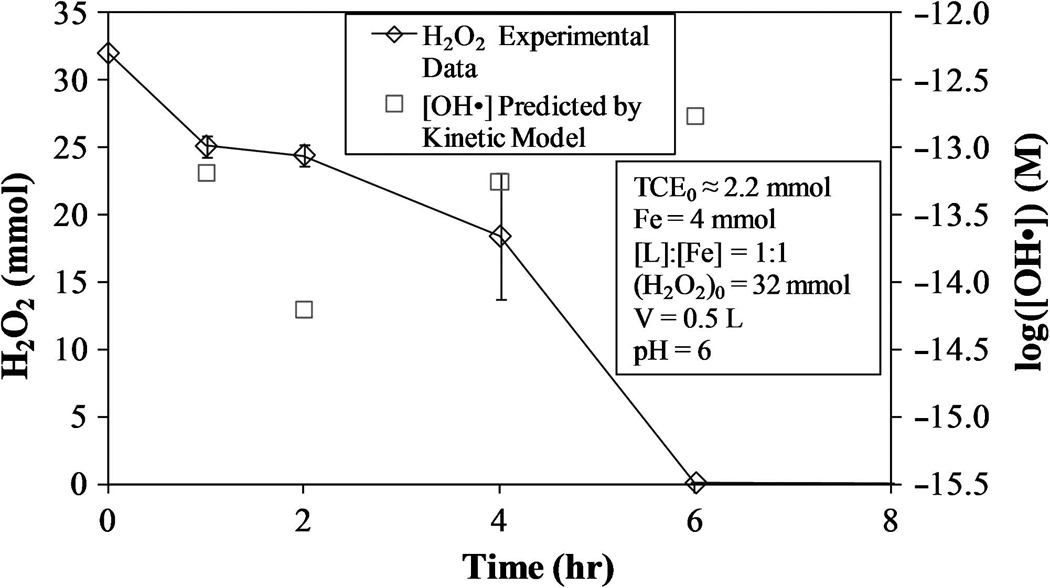
H2O2 consumption and [OH·] for proposed kinetic model using varying [OH·] [Equation (32)].
TCE degradation is accompanied by Cl− formation, with a possible maximum (mmol Cl− formed)/(mmol of TCE degraded) = 3. However, due to the formation of chlorinated intermediates that compete with TCE for hydroxyl radicals, complete TCE dechlorination was not necessarily observed. Figure 9 shows the kinetic data for Cl− formation as well as the theoretical quantities of Cl− produced for the model based on Equation (32) with (mmol Cl− formed)/(mmol TCE reacted) = 2 and 3. Analysis of the kinetic data indicates the actual (mmol Cl− formed)/(mmol TCE reacted) = 2.8±0.3, signifying almost complete degradation of TCE.
FIG. 9.
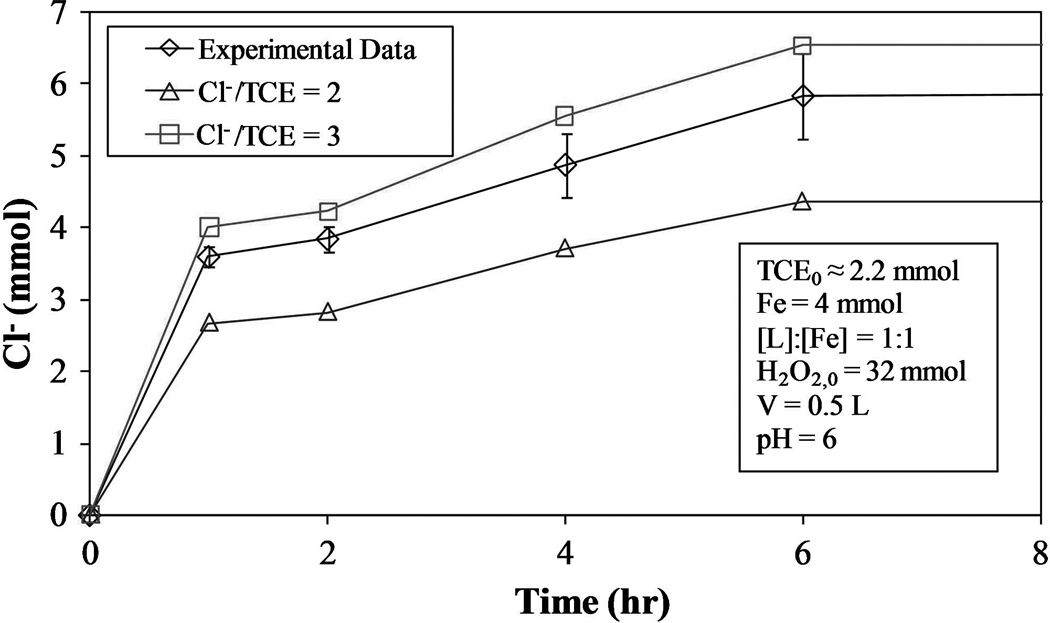
Cl− formation for proposed kinetic model using varying [OH·] [Equation (32)] for (mmol Cl− formed)/(mmol TCE reacted) = 2 and 3.
Two-phase (TCE droplet-water) kinetic modeling of TCE degradation
In this section, a model for the degradation of TCE in two-phase systems, as seen in Fig. 10, will be presented. In this system, n droplets of radius R (m) are present in a sealed reactor vessel of volume V (L). The vessel is stirred to maintain the organic-phase TCE in the form of droplets, which maintain a velocity of U (m/s) relative to the surrounding fluid. A mass-transfer boundary layer of thickness δ (m) is formed around the droplet, creating a TCE concentration gradient.
FIG. 10.
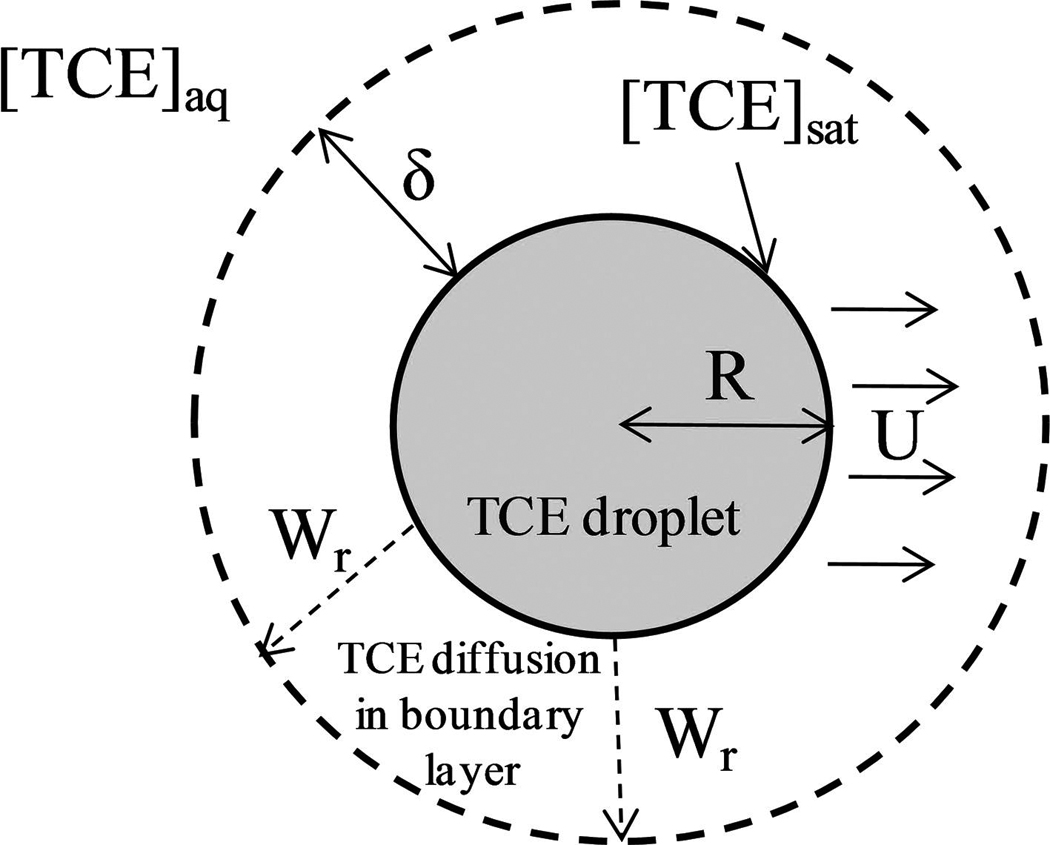
Schematic of TCE droplet dissolution into aqueous solution.
The governing equations for this model consist of balances on the TCE droplets [Equation (33)] and the concentration of TCE in the bulk phase, [TCE]aq, [Equation (34)] both varying with respect to time. In these equations, Wr (mmol s−1 m−2) is the mass flux of TCE from the droplet surface to the bulk phase, S is the surface area of one droplet (initial S = 2.4 × 10⁻⁵ m2) (n = 100 was used for calculations), ρTCE is the density of TCE (g/m3), and MTCE is the molecular weight of TCE (g/mol). Because [H2O2] > 0 for the majority of the experiments, the proposed constant [OH·] model is used to calculate the degradation of TCE in the aqueous phase. These equations (along with the noted assumptions) can be solved simultaneously to yield a dynamic profile for [TCE]aq and R.
| (33) |
| (34) |
In order to calculate Wr (mol s−1 m−2), Equation (35) is used, where kc is the mass transfer coefficient (m/s) and [TCE]sat is the maximum dissolved concentration of TCE in the aqueous phase (8 mmol/L is used for calculations).
| (35) |
The boundary layer thickness can be calculated from kc, a function of the Sherwood number (Sh). To calculate this coefficient, Equations (36–38) are used, where Re is the Reynolds number, Sc is the Schmidt number, ν is the dynamic viscosity of water, and DTCE – water is the binary diffusion coefficient of TCE in water (9.4×10⁻¹⁰ m2/s) (Montgomery, 2000; Reichert et al., 2004; Fogler, 2006).
| (36) |
| (37) |
| (38) |
Because U is the velocity of the particle relative to the surrounding fluid, it is very difficult to measure. However, using the theory of stationary slip velocity, the minimum relative velocity can be estimated by calculating the settling velocity of the droplet in a stationary media (Harriott, 1962; Reichert et al., 2004). Because R changes with time, the drag coefficient, CD, is a function of time. Because in-depth fluid dynamics calculations are beyond the scope of this research, a simple correlation between U and R is required. Using Equation (39) to estimate CD from Re and the equations for calculating settling velocity, a linear relationship between U and R was formulated for values of R ranging from 0 to 0.0015 m, as seen in Equation (40) (R2 = 0.995 with 12 points) (Munson, 2002; Brown and Lawler, 2003).
| (39) |
| (40) |
For the chelate-modified Fenton reaction, it can be safely assumed that no Fe or citrate species are present in the TCE droplets because these will be ionized at near-neutral pH. Additional model assumptions include:
Reactions only occur in the bulk aqueous phase
OH· is the only species that reacts with TCE
Liquid phase is uniformly mixed and isothermal
Uniform droplet size, distribution, and relative velocity of droplets
Droplets are spherical and have smooth surfaces
Negligible TCE loss due to volatility (TCE is present in excess such that the quantity of TCE lost due to volatization is not important compared to the quantity of TCE degraded via reaction with OH·)
Parametric variations were performed on kc to determine its effect on [TCE]aq and R. As expected, the rate of dissolution of the droplets is directly proportional to the value of kc. The minimum and maximum calculated values for kc are 4.6×10⁻⁵m/s and 9.9×10⁻⁴m/s, respectively.
The predicted model values indicate no droplets should be present after 18 h, and that TCE degradation should be complete after 22 h. According to visual observation, the droplets did not disappear until approximately 28 h. Thus, the value of k′ and/or kc is likely overestimated.
The H2O2 degradation profile for a chelate-modified Fenton reaction system in the presence of excess TCE in droplet form is shown in Fig. 11. Because the dechlorination of TCE is the main focus of this study, it was measured solely by Cl− production in the aqueous phase. After complete consumption of the initial amount of H2O2 (12 h), a second spike of equal quantity was made. The second addition leads to an increase in Cl− formation, proving that multiple injections of H2O2 can be used repeatedly in these systems to further degrade contaminants. The initial spike of H2O2 resulted in the production of 10.9 mmol Cl−, whereas the second spike produced only 5.9 mmol. This significant difference and occurs for two reasons: (1) More Fe2+ is available in the initial stages of the reaction, and (2) when TCE concentrations are lower, less hydroxyl radicals are consumed from reaction with TCE, increasing the rates of Reaction 3–5 and 7. The result is a higher rate of H2O2 degradation, which explains why H2O2 is consumed faster after the second injection than the first (Fig. 11). Figure 12 shows the actual and model-predicted amounts of Cl− formed.
FIG. 11.
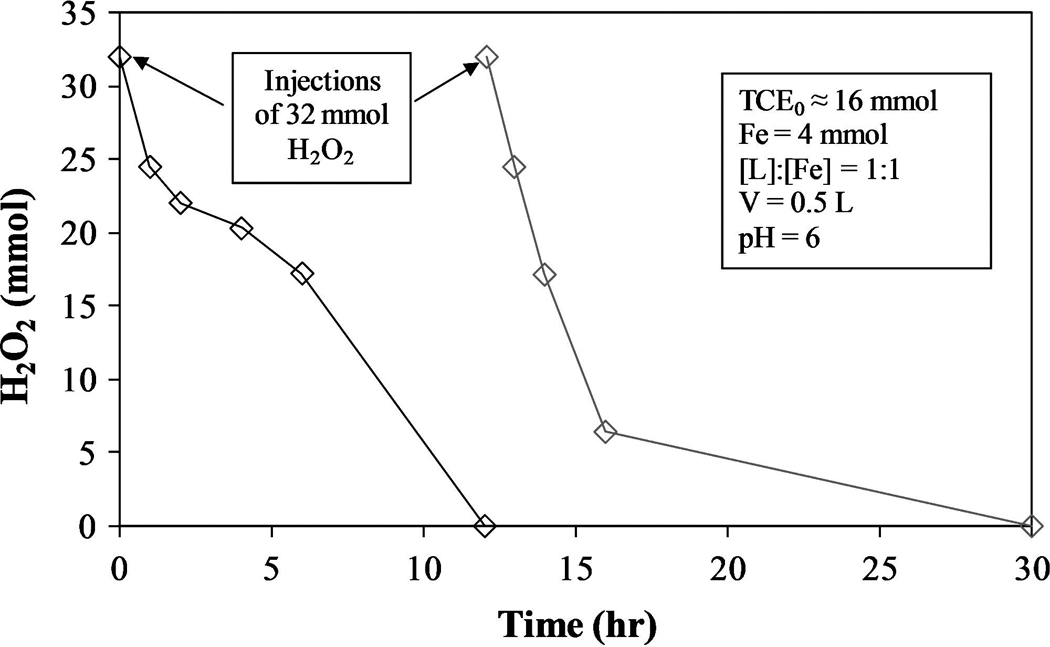
H2O2 degradation profile for chelate-modified Fenton reaction in two-phase TCE system. H2O2 injected at time = 0 and 12 h.
FIG. 12.
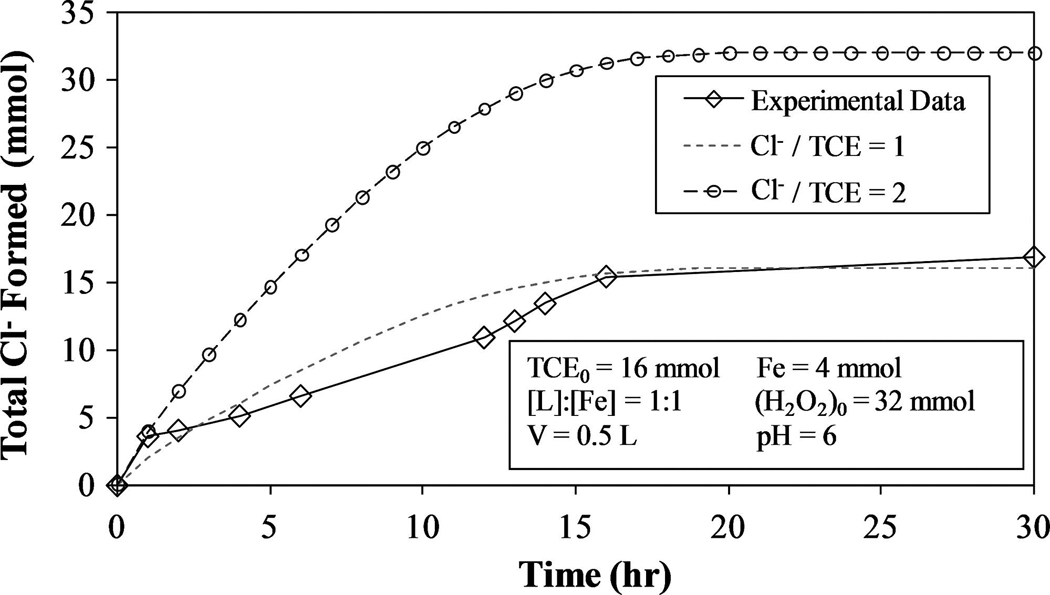
Cl− formation profile for chelate-modified Fenton reaction in two-phase TCE system. Experimental results for H2O2 injected at time = 0 and 12 h. Model-predicted results for (mmol Cl− formed)/(mmol TCE reacted) = 1 and 2 using Equations (33) and (34).
After the first hour of the reaction, Cl− production is relatively constant and correspond closely to the model-predicted values [Equations (33) and (34)] for (mmol Cl− formed)/(mmol TCE reacted) = 1. This is significantly less Cl− formation than in the aqueous-phase TCE experiments despite the larger (mmol Cl− formed)/(mmol H2O2 consumed) for the system with droplets. Even though the initial [H2O2]:[Fe] ratios are the same, some of this disparity can be explained by the different [TCE]aq:[Fe] ratios, which are ~ 1:1 for the system with no droplets and ~ 2:1 for the for the system containing droplets.
Although most TCE degradation is thought to occur via oxidation by hydroxyl radicals, it has been proven that other radical species formed during Fenton reaction propagations are capable of degrading toxic organics. Watts et al. (2005) used an Fe(III)-catalyzed modified Fenton reaction with chelate at pH 3 with a high H2O2:Fe(III) ratio to destroy DNAPLs of carbon tetrachloride and chloroform. These contaminants were chosen because of their resistance to oxidation via hydroxyl radicals (kOH· on the order of 106 M−1s−1) (Haag and Yao, 1992). The main species responsible for this is superoxide radical anion (O2·−) (Watts and Teel, 2006). Other oxidants include perhydroxy radical (HO2·) and hydroperoxide anion (HO2−), which are present in Reactions 3 and 5–10 (Ravikumar and Gurol, 1994; Lin and Gurol, 1998; DeLaat and Gallard, 1999; Wang and Lemley, 2001; Pignatello et al., 2006). Superoxide radical anion, the conjugate base of perhydroxy radical [Equation (41),], could also play a role in the destruction of TCE DNAPLs.
| (41) |
Li et al. (2007) showed that superoxide radical anion concentrations were two orders of magnitude higher for a chelate-modified Fenton reaction system ([L]:[Fe] = 1:1) than for a standard Fenton reaction system (no chelate), both containing [Fe] = 0.2mM and [H2O2] = 0.5mM.
Efficiency of chelate-modified Fenton reaction
One way to determine the efficiency of H2O2 use for TCE degradation is to compare the quantity of Cl− formed to the quantity of H2O2 reacted. For the chelate-modified Fenton reaction data in Fig. 9 (no TCE droplet) and 12 (with TCE droplets), the time-averaged (mmol Cl− formed)/(mmol H2O2 reacted) values are given in Fig. 13. Overall, this ratio is larger in the presence of TCE droplets because there is more TCE available to be degraded, but for these reaction conditions, between 0.2 and 0.5 mmol of Cl− are formed per mmol H2O2 reacted. To completely degrade 1 mmol TCE, approximately 6 to 15 mmol H2O2 are required. This is in contrast to the efficiency of the standard Fenton reaction (Fig. 2), which yields (mmol Cl− formed)/(mmol H2O2 reacted) = 1.2 to 1.5, meaning 2 to 2.5 mmol H2O2 are needed to completely degrade 1 mmol TCE. Considering the standard Fenton reaction takes place at optimum operating conditions, the results for the chelate-modified Fenton reaction are very reasonable and can be increased by injecting H2O2 in small doses over a longer period of time, increasing the L:Fe ratio, and/or other methods.
FIG. 13.
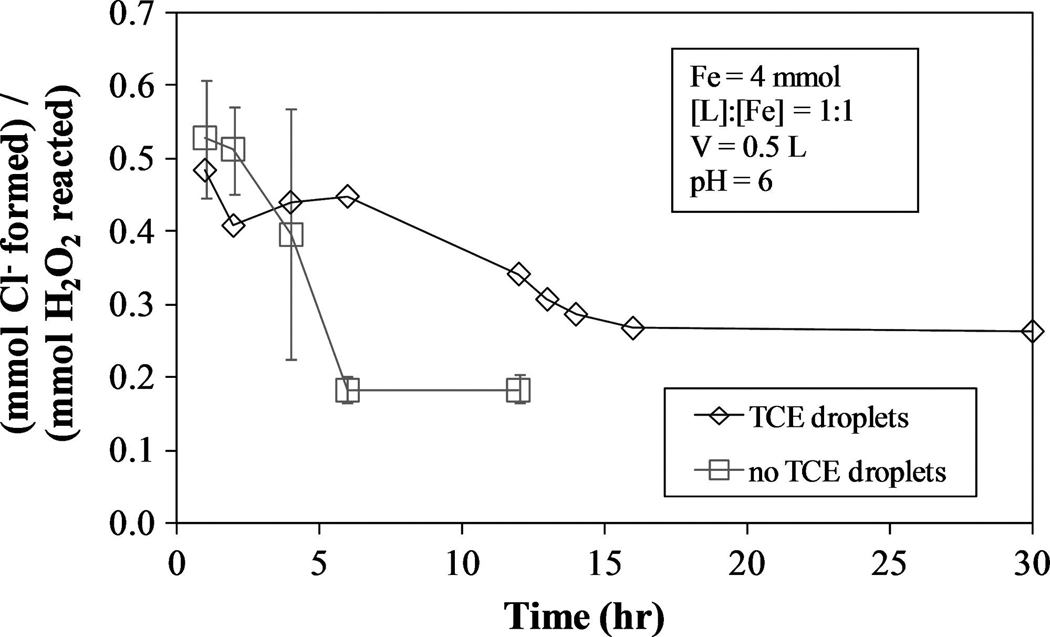
(mmol Cl− formed)/(mmol H2O2 reacted) for one system containing no TCE droplets (TCE0 ≈ 4 mmol) and one with TCE droplets (TCE0 ≈ 16 mmol).
Packed column studies for simulated groundwater injection
Natural subsurface matter may negatively affect H2O2 propagation reactions via H2O2 degradation by inorganic reductants and H2O2 decomposition to H2O and O2 (Pignatello et al., 2006). The possibility exists to use the naturally occurring iron found in the subsurface to catalyze Fenton-like reaction; however, this would only be applicable to a limited number of remediation sites due to the high concentrations of naturally occurring iron required for significant contaminant destruction. The rate of hydroxyl radical generation must also be great enough to overcome hydroxyl radical scavenging that takes place in the subsurface. Ravikumar and Gurol (1994) found that the addition of a small amount of soluble iron to sand containing bound iron results in a dramatic increase in hydrogen peroxide decomposition. For practical applications, the chelate-modified Fenton reaction was used to degrade TCE in a simulated gravel aquifer. A column packed with RGA gravel was filled with 2.25 L of DIUF water containing 0.41mM TCE, 1.5mM Fe(II), and 1.5mM citrate at near-neutral pH, as seen in Fig. 14. The circulation rate was adjusted to give an equivalent groundwater velocity of 2.5 ft/day. At 0 and 24 h, H2O2 was injected into the top of the column so as to yield a 2:1 [H2O2]:[Fe] molar ratio. TCE dechlorination results are shown in Fig. 15 with (mmol Cl− formed)/(mmol TCE degraded) ≈ 3.
FIG. 14.
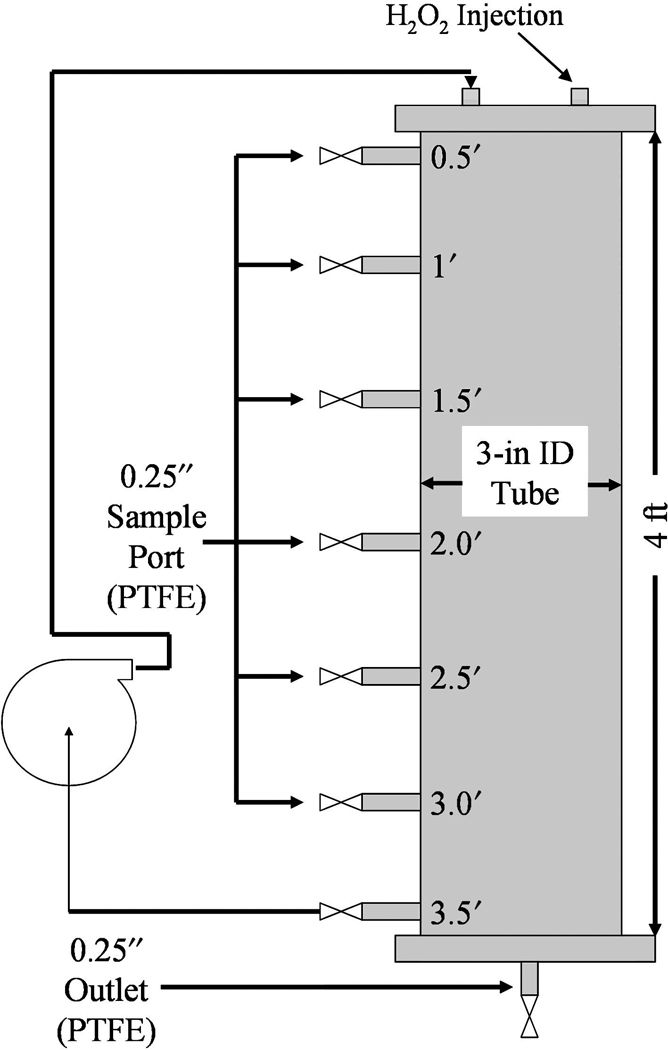
Column packed with RGA gravel for simulation of TCE degradation in groundwater systems using chelate-modified Fenton reaction. Void volume = 2.25 L.
FIG. 15.
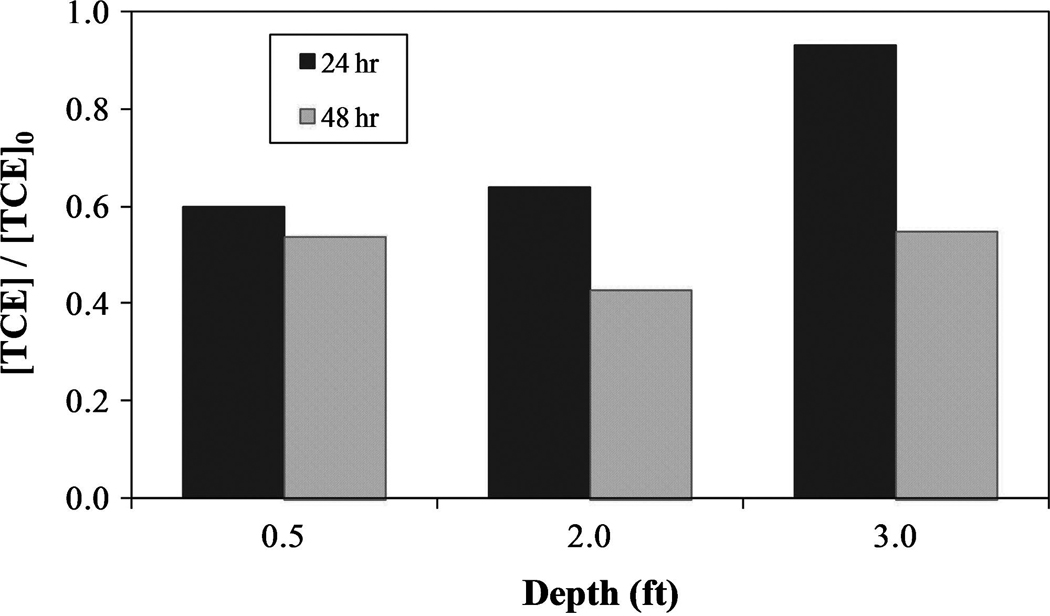
TCE dechlorination results for RGA packed column. [TCE]0 = 0.41mM, [Fe] = 1.5mM, [L]:[Fe] = 1:1. H2O2 injections at 0 and 24 h for 2:1 [H2O2]:[Fe] molar ratio. Column flowrate = 2.5 ft/day. (mol Cl− formed)/(mol TCE reacted) ≈ 3 (not shown in figure).
After a period of 24 h, approximately 40% of the TCE had been degraded up to a depth of at least 2 ft. Insignificant degradation was observed at a depth of 3 ft given the reactants had not had sufficient time to traverse that distance. After 48 h, TCE degradation at a depth of 3 ft had reached approximately 40%. The chelate-modified Fenton reaction is capable of degrading significant quantities of TCE in the presence of RGA gravel under simulated groundwater flow.
Conclusions
These studies established that the chelate-modified Fenton reaction effectively degrades TCE in both the aqueous and organic (present as droplet) phases at near-neutral pH. This chelate allows the reaction to take place at near-neutral pH and control hydrogen peroxide consumption by binding to Fe(II), forming an FeL complex. The chelate also binds to Fe(III), preventing its precipitation as ferric hydroxide. For the standard Fenton reaction at low pH, an optimum H2O2:Fe(II) ratio was found. Experimentation suggests multiple doses of H2O2 yield greater contaminant degradation than an equivalent single dose. For both aqueous and two-phase systems, the extent of dechlorination for the chelate-modified Fenton reaction is limited by the amount of H2O2 present. Thus, Fe–citrate complexes can be used repeatedly for dechlorination over long periods of time in the presence of H2O2. Generalized models were developed to predict the concentration of TCE in the aqueous phase and TCE droplet radius as a function of time using established hydroxyl radical kinetics and mass transfer relationships. Destruction of TCE in aqueous and droplet phases has been accomplished in natural water. Simulation of the application of the chelate-modified Fenton reaction to an aquifer has been achieved through packed column studies with successful TCE degradation.
Acknowledgments
This research was supported by the NIEHS/SBRP (Grant number: P42ES007380), NSF-IGERT, and by the DOE-KRCEE (DOE Grant Number DE-FG05-03OR2302) programs.
Nomenclature
- CD
drag coefficient (dimensionless)
- DTCE–water
diffusion coefficient (m2/s)
- Fe
total quantity of all iron species (mmol)
- (H2O2)0
initial total quantity of hydrogen peroxide (mmol)
- [H2O2]
hydrogen peroxide concentration (mmol/L)
- [H2O2]0
initial hydrogen peroxide concentration (mmol/L)
- kc
mass transfer coefficient (m/s)
- k′TCE
fitted first-order rate constant for constant [OH·] model (s−1)
- k″TCE
observed rate constant for varying [OH·] model (dimensionless)
- MTCE
molecular weight of TCE (g/mol)
- n
number of TCE droplets (dimensionless)
- [OH·]
hydroxyl radical concentration (mmol/L)
- R
droplet radius (m)
- Re
Reynolds number (dimensionless)
- S
surface area of single droplet (m2)
- Sc
Schmidt number (dimensionless)
- Sh
Sherwood number (dimensionless)
- TCE0
initial total quantity of TCE (mmol)
- [TCE]aq
aqueous-phase TCE concentration (mmol/L)
- [TCE]aq,0
initial aqueous-phase TCE concentration (mmol/L)
- [TCE]sat
TCE saturation concentration (mmol/L)
- U
velocity of droplet relative to surrounding fluid (m/s)
- V
reactor volume (L)
- Wr
mass flux in radial direction (mmol s−1 m−2)
- α
proportionality constant relating [OH·] and d[H2O2]/dt [Equations (30, 31)] (s)
- δ
droplet boundary layer thickness (m)
- ν
kinematic viscosity of water (m2/s)
- ρTCE
density of TCE (g/m3)
Footnotes
Author Disclosure Statement
The authors declare that no competiting financial interests exist.
References
- Ahuja DK, Bachas LG, Bhattacharyya D. Modified Fenton reaction for trichlorophenol dechlorination by enzymatically generated H2O2 and gluconic acid chelate. Chemosphere. 2007;66:2193. doi: 10.1016/j.chemosphere.2006.08.035. [DOI] [PubMed] [Google Scholar]
- Amarante D. Applying in situ chemical oxidation. Pollut. Eng. 2000 [Google Scholar]
- Baes CF, Mesmer RE. The Hydrolysis of Cations. New York: John Wiley & Sons; 1976. [Google Scholar]
- Brady JE, Humiston GE. General Chemistry–-Principles and Structure. New York: John Wiley & Sons; 1982. [Google Scholar]
- Brown P, Lawler DF. Sphere drag and settling velocity revisited. J. Environ. Eng. 2003;129:222. [Google Scholar]
- Brunet R, Bourbigot MM, Dore M. Oxidation of organic compounds through the combination of ozone–hydrogen peroxide. Ozone: Sci. Eng. 1984;6:163. [Google Scholar]
- De Laat J, Gallard H. Catalytic decomposition of hydrogen peroxide by Fe(III) in homogeneous aqueous solution: Mechanism and kinetic modeling. Environ. Sci. Technol. 1999;33:2726. [Google Scholar]
- Fogler HS. Elements of Chemical Reaction Engineering. Boston, MA: Prentice Hall; 2006. [Google Scholar]
- Haag WR, Yao CCD. Rate constants for reaction of hydroxyl radicals with several drinking water contaminants. Environ. Sci. Technol. 1992;26:1005. [Google Scholar]
- Haber F, Weiss J. The catalytic decomposition of hydrogern peroxide by iron salts. Proc. R. So. 1934;A147:332. [Google Scholar]
- Harriott P. Mass Transfer to particles. AIChE J. 1962;8:93. [Google Scholar]
- Inczedy J. Analytical Application of Complex Equilibria. London: Ellis Horwood Limited; 1976. [Google Scholar]
- Kennedy CA, Lennox WC. A pore-scale investigation of mass transport from dissolving DNAPL droplets. J. Contam. Hydrol. 1997;24:221. [Google Scholar]
- Kosaka K, Yamada H, Matsui S, Echigo S, Shishida K. Comparison among the methods for hydrogen peroxide measurements to evaluate advanced oxidation processes: Application of a spectrophometric method using copper(II) Ion and 2,9-dimethyl-1,10-phenanthroline. Environ. Sci. Technol. 1998;32:3821. [Google Scholar]
- Kwan WP, Voelker BM. Rates of hydroxyl radical generation and organic compound oxidation in mineral-catalyzed Fenton-like systems. Environ. Sci. Technol. 2003;37:1150. doi: 10.1021/es020874g. [DOI] [PubMed] [Google Scholar]
- Laine DF, Cheng IF. The destruction of organic pollutants under mild conditions: A review. Microchem. J. 2007;85:183. [Google Scholar]
- Li K, Stefan MI, Crittenden JC. Trichloroethylene degradation by UV/H2O2 advanced oxidation process: Product study and kinetic modeling. Environ. Sci. Technol. 2007a;41:1696. doi: 10.1021/es0607638. [DOI] [PubMed] [Google Scholar]
- Li Y, Bachas LG, Bhattacharyya D. Kinetic studies of trichlorophenol destruction by chelate-based Fenton reaction. Environ. Eng. Sci. 2005;22:756. [Google Scholar]
- Li Y, Bachas LG, Bhattacharyya D. Selected chloro-organic detoxifications by polychelate (poly(acrylic acid)) and citrate-based Fenton reaction at neutral pH environment. J. Ind. Eng. Chem. Res. 2007b;46:7984. [Google Scholar]
- Lin SS, Gurol MD. Catalytic decomposition of hydrogen peroxide to iron oxide: Kinetics, mechanism, and implications. Environ. Sci. Technol. 1998;32:1417. [Google Scholar]
- Masten SJ, Hoigne J. Comparison of ozone and hydroxyl radical-induced oxidation of chlorinated hydrocarbons in water. Ozone: Sci. Eng. 1992;14:197. [Google Scholar]
- Montgomery JH. Groundwater Chemicals Desk Reference. Boca Raton, FL: CRC Press; 2000. [Google Scholar]
- Morgan P, Watkinson RJ. Factors limiting the supply and efficiency of nutrient and oxygen supplements for the in situ biotreatment of contaminated soil and groundwater. Water Res. 1992;26:73. [Google Scholar]
- Munson BR, Young DF, Okiishi TH. Fundamentals of Fluid Mechanics. New York: John Wiley & Sons, Inc; 2002. [Google Scholar]
- Pignatello JJ, Liu D, Huston P. Evidence for an additional oxidant in the photoassisted Fenton reaction. Environ. Sci. Technol. 1999;33:1832. [Google Scholar]
- Pignatello JJ, Oliveros E, Mackay A. Advanced oxidation processes for organic contaminant destruction based on the Fenton reaction and related chemistry. Crit. Rev. Env. Sci. Technol. 2006;36:1. [Google Scholar]
- Ravikumar JX, Gurol MD. Chemical oxidation of chlorinated organics by hydrogen peroxide in the presence of sand. Environ. Sci. Technol. 1994;28:394. doi: 10.1021/es00052a009. [DOI] [PubMed] [Google Scholar]
- Reichert C, Hoell WH, Franzreb M. Mass transfer enhancement in stirred suspensions of magnetic particles by the use of alternating magnetic fields. Powder Technol. 2004;145:131. [Google Scholar]
- Rivett M, Feenstra S, Cherry J. A controlled field experiment on groundwater contamination by a multicomponent DNAPL: creation of the emplaced-source and overview of dissolved plume development. J. Contam. Hydrol. 2001;49:111. doi: 10.1016/s0169-7722(00)00191-1. [DOI] [PubMed] [Google Scholar]
- Roy-Perreault A, Kueper BH, Rawson J. Formation and stability of polychlorinated biphenyl Pickering emulsions. J. Contam. Hydrol. 2005;77:17. doi: 10.1016/j.jconhyd.2004.11.001. [DOI] [PubMed] [Google Scholar]
- Russell HH, Matthews JE, Sewell GW. TCE removal from contaminated soil and ground water. EPA Groundwater Issue. 1992 [Google Scholar]
- Sexton J. Final Masters Thesis. 2005. Jul, Lithologic and stratigraphic compilation of near-surface sediments for the Paducah Gaseous Diffusion Plant, McCracken County, Kentucky. [Google Scholar]
- Siegrist RL, Urynowicz MA, West OR. In situ chemical oxidation for remediation of contaminated soil and ground water. EPA Ground Water Currents. 2000 [Google Scholar]
- Seol Y, Javandel I. Citric acid-modified Fenton’s reaction for the oxidation of chlorinated ethylenes in soil solution systems. Chemosphere. 2008;72:537. doi: 10.1016/j.chemosphere.2008.03.052. [DOI] [PubMed] [Google Scholar]
- Sun Y, Pignatello JJ. Chemical treatment of pesticide wastes. Evaluation of Fe(III) chelates for catalytic hydrogen peroxide oxidation of 2,4-D at circum-neutral pH. J. Agric. Food Chem. 1992;40:322. [Google Scholar]
- Teel AL, Warberg CR, Atkinson DA, Watts RJ. Comparison of mineral and soluble iron Fenton’s catalysts for the treatment of trichloroethylene. Water Res. 2001;35:977. doi: 10.1016/s0043-1354(00)00332-8. [DOI] [PubMed] [Google Scholar]
- Vogel TM, Criddle CS, Mccarty PL. Transformations of halogenated aliphatic compounds. Environ. Sci. Technol. 1987;21:722. doi: 10.1021/es00162a001. [DOI] [PubMed] [Google Scholar]
- Walling C. Fenton’s reagent revisited. Acc. Chem. Res. 1975;8:125. [Google Scholar]
- Wang Q, Lemley AT. Kinetic model and optimization of 2,4-D degradation by anodic Fenton treatment. Environ. Sci. Technol. 2001;35:4509. doi: 10.1021/es0109693. [DOI] [PubMed] [Google Scholar]
- Watts RJ, Howsawkeng J, Teel AL. Destruction of a carbon tetrachloride dense nonaqueous phase liquid by modified Fenton’s reagent. J. Environ. Eng. 2005;131:1114. [Google Scholar]
- Watts RJ, Kong S, Dippre M, Barnes WT. Oxidation of sorbed hexachlorobenzene in soils using catalyzed hydrogen peroxide. J. Hazard. Mater. 1994;39:33. [Google Scholar]
- Watts RJ, Teel AL. Chemistry of modified Fenton’s reagent (catalyzed H2O2 propagations-CHP) for in situ soil and groundwater remediation. J. Environ. Eng. 2005;131 [Google Scholar]
- Watts RJ, Teel AL. Mechanism for the destruction of carbon tetrachloride and chloroform DNAPLs by modified Fenton’s reagent. J. Contam. Hydrol. 2006;85:229. doi: 10.1016/j.jconhyd.2006.02.002. [DOI] [PubMed] [Google Scholar]
- Yaron-Marcovich D, Dror I, Berkowitz B. Behavior and stability of organic contaminant droplets in aqueous solutions. Chemosphere. 2007;69:1593. doi: 10.1016/j.chemosphere.2007.05.056. [DOI] [PubMed] [Google Scholar]
- Yasunaga N, Hirotsuji J. Efficient decomposition of trichloroethylene (TCE) in groundwater by ozone–hydrogen peroxide treatment. Ozone: Sci. Eng. 2008;30:127. [Google Scholar]


