

Abstract
Background
Brain structure abnormalities throughout the course of Parkinson’s disease have yet to be fully elucidated.
Objective
Using a multicenter approach and harmonized analysis methods, we aimed to shed light on Parkinson’s disease stage-specific profiles of pathology as suggested by in vivo neuroimaging.
Methods
Individual brain MRI and clinical data from 2,357 Parkinson’s disease patients and 1,182 healthy controls were collected from 19 sources. We analyzed regional cortical thickness, cortical surface area, and subcortical volume using mixed-effect models. Patients grouped according to Hoehn and Yahr stage were compared to age- and sex-matched controls. Within the patient sample, we investigated associations with Montreal Cognitive Assessment scores.
Results
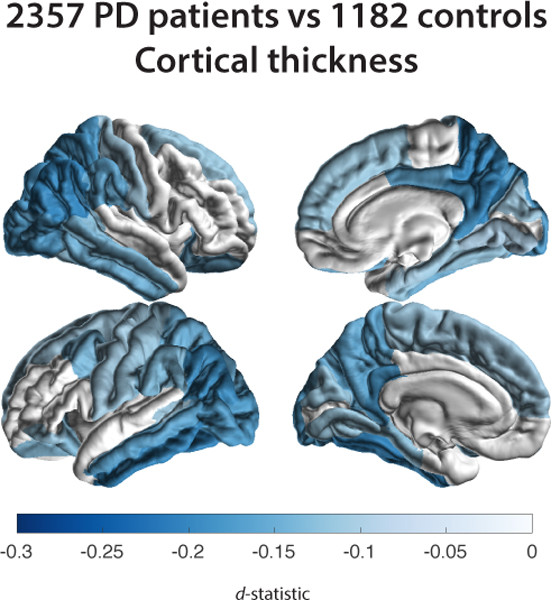
Overall, patients showed a thinner cortex in 38 of 68 regions compared to controls (dmax = −0.20, dmin = −0.09). The bilateral putamen (dleft = −0.14, dright = −0.14) and left amygdala (d = −0.13) were smaller in patients, while the left thalamus was larger (d = 0.13). Analysis on staging demonstrated an initial presentation of thinner occipital, parietal and temporal cortices, extending towards rostrally located cortical regions with increased disease severity. From stage 2 and onwards the bilateral putamen and amygdala were consistently smaller with larger differences denoting each increment. Poorer cognition was associated with widespread cortical thinning and lower volumes of core limbic structures.
Conclusions
Our findings offer robust and novel imaging signatures that are generally incremental across, but in certain regions specific to, disease stages. Our findings highlight the importance of adequately powered multicenter collaborations.
Keywords: Parkinson’s disease, MRI, brain, ENIGMA, disease severity
Graphical Abstract
Introduction
Parkinson’s disease (PD) is the world’s second most prevalent neurodegenerative disease. Apart from cardinal motor symptoms, patients may suffer from cognitive, neuropsychiatric, and autonomic dysfunction.1 Clinical features of PD are thought to arise in part from dysfunctions of neural circuits, involving both cortical and subcortical regions.2 The use of neuroimaging to investigate macroscopic brain structural changes in PD may help to understand patterns of the underlying pathology and potentially provide in vivo biomarkers of disease process and development.
Structural MRI of the brain allows for non-invasive assessment of cortical and subcortical morphology. Most imaging studies of PD report findings consistent with the atrophic process that underlies neurodegeneration, such as lower measures of subcortical volume and cortical thickness in PD compared to healthy controls.3 Reported atrophy patterns vary across studies in terms of location and effect size, and it is still poorly understood how disease severity relates to profiles of abnormal brain morphology.3,4 The discrepancies may be, in part, explained by methodological factors, including small sample sizes for individual studies, and differences in analysis methods. Heterogeneity with respect to demographics and clinical characteristics of the patient sample, regions of interest assessed, and algorithms used for segmentation and parcellation (e.g., atlas-based versus voxel- or vertex-based) may also produce differences in reported findings, which in turn complicates comparability of study outcome.
Large-scale collaborations, such as the Enhancing Neuroimaging through Meta-Analysis (ENIGMA) consortium, have been initiated to overcome these limitations, by harmonizing data processing and analysis across studies, and aggregating information across multiple samples worldwide.5
The ENIGMA-PD Working Group is an international initiative, set up to identify imaging signatures of pathology in PD, and factors that influence them. In the largest study on PD brain morphology to date, we report on differences in regional cortical thickness, cortical surface area, and subcortical volume between PD patients and healthy control subjects, and provide clinico-morphological correlates, taking into account disease severity, age, and sex.
Methods
Samples
Data were collected between September 2016 and December 2019. We analyzed T1-weighted MRI scans from 19 sites, from 20 countries (Fig. S1), comprising 2,357 PD patients and 1,182 control subjects. Clinical information from the PD subjects included Hoehn and Yahr (HY) stages,6 illness duration, and Montreal Cognitive Assessment (MoCA) scores.7 Every site additionally supplied scans of healthy controls, if available, with identical MR imaging parameters. Individual site inclusion/exclusion criteria are provided in Table S1a. The 43 samples of PD patients and controls provided were defined as ‘cohorts’, such that sites may contribute multiple cohorts from separate testing environments. In particular, the PPMI (Parkinson’s Progression Markers Initiative) collects data across multiple centers,8 and these were treated as independent cohorts. Disease severity was assessed using the HY stages, ranging from 1 to 5; HY1 denotes unilateral motor impairment, and HY5 confinement to bed or wheelchair. The modified HY classification, which includes intermediate increments of 1.5 and 2.5 to complement stage 2,9 was used in 12 cohorts. We regrouped the cases so that HY1.5 (N = 83) and HY2.5 (N = 169) patients were included in the HY2 group. HY4 (N = 66) and HY5 (N = 17) patient groups were merged. The nearest neighbor matching procedure, featured in the MatchIt software package for R,10 selected an age- and sex-balanced subsample of controls for each HY group based on propensity score matching with replacement.
Image Acquisition and Processing
Structural brain MRI scans were obtained with a 3-dimensional gradient-echo T1-weighted sequence. Site-specific parameters are summarized in Table S1b. Contributing sites processed their data locally using standardized ENIGMA protocols for harmonization and quality control (see http://enigma.ini.usc.edu/protocols/imaging-protocols/). Regional cortical thickness, cortical surface area, and subcortical volume metrics were extracted from the brain images using FreeSurfer 5.3. For each subject, per hemisphere, FreeSurfer parcellated 34 cortical regions of interest (ROIs) based on the Desikan-Killiany atlas, and eight subcortical ROIs.11,12 Poorly parcellated regions were excluded from the statistical analysis, in accordance with the standardized protocols. All collaborators in our Working Group granted permission to share individual participant derived data, including demographic and clinical characteristics, and FreeSurfer-derived measures. All sites provided anonymized data with ethical approval from their local ethics committees and institutional review boards.
Analysis of Cortical and Subcortical Properties
Between-group differences were assessed using multivariable linear mixed-effect regressions on the pooled means of regional cortical thickness (mm), regional and total cortical surface area (mm2), regional subcortical volume, and intracranial volume (ICV; mm3). Independent variables Diagnosis, Age, Sex, and ICV were used as fixed factors and Cohort was included as a random intercept.
The main analysis examined differences between all patients and controls using model 1a (ROI ~ Diagnosis + Age + Sex + ICV + Cohort) for subcortical volume and regional cortical surface area, model 1b (ROI ~ Diagnosis + Age + Sex + Cohort) for cortical thickness and total cortical surface area, and model 1c for ICV (ICV ~ Diagnosis + Sex + Cohort). Omitting ICV in the thickness model is consistent with previous research on nuisance factors.13 Differences between patients grouped by HY stage and age- and sex-matched controls were assessed using model 2a (ROI ~ Diagnosis(HYN) + ICV + Cohort) for subcortical volume and regional cortical surface area and model 2b (ROI ~ Diagnosis(HYN) + Cohort) for cortical thickness and total cortical surface area. The d-statistic appropriate for mixed-effect models was estimated to quantify the effect size of the differences.14 The percentage difference of patients from controls was calculated using the least-square group means of the outcome measure.
In addition, we used a linear mixed-effects regression model to examine within-group associations between the morphometric measures and cognitive ability, and illness duration, incorporating model 1a for subcortical volume and cortical surface area, and model 1b for cortical thickness. The r-statistic appropriate for mixed-effect models was reported as the effect size.14 To determine how representative the MoCA subgroup was for the complete PD sample, we performed a differential analysis between the PD group with available MoCA scores and the control group (supplementary material).
Significant results that passed Bonferroni correction for multiple comparisons were reported (i.e. p-value 0.05 divided by number of ROIs of each outcome measure); ICV is calculated differently from the subcortical volume measure, and was treated as a separate outcome measure.15
Results
Complete sample
Data flow for each analysis is depicted in Fig. 1, participant data in Table 1. There was a significant difference in age, t(1947.3) = 9.9, p < 0.001, and sex, X2(1, N = 3539) = 35.2, p < 0.001, between patients and controls in the complete sample.
Figure 1. Flowchart of Data Inclusion.

Schematic overview of derived subcortical and cortical samples for each analysis. Abbreviations: HY, Hoehn & Yahr; med, medication; MoCA, Montreal Cognitive Assessment.
Table 1:
Demographic Characteristics of 2,357 Parkinson’s Disease Patients and 1,182 Controls Stratified by Cohort.
| N | Mean age, years (SD) | Female % | DURILL, years (SD) | ||||||
|---|---|---|---|---|---|---|---|---|---|
| Site | Cohort | HC | PD | HC | PD | HC | PD | HC | PD |
|
| |||||||||
| Amsterdam | Amsterdam I | 44 | 138 | 56.5 (9.48) | 63.1 (10.81) | 39 | 38 | NA | 2.1 (3.39) |
| Amsterdam II | 0 | 61 | NA | 62.5 (7.08) | NA | 39 | NA | 5.3 (3.54) | |
| Bern | BE I | 23 | 52 | 54.1 (9.78) | 62.9 (10.38) | 30 | 52 | NA | 12.4 (4.29) |
| BE II | 30 | 3 | 68.2 (4.59) | 59.7 (6.66) | 70 | 67 | NA | 11.3 (7.57) | |
| Campinas | UNICAMP | 138 | 110 | 58.9 (7.91) | 59.9 (10.2) | 63 | 34 | NA | 7.3 (6.41) |
| Chang Gung | CGU | 223 | 327 | 61 (7.28) | 60.1 (9.63) | 54 | 43 | NA | 8.7 (6.33) |
| Charlottesville | UVA I | 0 | 116 | NA | 63.7 (8.52) | NA | 28 | NA | 9.7 (5.09) |
| UVA II | 0 | 37 | NA | 62.4 (9.59) | NA | 14 | NA | 8.7 (3.64) | |
| UVA III | 0 | 24 | NA | 70.8 (6.77) | NA | 29 | NA | 7.7 (3.23) | |
| Christchurch | PDNZ | 39 | 209 | 67.5 (8.52) | 69.4 (7.77) | 33 | 26 | NA | 5.7 (5.57) |
| Donders | Donders | 23 | 59 | 62.7 (10.29) | 60.8 (10.07) | 48 | 44 | NA | 4.4 (3.79) |
| Graz | PROMOVE/ASPS I | 124 | 100 | 63.4 (10.07) | 63.2 (10.15) | 27 | 29 | NA | 4.7 (4.77) |
| PROMOVE/ASPS II | 0 | 23 | NA | 64 (9.9) | NA | 22 | NA | 4 (5.69) | |
| Liege | Liege I | 33 | 30 | 65.8 (4.29) | 65.9 (6.61) | 45 | 37 | NA | 7.2 (5.32) |
| Liege II | 43 | 45 | 64.8 (8.33) | 66.9 (8.24) | 49 | 44 | NA | 6 (3.93) | |
| Milan | Milan | 10 | 44 | 53.3 (10.53) | 57.8 (7.71) | 70 | 32 | NA | 11.4 (3.38) |
| NEUROCON | NEUROCON | 15 | 27 | 66.7 (11.74) | 68.7 (10.55) | 80 | 37 | NA | NA |
| NW-England | NW-England I | 22 | 32 | 70 (7.27) | 69.9 (8.58) | 45 | 19 | NA | 6.8 (4.42) |
| NW-England II | 13 | 14 | 64.6 (4.13) | 65 (5.67) | 38 | 29 | NA | 9.2 (6.02) | |
| ON Japan | ON Japan | 15 | 30 | 63.3 (5.25) | 67.6 (6.81) | 53 | 57 | NA | NA |
| Oxford | Oxford DISCOVERY | 57 | 115 | 65.6 (8.2) | 63.9 (10.05) | 39 | 36 | NA | 2.3 (1.58) |
| Pennsylvania | UDALL/U19 | 11 | 112 | 70.1 (5.86) | 66.4 (7.87) | 55 | 32 | NA | 7.3 (5.48) |
| PPMI | PPMI 1–21 | 163 | 347 | 63.6 (16.73) | 62.9 (8.19) | 36 | 35 | NA | 0.6 (0.52) |
| Rome SLF | Rome SLF | 125 | 239 | 36.6 (10.63) | 62.7 (10.19) | 41 | 37 | NA | 4.9 (4.17) |
| Stanford | Stanford | 11 | 44 | 65.6 (6.47) | 68.6 (8.49) | 82 | 50 | NA | 5.6 (3.44) |
| Tao Wu | Tao Wu | 20 | 19 | 64.8 (5.58) | 65 (4.45) | 40 | 47 | NA | 5.3 (4) |
|
| |||||||||
| Total | 1182 | 2357 | 59.4 (12.31) | 63.4 (9.77) | 46 | 36 | NA | 5.5 (5.47) | |
Abbreviations: NA, not available; N, sample size; HC, healthy control; PD, Parkinson’s disease; SD, standard deviation; DURILL, duration of illness; MoCA, Montreal Cognitive Assessment.
Cortical thickness, cortical surface area and ICV
PD patients showed a significantly thinner cortex compared to controls in 20 of 34 left hemisphere ROIs (dmax = −0.20, −1.79%; dmin = −0.10, −0.78%) and 18 of 34 right hemisphere ROIs (dmax = −0.19, −1.87%; dmin = −0.09, −0.88%; Fig. 2a and Table S2a). Differences appeared symmetrical in 16 ROIs. All but the right parahippocampal gyrus (p = 0.0891), left pars orbitalis (p = 0.0572), and left superior frontal gyrus (p = 0.0600) remained significant when corrected for ICV. Surface areas of the left frontal pole (d = −0.17, −3.08%) and lateral occipital cortex (d = −0.12, −1.48%) were significantly smaller in patients (Fig. 2b and Table S2b). We found no differences for total surface area between patients and controls (p = 0.5272). Patients had a higher ICV than controls (p = 0.010, d = 0.08, 0.98%).
Figure 2. Cortical Thickness, Cortical Surface Area, and Subcortical Volume Group Differences for Parkinson’s Disease Patients versus Controls.

D-statistic effect size estimates for mean differences in (A) cortical thickness, (B) cortical surface area, and (C) subcortical volume. A negative d-value indicates smaller measurements in Parkinson’s disease patients. Cortical regions with P-values < 7.35 × 10⁻⁴ (i.e., 0.05/68 ROIs) are depicted in the heatmap colors. Subcortical regions with P-values < 3.13 × 10⁻³ (i.e. 0.05/16 ROIs) are depicted as in the heatmap colors. Abbreviations: RH, right hemisphere; LH, left hemisphere; ROI, region of interest, L, left; R, right; n., nucleus.
Subcortical volume
PD patients showed a significantly larger left thalamus (d = 0.13, 1.79%), smaller putamen bilaterally (dleft = −0.14, −2.03%; dright = −0.14, −2.01%), and a smaller left amygdala (d = −0.13, −2.27%), compared to controls (Fig. 2c and Table S2c).
HY stages
The matching procedure selected 435 stage 1 patients (846 controls), 940 stage 2 patients (907 controls), 258 stage 3 patients (501 controls), and 83 stage 4 & 5 patients (329 controls) for the analyses (Tables S8a–d). Controls partially overlapped across stages (Tables S9). Mann-Whitney tests revealed significant differences in illness duration and MoCA scores between all HY groups (Table S10).
Cortical thickness
A summary of thickness results is shown in Fig. 3a and Table S3a, and complete results in Table S4a–d. Compared with controls, HY1 patients showed a thinner left fusiform (d = −0.16, −1.31%) and inferior temporal cortex (d = −0.18, −1.43%), right precuneus (d = −0.17, −1.46%), and inferior (d = −0.22, −1.91%) and superior parietal cortex (d = −0.17, −1.71%). HY2 patients showed a thinner cortex in eight left hemisphere ROIs (dmax = −0.17, −2.53%; dmin = −0.13, −1.22%) and seven right hemisphere ROIs (dmax = −0.18, −1.97%; dmin = −0.13, −1.34%). HY3 patients showed a thinner cortex in 15 left hemisphere ROIs (dmax = −0.37, −3.67%; dmin = −0.21, −2.21%) and 17 right hemisphere ROIs (dmax = −0.33, −4.74%; dmin = −0.17, −1.89%). HY4–5 patients showed a thinner cortex in 14 left hemisphere ROIs (dmax = −0.58, −5.24%; dmin = −0.34, −2.88%) and 15 right hemisphere ROIs (dmax = −0.52, −5.75%; dmin = −0.31, −3.19%). When corrected for ICV, all ROIs remained significant, except for the right temporal pole (p = 0.0512) in HY3 and the right isthmus cingulate gyrus (p = 0.0744) in HY4–5.
Figure 3. Cortical Thickness, Cortical Surface Area, and Subcortical Volume Group Differences for Parkinson’s Disease Groups, at Different Hoehn & Yahr Stages, versus Age- and Sex-matched Controls.


D-statistic effect size estimates for mean differences in (A) cortical thickness, (B) cortical surface area, and (C) subcortical volume. Cortical regions with P-values < 7.35 × 10⁻⁴ (i.e., 0.05/68 ROIs) are depicted in the heatmap colors. Subcortical regions with P-values < 3.13 × 10⁻³ (i.e. 0.05/16 ROIs) are depicted as * and structures with P-values < 6.25 × 10⁻⁵ as ** (i.e. 0.001/16 ROIs). Scan the QR code to download the Schol-AR app and aim your camera at Figure 3 to see an augmented reality version of the supplementary videos. Abbreviation: ROI, region of interest; L, left; R, right; thal, thalamus; amyg, amygdala; caud, caudate nucleus; hippo, hippocampus; accumb, accumbens nucleus; put, putamen; pal, globus pallidus; lat vent, lateral ventricle.
Cortical surface area
Compared to controls, HY1 patients showed a smaller surface area of the left frontal pole (d = −0.22, −3.93%; Fig. 3b, Table S3b, and Table S4e–h). HY2 patients showed a smaller surface area of the lingual cortex (dleft = −0.15, −2.32%; dright = −0.17, −2.57%), left lateral occipital cortex (d = −0.15, −1.99%), and right pericalcarine cortex (d = −0.17, −3.03%). HY3 patients showed a smaller surface area in 9 left hemisphere ROIs (dmax = −0.32, −5.82%; dmin = −0.25, −3.40%) and 7 right hemisphere ROIs (dmax = −0.35, −4.72%; dmin = −0.25, −3.11%). HY4–5 patients combined showed a smaller surface area of the precuneus (dleft = −0.42, −5.10%; dright = −0.40, −4.79%), and left inferior temporal (d = −0.40, −5.73%) and lateral occipital cortex (d = −0.42, −5.50%). We found no differences for total surface area between patients and controls for all HY stages (Table S12).
Subcortical volume
Results of the subcortical analysis are depicted in Fig. 3c, Table S3c, and Table S4i–l. Compared to controls, HY1 patients showed a significantly larger left thalamus (d = 0.15, 2.15%). HY2 patients showed smaller bilateral amygdalae (dleft = −0.16, −2.99%; dright = −0.12, −2.28%) and smaller putamen (dleft = −0.15, −2.45%; dright = −0.15, −2.49%). At HY3, patients showed smaller amygdalae (dleft = −0.44, −8.63%; dright = −0.32, −6.28%), putamen (dleft = −0.27, −4.67%; dright = −0.24, −4.16%), hippocampi (dleft = −0.24, −3.43%; dright = −0.28, −4.27%), and left caudate nucleus (d = −0.22, −3.72%). Finally, HY4–5 patients showed smaller amygdalae (dleft = −0.64, −11.60%; dright = −0.55, −9.98%), hippocampi (dleft = −0.55, −6.82%; dright = −0.61, −8.11%), putamen (dleft = −0.42, −6.43%; dright = −0.47, −7.47%), left caudate nucleus (d = −0.33, −5.20%) and globus pallidus (d = −0.32, −6.97%), and right accumbens (d = −0.47, −12.45%). The lateral ventricles were larger in PD (dleft = 0.36, −18.42%; dright = 0.52, −27.80%).
Post-hoc HY side-by-side comparison
Comparisons between HY increments, using model 1, revealed mainly significantly thinner cortical and smaller subcortical ROIs in HY3 compared to HY2 that overlapped with the case-control findings (Tables S7a–i). Comparisons between HY groups, additionally corrected for illness duration, revealed largely consistent volume differences of both hippocampi and left amygdala (Tables S11a–c).
MoCA
A total of 1,057 patients had MoCA scores available for analysis (Table S12), including 425 patients (40.2%) with cognitive impairment (i.e. MoCA < 26), of which 88 patients (8.3%) with dementia (i.e. MoCA < 21).
Cortical thickness and surface area
Thickness results are depicted in Fig. 4a, Table S5a, and S15a. The analysis revealed a significant positive correlation between MoCA scores and cortical thickness in 15 ROIs in the left hemisphere (rmax = 0.14; rmin = 0.09) and 13 ROIs in the right hemisphere (rmax = 0.14; rmin = 0.08). All ROIs but the left precuneus and right transverse temporal gyrus remained significant when corrected for illness duration. Surface area results are shown in Fig. 4b, Table S5b, and S15b. We found a significant positive correlation between MoCA scores and cortical surface area in the left pars opercularis (r = 0.11) and the right inferior parietal cortex (r = 0.12). This remained significant when corrected for illness duration. MoCA PD patients versus controls results are depicted in Table S6a,b.
Figure 4. Cortical Thickness, Cortical Surface Area, and Subcortical Volume Findings for the MoCA Regression.

R-statistic estimates for the associations with (A) cortical thickness, (B) cortical surface area, and (C) subcortical volume. Cortical regions with P-values < 7.35 × 10⁻⁴ (i.e., 0.05/68 ROIs) are depicted in the heatmap colors. Subcortical regions with P-values < 3.13 × 10⁻³ (i.e. 0.001/16 ROIs) are depicted in the heatmap colors. Higher MoCA scores denote better cognitive performance. Abbreviations: RH, right hemisphere; LH, left hemisphere; ROI, region of interest; n., nucleus.
Subcortical volume
Volume results are depicted in Fig. 4c, Table S5c, and S15c. The analysis revealed a significant positive correlation between MoCA scores and the hippocampi (rleft = 0.11; rright = 0.12), amygdalae (rleft = 0.13; rright = 0.11), and left putamen (r = 0.08) volumes. In addition, we found a negative correlation between MoCA scores and lateral ventricular volume bilaterally (rleft = −0.12; rright = −0.11). All ROIs but the left putamen remained significant when corrected for illness duration. MoCA patients versus controls results are depicted in Table S6c.
Illness duration
A total of 2,211 patients had illness duration scores available for analysis (Table S13).
Cortical thickness and surface area
Thickness results are depicted in Table S14a. The analysis revealed a significant negative correlation between illness duration scores and thinning of the precuneus (rleft = −0.06; rright = −0.06), and left inferior (r = −0.06) and right superior parietal cortex (r = −0.06). Surface area results are shown in Table S14b. We found a significant negative correlation between illness duration scores and cortical surface area in the medial orbitofrontal cortex (r = −0.08). Results uncorrected for Age are depicted in Table S14d–e.
Subcortical volume
Volume results are depicted in Table S14c. The analysis revealed a significant negative correlation between illness duration scores and the thalami (rleft = −0.05; rright = −0.06), amygdalae (rleft = −0.11; rright = −0.10), hippocampi (rleft = −0.06; rright = −0.06), caudate (rleft = −0.10; rright = −0.08), left putamen (r = −0.07), and left accumbens (r = −0.06) volumes. Results uncorrected for Age are depicted in Table S14f.
Discussion
Main findings
In this largest collaborative MRI study on PD to date, we found lower cortical thickness, on average, in patients compared to controls across all HY disease stages, more pronounced with higher disease severity. In the subcortex, a larger left thalamus in patients in stage 1 was followed by smaller putamen and amygdalae bilaterally in stage 2 and onwards. Late-stage patients showed smaller hippocampi, left caudate nucleus, left globus pallidus, and right accumbens, and larger lateral ventricles. Finally, we found that poorer cognitive performance was associated with widespread cortical atrophy and volume loss in core limbic structures.
HY and disease staging
The HY stages reliably track disease progression,16 although the relationship between the development of motor and cognitive symptom development has not been fully elucidated. Generally, both domains tend to worsen during the disease course, with a dementia prevalence up to 80% in the final stages of PD, in addition to severe movement disabilities.17 Our cortical and subcortical findings are strongly in line with an ongoing neurodegenerative process; each HY increment largely replicates the previous stage with additional implicated regions, emphasized by longer illness duration and poorer cognitive performance in patients. Furthermore, there was notable overlap in the implicated cortical and subcortical regions in the illness duration and HY stage analysis, including parietal, striatal and limbic structures. This is largely compatible with earlier work on the progression and propagation of atrophy in early PD, with the exception of the frontal cortex we found to be spared until the later HY stages.18 Possibly, deformation-based morphometry is more sensitive to capture these differences, while nuances may alternatively be driven by milder atrophy subtypes.19 The small effect sizes reflect the subtle differences that may be difficult to capture in smaller, underpowered studies. Notably, the stringent statistical method we used for better model fit is known to yield lower effect size estimates.20
Cognitive features
A thinner posterior and temporal cortex has been linked to cognitive impairment in the early symptomatic stages of PD.21 Indeed, we found that poorer cognition was associated with thinning in the parietal and inferior temporal regions, contingent upon the thinner cortices as demonstrated in HY1 and HY2 patients. We may, however, assume the vast majority of early-stage patients were cognitively normal,22 which would fit the notion that temporal and parietal degeneration may precede cognitive decline.21 In addition, the implication of the occipital cortex may relate to compromised visual functions in early-stage PD patients.23 The diffuse pattern of thinner cortices alongside smaller hippocampi and amygdalae in HY3 patients agrees with the more advanced symptomatic stages associated with PD dementia;24 we found those regions accordingly linked to worse cognitive performance. Patients in the final stages showed enlarged lateral ventricles - highlighting the severe atrophy in surrounding and adjacent structures, such as the hippocampus. The spared occipital cortex in HY4–5 contrasting HY2–3 may be a surprising finding, since previous studies demonstrated a gradual worsening of cholinergic denervation in this region, associated with cognitive decline and the appearance of dementia.25 It is possibly explained by the relatively small HY4–5 sample size and dementia-specific exclusion criteria related to 13 patients (15%), which together may have nuanced group differences. Interestingly, patterns associated with cognitive decline appeared largely independent of illness duration, possibly denoting the variable rate of cognitive symptom progression in PD.24
HY and relation to staging theories
An estimated 80% of striatal dopaminergic neurons are lost at the time of motor symptom onset in PD.26 Dysfunction of the nigrostriatal pathway is associated with motor symptoms and leads to reduced activity in the putamen.27 We observed lower putamen volumes, indicative of early abnormal atrophy in PD; the symmetry in HY2 corresponds to the transition from unilateral to bilateral motor impairment. Striatal degeneration is further highlighted by atrophy of the caudate nucleus in HY3 and onwards. The globus pallidus appeared robust to volume loss until the final stages, contrasting with the role of pallidal dopamine depletion in tremor in PD.28 It should be noted, however, that the globus pallidus notoriously shows poor contrast on T1-weighted scans,29 hampering adequate segmentation. Perhaps counterintuitively in view of a neurodegenerative disease, the volume of the left thalamus was higher in HY1 patients versus controls. Previous studies have reported local shape abnormalities of the thalamus in PD patients to suggest both atrophic and hypertrophic subregions.30,31 It is proposed that the initial hypertrophy may be the result of hyperactivity in the cerebellothalamic circuit, which is thought to underlie Parkinson tremor.28
According to Braak’s staging model,32 Lewy body pathology spreads in an ascending fashion from brainstem regions towards the subcortex, finally reaching the neocortex through the mesocortex. Clinical symptoms manifest around Braak stage 4–5, when first limbic and then mesocortical structures become affected. Similarly, in this study the bilateral amygdalae are affected first at an early symptomatic stage, with reduced bilateral hippocampal volumes and thinner entorhinal, parahippocampal, and posterior cingulate regions in subsequent stages, denoting the transition to the neocortex. The ascending propagation of pathology as proposed by Braak is challenged by our finding of posterior cortical implication at an early stage, suggesting that neocortical degeneration may occur at least parallel to the onset of subcortical degeneration. The simultaneous development of pathology in multiple systems has been incorporated in alternative staging models and may offer a more comprehensive theory on the neurobiology of PD that better accounts for individual differences in manifestation, onset and progression of motor and non-motor symptoms such as cognitive impairment.33,34 For example, unlike the fronto-striatal dopaminergic circuits, the posterior cortex is heavily innervated by cholinergic projections, emphasizing the deterioration of distinct systems. Early stage dysfunction in the posterior cortex in PD patients has been linked to a phenotype showing rapid cognitive decline and conversion to dementia.33 We note, however, that MRI-derived findings should be cautiously interpreted in the context of alpha-synuclein propagation.
ICV and brain size
The larger ICV found in PD patients suggests that cranial overgrowth might be a risk factor for the disease, supported by earlier research demonstrating a shared genetic background between ICV and the risk of PD.35 Due to the congruent maturation of the brain and cranium, and the unchanged cranial size through adulthood, ICV is considered a stable proxy for “maximal attained brain size”.35 It could be hypothesized that PD patients have a larger maximal attained brain size compared to healthy individuals, which would be a relevant early life marker. In absence of premorbid data, we have evidence to suggest there is no difference in cerebral size, as measured by total cerebral surface area, between PD patients and healthy controls, despite early indications of abnormal atrophy in patients. Investigation of brain size in a premorbid group, such as patients suffering from prodromal REM-sleep behavior disorder, could provide further insight in the possible role of brain overgrowth in PD.
Limitations
The use of cross-sectional data does not allow us to make clear inferences on atrophy patterns and disease progression as with a longitudinal design. The HY scale also does not encompass the variety of non-motor symptoms that contribute to disease severity and progression. Moreover, due to the retrospective nature of data collection, some sites had specific inclusion/exclusion criteria related to psychiatric illness, cognitive impairment, and dementia, which may have made our sample less representative of the patient population, especially in the later HY stages, when these symptoms are more prevalent and severe. Nevertheless, we demonstrated that both longer illness duration and poorer cognitive performance were associated with each HY increment. Although the MoCA subgroup was representative of the full sample in terms of demographics, there may be hidden confounding clinical or environmental parameters influencing these results not picked up by our limited sample.
Conclusions
To conclude, in this large, multi-national sample of PD patients versus healthy controls, we found widespread structural brain abnormalities on the cortical and subcortical level that may shed new light on the pathophysiology and progression of PD. The cortical and subcortical findings are strongly in line with an ongoing neurodegenerative process and with the development and extent of structural differences with increasing disease severity. The results correspond to earlier findings reported in individual studies and, importantly, overall correspond to the staging described by Braak,32 with some notable exceptions that fit alternative staging theories. The results of this study highlight the importance of adequately powered multicenter collaborations to reveal disease patterns.
Supplementary Material
Acknowledgments
financial disclosures
K.L.P. reports honoraria from invited scientific presentations to universities and professional societies not exceeding $5,000/yr, is reimbursed by Sanofi, AstraZeneca, and Sangamo BioSciences for the conduct of clinical trials, has received consulting fees from Allergan and Curasen, and is funded by grants from the Michael J Fox Foundation for Parkinson’s Research and the NIH.
R.M.A.d.B. received unrestricted research grants from Medtronic, GEHealth, Lysosomal Therapeutics, all paid to the Institution.
R.H. serves on the Clinical Advisory Board of Cadent Therapeutics.
O.A.v.d.H received funding for a honorarium lecture from Benecke.
C.T.M. receives research funding from Biogen, Inc and provides consulting services for Invicro and Axon Advisors on behalf of Translational Bioinformatics, LLC. He also receives an honorarium as Associate Editor of NeuroImage: Clinical.
N.J. and P.M.T. received partial grant support from Biogen, Inc., for research unrelated to the topic of this manuscript.
Funding sources
ENIGMA Core: This work was supported in part by NIH grants R56AG058854, R01AG059874, R01MH116147, R01MH117601, U54EB020403, and the Michael J Fox Foundation grant 14848, and the Kavli Foundation Neurodata without Borders.
PPMI cohort: Data used in the preparation of this article were obtained from the Parkinson’s Progression Markers Initiative (PPMI) database (www.ppmi-info.org/data). For up-to-date information on the study, visit www.ppmi-info.org. PPMI – a public-private partnership – is funded by the Michael J. Fox Foundation for Parkinson’s Research and funding partners, including AbbVie, Allergan, Amathus Therapeutics, Avid Radiopharmaceuticals, Biogen, BioLegend, Bristol-Myers Squibb, Celgene, Denali, GE Healthcare, Genentech, GlaxoSmithKline, Janssen Neuroscience, Eli Lilly and Company, Lundbeck, Merck, Meso Scale Discovery (MSD), Pfizer, Piramal Enterprises, Ltd, Prevail Therapeutics, Roche, Sanofi Genzyme, Servier, Takeda, Teva, UCB, Verily and Voyager Therapeutics.
OpenNeuro Japan cohort: This data was obtained from the OpenfMRI database. Its accession number is ds000245. This research was supported in part by the following: a Grant-in-Aid from the Research Committee of Central Nervous System Degenerative Diseases by the Ministry of Health, Labour, and Welfare, Integrated Research on Neuropsychiatric Disorders project, carried out by SRBPS; a Grant-in-Aid for Scientific Research on Innovative Areas (Brain Protein Aging and Dementia Control 26117002) from the MEXT of Japan; Integrated Research on Neuropsychiatric Disorders carried out under the Strategic Research Program for Brain Sciences, Scientific Research on Innovative Areas (Comprehensive Brain Science Network); and Integrated Research on Depression, Dementia, and Development Disorders by the Strategic Research Program for Brain Sciences from the Japan Agency for Medical Research and Development (AMED).
NEUROCON cohort: This work was partially supported by the NEUROCON project (84/2012), financed by UEFISCDI.
Stanford cohort: This work was supported by the NIH/NINDS (K23 NS075097) and the Michael J Fox Foundation for Parkinson’s Research.
Oxford DISCOVERY cohort: This work was funded by Parkinson’s UK, NIHR Oxford Health Biomedical Research Centre.
Amsterdam I cohort: Grant support (not for this study) from the Netherlands Organisation for Health Research and Development, the Michael J Fox Foundation and the Hersenstichting.
Amsterdam II (Cogtips) cohort: Cogtips is supported by the Dutch Parkinson’s Disease Association (‘Parkinson Vereniging’ 19–2015) and Brain Foundation of the Netherlands (‘Hersenstichting’ HA-2017–00227).
Liege I & II cohorts: This work was funded by PDR Grant T0.165.14, National Fund for Scientific Research (FNRS), Belgium.
Donders cohort: This work was funded by a grant of the Dutch Brain Foundation (grant F2013(10–15 to R.H.), from the Netherlands Organization for Scientific Research (VENI grant #91617077), and from the Michael J Fox Foundation.
Rome SLF cohort: This work was funded by the Italian Ministry of Health, Italian Ministry of Health RC12–13-14–15-16–17-18–19/A.
UNICAMP cohort: This work was funded by the São Paulo Research Foundation FAPESP-BRAINN (2013–07559-3).
Christchurch cohort: This work was supported by the Health Research Council of New Zealand, Canterbury Medical Research Foundation, Neurological Foundation of New Zealand, University of Otago Research Grant, Brain Research New Zealand.
Charlottesville I-III cohorts: This work was supported by grants from Department of Defense, Commonwealth of Virginia’s Alzheimer’s and Related Diseases Research Award Fund, and University of Virginia.
NW-England I & II cohorts: This work was funded by the Sydney Driscoll Neuroscience Foundation, Lancaster University and the Sir John Fisher Foundation, University of Manchester Biomedical Imaging Institute, Medical Research Council UK Doctoral Training Programme, Engineering and Physical Science Research Council UK (EP/M005909/1).
BE I & II cohorts: Co-author for the Bern cohort receives a grant from Boston Scientific.
Pennsylvania cohort: This work was funded by the NINDS, NIH AG062418 (U19) and NS053488 (P50). We would like to acknowledge the support of Alice Chen Plotkin for MRI and clinical data collection.
Chang Gung cohort: This work was supported by MOST 106–2314-B-182–018-MY3, EMRPD1K0451, EMRPD1K0481.
Schol-AR: Support for this work was provided by the National Institutes of Health (grants P41EB015922 and U54EB020406) and by the Michael J. Fox Foundation’s Parkinson’s Progression Markers Initiative (PPMI – award # 8283.03).
Financial Disclosures of All Authors (for the Preceding 12 Months)
Y.D.v.d.W.: none.
M.A.L.: none.
J.K.B.: none.
S.A.: Grant: The Dowager Countess Eleanor Peel Trust Medical Research Grant.
T.J.A.: none.
T.A.: Grants: Alzheimer’s Disease Neuroimaging Initiative (U01AG02490), Neurodegeneration in Aging Down Syndrome (U01AG051406).
F.A.: none.
K.A.B.: none.
H.W.B.: Grants: ZonMw, Michael J Fox Foundation.
J.B.: none.
F.C.: Employment: National Council for Scientific and Technological Development (CNPq).
J.C.D.: Grants: New Zealand Neurological Foundation, Health Research Council of New Zealand, Brain Research New Zealand, School of Psychology, Speech and Hearing.
R.M.A.d.B.: Research support paid to the institution from Medtronic, Lysosomal Therapeutics, Neuroderm, ZonMw, Parkinson Vereniging, Stichting Parkinson Nederland.
I.D.: Grants: Boston Scientific, Abbvie, Medtronic, UCB, Bial. Reimbursement: Zambon, Boston Scientific.
M.F.D.: none.
J.D.: none.
H.C.A.E.: Grants: NIHR, EPSRC, MRC.
G.G.: none.
R.P.G.: Employment: National Council for Scientific and Technological Development (CNPq).
B.A.G.: Grant: Alzheimer’s Association Grant 2018-AARG-592081.
R.C.H.: Grants: Michael J Fox Foundation (grant #16048 & #15581), Netherlands Organization for Scientific Research (VENI grant, #91617077).
J.C.K.: none.
C.E.M.: none.
C.T.M.: none.
T.R.M.: none.
L.M.P.: Grants: Alzheimer’s Society, EPSRC UK, EU.
F.P.: Grants: Italian Ministry of Health RC 19, RC 20.
T.L.P.: Grant: New Zealand Brain Research Institute. Honorarium: Stata Australia Ltd.
K.L.P.: Grants: Michael J Fox Foundation for Parkinson’s Research, NIH. Honoraria: invited scientific presentations to universities and professional societies not exceeding $5,000/yr. reimbursement: Sanofi, AstraZeneca, Sangamo BioSciences. Consultancies: Allergan, Curasen.
M.R.: none.
L.F.R.: Employment: National Council for Scientific and Technological Development (CNPq).
C.S.R.: Employment: National Council for Scientific and Technological Development (CNPq).
C.R.: Grants: Swiss National Science Foundation (projects CRSK-3_190817/1 and CRSII5_180365), Novartis AG (FreeNovation research grant).
L.S.R.S.: Employment: National Council for Scientific and Technological Development (CNPq).
R.S.: none.
P.S.: Honoraria: AbbVie, GmbH.
G.S.: none.
L.S.: none.
O.A.v.d.H.: Grant: VIDI grant from The Netherlands Organization for Health Research (ZonMw; project number: 91717306). Consultancy: Lundbeck.
C.V.: none.
J.W.: Grants: MOST 109–2314-B-182–021-MY3, MOST 109–2221-E-182–009-MY3, MOST 106–2314-B-182–018-MY3.
D.W.: Grants: Michael J. Fox Foundation for Parkinson’s Research, Alzheimer’s Therapeutic Research Initiative (ATRI), Alzheimer’s Disease Cooperative Study (ADCS), the International Parkinson and Movement Disorder Society (IPMDS), the National Institute on Aging (NIA). Honoraria: Acadia, Aptinyx, CHDI Foundation, Clintrex LLC (Alkahest, Aptinyx, Avanir, Otsuka), Eisai, Enterin, Great Lake Neurotechnologies, Janssen, Sage, Scion, Signant Health, Sunovion and Vanda. License fee payments: the University of Pennsylvania for the QUIP and QUIP-RS..
R.W.: Grants: Swiss National Science Foundation (projects CRSII5_180365, 320030L_170060), Swiss Personalized Health Network (driver project 2018DRI10), Swiss Innovation Council (project 43087.1 IP-LS) University of Bern (sitem-insel Support Funds 2019), Biogen (research project CHE-TYS-18–11316). .
C.L.Y.: Employment: National Council for Scientific and Technological Development (CNPq).
N.J.: Grant: Biogen Inc.
P.M.T.: Grants: NIH grants U01AG024904, R01MH111671.
Footnotes
conflicts of interest
None of the other authors declares any competing financial interests.
References
- 1.Poewe W, Seppi K, Tanner CM, et al. Parkinson disease. Nat Rev Dis Primers. 2017;3:17013. [DOI] [PubMed] [Google Scholar]
- 2.Caligiore D, Helmich RC, Hallett M, et al. Parkinson’s disease as a system-level disorder. NPJ Parkinsons Dis. 2016;2:16025. [DOI] [PMC free article] [PubMed] [Google Scholar]
- 3.De Micco R, Russo A, Tessitore A. Structural MRI in Idiopathic Parkinson’s Disease. Int Rev Neurobiol. 2018;141:405–438. [DOI] [PubMed] [Google Scholar]
- 4.Hall JM, Lewis SJG. Neural Correlates of Cognitive Impairment in Parkinson’s Disease: A Review of Structural MRI Findings. Int Rev Neurobiol. 2019;144:1–28. [DOI] [PubMed] [Google Scholar]
- 5.Thompson PM, Jahanshad N, Ching CRK, et al. ENIGMA and Global Neuroscience: A Decade of Large-Scale Studies of the Brain in Health and Disease across 43 Countries. Translational Psychiatry. Published online February 2020. [DOI] [PMC free article] [PubMed] [Google Scholar]
- 6.Hoehn MM, Yahr MD. Parkinsonism: onset, progression and mortality. Neurology. 1967;17(5):427–442. [DOI] [PubMed] [Google Scholar]
- 7.Nasreddine ZS, Phillips NA, Bédirian V, et al. The Montreal Cognitive Assessment, MoCA: a brief screening tool for mild cognitive impairment. J Am Geriatr Soc. 2005;53(4):695–699. [DOI] [PubMed] [Google Scholar]
- 8.Marek K, Jennings D, Lasch S, et al. The Parkinson Progression Marker Initiative (PPMI). Prog Neurobiol. 2011;95(4):629–635. [DOI] [PMC free article] [PubMed] [Google Scholar]
- 9.Goetz CG, Poewe W, Rascol O, et al. Movement Disorder Society Task Force report on the Hoehn and Yahr staging scale: status and recommendations. Mov Disord. 2004;19(9):1020–1028. [DOI] [PubMed] [Google Scholar]
- 10.Ho DE, Imai K, King G, Stuart EA, Others. MatchIt: nonparametric preprocessing for parametric causal inference. Journal of Statistical Software, http://gkingharvardedu/matchit. Published online 2011. https://r.iq.harvard.edu/docs/matchit/2.4-18/matchit.pdf [Google Scholar]
- 11.Desikan RS, Ségonne F, Fischl B, et al. An automated labeling system for subdividing the human cerebral cortex on MRI scans into gyral based regions of interest. Neuroimage. 2006;31(3):968–980. [DOI] [PubMed] [Google Scholar]
- 12.Fischl B, Salat DH, Busa E, et al. Whole brain segmentation: automated labeling of neuroanatomical structures in the human brain. Neuron. 2002;33(3):341–355. [DOI] [PubMed] [Google Scholar]
- 13.Barnes J, Ridgway GR, Bartlett J, et al. Head size, age and gender adjustment in MRI studies: a necessary nuisance? NeuroImage. 2010;53(4):1244–1255. doi: 10.1016/j.neuroimage.2010.06.025 [DOI] [PubMed] [Google Scholar]
- 14.Nakagawa S, Cuthill IC. Effect size, confidence interval and statistical significance: a practical guide for biologists. Biol Rev Camb Philos Soc. 2007;82(4):591–605. [DOI] [PubMed] [Google Scholar]
- 15.Buckner RL, Head D, Parker J, et al. A unified approach for morphometric and functional data analysis in young, old, and demented adults using automated atlas-based head size normalization: reliability and validation against manual measurement of total intracranial volume. NeuroImage. 2004;23(2):724–738. doi: 10.1016/j.neuroimage.2004.06.018 [DOI] [PubMed] [Google Scholar]
- 16.Zhao YJ, Wee HL, Chan Y-H, et al. Progression of Parkinson’s disease as evaluated by Hoehn and Yahr stage transition times. Mov Disord. 2010;25(6):710–716. [DOI] [PubMed] [Google Scholar]
- 17.Hely MA, Reid WGJ, Adena MA, Halliday GM, Morris JGL. The Sydney multicenter study of Parkinson’s disease: the inevitability of dementia at 20 years. Mov Disord. 2008;23(6):837–844. [DOI] [PubMed] [Google Scholar]
- 18.Yau Y, Zeighami Y, Baker TE, et al. Network connectivity determines cortical thinning in early Parkinson’s disease progression. Nat Commun. 2018;9(1):12. [DOI] [PMC free article] [PubMed] [Google Scholar]
- 19.Fereshtehnejad S-M, Zeighami Y, Dagher A, Postuma RB. Clinical criteria for subtyping Parkinson’s disease: biomarkers and longitudinal progression. Brain. 2017;140(7):1959–1976. [DOI] [PubMed] [Google Scholar]
- 20.Boedhoe PSW, Heymans MW, Schmaal L, et al. An Empirical Comparison of Meta- and Mega-Analysis With Data From the ENIGMA Obsessive-Compulsive Disorder Working Group. Front Neuroinform. 2018;12:102. [DOI] [PMC free article] [PubMed] [Google Scholar]
- 21.Pereira JB, Svenningsson P, Weintraub D, et al. Initial cognitive decline is associated with cortical thinning in early Parkinson disease. Neurology. 2014;82(22):2017–2025. [DOI] [PMC free article] [PubMed] [Google Scholar]
- 22.Svenningsson P, Westman E, Ballard C, Aarsland D. Cognitive impairment in patients with Parkinson’s disease: diagnosis, biomarkers, and treatment. Lancet Neurol. 2012;11(8):697–707. [DOI] [PubMed] [Google Scholar]
- 23.Weil RS, Schrag AE, Warren JD, Crutch SJ, Lees AJ, Morris HR. Visual dysfunction in Parkinson’s disease. Brain. 2016;139(11):2827–2843. [DOI] [PMC free article] [PubMed] [Google Scholar]
- 24.Aarsland D, Creese B, Politis M, et al. Cognitive decline in Parkinson disease. Nat Rev Neurol. 2017;13(4):217–231. [DOI] [PMC free article] [PubMed] [Google Scholar]
- 25.Bohnen NI, Albin RL. The cholinergic system and Parkinson disease. Behav Brain Res. 2011;221(2):564–573. [DOI] [PMC free article] [PubMed] [Google Scholar]
- 26.Marsden CD. Parkinson’s disease. Lancet. 1990;335(8695):948–952. [DOI] [PubMed] [Google Scholar]
- 27.Brooks DJ. Neuroimaging in Parkinson’s disease. NeuroRx. 2004;1(2):243–254. [DOI] [PMC free article] [PubMed] [Google Scholar]
- 28.Helmich RC, Janssen MJR, Oyen WJG, Bloem BR, Toni I. Pallidal dysfunction drives a cerebellothalamic circuit into Parkinson tremor. Ann Neurol. 2011;69(2):269–281. [DOI] [PubMed] [Google Scholar]
- 29.Visser E, Keuken MC, Douaud G, et al. Automatic segmentation of the striatum and globus pallidus using MIST: Multimodal Image Segmentation Tool. Neuroimage. 2016;125:479–497. [DOI] [PMC free article] [PubMed] [Google Scholar]
- 30.Chen Y, Zhu G, Liu D, et al. The morphology of thalamic subnuclei in Parkinson’s disease and the effects of machine learning on disease diagnosis and clinical evaluation. J Neurol Sci. 2020;411:116721. [DOI] [PubMed] [Google Scholar]
- 31.Garg A, Appel-Cresswell S, Popuri K, McKeown MJ, Beg MF. Morphological alterations in the caudate, putamen, pallidum, and thalamus in Parkinson’s disease. Front Neurosci. 2015;9:101. [DOI] [PMC free article] [PubMed] [Google Scholar]
- 32.Braak H, Ghebremedhin E, Rüb U, Bratzke H, Del Tredici K. Stages in the development of Parkinson’s disease-related pathology. Cell Tissue Res. 2004;318(1):121–134. [DOI] [PubMed] [Google Scholar]
- 33.Kehagia AA, Barker RA, Robbins TW. Cognitive impairment in Parkinson’s disease: the dual syndrome hypothesis. Neurodegener Dis. 2013;11(2):79–92. [DOI] [PMC free article] [PubMed] [Google Scholar]
- 34.Engelender S, Isacson O. The Threshold Theory for Parkinson’s Disease. Trends Neurosci. 2017;40(1):4–14. [DOI] [PubMed] [Google Scholar]
- 35.Adams HHH, Hibar DP, Chouraki V, et al. Novel genetic loci underlying human intracranial volume identified through genome-wide association. Nat Neurosci. 2016;19(12):1569–1582. [DOI] [PMC free article] [PubMed] [Google Scholar]
Associated Data
This section collects any data citations, data availability statements, or supplementary materials included in this article.