Abstract
Chromosome conformation capture (3C) assays are used to map chromatin interactions genome-wide. Chromatin interaction maps provide insights into the spatial organization of chromosomes and the mechanisms by which they fold. Hi-C and Micro-C are widely used 3C protocols that differ in key experimental parameters including cross-linking chemistry and chromatin fragmentation strategy. To understand how the choice of experimental protocol determines the ability to detect and quantify aspects of chromosome folding we have performed a systematic evaluation of 3C experimental parameters. We identified optimal protocol variants for either loop or compartment detection optimizing fragment size and cross-linking chemistry. We used this knowledge to develop a greatly improved Hi-C protocol (Hi-C 3.0) that can detect both loops and compartments relatively effectively. In addition to providing benchmarked protocols, this work produced ultra-deep chromatin interaction maps using Micro-C, conventional Hi-C and Hi-C 3.0 for key cell lines used by the 4D Nucleome project.
Chromosome conformation capture (3C)-based assays (1) have become widely used to generate genome-wide chromatin interaction maps (2). Analysis of chromatin interaction maps has led to detection of several features of the folded genome. Such features include precise looping interactions (0.1-1 Mb scale) between pairs of specific sites that appear as local dots in interaction maps. Many of such dots represent loops formed by cohesin-mediated loop extrusion that is stalled at convergent CTCF sites (3-5). Loop extrusion also produces other features in interaction maps including stripe-like patterns anchored at specific sites that block loop extrusion. The effective depletion of interactions across such blocking sites leading to domain boundaries (insulation). At the Mb scale interaction maps of many organisms including mammals display checkerboard patterns that represent the spatial compartmentalization of two main types of chromatin: active and open A-type chromatin domains and inactive and more closed B-type chromatin domains (6).
The Hi-C protocol has evolved over the years. While initial protocols used restriction enzymes such as HindIII that produces relatively large fragments of several kb (6), over the last 5 years Hi-C using DpnII or MboI digestion has become the protocol of choice for mapping chromatin interactions at kilobase resolution (3). More recently, Micro-C, which uses MNase instead of restriction enzymes as well as a different cross-linking protocol, was shown to allow generation of nucleosome-level interaction maps (7-9). It is critical to ascertain how key parameters of these 3C-based methods, including cross-linking and chromatin fragmentation, quantitatively influence the detection of chromatin interaction frequencies and the detection of different chromosome folding features that range from local looping between small cis elements to global compartmentalization of Mb-sized domains. Here we systematically assessed how different cross-linking and fragmentation methods yield quantitatively different chromatin interaction maps.
Results
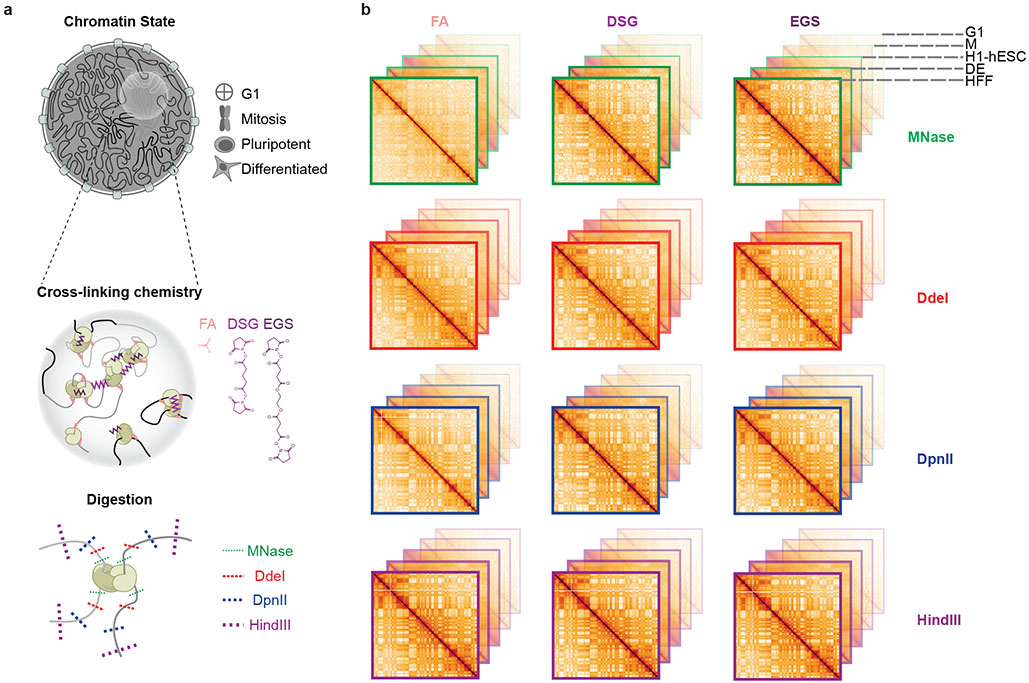
We explored how two key parameters of 3C-based protocols, cross-linking and chromatin fragmentation, determine the ability to quantitatively detect chromatin compartment domains and loops. We selected three cross-linkers widely used for chromatin: 1) 1% formaldehyde (FA), conventional for most 3C-based protocols, 2) 1% FA followed by an incubation with 3 mM disuccinimidyl glutarate (FA+DSG protocol), and 3) 1% FA followed by an incubation with 3 mM Ethylene glycol bis(succinimidylsuccinate) (FA+EGS protocol) (Figure 1a). We selected 4 different nucleases for chromatin fragmentation: MNase, DdeI, DpnII and HindIII, which fragment chromatin in sizes ranging from single nucleosomes to multiple kilobases. Combined, the 3 cross-linking and 4 fragmentation strategies yield a matrix of 12 distinct protocols (Figure 1b). To determine how performance of these protocols varies for different states of chromatin we applied this matrix of protocols to multiple cell types and cell cycle stages. We analyzed 4 different cell types: pluripotent H1-hESCs, differentiated endoderm (DE) cells derived from H1-hESCs, fully differentiated Human Foreskin Fibroblasts (HFF) (12 protocols for each), and HeLa-S3 (9 protocols) cells. We analyzed two cell cycle stages: G1 and mitotic HeLa-S3 cells (9 protocols for each; Figure 1). Each interaction library was then sequenced on a single lane of a HiSeq4000 instrument, producing ~150-200 million uniquely mapping read pairs (Supplementary Table 1). We used the Distiller pipeline to align the sequencing reads, and pairtools and cooler (33) packages to process mapped reads and create multiresolution contact maps (Methods). Since the density of restriction sites for DdeI, DpnII and HindIII fluctuates along chromosomes, we observed different read coverages in raw interaction maps obtained from datasets using these enzymes (Extended Data Figure 1h). These differences were removed after matrix balancing (14).
Figure 1: Outline of the experimental design.
a. Experimental design for conformation capture for various cells, cross-linkers and enzymes.
b. Representation of interaction maps from experiments depicted in panel a.
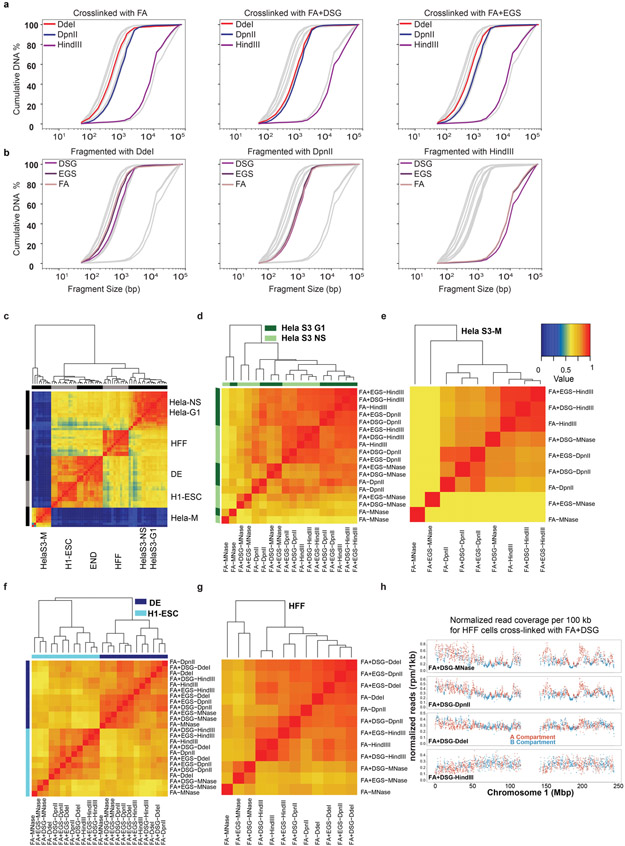
We first assessed the size range of the chromatin fragments produced after digestion by the twelve protocols for HFF cells (Methods). Digestion with HindIII resulted in 5-20 kb DNA fragments; DpnII and DdeI produced fragments of 0.5-5kb; and MNase protocols included a size selection step to ensure ligation product involved two mononucleosome sized fragments (~150 bp) (Extended Data Figure 1). Different cross-linkers did not affect the size ranges produced by the different nucleases much, though DSG cross-linking lowered digestion efficiency slightly (Extended Data Figure 1b).
All 3C-based protocols can differentiate between cell states
We first assessed similarity between the 63 datasets by global and pairwise correlations using HiCRep and hierarchical clustering (Extended Data Figure 1c) (10, 11). We found that the datasets are highly correlated and cluster primarily by cell type and state and then by cell type similarity, for example H1-ESC and H1-hESC derived DE cells cluster together; and the most distinct cluster is formed by mitotic HeLa cells. MNase protocols show slightly lower correlations with Hi-C experiments.
Extra cross-linking yields more intra-chromosomal contacts
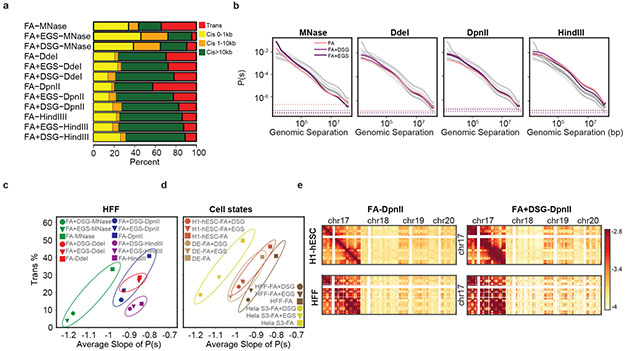
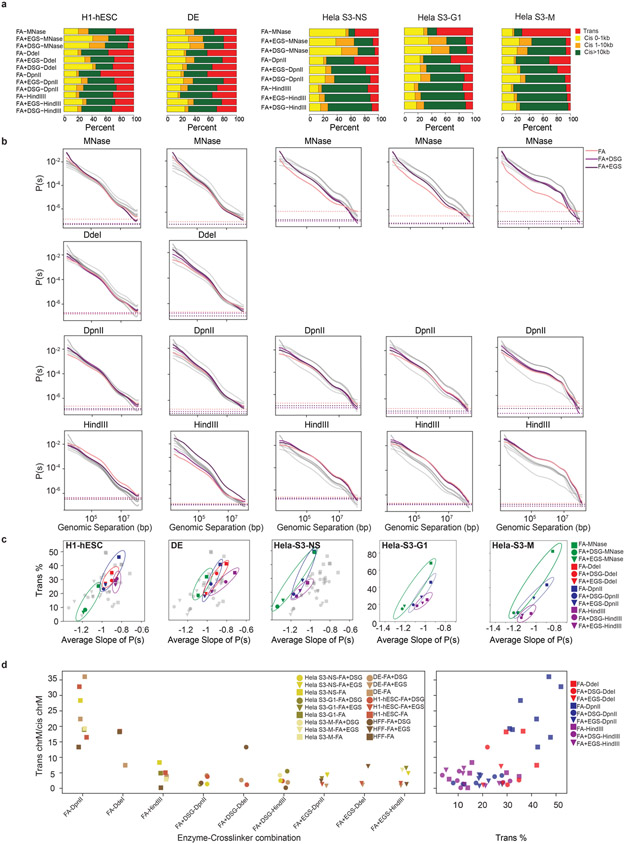
Since chromosomes occupy individual territories, intra-chromosomal (cis) interactions are more frequent than inter-chromosomal (trans) interactions (12). The cis:trans ratio is commonly used as an indicator of Hi-C library quality given that inter-chromosomal interactions are a mixture of true chromatin interactions and interactions that are the result of random ligations (12, 13). For all enzymes and cell types, we found that the addition of DSG or EGS to FA cross-linking decreased the percentage of trans interactions (Figure 2a (HFF) ; Extended Data Figure 2a (H1-hESC, DE, HeLa-S3)).
Figure 2: Extra cross-linking yields more intra-chromosomal contacts.
a. Number of valid pairs in each of the 12 HFF protocols by genomic distance.
b. Distance dependent contact probability for 12 HFF protocols. Each plot shows P(s) for experiments performed with indicated nuclease. Color of the lines indicate cross-linkers and gray lines indicate all datasets. Dashed lines show trans level.
c. The percentage of trans interactions versus the average slope of distance dependent contact probability for all cross-linker and enzyme combinations in HFF. Nucleases grouped by colored ovals.
d. Percentage of trans interactions versus average slope of distance dependent contact probability for each cell state. Only experiments cross-linked with FA, FA+DSG or FA+EGS and digested with DpnII are shown.
e. Interactions (log transformed) between chromosome 17 and chromosomes 17, 18, 19 and 20 for FA or FA+DSG cross-linking and DpnII digestion, in H1-hESC and HFF. Total trans interactions for FA-DpnII protocols in H1-hESC: 47.7%, HFF: 42.5% and for FA+DSG-DpnII protocols in H1-hESC: 25% and HFF: 17.3%.
Regarding intra-chromosomal interactions, we noticed two distinct patterns. First, digestion into smaller fragments increased short range interactions. MNase digestion generated more interactions between loci separated by less than 10 kb, whereas digestion with either DdeI, DpnII or HindIII resulted in a relatively larger number of interactions between loci separated by more than 10 kb (Figure 2a-2b (HFF), Extended Data Figure 2a, 2b (DE, H1-hESC, HeLa-S3)). Second, P(s) plots showed that the addition of either DSG or EGS resulted in a steeper decay in interaction frequency as a function of genomic distance for all fragmentation protocols. Moreover, for a given chromatin fragmentation level, additional cross-linking with DSG or EGS reduced trans interactions, as shown for HFF and all other cell types and cell stages studied (Figure 2c, 2d and Extended Data Figure 2c). Addition of DSG or EGS could have reduced fragment mobility and formation of spurious ligations, resulting in a steeper slope of the P(s). We note a difference in slopes for data obtained with different cell types and cell cycle stages, which could reflect state-dependent differences in chromatin compaction.
Random ligation events between uncrosslinked, freely diffusing fragments lead to noise that is mostly seen in trans and long range cis interactions. Experiments that use DpnII and additional crosslinkers have a general decrease in trans contacts, while uncovering a stronger trans compartmental pattern (Figure 2e). Additionally, the comparison of trans interaction frequencies to interactions between mitochondrial and nuclear genomes, as these interactions can only result from random ligations (Extended Data Figure 2d) showed that random ligations between genomic and mitochondrial DNA were the lowest when chromatin was fragmented with HindIII, and generally higher when chromatin was fragmented in smaller segments. Additional DSG or EGS cross-linking reduced random ligation in experiments using DpnII or DdeI. We could not use this noise metric for experiments using MNase because MNase completely degrades the mitochondrial genome.
Fragment size and cross-linking affect compartment strength
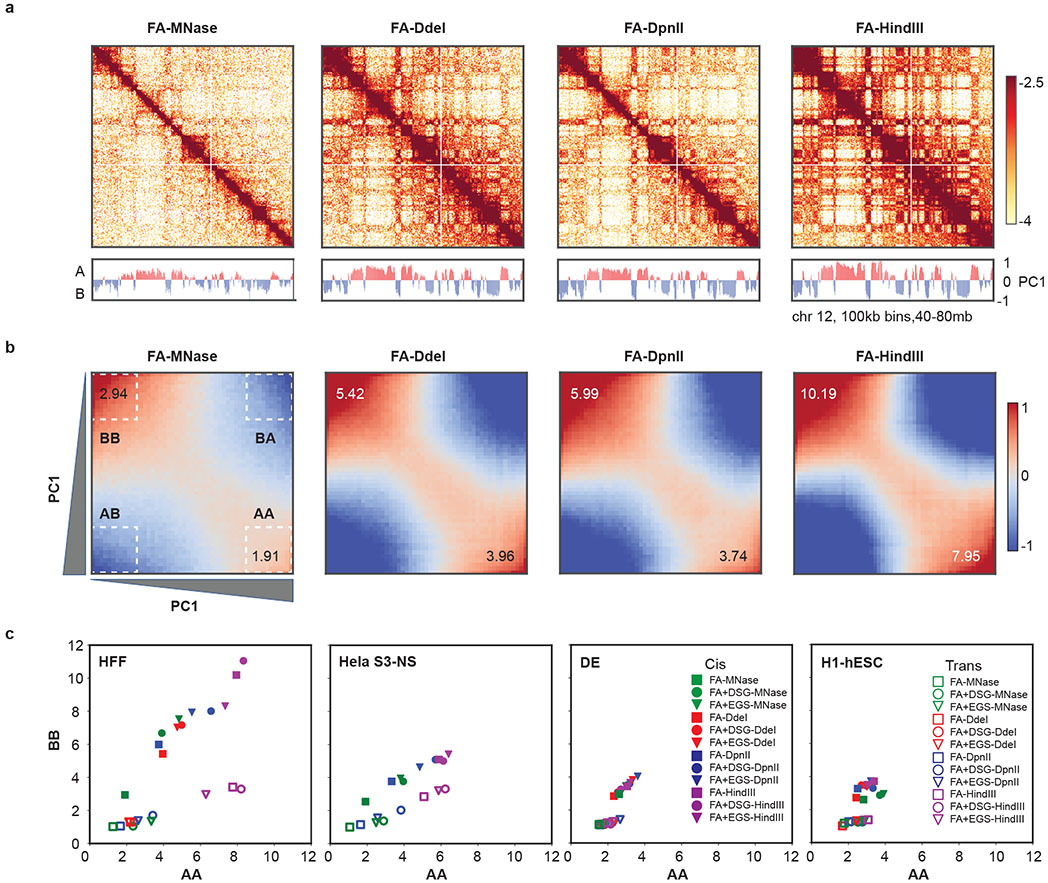
Visual inspection of interaction matrices (binned at 100 kb resolution) suggested that the contrast between the domains that make up the A and B compartments can vary between protocols. For instance, for HFF cells cross-linked with only FA, interaction matrices obtained with MNase digestion displayed a relatively weak compartment pattern, whereas those obtained with HindIII digestion showed much stronger patterns (Fig 3a).
Figure 3: Fragment size and cross-linking affect compartment strength.
a. Interactions (log transformed) for HFF obtained after cross-linking with FA only and digestion with MNase, DdeI, DpnII and HindIII, respectively. PC1 values of the genomic region are displayed below the figure.
b. Saddle plots of genome-wide interaction maps for data shown in Figure 3a. A-A and B-B compartment signals in cis get stronger with increasing fragment size.
c. Quantification of the compartment strength using saddle plots of cis and trans interactions for 12 protocols applied to HFF, 9 protocols to HeLa-S3 NS, 12 protocols to DE, 12 protocols to H1-hESC. Y-axis represents the strongest 20% of B-B; x-axis represents the strongest 20% of A-A interactions; B-B and A-A interactions are divided by the sum of corresponding A-B interactions.
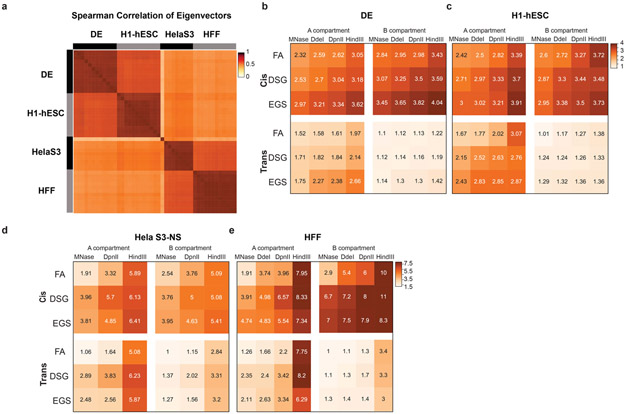
To investigate compartmentalization and determine the positions of A and B compartments, we used eigenvector decomposition (6, 14) for all cell states except for mitotic cells that do not display compartmentalized chromosomes (15). Correlation between compartment profiles of all experiments showed that the greatest difference in profiles can be attributed to cell type (Extended Data Figure 3a). Within each cell type, positions of compartment domains obtained with different protocols were highly similar (Spearman correlation >0.8; Extended Data Figure 3a).
Compartment strength analysis using saddle plots (Methods (14, 16, 17) revealed three important trends. First, protocols that generate larger fragments (e.g. using HindIII; Figure 3b, 3c) and protocols that include additional DSG or EGS cross-linking produced quantitatively stronger compartment patterns (Figure 3c; Extended Data Figure 3b-e) for all 4 cell types. Second, different cell types differed in compartment strength: HFF cells displayed the strongest compartment pattern, while H1-hESCs displayed weak compartments regardless of the protocol used. This could be related to differences in chromatin state and/or cell cycle distribution between the cell types. Third, compartment strength was much stronger in cis than in trans. Furthermore, some protocols, including the conventional Hi-C protocol (cross-linked with FA and digestion with DpnII) and MNase-based protocols (Micro-C, regardless of cross-linking protocol) did not detect enrichment of B-B interactions in trans (Extended Data Figure 3). Such preferred B-B interactions were detected only when Hi-C was performed with HindIII (Extended Data Figure 3d, 3e)). Additionally, trans preferential A-A interactions were more frequent than trans preferential B-B interactions for all protocols and cell types. In summary, compartment strength was stronger in both cis and trans, when protocols produce larger fragments or employ additional cross-linking.
Fragment size and cross-linking determine loop detection
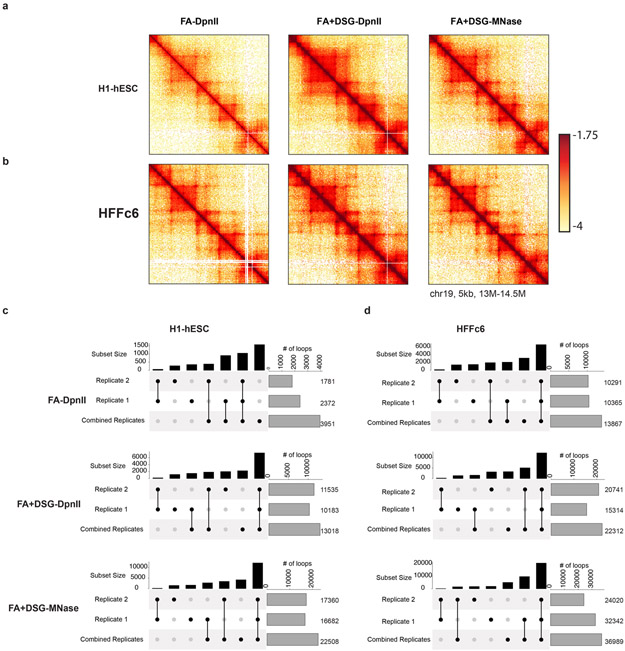
Of all structural Hi-C features, the detection of loops depends the most on sequencing depth. We applied 1) conventional Hi-C using FA and DpnII digestion (FA-DpnII); 2) Hi-C using DSG in addition to FA cross-linking and DpnII digestion (FA+DSG-DpnII); and 3) the standard Micro-C protocol (FA+DSG-MNase) to two cell types, H1-hESC and HFFc6, and sequenced these libraries to a depth of 2.4-3.9 billion valid interactions. HFFc6 is a subclone of HFF cells and is used by the 4D Nucleome Consortium (18). Interaction maps of data obtained from these “deep” datasets showed quantitative differences in interactions for both H1-hESC and HFFc6 (Extended Data Figure 4a-b). As compared to conventional Hi-C, the use of additional DSG cross-linking and finer fragmentation produced contact maps with more contrast and more pronounced focal enrichment of specific looping contacts. We reimplemented HICCUPS to identify looping interactions that appear as dots (3, 8) (Methods).
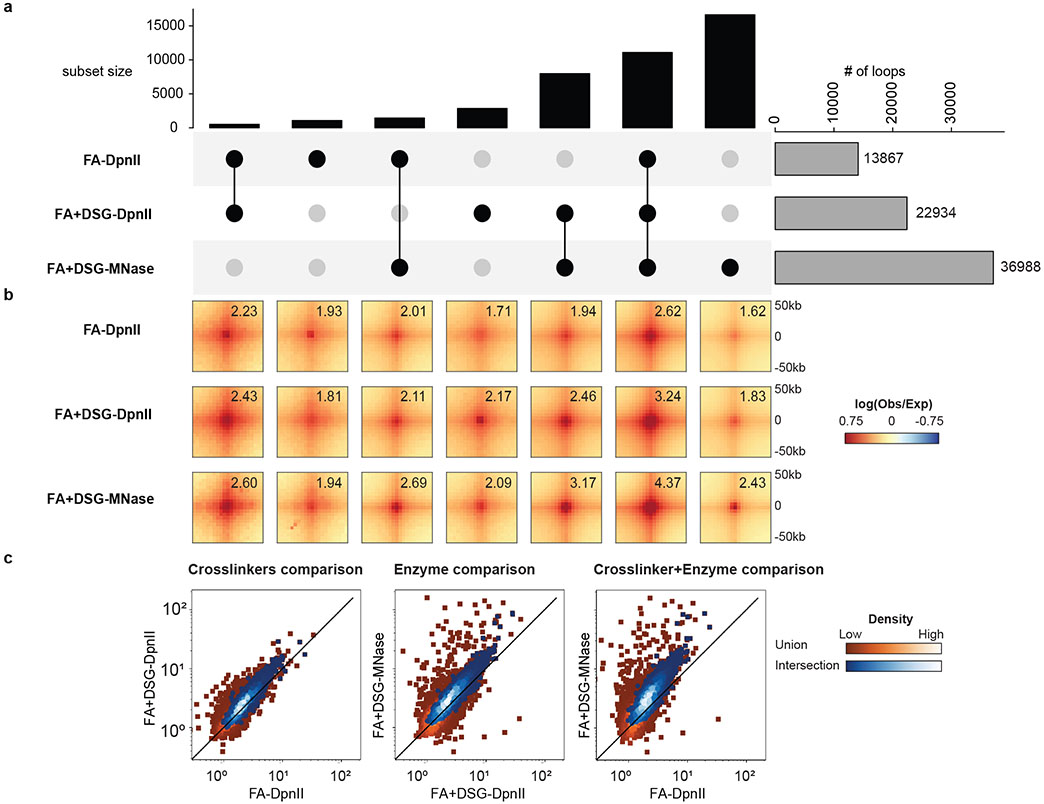
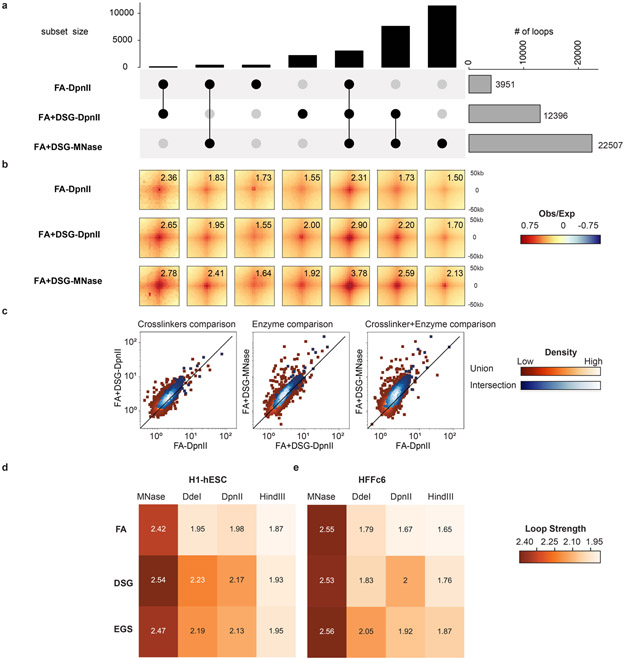
First, we compared the number of loops detected in individual and merged biological replicates for the deeply sequenced protocols. We observed that the number of loops detected with protocols that cross-link chromatin with only FA was more sensitive to sequencing depth and less consistent between replicates compared to the number of loops detected with protocols that cross-linked with FA+DSG (Extended Data Figure 4c, 4d). We used the lists of loops that were detected in merged replicates for subsequent analyses. In H1-hESCs we detected 3,951 loops with the FA-DpnII protocol, 12,396 loops with the FA+DSG-DpnII protocol, and 22,507 loops with the FA+DSG-MNase protocol (Extended Data Figure 5a). For HFFc6 these numbers were 13,867, 22,934 and 36,988 respectively (Figure 4a). To investigate the properties of detected loops, we compared loops that were called in individual or multiple protocols. While a large fraction of loops was detected by all three protocols, we found that the protocols with extra cross-linking and finer fragmentation (FA+DSG-MNase) detected a large set of additional loops (Fig. 4a).
Figure 4. Fragment size and cross-linking determine loop detection.
a. “Upset” plot of loops detected in protocols performed using HFFc6 shows the 1) total number of loops detected in FA-DpnII, FA+DSG-DpnII and FA+DSG-MNase on the right side (gray bars), 2) number of loops detected in one, two or three of these protocols shown in black bars. Loops found with one or multiple protocols are connected with black dots.
b. Pileups of the loops shown in Figure 4a. Numbers in each pileup represent signal enrichment at the loop compared to local background (Methods).
c. Scatter plots for strengths of individual loops calculated the same as in panel b between protocol pairs in HFFc6 cells. Plots display two sets of looping interactions - the union (red squares) and intersection (blue circles) sets from the three protocols. The color scale represents the density of loop interactions.
When we aggregated interaction data for the various subsets of loops, we observed a focal increase in interaction frequency for all subsets of loops for all datasets, even for data obtained with protocols where that subset of loops was not detected as significantly enriched (Figure 4b for HFFc6, Extended Data Figure 5b for H1-ESC). Quantifying the strength of the different subsets of loops detected by one or multiple protocols, we found that loops detected by all three protocols were the strongest, while loops detected only by the FA+DSG-MNase protocol were relatively weak.
We then defined a consensus set of loops that were detected in all datasets and used this set to analyze the data obtained with the matrix of 12 protocols described in Figure 1 that differ in cross-linking and fragmentation strategies. We observed a gradual increase in average loop strength with decreasing fragment size and after addition of DSG or EGS (Extended Data Figure 5d, 5e).
To explore this in another way, we quantified the strengths of each loop in the sets of consensus and union loops and found that the majority of loops were strengthened by additional DSG crosslinking (Figure 4c left panel) and by digestion with MNase as compared to DpnII (Figure 4c, middle). Loops were strongest when additional cross-linkers and fragmentation with MNase were applied (Figure 4c, right plot). A similar trend is also observed in HFFc6 cells (Extended Data Figure 5c). We conclude that the use of additional cross-linkers and enzymes that fragment chromatin in smaller fragments independently contribute to the loop detection and strength.
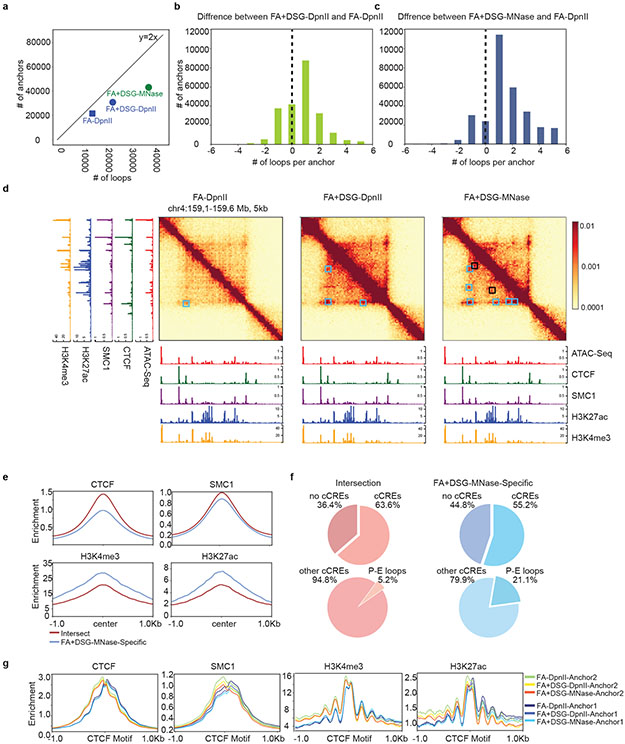
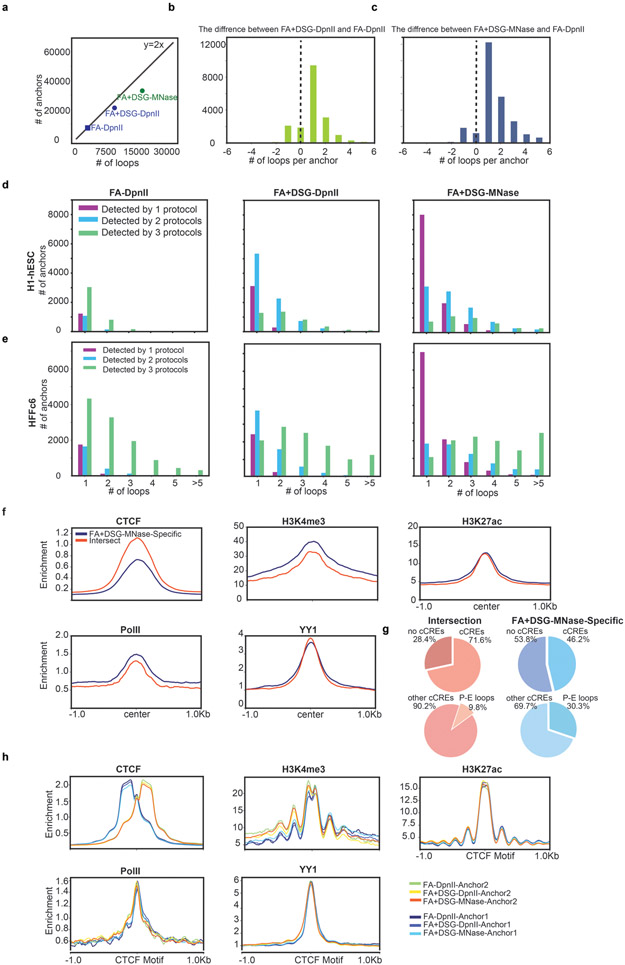
A looping interaction is defined by a pair of frequently interacting loci or anchors. When anchors engage in multiple looping interactions with other anchors, the number of anchors will be smaller than twofold the number of loops (5). We compared the number of anchors as a function of the number of loops detected in deeply sequenced datasets for HFFc6 cells (Figure 5a). We found that this relation is proportional for the FA-DpnII experiment with a ratio of two, but disproportionate for experiments with improved loop detection (FA-DSG-DpnII and FA-DSG-MNase). This suggests that many of the newly identified loops involved anchors that were also detected with FA-DpnII (Figure 5a, Extended Data Figure 6a). In other words, many additionally detected loops are arranged along stripes emanating from the same anchors.
Figure 5: Characterization of interactions and chromatin features of loop anchors.
a. Number of loops versus number of loop anchors in HFFc6. Expected relationship between anchor engaged in one loop: y=2x
b,c.FA-DpnII loops subtracted from FA+DSG-DpnII (b) or FA+DSG-MNase (c) loops detected at the same anchors. Union loops of the plotted protocols were used.
d. Interactions (linear scale) and Cut&Run/Cut&Tag signals for CTCF, SMC1, H3K4me3 and H3K27ac Loop anchors detected with all three protocols (Cyan squares) or only with FA+DSG-MNase (Black squares) (37).
e. CTCF, SMC1, H3K4me3 and H3K27ac enrichments at loop anchors detected by all protocols (intersection) or FA+DSG-MNase alone in HFFc6. Open chromatin regions within anchor coordinates were used to center average enrichments.
f. cCREs detected in common and FA+DSG-MNase specific loop anchors from Figure 5e (top) and stratified percentage of Promoter-Enhancer cCREs without CTCF enrichment (bottom).
g. Enrichment of CTCF, SMC1, H3K4me3 and H3K27ac separated between left (Anchor1) and right (Anchor 2) anchor for anchors detected in HFFc6 using FA-DpnII, FA+DSG-DpnII or FA+DSG-MNase.
To further investigate this we directly determined the number of loops that a given anchor is engaged in as detected by different protocols. For each anchor, we subtracted the number of loops detected by the FA-DpnII protocol from the number of loops detected using the FA+DSG-DpnII or the FA-DSG-MNase protocol. We found that using extra cross-linkers as well as finer fragmentation increased the number of detectable loops for most anchors (Figure 5b, 5c, Extended Data Figure 6b, 6c) in two ways: first, more loops are detected per anchor, and second, additional anchors are detected.
We split loop anchors into two categories: 1) anchors detected with more than 1 protocol and 2) anchors detected with only 1 protocol. We observed that anchors detected with at least 2 protocols were engaged in multiple loops (loop “valency” >1). In contrast, anchors that were detected with only 1 protocol mostly had a loop valency of 1 (Extended Data Figure 6d, 6e). Interestingly, for H1-ESCs the majority of additional loops detected with FA-DSG-MNase protocol (62%) involve two anchors not detected with other protocols. For HFFc6 this was only 21% indicating that most new loops shared at least one anchor with loops detected with other protocols.
We investigated factor binding (CTCF and cohesin (SMC1, YY1 and RNA polII) and chromatin state (H3K4Me3, H3K27Ac) at the two categories of loop anchors. We used previously published datasets (19, 20) and new data generated using a variety of techniques (Cut&Run (21), Cut&Tag (22), ChIP-Seq and ATAC-Seq (23)). Some loop anchors were detected with all protocols and in the example shown these correspond to sites bound by CTCF and cohesin (Figure 5d, cyan squares). Other loop anchors that were only detected with the FA-DSG-MNase protocol did not correspond to CTCF and cohesin bound sites, but were enriched in H3K27Ac and H3K4Me3 (black squares). Possibly, the ability of different protocols to detect various loop anchors is related to factor binding and chromatin state. To investigate this genome-wide we aggregated CTCF, SMC1, YY1, RNA PolII binding data and histone modification data (H3K4me3 and H3K27ac) at loop anchors detected with all protocols or with only FA-DSG-MNase (Figure 5e). Interestingly, in HFFc6 cells we found that FA+DSG-MNase-specific loop anchors were less enriched for CTCF and SMC1 but more enriched for H3K4me3 and H3K27ac compared to the loop anchors that were detected by all three protocols (Figure 5e, Extended Data Figure 6f).
Next, we examined the predicted cis-Regulatory elements (cCREs) that are located at shared loop anchors across the three deep datasets and at loop anchors detected only with the FA+DSG-MNase protocol. We used candidate cCRE predictions from ENCODE for H1-hESC and HFFc6 (24). We found that the majority of the shared anchors had cCREs but only a small part of these cCREs were predicted promoter or enhancer elements without CTCF site (5.2% for HFFc6, 9.8% for H1-ESC; Figure 5f, Extended Data Figure 6g). In contrast, half of the FA-DSG-MNase-specific anchors had predicted cCREs and for this subset the number of predicted promoter or enhancer elements without CTCF site is higher compared to loop anchors detected with all protocols (21% for HFFc6, 30% for H1-ESC; Figure 5f, Extended Data Figure 6g). FA+DSG-DpnII-specific loop anchors show similar enrichments as FA-DSG-MNase-specific anchors.
Finally, we compared the chromatin organization at CTCF-enriched loop anchors with respect to the orientation of the CTCF binding motif. Remarkably, using Cut&Tag or Cut&Run data we found an asymmetric distribution of signal for all factors (Figure 5g), including CTCF (Cut&Tag data). Both CTCF and cohesin signals were skewed towards the inside of the loop. We noted that the Cut&Tag data was generated with an antibody against the N-terminus of CTCF (Figure 5g). We also analyzed Cut&Run data that was generated with an antibody directed against the C-terminus of CTCF (Extended Data Figure 6h) and observed signal enrichment skewed at CTCF sites towards the outside of the loop. These observations are consistent with the orientation of CTCF binding to its motif and interactions between the N-terminus of CTCF with cohesin on the inside of the loop (25). The stronger enrichment of H3K4me3 and H3K27ac on the inside of the loop is intriguing, but the mechanism of this asymmetry is still unknown.
Insulation quantification is robust to experimental variations
Next we investigated chromatin insulation, i.e. the reduced interaction probability across domain boundaries (26-28). Loop anchors often form domain boundaries as they represent sites at which cohesin-mediated loop extrusion is blocked. To identify sites of insulation using the previously described insulation metric (29)
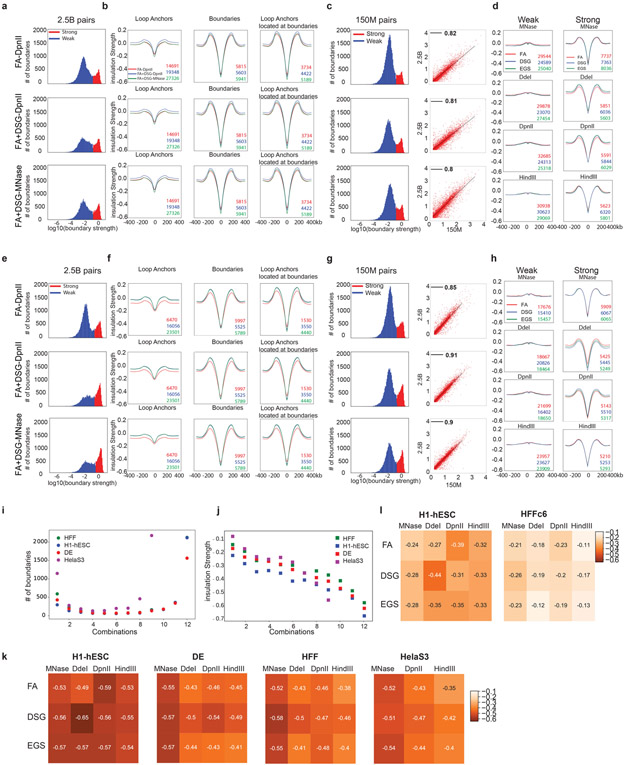
First, we compared the boundary strength as detected with the deep datasets obtained with the FA-DpnII, FA+DSG-DpnII and FA+DSG-MNase protocols in HFFc6. The distribution of the boundary strengths was bimodal: for each dataset we identified a relatively large set of very weak boundaries, and a smaller set of strong boundaries (Extended Data Figure 7a). Insulation at the weak boundaries was very small, and possibly noise (Extended Data Figure 7d). Focusing on the strong boundaries, we aggregated insulation profiles at 1) loop anchors detected with each of the three deep datasets, 2) strong boundaries and 3) loop anchors that are at strong boundaries (Extended Data Figure 7b). Insulation was very similar for each of the three deep datasets, indicating that the different protocols performed comparably in quantitative detection of strong insulation sites. In general, insulation at strong boundaries was stronger than at loop anchors, possibly because of our stringent threshold for boundary detection.
Second, we investigated whether insulation strength depends on sequencing depth. We compared two biological replicates, one with ~150 M interactions (matrix data, Extended Data Figure 7c) and the other with 2.5 billion interactions (deep data, Extended Data Figure 7a) for data obtained with the FA-DpnII, FA+DSG-DpnII and FA+DSG-MNase protocols. Deeper sequencing reduced the relative number of weak boundaries, suggesting these were due to noise. The majority (>85%) of strong boundaries are detected in both deep data and the less deeply sequenced data obtained with the matrix of 12 protocols, and the insulation scores of these shared strong boundaries were highly correlated across all datasets (r >0.80) (Extended Data Figure 7c).
Third, we investigated the number and the strength of the boundaries detected using data obtained with the matrix of 12 protocols for HFF, H1-hESC, DE cells and the 9 protocols for HeLa-S3. Insulation strength at boundaries detected with each protocol was very similar (Extended Data Figure 7d). We observed the same results for H1-hESC (Extended Data Figure 7e-h).
We found a positive correlation between boundary strength and the number of protocols that detected that boundary (Extended Data Figure 7i, 7j). Focusing on the set of boundaries that were detected by at least half of the protocols we then investigated how insulation varied for data obtained with the matrix of 12 protocols. We found that insulation strength was very similar for data obtained with all protocols (Extended Data Figure 7k). Similarly, we detected only minor variations in insulation when insulation was aggregated at the set of loop anchors detected by all three deep datasets using data obtained with the matrix of 12 protocols. In summary insulation detection and quantification was robust to variations in protocol (Extended Data Figure 7l).
Hi-C 3.0 detects both compartments and loops
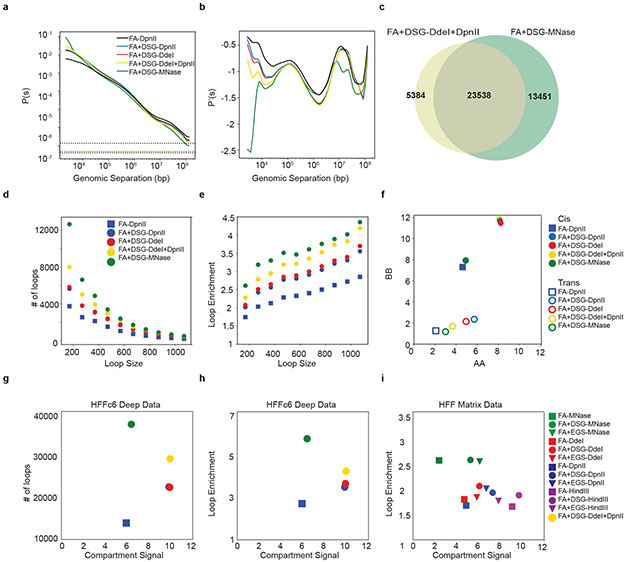
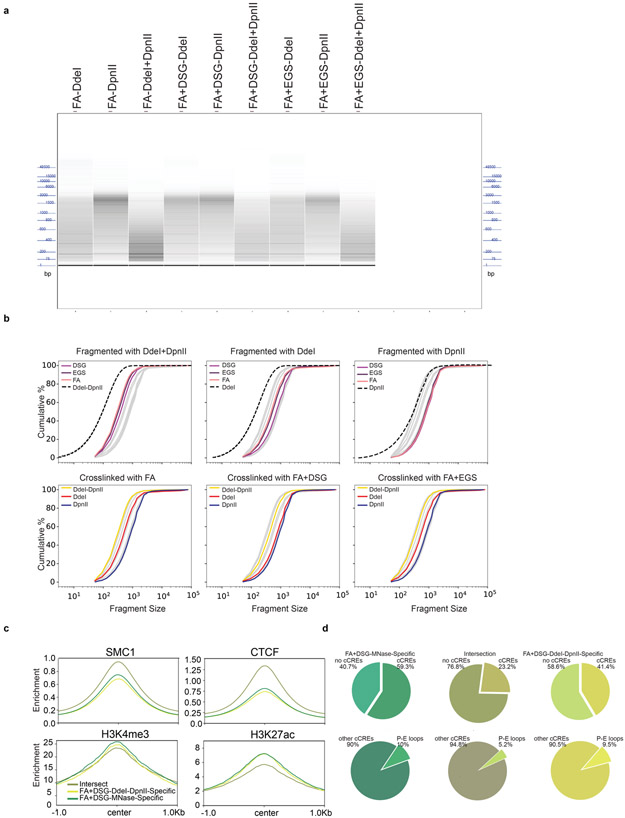
We showed that additional cross-linkers strengthen the compartment signal and loop enrichments. Additionally, compartments were strongest for experiments that have longer fragments and loops were better detected when the chromatin was fragmented into smaller fragments. We considered whether a single protocol could be designed to optimally capture both compartments and loops. We tested the effect of digestion with both DdeI and DpnII after cross-linking with FA+DSG (FA+DSG-DdeI+DpnII, referred to as “Hi-C 3.0”). We observed that using two enzymes further shortened the fragment size compared to individual enzyme digestion (Extended Data Figure 8a, 8b). Applying this protocol to HFFc6 cells, we generated two deeply sequenced biological replicates (3.3 billion valid interactions combined). For comparison, we also generated a dataset using only DdeI digestion (FA-DSG-DdeI; 2.7 billion valid interactions) in addition to the deeply sequenced libraries digested with only DpnII or MNase described above.
We found that the FA+DSG-DdeI+DpnII protocol affected the distance-dependent contact probability (Figure 6a). Compared to data obtained by single DdeI or DpnII digests, contacts increased for loci separated by less than 10 kb, making the results from this protocol more similar to results obtained with protocols using MNase digestion. Yet, longer distance contacts resembled data obtained with protocols using single restriction enzymes more than data obtained with protocols using MNase. Combined, this protocol improved short range signal without loss of long-range signal (Figure 6b).
Figure 6: Hi-C 3.0 detects both compartments and loops.
a. Distance dependent contact probability of interactions detected with 5 protocols in HFFc6 (trans percent is shown in dashed lines).
b. Derivative of the P(s) plots from panel a.
c. Overlapping loops between FA+DSG-DdeI+DpnII and FA+DSG-MNase.
d. Number of loops detected within 100kb intervals (loop size) starting at 70kb.
e. Loop strength of 1,000 loops sampled from 100 kb intervals (Figure 6d). When less than 1,000 loops were available, loop strengths for available loops were used.
f. A-A and B-B compartment strengths in cis and trans derived by saddle plot analysis.
g. Number of loops and compartment strength for 5 protocols applied to HFFc6.
h. Compartment strength compared to loop enrichment for 10,000 loops sampled from HFFc6 (2,000 loops were sampled from each protocol).
i. Compartment strength for 12 protocols applied to HFF compared to loop enrichment of 10,000 loops (panel h) using data from the same 12 protocols.
We found that the majority of the loops detected with FA+DSG-DdeI+DpnII overlapped with those detected with FA+DSG-MNase (Figure 6c). Loop anchors detected in both protocols had stronger CTCF and cohesin enrichment, whereas protocol-specific anchors (for both FA+DSG-DdeI+DpnII and FA+DSG-MNase) were more enriched for H3K4me3 and H3K27ac (Extended Data Figure 8c). Loop strength increased compared to data obtained with protocols that use a single restriction enzyme. We found ~6,000 more looping interactions than with either single DpnII or single DdeI digestion (Figure 6d). Furthermore, the average enrichment of contacts at these looping interactions was also higher for data obtained with the double digestion protocol. Nonetheless, the MNase library remained superior in detecting loops - both in number and in contact enrichment (Figure 6e). Importantly, when we investigated compartmental interactions we found that smaller restriction fragments did not result in a loss of quantitative detection of preferential compartmental interactions (Figure 6f). In addition, the FA+DSG-DdeI+DpnII double digest protocol allows for the efficient detection of both loops and compartments in a single protocol (Figure 6g-6h).
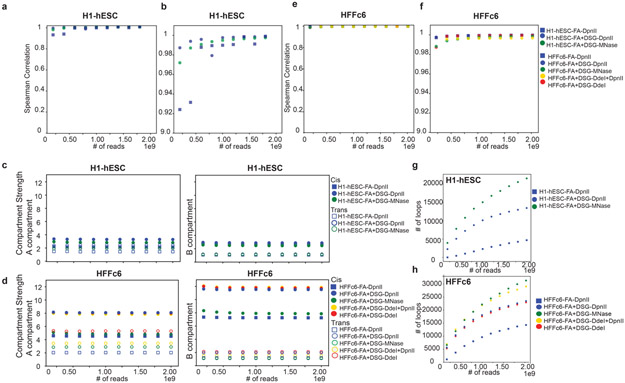
Finally, we tested how compartment strength and loop detection changes for various sequencing depths. We sampled experiments from H1-hESC and HFFc6 deep datasets and compared 10 experiments that have 200 Million reads to 2 Billion reads. First, we found that compartment identifications are comparable for all read depths (Spearman correlation > 0.9) (Extended Data Figure 9a,9b). Second, we observed that the compartment strength does not change for different read depths (Extended Data Figure 9c). Third, more loops are detected as the number of reads increases (Extended Data Figure 9d). Importantly, at all read depths, the number of detected loops increases with finer fragmentation and additional cross-linking.
Discussion
We observed fragmentation level and cross-linking chemistry influenced detection of chromatin loops and compartmentalization. Loop detection was improved when chromatin was cross-linked with additional (DSG) cross-linking and cut into small fragments. Loops detected with such protocols were more enriched for cis elements like enhancers and promoters as compared to sets of loops detected with conventional Hi-C. However, this comes at a cost of a reduced ability to quantitatively detect compartmentalization in cis and in trans. Quantification of compartmentalization improved with longer fragments such as those produced with DpnII in conventional Hi-C. Compartment strength improved with additional cross-linkers or when chromatin was digested with HindIII. We showed that Hi-C 3.0 using two restriction enzymes (DpnII and DdeI) and additional DSG cross-linking combined strengths of the MNase-based Micro-C protocol to detect loops and Hi-C protocols in detecting stronger compartments.
Fragmentation level and cross-linking chemistry determine assay performance by affecting the level of noise due to random ligation events in datasets (12). We find that smaller fragments result in more random ligation events possibly due to the low number of cross-links per fragment for small fragments, leading to a higher mobility and increased random ligations during the assay. Random ligation events diminish when additional cross-linking is used or when chromatin is fragmented into larger fragments. This results in a decrease in inter-chromosomal interactions and steeper P(s) plots. Improved signal to noise ratios allowed better detection of loops, compartments, and more bona fide inter-chromosomal interactions.
Detection of compartmentalization strength is improved when protocols are used that produce relatively long fragments and include additional cross-linking. Possibly, compartmental interactions are more difficult to capture than looping interactions that are closely held together by cohesin complexes. Recently, we found that interfaces between compartment domains appear relatively unmixed (30). Longer fragments or extra cross-linkers may be required to more efficiently capture contacts across these interfaces. Interestingly, cell type-specific differences in strength of compartmentalization are only observed with some protocols. Conventional Hi-C (FA+DpnII) suggests that compartmentalization strength is quite similar in H1-ESCs, HeLa-S3, DE cells and HFF. However, when Hi-C is performed with additional cross-linkers and/or with restriction enzymes that produce longer fragments, HFF and HeLa-S3 have stronger compartmentalization, while compartmentalization strength for H1-ESCs and DE are unaffected. This suggests that quantitative differences in cell type-specific chromosome organization can be missed or underestimated depending on the 3C-based protocol.
Insights into the influence of experimental parameters of chromatin interaction data led us to test a single Hi-C protocol (Hi-C 3.0), that can be used for better detection of both loops and compartments. Hi-C 3.0 produces shorter fragments than those in conventional Hi-C, but not as short as in the nucleosome-sized fragments in Micro-C. Hi-C 3.0 allows detection of thousands more loops compared to conventional Hi-C, and stronger compartmentalization than Micro-C. Depending on the objective of the study, investigators may choose different protocols: Micro-C for loop detection, or Hi-C 3.0 for detection of both loops and compartments. Hi-C 3.0 may be a good compromise protocol for many studies. Finally, we recommend always using FA+DSG (or EGS) cross-linking.
The deeply sequenced Hi-C, Micro-C and Hi-C 3.0 datasets we produced for H1-ESCs and HFFc6 cells will be useful resources for the chromosome folding community given that these cell lines are widely used for method benchmarking and analysis by the 4D nucleome project (18). Further, the comprehensive collection of chromatin interaction data generated with the matrix of twelve 3C-based protocol variants for each cell line can also be a valuable resource for benchmarking computational methods for data analysis given their different cross-linking distances and chemistry, fragment lengths and noise levels.
Data availability
Data is available at GEO under accession number GSE163666. Supplementary Table 1 lists datasets accessible through the 4DN data portal including 4DN accession numbers.
Methods
cLIMS: A Laboratory Information Management System for C-Data
cLims is a web-based lab information management system tailored for chromosome conformation capture experiments. It can be used to organize, store and export metadata of various experiment types such as HiC, 5C, ATAC-Seq, etc. The metadata organization is compatible with 4DN DCIC standards and data to cLIMS can be used to export 4DN DCIC and GEO systems with one click.
For the matrix project, we had increasing levels of detail in metadata, growing number of experiments, long time periods between data creation and submission and many people working on the same data sets, hence cLIMS helped us to keep this information properly maintained. The details included cell line, assay, treatments, sequencing, contributor’s information. This will also help us in reproducibility of experiments.
cLIMS has been developed using the Django web framework on the back-end and HTML5 and Javascript libraries on the front-end. It is running on PostgreSQL database and Apache web server and can be hosted on major Linux distributions.
Cell line culture and fixation
HFFc6
HFFc6 was cultured according to 4DN SOP (https://data.4dnucleome.org/biosources/4DNSRC6ZVYVP/). Cells were grown at 37°C under 5% CO2 in 75cm2 flasks containing Dulbeco’s Modified Eagle Medium (DMEM), supplemented with 20%, heat inactivated Fetal Bovine Serum (FBS). For sub-culture, cells were rinsed with 1x DPBS and detached using 0.05% trypsin at 37 °C for 2-3 minutes. Cells were typically split every 2-3 days at a 1:4 ratio and harvested while sub-confluent, ensuring they would not overgrow.
H1-hESC
Human Embryonic stem cells (H1 – WiCell, WA01, lot # WB35186) were cultured in mTeSR1 media (StemCell Technologies, 85850) under feeder-free conditions on Matrigel H1-hESC-qualified matrix (Corning, 354277, lot # 6011002) coated plates at 37°C and 5% CO2. H1 cells were daily fed with fresh mTeSR1 media and passaged every 4-5 days using ReLeSR reagent (StemCell Technologies, 05872). Cells were dissociated into single cells with TrypLE Express (Thermo Fisher, 12604013).
Fixation protocol
Final harvest of 5 million HFFc6 and H1-hESC cells was performed after washing twice with Hank’s Buffered Salt Solution (HBSS) before cross-linking in HBSS with 1% Formaldehyde for 10 minutes at room temperature. Formaldehyde was quenched with glycine (128 mM final concentration) at room temperature for 5 minutes and on ice for an additional 15 minutes. Cells were washed twice with DPBS before pelleting and flash freezing with liquid nitrogen into 5 million aliquots. Alternatively, formaldehyde fixed cells were centrifuged at 800xg and subjected to additional cross-linking with either 3mM Disuccinimidyl glutarate (DSG) or Ethylene glycol bis (succinimidylsuccinate) (EGS), freshly prepared and diluted from a 300mM stock in DMSO, for 40 minutes at room temperature. DSG and EGS cross-linked cells were both quenched with 0.4M glycine for 5 minutes and washed twice with DPBS, supplemented with 0.05% Bovine Serum Albumin, before flash freezing with liquid nitrogen into 5 million aliquots.
Hi-C protocol
Chromosome conformation capture was performed as described previously and we refer to Belaghzal et al. (31) for a step-by-step version similar to this protocol. The optimizations of crosslinkers are described above.
Micro-C-XL protocol
The Micro-C XL protocol was adopted from Hsieh et al. and Krietenstein et al. (7, 8).
Size range of chromatin fragments produced after digestion
Cells were cross-linked, lysed and digested as with the Hi-C protocol (see above). Then, cross-links were reversed and DNA was isolated as in Hi-C, but without ligation and biotin incorporation. DNA was loaded on an Advanced Analytical Fragment Analyzer (Agilent) for size range analysis and data was analyzed with PROsize3 software (Agilent). PROsize3 traces were exported separately as 4x8 bins (32 total) ranging from 40-500; 500-1300; 1300-8000 and 8000-100000 basepairs. Size ranges of potential restriction sites (hg38) were identified with cooltools genome digest (https://cooltools.readthedocs.io/en/latest/cli.html?highlight=enzyme#cooltools-genome-digest).
Cut&Tag protocol
Samples were processed as previously described in Kaya-Okur et.al. (22) , with few modifications. Briefly, approximately 100K cells per sample were permeabilized in the wash buffer (20 mM HEPES pH 7.5, 150 mM NaCl, 0.5 mM Spermidine, 1× Protease inhibitor cocktail) and then cells were coupled with activated concanavalin A-coated magnetic beads for 10 min at RT. Pelleted beads were resuspended in antibody buffer (Mix 8 μL 0.5 M EDTA and 6.7 μL 30% BSA with 2 mL Dig-wash buffer) with 1:100 dilution of SMC1 (Bethyl, cat# A300-055A) or CTCF antibody (Active motif, cat # 61311) and incubated overnight at 4 °C on a rotator. The next day, the pelleted bead complex was incubated with 1: 50 dilution of secondary antibody (guinea pig α-rabbit antibody, cat. # ABIN101961) in Dig-Wash buffer (20 mM HEPES pH 7.5, 150 mM NaCl, 0.5 mM Spermidine, 1× Protease inhibitor cocktail, 0.05% Digitonin) and incubated at RT for 30 min on rotator. After two washes in Dig-Wash buffer, 1:250 diluted pAG-Tn5 adapter complex in Dig-300 buffer (20 mM HEPES pH 7.5, 300 mM NaCl, 0.5 mM Spermidine, 1× Protease inhibitor cocktail, 0.05% Digitonin) were added to bead complex and incubated at RT for 1 hr. After two washes in Dig-300 buffer, beads were resuspended in 300 μL of Tagmentation buffer (20 mM HEPES pH 7.5, 300 mM NaCl, 0.5 mM Spermidine, 1× Protease inhibitor cocktail, 0.05% Digitonin,10 mM MgCl2) and incubated at 37 °C for 1 h 45 min. Samples were subjected to Proteinase K treatment and extracted tagmented DNA using Phenol:Chloroform:Isoamyl Alcohol (25:24:1). In preparation for Illumina sequencing, 21 μL DNA was mixed with 2 μL of a universal i5, 2 μL of a uniquely barcoded i7 primer, and 25 μL of NEBNext HiFi 2× PCR Master mix. The sample was placed in a thermocycler with a heated lid using the following cycling conditions: 72 °C for 5 min; 98 °C for 30 s; 14 cycles of 98 °C for 10 s and 63 °C for 30 s; final extension at 72 °C for 1 min and hold at 4 °C. Post-PCR clean-up was performed by adding 1.1× volume of Ampure XP beads and incubated for 15 min at RT, washed twice gently in 80% ethanol, and eluted in 30 μL 10 mM Tris pH 8.0. Final library samples were paired-end sequenced on Nextseq500.
Cut&Run Protocol
Cut&Run raw data (fastq files) of H1-hESC are downloaded from Janssens et al. 2018 (19) and raw files of HFFc6 are generated by Steve Henikoff Lab using Skene et al. 2017 protocol (21).
ATAC Seq Protocol
We have followed a published protocol to perform H1-hESC ATAC Seq experiments. The protocol details are described in Genga et al. 2019 (32).
ATAC-seq experiments on HFFc6 cells were performed following previously published protocol (Buenrostro, Wu, Chang, & Greenleaf, 2015) (23). Briefly, 50,000 cells per experiment were washed and lysed using a lysis buffer (0.1% NP-40, 10 mM Tris-HCl (pH 7.4), 10 mM NaCl and 3 mM MgCl2). Lysed cells were then transposed using the Nextera DNA library prep kit (Illumina #FC-121-1030) for 30 min at 37C, immediately followed by DNA collection using Qiagen MinElute columns (Qiagen #28004). Appropriate cycle numbers for amplification were determined for each sample individually using qPCR. Finally, primers were removed using AMpure XP beads (Beckman Coulter #A63881) prior to 2x50bp paired-end sequencing.
Data analysis
Chromosome capture data processing
Distiller (https://github.com/mirnylab/distiller-nf) pipeline is used to process Hi-C and Micro-C datasets. First, sequencing reads were mapped to hg38 using bwa mem with flags-SP. Second, mapped reads were parsed and classified using the pairtools package (https://github.com/mirnylab/pairtools) to get 4DN-compliant pairs files. PCR and/optical duplicates removed by matching the positions of aligned reads with 2bp flexibility. Next, pairs were filtered using mapping quality scores (MAPQ > 30) on each side of aligned chimeric reads, binned into multiple resolutions and low coverage bins were removed. Finally multiresolution cooler files were created using the cooler package (33) (https://github.com/mirnylab/cooler.git). We normalized contact matrices using the iterative correction procedure from Imakaev et al. 2012 (14). Interaction heatmaps were created using the “cooler show“ command from the cooler package.
Hicrep correlations
We used HiCRep to do distance corrected correlations (10) of the various protocols and cell states. Correlation is calculated in two steps. First, interaction maps are stratified by genomic distances and the correlation coefficients are calculated for each distance separately. Second, the reproducibility is determined by a novel stratum-adjusted correlation coefficient statistic (SCC) by aggregating stratum-specific correlation coefficients using a weighted average. We correlated 50kb binned individual chromosomes between protocols and averaged the correlations across all chromosomes.
Cis and Trans Ratio
Trans percent is calculated by dividing the total interactions between chromosomes with the sum of interactions within and between chromosomes (trans/cis+trans). Distance seperated cis interactions are calculated by dividing total interactions within specified distance of the chromosomes by the sum of interactions within and between chromosomes (cis of specific distance/cis+trans). Pairtools provides statistics for the numbers of interactions captured within and between chromosomes.
P(s) Plots
P(s) plots describe the decay of the average probability of contact between two regions on a chromosome as a function of the genomic separation between them.
As per best practices, scalings are typically computed for each chromosomal arm of the genome before being aggregated. In order to obtain the extent of each chromosomal arm, the sizes of the chromosomes and the positions of their associated centromeres must be obtained. The sizes of the chromosome were obtained using the fetch_chromsizes function that is found in the bioframe library (https://github.com/open2c/bioframe/blob/master/bioframe/io/resources.py#L61) and the starts and ends of the centromere were obtained from bioframe using fetch_centromeres (https://github.com/open2c/bioframe/blob/master/bioframe/io/resources.py#L109). The results of these two functions were combined to create a single list containing the extents of each chromosomal arm of the Human hg38 genome. For all libraries except those made from HeLa-S3 cells, all chromosome arms were used in the scaling calculation. For HeLa libraries we excluded the chromosomes with translocations and used only chromosomes 4, 14, 17, 18, 20, and 21.
We used the diagsum function from the cooltools library (https://github.com/open2c/cooltools/blob/master/cooltools/expected.py#L541) to calculate scaling. This function takes in a cooler, extracts the table of non-zero read counts across the genome (known as the pixel table) and calculates the sum of read counts based on its distance from the main diagonal. It also simultaneously calculates the total number of possible counts obtainable at a given distance (called valid pairs) based on masking of region due to balancing and other use provided criteria. Additionally, this function also has the ability of transforming the read-counts obtained from the pixel table before aggregating the result. This is done by passing the appropriate use defined function to the “transforms” parameter of diagsum.
To obtain the scaling plots shown in the manuscript, for each library, the diagsum function was applied on the 1kb cooler associated with the library. 1kb is the recommended resolution to calculate scalings as it allows us to observe variations at the finest scales. Along with the cooler, the chromosomal arms extents were also provided using the regions argument. A transform (named “balanced”) was also applied to the data to convert raw read-counts to balanced read-counts. This was done by multiplying the count value with the associated row and column weights obtained from balancing the cooler.
The resulting output is a single table with 4 relevant columns: 1) “region” which describes what chromosome arm a specific row was obtained from; 2) “diag” which refers to the genomic separation at which the data was aggregated; 3) “balanced.sum” which is the sum of read-counts for that given region and genomic separation after they were transformed by the “balanced” transform and 4) “n_valid” the number of possible valid pairs at a given distance (as described earlier). The individual column values were aggregated over the different arms and then further aggregated into logarithmically spaced bins of genomic separation. Finally, the “balanced.sum” column was divided by the “n_valid” column to create the “balanced.avg” column that is a measure of the average number of contacts across the genomic for a given genomic separation. The curves shown in the main text are the “balanced.avg” values plotted as a function of “diag” for the different libraries.
In addition to the interaction decay within a chromosome, interaction between different chromosomes can also be quantified. This is done using the “blocksum_asymm” function in cooltools (https://github.com/open2c/cooltools/blob/master/cooltools/expected.py#L820) which uses a very similar methodology. Two sets of regions are provided to blocksum_asymm and “balanced.sum” and “n_valid” is calculated for every pair of regions (entire chromosomes in this case). Since the interactions are between two chromosomes there is no notion of genomic separation between two regions. The “balanced.avg” is calculated in the same manner as above and the mean of this value is visualized as horizontal dashed lines in the main text figures.
Average slope of scaling
In order to magnify small variations between the different libraries, we calculated “derivative curves” from the scaling curves. Derivative curves represent the rate of change of scaling curves as observed on a log-log scale. These are computed by taking the log of scaling data (both x and y), calculating the finite difference measure of the slope and smoothing that value with a gaussian kernel. The smoothing function used is gaussian_filter1d from the scipy library (with a spread of 1). The smooth finite difference values can be plotted as a function of distance as is the case for Fig 6b. Alternatively, the average value of this derivative is calculated and correlated with other features (as in Fig 2c,d)
Genome Coverage Analysis
For genome wide coverage analysis, the mapped read pairs were split into two individual files and the read coverage at respective bins (genome-wide at 100 kb bins) were computed with bedtools coverage (v2.29.2) function. The read density was normalized to reads per million to compare between samples with different total read counts and subsequently by reads per 1 kb to compare between annotations with different bin sizes. The compartment associations were extracted from HindIII compartment calls using the respective cell types.
Compartment Analysis
We assessed compartments using eigenvector decomposition on observed-over-expected contact maps at 100kb resolution separated for each chromosomal arm using the cooltools package derived scripts. Eigenvector that has the strongest correlation with gene density is selected, then A and B compartments were assigned based on the gene density profiles such that A compartment has high gene density and B compartment has low gene density profile (14). Spearman correlation (Extended Data Figure 3a) was used to correlate the eigenvectors of different experiments performed with various protocols and cell states. Saddle plots were generated as follows: the interaction matrix of an experiment was sorted based on the eigenvector values from lowest to highest (B to A). Sorted maps were then normalized for their expected interaction frequencies; the upper left corner of the interaction matrix represents the strongest B-B interactions, lower right represents strongest A-A interactions, upper right and lower left are B-A and A-B respectively. To quantify saddle plots we took the strongest 20% of BB and strongest 20% of AA interactions and normalized them by the sum of AB and BA (top(AA)/(AB+BA) and top(BB)/(AB+BA)). Saddle quantifications were used to create the scatter plots in figure 3c and heatmaps in Extended Data Figure 3 that compare A and B compartments for all cell types. Both scatter plots and heatmaps in figure 3 and Extended Data Figure 3 were created using the Matplotlib package from Python.
Identification of chromatin loops
The cooltools call-dots function (https://github.com/open2c/cooltools/blob/master/cooltools/cli/call_dots.py ), a reimplementation of HICCUPS (3) was used to detect the chromatin loops that are reflected as dots in the interaction matrix. We used the following parameters to call the loops: fdr=0.1, diag_width=10000000, tile_size = 5000000, --max-nans-tolerated 4. We called dots in deep data at both 5kb and 10 kb resolutions, using MAPQ> 30 pairs and merged the results using the criteria mentioned in Rao et al. 2014 (3). Briefly, to merge 5kb and 10 kb loop calls, both the reproducible 5kb calls and unique 10 kb calls were kept. Unique 5kb calls were kept if the genomic separation of the region was <100kb or if the dots were particularly strong (i.e.more than 100 raw interactions per 5kb pixel). More detailed explanations for dot calling can be found in Rao et al. 2014 and Krietenstein et al. 2020 (3, 8).
Comparison of loops detected in different protocols
Bedtools intersect (34) was re-implemented to overlap 2D loops between protocols. Since loop calls are fundamentally 2 dimensional data, they need to be processed for use with bedtools (which operate on 1d data).
Each loop call consists of 6 coordinates: chrom1, start1, end1, chrom2, start2, end2. Since chrom1 is always the same as chrom2 for loop calls, we ignored these two columns and reduced our space to4 coordinates. Furthermore, to account for errors in the positioning of loop during the loop calling, we introduced the following margin of error around the called region (typically 10kb):
pos1 = (start1 + end1)/2; start1 = (pos1 - 5kb); end1 = (pos1 + 5kb)
pos2 = (start1 + end1)/2; start2 = (pos1 - 5kb); end2 = (pos2 + 5kb)
In order to overlap two lists, we performed 2 separate 1D overlaps with bedtools and then merged the results. To this end, every entry on each list is given a unique “loop ID.” Using bedtools overlap on each dimension of the loop list, we obtained a pair of loop IDs (one from each list) that were used to track which pairs of dots overlapped along both dimensions. Thus only pairs of dots with overlaps in both dimensions are merged and outputted.
Upset Plots
Upset plots were created for overlapping loops using the following R package: https://cran.r-project.org/web/packages/UpSetR/vignettes/basic.usage.html.
Quantification of chromatin loops
We created the loop pileups using notebooks from the hic-data-analysis-bootcamp notebook (https://github.com/hms-dbmi/hic-data-analysis-bootcamp/blob/master/notebooks/06_analysis_cooltools-snipping-pileups.ipynb). The pileups were done at 5kb resolution and with a 50kb extension on each side of the loop. To quantify the loop strength, first, we created an interaction matrix of 50x50 kb, centered around the loop. Then, we calculated the intensity of the loop by dividing the average of a 3x3 square in the middle of the interaction matrix by the average of its neighboring pixels; upper left, upper middle, upper right, lower left and right middle. See the image below:
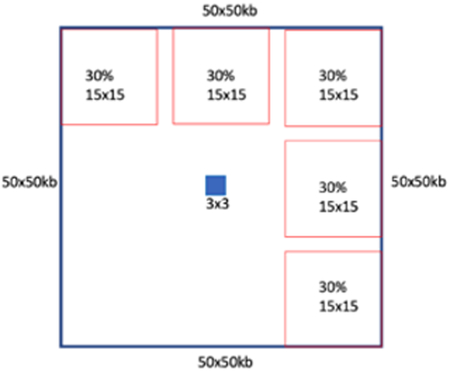
This quantification of loop enrichment using its local background was also done to identify the loops. These quantifications are shown in figure 4b-4c, Extended Data Figure 5b-e.
Anchor Analysis
We concatenated the genomic positions of the left and the right anchors for each loop to create a 1D anchor list for each deep dataset (FA-DpnII, FA+DSG-DpnII, FA+DSG-MNase) derived from both H1-hESC and HFFc6 cell lines.
We used BEDtools merge (34) with “--c 1 -o count “ parameters to remove redundant anchors (based on their genomic position) and to find the number of merged anchors in each genomic location. The number of merged anchors in a given genomic locus reflected loop valency at this anchor. Using BEDtools multiinter (https://bedtools.readthedocs.io/en/latest/content/overview.html) we identified the anchors that were shared in 1,2 or 3 protocols (Figure 5a-5b-5c and Extended Data Figure 6a-e).
Cut&Run, Cut&Tag and ChIP Seq Analysis
Cut&Run data (HFFc6 H3K4me3, HFFc6 H3K27ac, H1-hESC CTCF, H1-hESC H3K4me3, H1-hESC H3K27ac) was generated in the lab of Steve Henikoff and can be found on the 4DN Data Portal (https://data.4dnucleome.org/). Cut&Tag (HFFc6 CTCF, HFFc6 SMC1) data was generated in the lab of René Maehr at UMass Medical school. Finally, ChIP Seq data was downloaded from ENCODE. We processed raw fastq files for Cut&Run and Cut&Tag data and downloaded already processed bigwig and peak lists for ChIP Seq data. We mapped and processed the fastq files using nf-core ATAC Seq (35) pipelines. BWA was used for mapping the fastq files to the hg38 reference genome; MACS2 (with default parameters) was used to find the enriched peaks and BEDtools intersect was subsequently used to identify the loop anchors from these enriched peaks.
We found the intersected anchors between the three protocols (FA-DpnII, FA+DSG-DpnII, FA+DSG-MNase) and the FA+DSG-MNase specific anchors using bedtools intersect. We extracted the open chromatin (ATAC Seq peaks) regions located at these anchors and then aggregated the average signal enrichments of CTCF, SMC1, H3K4me3, H3K27ac, YY1 and RNA PolII. Deeptools was used to create the enrichment profiles in Figure 5e and Extended Data Figure 6f (36). We downloaded the lists of candidate Cis Regulatory Elements (cCREs) for H1-hESC and HFFc6 from ENCODE (24) and overlapped these cCREs with the intersected anchor list and the FA+DSG-MNase anchor list, again using BEDtools intersect. Finally separated them based on the cCRE categories.
To compare the anchor specific enrichments shown in Fig 5g and Extended Data Figure 6h, we used the loop lists of FA-DpnII, FA+DSG-DpnII and FA+DSG-MNase. We identified enriched convergent CTCF sites located at these loop anchors and compared the enrichments of CTCF, SMC1, H3K4me3, H3K27ac, YY1 and RNA PolII per anchor. To obtain convergent CTCF sites, we selected Anchor 1 (left anchor) to overlap with CTCF sites that had a “+” orientation and a CTCF peak and Anchor 2 (right anchor) to overlap with CTCF sites that had a “−” orientation. We plotted convergent CTCF sites located at Anchor 1 and Anchor 2 for FA-DpnII, FA+DSG-DpnII and FA+DSG-MNase in both HFFc6 and H1-hESC (Figure 5f and Extended Data Figure 6h).
For HFFc6, we used Cut&Tag data generated with an antibody against the N-terminus of CTCF. For H1-hESC cells, we used Cut&Run data generated with an antibody against the C-terminus of CTCF. Since CTCF motifs are known to locate at the N-terminus of the CTCF protein (25), the orientation of the CTCF enrichments differed between the data sets from Cut&Tag and Cut&Run.
Insulation Score
We calculated diamond insulation scores using cooltools ( https://github.com/open2c/cooltools/blob/master/cooltools/cli/diamond_insulation.py ) as implemented from Crane et al. (29) We defined the insulation and boundary strengths of each 10 kb bin by detecting the local minima of 10 kb binned data with a 200kb window size. We used cooltools’s diamond-insulation function with these parameters: “ --ignore-diags 2, --window-pixels 20”. We separated weak and strong boundaries using the mean insulation score of each protocol ( i.e.: weak boundaries < mean < strong boundaries). Since diamond insulation pipelines cannot differentiate between compartment boundaries and insulation boundaries we manually removed the compartment boundaries before any further analysis. Therefore the depth in local minima here is a result of strong insulation strength not a compartment switch. Next, we aggregated the insulation strength of the deep datasets at loop anchors, strong boundaries and loop anchors located at the strong boundaries using scripts from the hic-data-analysis-bootcamp notebook ( https://github.com/hms-dbmi/hic-data-analysis-bootcamp/blob/master/notebooks/06_analysis_cooltools-snipping-pileups.ipynb). For both deep and matrix data we used only strong boundaries for further analysis since they reflected the true boundaries across protocols. Since the position of insulation boundaries was often offset by one or two bins between protocols, we extended the boundary bin by 10 kb on each side (30 kb total) in each protocol. We then used bedtools multiinter (https://bedtools.readthedocs.io/en/latest/content/overview.html) to count the boundaries that were found in one or more protocols within the cell type. We defined our stringent boundary list as the boundaries that were shared in at least 50% of the matrix protocols within each cell type and used these boundary lists for further comparisons. In heatmaps, we used the average insulation strength of these boundaries per protocol (Extended Data Figure 7k). To create the heatmaps in Extended Data Figure 7l, we used the loop anchors that were shared between the 3 protocols that were deeply sequenced: FA+DpnII, FA+DSG-DpnII and FA+DSG-MNase in both H1-hESC and HFFc6.
Loop quantification for specific genomic separations
To quantify the loop strengths for HFFc6 deep datasets described in Fig 6d (FA-DpnII, FA+DSG-DpnII, FA+DSG-DdeI, FA+DSG-DdeI-DpnII, FA+DSG-MNase), first, we seperated the loops based on their genomic separations into 100 kb bins, starting from 70kb (i.e. 70-170-kb, 170-270kb,…970-1070 kb), because 70kb was the smallest detectable loop size and then plotted the number of loops detected in each distance interval (Fig. 6d). Since the number of detected loops in these genomic separations was different for each library, we sampled 1,000 loops for each distance from FA+DSG-DdeI-DpnII to quantify loop enrichments of the 5 libraries (Fig. 6e). If the number of loops at a specified distance was smaller than 1000 we use the entire loop set at this distance.
Finally, to create Fig. 6h and Fig. 6i we sampled 2,000 loops from each HFFc6 deep dataset, (FA-DpnII, FA+DSG-DpnII, FA+DSG-DdeI, FA+DSG-DdeI-DpnII, FA+DSG-MNase), combined them and then quantified the loop strength of the total 10,000 loops in these deep datasets (Fig. 6h) and in matrix datasets described in Fig. 1a (Fig. 6i). Loop enrichments were quantified as described in the “Quantification of chromatin loops” section.
Sampling Experiment
We combined two biological replicates for the deep datasets obtained with each of the protocols. We then sampled 10 experiments with different numbers of interactions (valid pairs): 200 Million reads, 400 M, …1800M, 2B reads. For each sample we then called and quantified compartment strength, and loops exactly as described above.
Extended Data
Extended Data Fig. 1. DNA fragmentation and clustering of correlation (HiCRep).
a,b. Cumulative distribution of the lengths of fragmented DNA obtained from fragment analyzer data in HFF cells stratified for different cross-linkers (a) and restriction enzymes (b). Gray lines indicate all datasets, colored lines indicate data obtained with the indicated nuclease/cross-linkers.
c-g. Hierarchical clustering of HiCRep correlations for: all protocols comparing cell states (c), synchronized HeLa-S3 G1 cells (dark green) and non-synchronized HeLa-S3 cells (light green) (d), synchronized HeLa-S3 mitotic cells (e), H1-hESC and H1-hESC derived DE cells (f), 12 protocols applied to HFF cells (g). One color key is indicated for all of the heatmaps.
h. Genome coverage of data generated using MNase, DdeI, DpnII and HindIII. The read density was normalized to reads per million, separated by the coverage in A and B compartments (Methods).
Extended Data Fig. 2. Cis and trans contact frequency differ between protocols.
a. The number of valid pairs in each of the 12 protocols applied to H1-hESC, DE, HeLa-S3-NS, HeLa-S3-G1 and HeLa-S3-M cells partitioned by genomic distances.
b. Distance dependent contact probability of 12 protocols ordered as in (a), partitioned by fragmenting nucleases used (gray lines indicate all datasets, colored lines indicate datasets generated with the nucleases indicated for each plot).
c. The relationship between the trans percent and the average slope of the distance dependent contact probability for the 12 protocols ordered as in Extended Data Fig. 2a.
d. Quantification of protocol introduced noise as defined by inter-mitochondrial interactions (chrM with chr1-22), normalized by intra-mitochondrial (chrM with chrM) interactions.
Extended Data Fig. 3. Quantitative compartment detection differ between protocols.
a. Hierarchical clustering of Spearman correlations of Eigenvectors (PC1) for 63 protocols. Clustering shows strong correlations between compartments from data obtained with varying protocols applied to the same cell types and weaker correlations for data obtained with the same protocols applied to different cell types.
b-e. A-A and B-B compartment strength of saddle plots for fixation versus enzyme stratified by cell state: DE (b), H1-hESC (c), HeLa-S3-NS (d), HFF (e). For each cell type, saddle plot quantification was done for cis and trans reads separately.
Extended Data Fig. 4. FA+DSG cross-linking produces reproducible chromatin loops.
a. Interaction heatmaps (log transformed) of experiments for H1-ESC cells obtained from the following cross-linker-enzyme combinations (from left to right): FA-DpnII, FA+DSG-DpnII and FA+DSG-MNase.
b. Interaction heatmaps of protocols specified in Extended Data Fig. 4a for HFFc6 cells.
c. Upset plots of loops detected with different replicates for H1-hESC show: 1) total number of loops detected in Replicate 1, Replicate 2 and merged replicates on the right side (gray bars), 2) number of loops detected in the one, two or three experiments shown in black bars. Loops found with only one or multiple experiments are highlighted and connected with black dots. Here Upset plots investigate the consistency of loops between each of the replicates and combined replicates for FA-DpnII, FA+DSG-DpnII and FA+DSG-MNase in H1-hESC.
d. Upset plots (as explained in Extended Data Fig. 4c) of loops detected with different replicates for HFFc6 cells.
Extended Data Fig. 5. Fine fragmentation and DSG cross-linking improves loop detection.
a. Loops for HFFc6 shows the 1) total number of loops detected with FA-DpnII, FA+DSG-DpnII and FA+DSG-MNase(gray bars, right side), 2) number of overlapping loops detected (black bars). Overlapping loops are connected with black dots.
b. Pileups of the loops from Figure 4a. Numbers represent signal enrichment over local background (Methods).
c. Individual loop strength (as in panel b) between protocol pairs in HFFc6. Protocols (left to right): FA-DpnII v/s FA+DSG-DpnII, FA+DSG-DpnII v/s FA+DSG-MNase and FA-DpnII v/s FA+DSG-MNase. Plots display two sets of looping interactions - Union (red squares) and Intersection (blue circles) from the three protocols. Color scale represents density of loop interactions.
d,e. Aggregated loop strengths of intersection loop set from matrix of 12 protocols (described in Fig 1a) for H1-hESC (d), and HFFc6 (e).
Extended Data Fig. 6. Finer fragments lead to detection of Promoter-Enhancer loops.
a. H1-hESC loops versus loop anchors. Expected for anchors in one loop: y=2x
b,c. FA-DpnII loops subtracted from FA+DSG-DpnII (b) or FA+DSG-MNase (c) Union of loops detected at the same anchors.
d,e. Valencies of loop anchors for H1-hESC (d), HFFc6 (e) from FA-DpnII, FA+DSG-DpnII, FA+DSG-MNase. FA-DpnII is used as a guiding example. Categories are: anchors from 1 protocol (FA-DpnII), anchors from 2 protocols (FA-DpnII and either FA+DSG-DpnII or FA+DSG-MNase) and anchors from all 3 protocols.
f. CTCF, SMC1, H3K4me3 and H3K27ac enrichments at loop anchors for all protocols (intersection) or FA+DSG-MNase alone in H1-hESC.Average enrichments centered on open chromatin regions within anchor coordinates.
g. Top: cCREs from common and FA+DSG-MNase specific loop anchors (Extended Data Figure 5f). Bottom: stratified percentage of Promoter-Enhancer cCREs without CTCF enrichment.
h. Enrichment of CTCF, SMC1, H3K4me3 and H3K27ac for left (Anchor1) and right (Anchor 2) anchor in H1-hESC using FA-DpnII, FA+DSG-DpnII or FA+DSG-MNase.
Extended Data Fig. 7. Insulation quantification is robust to experimental variations.
a-d. Rows: HFFc6 deep data from FA-DpnII (top), FA+DSG-DpnII (middle) and FA+DSG-MNase (bottom). Columns: boundary strength distributions with strength threshold (a) (Methods), pileups in FA-DpnII, FA+DSG-DpnII and FA+DSG-MNase for aggregate insulation scores at loop anchors (left), strong insulation boundaries (middle) and loop anchors colocalizing with strong insulation boundaries (right) (b). Left panel: boundary strength distribution of matrix data (Fig. 1a) for FA-DpnII, FA+DSG-DpnII and FA+DSG-MNase. Right panel:correlation of strong boundaries between deep and matrix data for FA-DpnII, FA+DSG-DpnII and FA+DSG-MNase (c). Aggregate insulation profile of weak and strong boundaries from matrix data for HFFc6 for cross-linkers and nucleases (d).
e-h. H1-hESC data displayed like Extended Data Fig. 7a-d.
i. Number of boundaries (y-axis) stratified by number of protocols (1 to 12; see fig.1a) wherein a given boundary was detected (x-axis).
j. Insulation strength of boundaries stratified as in (i).
k. Mean insulation strength for boundaries detected in at least half of protocols for variouscross-linkers and enzyme combinations of H1-hESC, DE, HFF and HeLa-S3-NS (Methods).
l. Mean insulation strength of loop anchors detected in all three deep protocols for both HFFc6 and H1-hESC, averaged for 12 protocols of H1-hESC and HFF.
Extended Data Fig. 8. Hi-C 3.0 performs similar to Micro-C.
a. Fragment size distributions from Fragment Analyzer for specified protocols.
b. Cumulative distributions of fragmented DNA in HFF cells stratified for cross-linking agents (top row) or restriction enzymes (bottom row). Dashed lines in each of the panels represent expected fragment size distribution from in silico digestion of hg38 for enzymes indicated. Gray lines represent all data from all other enzymes (columns).
c. Comparison of CTCF, SMC1, H3K4me3 and H3K27ac enrichments at loop anchors centered at open chromatin regions. Open chromatin regions (ATAC Seq) located within the anchor coordinates were used to center the average enrichments. Anchors were separated into sets detected by FA+DSG-DdeI+DpnII, FA+DSG-MNase or both.
d. Percentage of cCREs and promoter-enhancer elements located at loop anchors specific to FA+DSG-DdeI+DpnII, FA+DSG-MNase or shared between them.
Extended Data Fig. 9. Sequencing depth impact loop detection but not compartmentalization.
a. Spearman correlation of the eigenvectors for different sequencing depths in H1-hESC. Each point represents one sampled experiment. X-axis shows the sequencing depth (200M reads-2B reads) and the y-axis shows the correlation of the eigenvectors for each depth with the eigenvector of the experiment with 2 Billion reads. The bottom plot shows the zoomed correlations.
b. Compartment strength of A compartment for experiments with different read depths quantified in cis and trans for H1-hESC.
c. Compartment strength of B compartment for experiments with different read depths quantified in cis and trans for H1-hESC.
d. # of loops detected in experiments with different read depths in H1-hESC.
e-f. Analysis that is shown in a-d repeated for experiments performed in HFFc6 cells.
Supplementary Material
Mapping stats of all experiments used in this study
Source Data Fig. 2 Data points of cis/trans ratio, scaling plots and P(s) average slope for HFF.
Source Data Fig. 3 Compartment strength of all protocols
Source Data Fig. 4 Loop strength of intersection and union loop lists
Source Data Fig. 5 Loop and anchor relationship, Protocol specific and shared loop anchor lists.
Source Data Fig. 6 Data points of compartment strength and loop strength including Hi-C 3.0.
Source Data Extended Data Fig. 1 Fragment size distributions for cumulative plot and HiCRep correlations.
Source Data Extended Data Fig. 2 Data points of cis/trans ratio, scaling plots, P(s) average slope and mitochondrial interactions for all cell types.
Source Data Extended Data Fig. 3 Compartment strength of all protocols, First Eigen vector correlations and coverages data points.
Source Data Extended Data Fig. 5 Loop strength of intersection and union loop lists
Source Data Extended Data Fig. 6 Loop and anchor relationship, Protocol specific and shared loop anchor lists.
Source Data Extended Data Fig. 7 # of commonly detected insulation boundaries and the strength of these boundaries.
Source Data Extended Data Fig. 8 Fragment size distributions for cumulative plot including Hi-C 3.0.
Source Data Extended Data Fig. 9 Spearman correlation of First EigenVectors, compartment strengths and # of detected loops for sampled experiments.
Acknowledgements
This work was supported by a grant from the National Institutes of Health Common Fund 4D Nucleome Program to J.D. and L.A.M (U54-DK107980), a grant from the National Human Genome Research Institute (NHGRI) to J.D. (HG003143). J.D. is an investigator of the Howard Hughes Medical Institute. N.K. was supported by Human Frontiers Science Program (HFSP) grant LT000631/2017-L. We thank Drs. Stephen Henikoff and Derek Janssens for sharing Cut&Run data.
Footnotes
Competing Interests Statement
The authors declare no competing interests.
Code availability
Scripts and notebooks that are used in this manuscripts are located here: https://github.com/dekkerlab/matrix_paper
References
- 1.Dekker J, Rippe K, Dekker M, Kleckner N. Capturing Chromosome Conformation. Science. 2002;295(5558):1306–11. doi: 10.1126/science.1067799. [DOI] [PubMed] [Google Scholar]
- 2.Denker A, de Laat W. The second decade of 3C technologies: detailed insights into nuclear organization. Genes Dev. 2016;30(12):1357–82. Epub 2016/06/25. doi: 10.1101/gad.281964.116. PubMed PMID: 27340173; PMCID: PMC4926860. [DOI] [PMC free article] [PubMed] [Google Scholar]
- 3.Rao SS, Huntley MH, Durand NC, Stamenova EK, Bochkov ID, Robinson JT, Sanborn AL, Machol I, Omer AD, Lander ES, Aiden EL. A 3D map of the human genome at kilobase resolution reveals principles of chromatin looping. Cell. 2014;159(7):1665–80. Epub 2014/12/17. doi: 10.1016/j.cell.2014.11.021. PubMed PMID: 25497547; PMCID: PMC5635824. [DOI] [PMC free article] [PubMed] [Google Scholar]
- 4.Kagey MH, Newman JJ, Bilodeau S, Zhan Y, Orlando DA, van Berkum NL, Ebmeier CC, Goossens J, Rahl PB, Levine SS, Taatjes DJ, Dekker J, Young RA. Mediator and cohesin connect gene expression and chromatin architecture. Nature. 2010;467(7314):430–5. doi: 10.1038/nature09380. [DOI] [PMC free article] [PubMed] [Google Scholar]
- 5.Fudenberg G, Imakaev M, Lu C, Goloborodko A, Abdennur N, Mirny LA. Formation of Chromosomal Domains by Loop Extrusion. Cell Rep. 2016;15(9):2038–49. Epub 2016/05/24. doi: 10.1016/j.celrep.2016.04.085. PubMed PMID: 27210764; PMCID: PMC4889513. [DOI] [PMC free article] [PubMed] [Google Scholar]
- 6.Lieberman-Aiden E, van Berkum NL, Williams L, Imakaev M, Ragoczy T, Telling A, Amit I, Lajoie BR, Sabo PJ, Dorschner MO, Sandstrom R, Bernstein B, Bender MA, Groudine M, Gnirke A, Stamatoyannopoulos J, Mirny LA, Lander ES, Dekker J. Comprehensive mapping of long-range interactions reveals folding principles of the human genome. Science. 2009;326(5950):289–93. Epub 2009/10/10. doi: 10.1126/science.1181369. PubMed PMID: 19815776; PMCID: PMC2858594. [DOI] [PMC free article] [PubMed] [Google Scholar]
- 7.Hsieh TS, Fudenberg G, Goloborodko A, Rando OJ. Micro-C XL: assaying chromosome conformation from the nucleosome to the entire genome. Nat Methods. 2016;13(12):1009–11. Epub 2016/11/01. doi: 10.1038/nmeth.4025. PubMed PMID: 27723753. [DOI] [PubMed] [Google Scholar]
- 8.Krietenstein N, Abraham S, Venev SV, Abdennur N, Gibcus J, Hsieh TS, Parsi KM, Yang L, Maehr R, Mirny LA, Dekker J, Rando OJ. Ultrastructural Details of Mammalian Chromosome Architecture. Mol Cell. 2020;78(3):554–65 e7. Epub 2020/03/28. doi: 10.1016/j.molcel.2020.03.003. PubMed PMID: 32213324; PMCID: PMC7222625. [DOI] [PMC free article] [PubMed] [Google Scholar]
- 9.Hsieh TS, Cattoglio C, Slobodyanyuk E, Hansen AS, Rando OJ, Tjian R, Darzacq X. Resolving the 3D Landscape of Transcription-Linked Mammalian Chromatin Folding. Mol Cell. 2020;78(3):539–53.e8. Epub 2020/03/28. doi: 10.1016/j.molcel.2020.03.002. PubMed PMID: 32213323; PMCID: PMC7703524. [DOI] [PMC free article] [PubMed] [Google Scholar]
- 10.Yang T, Zhang F, Yardımcı GG, Song F, Hardison RC, Noble WS, Yue F, Li Q. HiCRep: assessing the reproducibility of Hi-C data using a stratum-adjusted correlation coefficient. Genome Res. 2017;27(11):1939–49. Epub 2017/09/01. doi: 10.1101/gr.220640.117. PubMed PMID: 28855260; PMCID: PMC5668950. [DOI] [PMC free article] [PubMed] [Google Scholar]
- 11.Yardimci GG, Ozadam H, Sauria MEG, Ursu O, Yan KK, Yang T, Chakraborty A, Kaul A, Lajoie BR, Song F, Zhan Y, Ay F, Gerstein M, Kundaje A, Li Q, Taylor J, Yue F, Dekker J, Noble WS. Measuring the reproducibility and quality of Hi-C data. Genome Biol. 2019;20(1):57. Epub 2019/03/21. doi: 10.1186/s13059-019-1658-7. PubMed PMID: 30890172; PMCID: PMC6423771. [DOI] [PMC free article] [PubMed] [Google Scholar]
- 12.Lajoie BR, Dekker J, Kaplan N. The Hitchhiker's guide to Hi-C analysis: practical guidelines. Methods. 2015;72:65–75. Epub 2014/12/03. doi: 10.1016/j.ymeth.2014.10.031. PubMed PMID: 25448293; PMCID: PMC4347522. [DOI] [PMC free article] [PubMed] [Google Scholar]
- 13.Schmitt AD, Hu M, Ren B. Genome-wide mapping and analysis of chromosome architecture. Nat Rev Mol Cell Biol. 2016;17(12):743–55. Epub 2016/11/04. doi: 10.1038/nrm.2016.104. PubMed PMID: 27580841; PMCID: PMC5763923. [DOI] [PMC free article] [PubMed] [Google Scholar]
- 14.Imakaev M, Fudenberg G, McCord RP, Naumova N, Goloborodko A, Lajoie BR, Dekker J, Mirny LA. Iterative correction of Hi-C data reveals hallmarks of chromosome organization. Nat Methods. 2012;9(10):999–1003. Epub 2012/09/04. doi: 10.1038/nmeth.2148. PubMed PMID: 22941365; PMCID: PMC3816492. [DOI] [PMC free article] [PubMed] [Google Scholar]
- 15.Naumova N, Imakaev M, Fudenberg G, Zhan Y, Lajoie BR, Mirny LA, Dekker J. Organization of the mitotic chromosome. Science. 2013;342(6161):948–53. Epub 2013/11/10. doi: 10.1126/science.1236083. PubMed PMID: 24200812; PMCID: PMC4040465. [DOI] [PMC free article] [PubMed] [Google Scholar]
- 16.Nora EP, Goloborodko A, Valton AL, Gibcus JH, Uebersohn A, Abdennur N, Dekker J, Mirny LA, Bruneau BG. Targeted Degradation of CTCF Decouples Local Insulation of Chromosome Domains from Genomic Compartmentalization. Cell. 2017;169(5):930–44 e22. Epub 2017/05/20. doi: 10.1016/j.cell.2017.05.004. PubMed PMID: 28525758; PMCID: PMC5538188. [DOI] [PMC free article] [PubMed] [Google Scholar]
- 17.Schwarzer W, Abdennur N, Goloborodko A, Pekowska A, Fudenberg G, Loe-Mie Y, Fonseca NA, Huber W, Haering CH, Mirny L, Spitz F. Two independent modes of chromatin organization revealed by cohesin removal. Nature. 2017;551(7678):51–6. Epub 2017/11/03. doi: 10.1038/nature24281. PubMed PMID: 29094699; PMCID: PMC5687303. [DOI] [PMC free article] [PubMed] [Google Scholar]
- 18.Dekker J, Belmont AS, Guttman M, Leshyk VO, Lis JT, Lomvardas S, Mirny LA, O'Shea CC, Park PJ, Ren B, Politz JCR, Shendure J, Zhong S, Network DN. The 4D nucleome project. Nature. 2017;549(7671):219–26. Epub 2017/09/15. doi: 10.1038/nature23884. PubMed PMID: 28905911; PMCID: PMC5617335. [DOI] [PMC free article] [PubMed] [Google Scholar]
- 19.Janssens DH, Wu SJ, Sarthy JF, Meers MP, Myers CH, Olson JM, Ahmad K, Henikoff S. Automated in situ chromatin profiling efficiently resolves cell types and gene regulatory programs. Epigenetics Chromatin. 2018;11(1):74. Epub 2018/12/24. doi: 10.1186/s13072-018-0243-8. PubMed PMID: 30577869; PMCID: PMC6302505. [DOI] [PMC free article] [PubMed] [Google Scholar]
- 20.Zhang J, Lee D, Dhiman V, Jiang P, Xu J, McGillivray P, Yang H, Liu J, Meyerson W, Clarke D, Gu M, Li S, Lou S, Xu J, Lochovsky L, Ung M, Ma L, Yu S, Cao Q, Harmanci A, Yan K-K, Sethi A, Gürsoy G, Schoenberg MR, Rozowsky J, Warrell J, Emani P, Yang YT, Galeev T, Kong X, Liu S, Li X, Krishnan J, Feng Y, Rivera-Mulia JC, Adrian J, Broach JR, Bolt M, Moran J, Fitzgerald D, Dileep V, Liu T, Mei S, Sasaki T, Trevilla-Garcia C, Wang S, Wang Y, Zang C, Wang D, Klein RJ, Snyder M, Gilbert DM, Yip K, Cheng C, Yue F, Liu XS, White KP, Gerstein M. An integrative ENCODE resource for cancer genomics. Nature Communications. 2020;11(1):3696. doi: 10.1038/s41467-020-14743-w. [DOI] [PMC free article] [PubMed] [Google Scholar]
- 21.Skene PJ, Henikoff S. An efficient targeted nuclease strategy for high-resolution mapping of DNA binding sites. Elife. 2017;6. Epub 2017/01/13. doi: 10.7554/eLife.21856. PubMed PMID: 28079019; PMCID: PMC5310842. [DOI] [PMC free article] [PubMed] [Google Scholar]
- 22.Kaya-Okur HS, Wu SJ, Codomo CA, Pledger ES, Bryson TD, Henikoff JG, Ahmad K, Henikoff S. CUT&Tag for efficient epigenomic profiling of small samples and single cells. Nature Communications. 2019;10(1):1930. doi: 10.1038/s41467-019-09982-5. [DOI] [PMC free article] [PubMed] [Google Scholar]
- 23.Buenrostro JD, Giresi PG, Zaba LC, Chang HY, Greenleaf WJ. Transposition of native chromatin for fast and sensitive epigenomic profiling of open chromatin, DNA-binding proteins and nucleosome position. Nat Methods. 2013;10(12):1213–8. Epub 2013/10/08. doi: 10.1038/nmeth.2688. PubMed PMID: 24097267; PMCID: PMC3959825. [DOI] [PMC free article] [PubMed] [Google Scholar]
- 24.Consortium EP, Moore JE, Purcaro MJ, Pratt HE, Epstein CB, Shoresh N, Adrian J, Kawli T, Davis CA, Dobin A, Kaul R, Halow J, Van Nostrand EL, Freese P, Gorkin DU, Shen Y, He Y, Mackiewicz M, Pauli-Behn F, Williams BA, Mortazavi A, Keller CA, Zhang XO, Elhajjajy SI, Huey J, Dickel DE, Snetkova V, Wei X, Wang X, Rivera-Mulia JC, Rozowsky J, Zhang J, Chhetri SB, Zhang J, Victorsen A, White KP, Visel A, Yeo GW, Burge CB, Lecuyer E, Gilbert DM, Dekker J, Rinn J, Mendenhall EM, Ecker JR, Kellis M, Klein RJ, Noble WS, Kundaje A, Guigo R, Farnham PJ, Cherry JM, Myers RM, Ren B, Graveley BR, Gerstein MB, Pennacchio LA, Snyder MP, Bernstein BE, Wold B, Hardison RC, Gingeras TR, Stamatoyannopoulos JA, Weng Z. Expanded encyclopaedias of DNA elements in the human and mouse genomes. Nature. 2020;583(7818):699–710. Epub 2020/07/31. doi: 10.1038/s41586-020-2493-4. PubMed PMID: 32728249; PMCID: PMC7410828. [DOI] [PMC free article] [PubMed] [Google Scholar]
- 25.Li Y, Haarhuis JHI, Sedeno Cacciatore A, Oldenkamp R, van Ruiten MS, Willems L, Teunissen H, Muir KW, de Wit E, Rowland BD, Panne D. The structural basis for cohesin-CTCF-anchored loops. Nature. 2020;578(7795):472–6. Epub 2020/01/07. doi: 10.1038/s41586-019-1910-z. PubMed PMID: 31905366; PMCID: PMC7035113. [DOI] [PMC free article] [PubMed] [Google Scholar]
- 26.Hou C, Li L, Qin Zhaohui S, Corces Victor G. Gene Density, Transcription, and Insulators Contribute to the Partition of the Drosophila Genome into Physical Domains. Molecular Cell. 2012;48(3):471–84. doi: 10.1016/j.molcel.2012.08.031. [DOI] [PMC free article] [PubMed] [Google Scholar]
- 27.Dixon JR, Selvaraj S, Yue F, Kim A, Li Y, Shen Y, Hu M, Liu JS, Ren B. Topological domains in mammalian genomes identified by analysis of chromatin interactions. Nature. 2012;485(7398):376–80. Epub 2012/04/13. doi: 10.1038/nature11082. PubMed PMID: 22495300; PMCID: PMC3356448. [DOI] [PMC free article] [PubMed] [Google Scholar]
- 28.Nora EP, Lajoie BR, Schulz EG, Giorgetti L, Okamoto I, Servant N, Piolot T, van Berkum NL, Meisig J, Sedat J, Gribnau J, Barillot E, Bluthgen N, Dekker J, Heard E. Spatial partitioning of the regulatory landscape of the X-inactivation centre. Nature. 2012;485(7398):381–5. Epub 2012/04/13. doi: 10.1038/nature11049. PubMed PMID: 22495304; PMCID: PMC3555144. [DOI] [PMC free article] [PubMed] [Google Scholar]
- 29.Crane E, Bian Q, McCord RP, Lajoie BR, Wheeler BS, Ralston EJ, Uzawa S, Dekker J, Meyer BJ. Condensin-driven remodelling of X chromosome topology during dosage compensation. Nature. 2015;523(7559):240–4. Epub 2015/06/02. doi: 10.1038/nature14450. PubMed PMID: 26030525; PMCID: PMC4498965. [DOI] [PMC free article] [PubMed] [Google Scholar]
- 30.Tavares-Cadete F, Norouzi D, Dekker B, Liu Y, Dekker J. Multi-contact 3C reveals that the human genome during interphase is largely not entangled. Nat Struct Mol Biol. 2020. Epub 2020/09/16. doi: 10.1038/s41594-020-0506-5. PubMed PMID: 32929283. [DOI] [PMC free article] [PubMed] [Google Scholar]
- 31.Belaghzal H, Dekker J, Gibcus JH. Hi-C 2.0: An optimized Hi-C procedure for high-resolution genome-wide mapping of chromosome conformation. Methods. 2017;123:56–65. Epub 2017/04/25. doi: 10.1016/j.ymeth.2017.04.004. PubMed PMID: 28435001; PMCID: PMC5522765. [DOI] [PMC free article] [PubMed] [Google Scholar]
- 32.Genga RMJ, Kernfeld EM, Parsi KM, Parsons TJ, Ziller MJ, Maehr R. Single-Cell RNA-Sequencing-Based CRISPRi Screening Resolves Molecular Drivers of Early Human Endoderm Development. Cell Rep. 2019;27(3):708–18.e10. Epub 2019/04/18. doi: 10.1016/j.celrep.2019.03.076. PubMed PMID: 30995470; PMCID: PMC6525305. [DOI] [PMC free article] [PubMed] [Google Scholar]
- 33.Abdennur N, Mirny LA. Cooler: scalable storage for Hi-C data and other genomically labeled arrays. Bioinformatics. 2020;36(1):311–6. doi: 10.1093/bioinformatics/btz540. [DOI] [PMC free article] [PubMed] [Google Scholar]
- 34.Quinlan AR, Hall IM. BEDTools: a flexible suite of utilities for comparing genomic features. Bioinformatics. 2010;26(6):841–2. Epub 2010/01/30. doi: 10.1093/bioinformatics/btq033. PubMed PMID: 20110278; PMCID: PMC2832824. [DOI] [PMC free article] [PubMed] [Google Scholar]
- 35.Ewels PA, Peltzer A, Fillinger S, Patel H, Alneberg J, Wilm A, Garcia MU, Di Tommaso P, Nahnsen S. The nf-core framework for community-curated bioinformatics pipelines. Nat Biotechnol. 2020;38(3):276–8. Epub 2020/02/15. doi: 10.1038/s41587-020-0439-x. PubMed PMID: 32055031. [DOI] [PubMed] [Google Scholar]
- 36.Ramírez F, Ryan DP, Grüning B, Bhardwaj V, Kilpert F, Richter AS, Heyne S, Dündar F, Manke T. deepTools2: a next generation web server for deep-sequencing data analysis. Nucleic Acids Res. 2016;44(W1):W160–5. Epub 2016/04/16. doi: 10.1093/nar/gkw257. PubMed PMID: 27079975; PMCID: PMC4987876. [DOI] [PMC free article] [PubMed] [Google Scholar]
- 37.Kerpedjiev P, Abdennur N, Lekschas F, McCallum C, Dinkla K, Strobelt H, Luber JM, Ouellette SB, Azhir A, Kumar N, Hwang J, Lee S, Alver BH, Pfister H, Mirny LA, Park PJ, Gehlenborg N. HiGlass: web-based visual exploration and analysis of genome interaction maps. Genome Biology. 2018;19(1):125. doi: 10.1186/s13059-018-1486-1. [DOI] [PMC free article] [PubMed] [Google Scholar]
Associated Data
This section collects any data citations, data availability statements, or supplementary materials included in this article.
Supplementary Materials
Mapping stats of all experiments used in this study
Source Data Fig. 2 Data points of cis/trans ratio, scaling plots and P(s) average slope for HFF.
Source Data Fig. 3 Compartment strength of all protocols
Source Data Fig. 4 Loop strength of intersection and union loop lists
Source Data Fig. 5 Loop and anchor relationship, Protocol specific and shared loop anchor lists.
Source Data Fig. 6 Data points of compartment strength and loop strength including Hi-C 3.0.
Source Data Extended Data Fig. 1 Fragment size distributions for cumulative plot and HiCRep correlations.
Source Data Extended Data Fig. 2 Data points of cis/trans ratio, scaling plots, P(s) average slope and mitochondrial interactions for all cell types.
Source Data Extended Data Fig. 3 Compartment strength of all protocols, First Eigen vector correlations and coverages data points.
Source Data Extended Data Fig. 5 Loop strength of intersection and union loop lists
Source Data Extended Data Fig. 6 Loop and anchor relationship, Protocol specific and shared loop anchor lists.
Source Data Extended Data Fig. 7 # of commonly detected insulation boundaries and the strength of these boundaries.
Source Data Extended Data Fig. 8 Fragment size distributions for cumulative plot including Hi-C 3.0.
Source Data Extended Data Fig. 9 Spearman correlation of First EigenVectors, compartment strengths and # of detected loops for sampled experiments.
Data Availability Statement
Data is available at GEO under accession number GSE163666. Supplementary Table 1 lists datasets accessible through the 4DN data portal including 4DN accession numbers.


