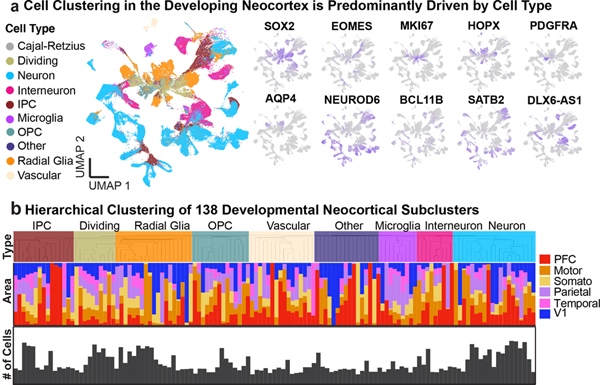
Figure 2. Cell Types in the Developing Human Neocortex Across Cortical Areas.
a) Single-cells from the neocortex represented in UMAP space. Cells in the left-most UMAP plot are color-coded by cell type/state annotation. Feature plots on the right depict the expression pattern of major cell population markers (SOX2 – radial glia, EOMES – IPC, MKI67 – dividing cells, HOPX – outer radial glia, PDGFRA – OPC/Oligodendrocyte, AQP4 – astrocytes, BCL11B – deep layer excitatory neurons, SATB2 – supererficial layer excitatory neurons, NEUROD6 – broad excitatory neurons, DLX6-AS1 – inhibitory neurons). b) Hierarchical clustering of 138 neocortical clusters based on the Pearson correlations of cluster marker expression profiles across all neocortical stages sampled. Branches are color-coded by the major cell type assigned to each cluster group. Histograms below show the fraction of cells from each area contributing to a cluster. Bottom bar chart shows the relative number of cells in each cluster (log2-transformed numbers,0 to 20).

