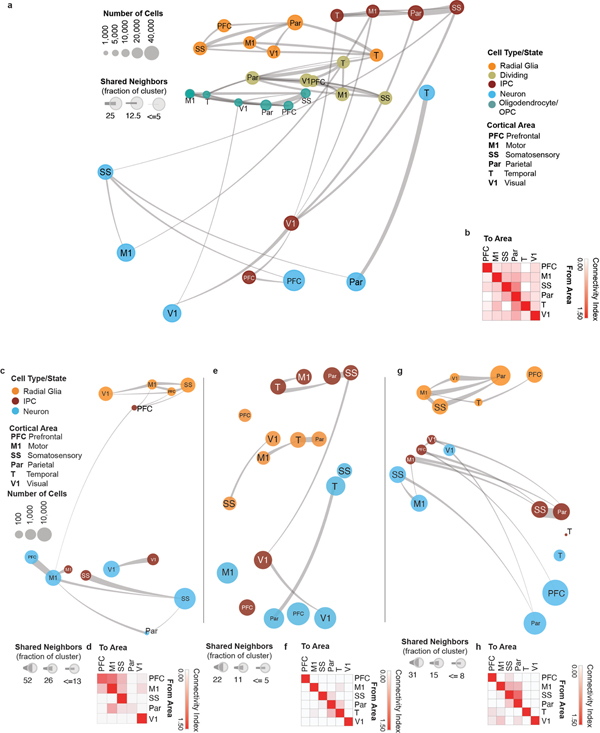
Extended Data Figure 4. Constellation plots cell types and developmental stages.
a) Constellation plots of excitatory lineage and oligodendrocyte lineage cell grouped by type and cortical area highlight similarities between groups of frontal and occipital cortical areas. Each dot is scaled proportionally to the number of cells represented by that analysis. The thickness of the connecting line on each end represents the fraction of cells within each group with neighbors in connected groups. Dot color represents cell type while text over the dot marks cortical area. b) Quantification of the constellation plots, with ‘towards area’ in columns and ‘from area’ in rows. The connectivity index from white to red integrates the number of connections between two cell types as well as the average fraction of cells from each cluster contributing to each connection. c) Constellation plots of excitatory lineage grouped by cortical area within early (GW14 – GW17) samples. d) Quantification of the early constellation plots. e) Constellation plots of excitatory lineage grouped by cortical area within mid-stage (GW18 – GW20) samples. f) Quantification of the mid-stage constellation plots. g) Constellation plots of excitatory lineage grouped by cortical area within late-stage (GW18 – GW20) samples. h) Quantification of the late-stage constellation plots.

