

Abstract
Objective
Gastric bypass surgery results in long-term weight loss. Small studies have examined protein changes during rapid weight loss (up to 1 or 2 years post-surgery). This study tested if short-term changes were maintained after 12 years.
Methods
A 12-year follow-up, protein-wide association study of 1297 SomaLogic aptamer-based plasma proteins compared short- (2-year) and long-term (12-year) protein changes in 234 subjects who had gastric bypass surgery to 144 non-intervened subjects with severe obesity.
Results
There were 51 replicated 12-year protein changes that differed between the surgery and non-surgery groups. Adjusting for change in BMI, only 12 proteins remained significant, suggesting that BMI change was the primary reason for most protein changes and not nonBMI-related surgical effects. Protein changes were related to BMI changes during both weight-loss and weight-regain periods. The significant proteins were associated primarily with lipid, uric acid or resting energy expenditure clinical variables and metabolic pathways. Eight protein changes were associated with 12-year diabetes remission, including ApoM, SHBG, and adiponectin (p<3.5X10⁻⁵).
Conclusions
This study showed that most short-term post-surgical changes in proteins were maintained at 12 years. Systemic protection pathways, including inflammation, complement, lipid and adipocyte pathways were related to the long-term benefits of gastric bypass surgery.
Keywords: weight loss, proteomics, longitudinal study, gastric bypass surgery, lipids
Introduction
Bariatric surgery results in significant, sustained weight loss in most patients. The surgery also improves most cardiovascular risk factors, including blood pressure, diabetes, dyslipidemia, fatty liver disease, inflammation and health-related quality of life (1–4). Total mortality and cardiovascular mortality are reduced by 40% and 56%, respectively (5). Where voluntary, non-surgical weight loss is difficult to maintain over the long term (6), surgical weight loss is generally maintained long term, and as such, may provide an efficient way of identifying proteins and protein pathways contributing to improved health outcomes induced by bariatric surgery or weight loss in general.
Short-term studies of 1 or 2 years (i.e., the nadir of maximum weight loss (7)) have suggested plasma proteins significantly changing after bariatric surgery (8–11), but it is unknown which protein changes are durable long term. Long-term assessment is important because short-term post-surgery changes in many proteins may be due to the invasive nature of the surgery itself and the dramatic first year post-surgery weight loss, expected to affect many related physiological systems. However, once weight has stabilized and modest weight regain progresses, the underlying short-term benefits of the protein changes may disappear if these proteins return to near pre-surgical levels. Identification of proteins that remain changed long-term may help identify biological pathways responsible for disease reduction. Therefore, a proteome-wide association study (PWAS) was conducted to test for significant differences in 12-year changes in 1297 plasma protein levels between 234 subjects with severe obesity who had gastric bypass surgery and a non-intervened group of 144 subjects with severe obesity. Protein changes were also related to significant changes in disease risk factors.
Methods
A longitudinal, controlled study of the risks and benefits of Roux-en-Y gastric bypass surgery was begun in 2000. After a baseline exam (exam 1), additional exams were conducted at the University of Utah at approximately 2 years (exam 2), 6 years (exam 3) and 12 years (exam 4) (3,12,13). Follow-up of major clinical variables was over 90% at exam 4, although only 67% had their blood drawn at the University of Utah and could provide a sample for proteomic measurements. Of the 67% returning subjects, a subset of the subjects was selected who either had gastric bypass surgery after the baseline exam or who never had bariatric surgery during follow-up. The non-surgery group did not have study-related intervention during the follow-up period, and even though mean weight did not change, there was a wide variation in weight change in this group over the 12 years. An initial subset of 203 subjects (137 surgery and 68 non-surgery) was used as a discovery set, and a second subset of 175 subjects (97 surgery and 78 non-surgery) was used for replication. In addition to plasma protein measurements at baseline and 12-years, proteins were measured at the 2-year follow-up (exam 2) for 204 of the 234 subjects who had gastric bypass surgery. Proteins from exam 3 were not measured. All subjects provided written informed consent and the study was approved by the University of Utah Institutional Review Board.
Clinical Measurements
The clinical measurements shown in Table 1 were measured or calculated as previously described (3,12–14). Fat free mass (FFM) and fat mass (FM) were measured by bioimpedance. Resting energy expenditure (REE) was measured after an overnight fast by indirect calorimetry (TrueOne 2400, ParvoMedics, Sandy, UT, (12)). Clinical biochemistries were obtained after an overnight fast. Diabetes remission at 12 years in subjects with baseline diabetes (DMREM), diabetes incidence in subjects without baseline non-diabetes (DMINC) and 10-year risk of coronary heart disease (CHD) by the Framingham Risk Score (FRS) were derived. So that the FRS represented change in CHD risk only due to changes in the clinical variables and not age, age at exam 4 was used in both the baseline and 12-year follow-up risk equations. Diabetes was defined as a fasting glucose of 126 mg/dl or greater or being on antidiabetic medication. Blood pressure, lipids, and diabetes-related variables that are affected by antihypertensive, antidiabetic or lipid medications were adjusted prior to analysis, as described previously (3). Briefly, subjects taking medications for each condition had their values changed to the sex-specific means of untreated subjects with the condition. Analysis with and without medication adjustment were performed.
Table 1.
Discovery and replication subject subset characteristics and winsorized variable means and standard deviations
| Variable | Discovery | Replication | |||||
|---|---|---|---|---|---|---|---|
| Groups | Surgery (n=137) | Non-Surgery (n=66) | All (n=203) | Surgery (n=97) | Non-Surgery (n=78) | All (n=175) | |
| Gender (M) | 20% | 12% | 17% | 12% | 11% | 12% | |
| Age (Exam 1, y) | 46.4 ± 10.5 | 47.1 ± 11 | 46.6 ± 10.9 | 40.1 ± 10 | 43.9 ± 12.3 | 41.8 ± 11.2 | |
| BMI (Exam 1, kg/m2) | 46.4 ± 7.1 | 44.6 ± 6.4 | 45.8 ± 6.9 | 46.1 ± 6.4 | 45.3 ± 7.5 | 45.8 ± 6.9 | |
| BMI (Exam 2, kg/m2) (n=204) | 29.7 ± 5.5 (n=137) | NA | NA | 34.3 ± 9.1 (n=67) | NA | NA | |
| BMI (Exam 4, kg/m2) | 34.6 ± 8 | 44.8 ± 7.5 | 37.9 ± 9.1 | 35.0 ± 8.8 | 45.0 ± 8.9 | 39.6 ± 10.2 | |
| DM (Exam 1, %) | 34 | 38 | 35 | 8 | 32 | 19 | |
| DM (Exam 4, %) | 17 | 38 | 24 | 7 | 54 | 28 | |
| Changes in Clinical Variables (Exam 4 – Exam 1): Mean ± Standard Deviation, N | |||||||
| FFM (kg) | M±SD | −13.4±6.7 | −2.4±6.5 | −9.9±8.4 | −13.5±7.0 | −4.9±7.4 | −9.8±8.4 |
| N | 127 | 59 | 186 | 91 | 70 | 161 | |
| FM (kg) | M±SD | −22.2±11.5 | −2.1±10.3 | −15.8±14.5 | −21.0±11.6 | −1.2±10.1 | −12.4±14.7 |
| N | 127 | 59 | 186 | 91 | 70 | 161 | |
| BMI (kg/m2) | M±SD | −11.5±5.4 | −0.2±5.6 | −7.8±7.6 | −11.0±5.5 | −0.2±5.3 | −6.2±7.6 |
| N | 137 | 66 | 203 | 97 | 78 | 175 | |
| REE (kcal) | M±SD | −550±238 | −301±215 | −478±257 | −569±260 | −325±249 | −452±282 |
| N | 79 | 32 | 111 | 50 | 46 | 96 | |
| AST (U/l) | M±SD | −0.5±8.1 | −2.4±8.5 | −1.1±8.3 | −0.5±10.0 | −4.0±7.8 | −2.1±9.2 |
| N | 136 | 66 | 202 | 96 | 77 | 173 | |
| ALT (U/l) | M±SD | −5.0±11.3 | −2.7±13.1 | −4.3±11.9 | −4.4±15.0 | −5.4±12.8 | −4.8±14.0 |
| N | 137 | 66 | 203 | 97 | 77 | 174 | |
| Uric acid (mg/dl) | M±SD | −0.7±1.2 | 0.1±1.3 | −0.4±1.3 | −0.8±1.3 | −0.2±1.2 | −0.6±1.3 |
| N | 137 | 65 | 202 | 96 | 77 | 173 | |
| SBP (mmHg) | M±SD | −4.6±19.1 | 9.3±21.5 | −0.1±20.9 | −2.0±21.5 | 8.8±20.3 | 2.8±21.6 |
| N | 137 | 66 | 203 | 97 | 78 | 175 | |
| DBP (mmHg) | M±SD | −1.4±13.9 | 5.5±14.0 | 0.8±14.3 | 1.1±14.9 | 7.0±14.4 | 3.7±14.9 |
| N | 137 | 66 | 203 | 97 | 78 | 175 | |
| Glucose (mg/dl) | M±SD | −13.3±20.7 | −2.5±23.9 | −9.8±22.3 | −7.5±14.0 | −1.9±25.9 | −5.0±20.3 |
| N | 137 | 66 | 203 | 97 | 78 | 175 | |
| Insulin (μU/ml) | M±SD | −10.8±11.8 | −6.7±13.9 | −9.5±12.6 | −11.3±13.0 | −6.2±12.8 | −9.1±13.1 |
| N | 137 | 66 | 203 | 97 | 78 | 175 | |
| HOMA-IR | M±SD | −3.1±3.4 | −2.0±4.1 | −2.8±3.7 | −2.9±3.5 | −1.5±3.9 | −2.3±3.7 |
| N | 137 | 66 | 203 | 97 | 78 | 175 | |
| HOMA-B | M±SD | −71±147 | −69±177 | −70.0±157 | −100±179 | −38±166 | −73±175 |
| N | 133 | 63 | 196 | 96 | 76 | 172 | |
| HbA1c (%) | M±SD | 0.01±0.93 | 0.25±1.00 | 0.09±0.96 | 0.07±0.76 | 0.44±1.22 | 0.23±1.01 |
| N | 136 | 66 | 202 | 97 | 78 | 175 | |
| TG (mg/dl) | M±SD | −70.6±59.8 | −24.8±56.8 | −55.7±62.5 | −73.0±67.3 | −33.9±69.7 | −55.6±70.9 |
| N | 137 | 66 | 203 | 97 | 78 | 175 | |
| LDL-C (mg/dl) | M±SD | −2.9±29.5 | 26.4±29.7 | 6.6±32.5 | −3.4±30.6 | 27.8±28.4 | 10.5±33.4 |
| N | 137 | 66 | 203 | 97 | 78 | 175 | |
| HDL-C (mg/dl) | M±SD | 13.7±12.6 | 2.2±9.4 | 10.0±12.8 | 15.6±13.8 | 2.3±9.0 | 9.7±13.6 |
| N | 137 | 66 | 203 | 97 | 78 | 175 | |
| FRS (%) | M±SD | −2.3 ± 3 | −0.8 ± 2 | −1.8 ± 3 | −1.0 ± 2 | −0.8 ± 2 | −0.9 ± 2 |
| N | 137 | 66 | 203 | 97 | 78 | 175 | |
| DMINC | % | 0 | 0 | 0 | 3 | 21 | 24 |
| N | 91 | 41 | 132 | 88 | 51 | 139 | |
| DMREM | % | 23 | 0 | 23 | 4 | 5 | 9 |
| N | 46 | 25 | 71 | 8 | 25 | 33 | |
Exam 1: baseline exam; Exam 2: exam at 2 years; Exam 4: exam at 12 years; BMI: body mass index; NA: not measured at Exam 2; FFM: fat-free mass; FM (fat mass); REE: resting energy expenditure; AST (aspartate aminotransferase); ALT (alanine aminotransferase); SBP: systolic blood pressure; DBP: diastolic blood pressure; HOMA-IR: homeostatic assessment of insulin resistance; HOMA-B: homeostatic assessment of insulin secretion; HbA1c: hemoglobin A1c; TG: triglycerides; LDL-C: low-density lipoprotein cholesterol; HDL-C: high-density lipoprotein cholesterol; FRS: Framingham risk score for 10-year cardiovascular disease incidence. DMINC: Diabetes incidence at 12 years; DMREM: Diabetes remission at 12 years. Only 204 of the 234 subjects who had gastric bypass surgery had available Exam 2 samples for proteomic measurements.
Plasma aliquots were stored at −80 degrees C. Prior to assay, the plasma was thawed and approximately 70 μl used for the proteomics assay. Proteins were measured by a Slow Off-rate Modified Aptamer-based protein array (SomaLogic, Boulder, CO, USA) (15). A total of 1297 proteins were measured and are referred to by their gene names. Normalization and calibration of protein levels were done using SomaScan proprietary software. Sample data was normalized to remove hybridization variation within a run, followed by median normalization across all samples to remove other assay biases within the run and finally calibrated to remove assay differences between runs. Calibrator CVs on each plate were calculated and at least 50% of SOMAmer reagents had to have CVs less than 0.1 and 95% had to have CVs below 0.2. Any flagged samples by SomaScan software were removed from the analysis. Protein abundance was calculated as log of the relative fluorescence units.
Statistical methods
Outliers were removed at 4 standard deviations above or below the mean value of each protein. Within-individual changes in protein levels (protein at exam 4 – protein at exam 1) were calculated for all 1297 proteins. Clinical data were winsorized at 5-95% quantiles.
Beta coefficients from linear regression models were used to test for protein changes versus surgery status (surgery group compared with non-surgery group) or versus BMI changes (exam 4 – exam 1) after adjusting for age, sex, and baseline BMI, first in the discovery batch and second in the replication batch. Additional regression models were run after adding change in BMI as a covariate when comparing the surgery and non-surgery groups. All statistical tests were two-sided tests and were adjusted for multiple comparisons using the Bonferroni correction.
Functional enrichment analysis was performed in R using the fgsea (16) and clusterProfiler (17) packages for Gene-Set Enrichment Analysis (GSEA). Analysis was performed using pathway annotation from human Reactome (v. 73; 06/2020 release), WikiPathways (07.2020 release) and KEGG (22.07.2020 release) databases. The full SomaScan panel of proteins was used as the background set of proteins. GSEA results were filtered for redundant entries based on semantic similarity between protein groups. UniProt keyword (15.10.2019 release) annotations were used for classification of proteins. Significantly over-represented diseases were assessed using the Genetic Association Database (18). Clustering in heatmaps was performed using the complete linkage Euclidean distance method.
Results
Baseline and 12-year change variables are presented for the discovery and replication subsets in Table 1. For the gastric bypass surgery group, unadjusted protein means at baseline, 2 years and 12 years for all 1297 proteins are color coded for those that increase or decrease over 12 years (Table S1). The unadjusted protein means at baseline and at 12-year follow-up in the comparison non-surgery group are listed in Table S2.
Long-term effect of surgery and weight loss on the proteomic profile
A total of 58 adjusted protein changes differed between the gastric bypass surgery and non-surgery groups in the discovery set at a Bonferroni significance level (p<0.05/1297=3.85 × 10−5), among which 51 were replicated (p<0.05/58=8.6 × 10−4; Figure 1A and Tables S3, 4 and 5 for discovery, replication and combined analysis, respectively).
Figure 1.
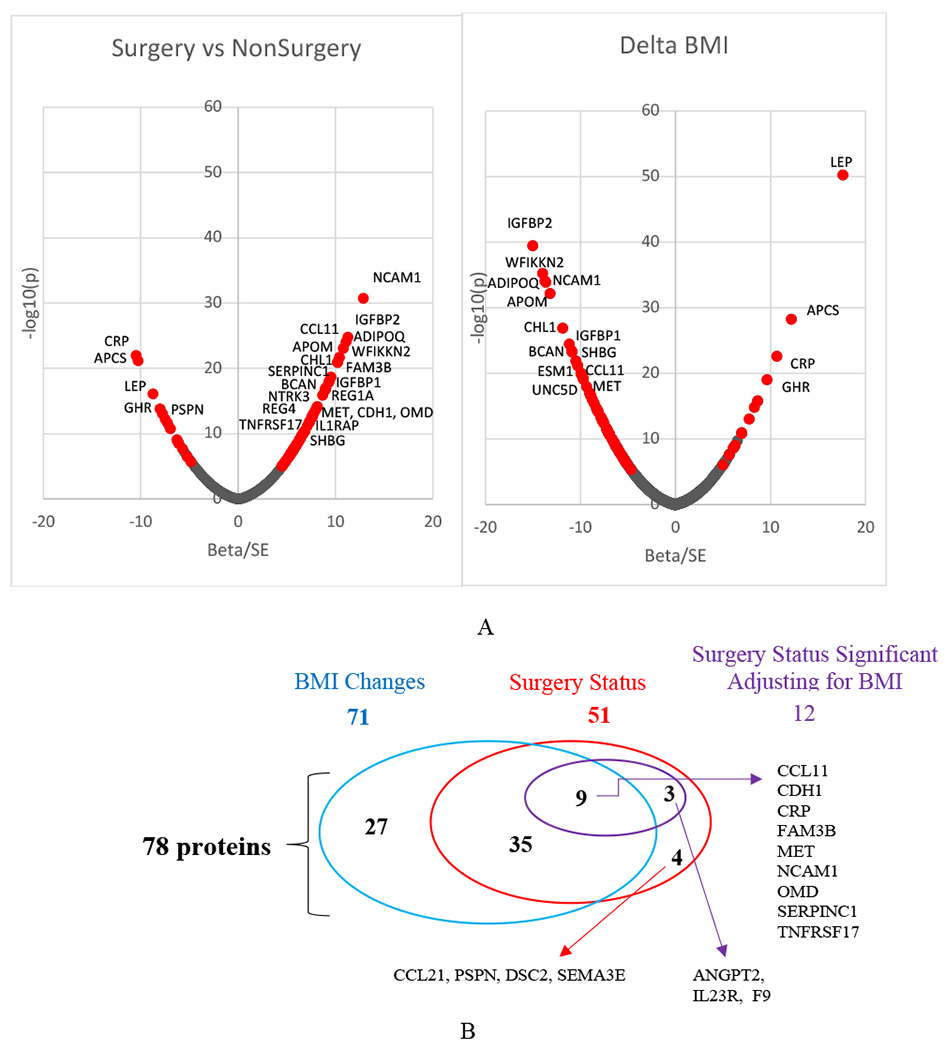
A) Plot of 12-year protein changes’ normalized beta values (beta/SE beta) vs nominal −log10(p values). Left plot from the surgery vs non-surgery analysis of the combined discovery and replication samples. Right plot from the delta BMI (exam 4 – exam 1) analysis. Red color identifies the 78 replicated and Bonferroni corrected significant protein changes.
B). Overlap of 71 significant 12-year protein changes associated with BMI change (blue oval) and 51 associated with gastric bypass surgical status without correcting for change in BMI in the model (red oval). Twelve proteins of the 51 proteins were still significantly associated with surgery status after correcting for changes in BMI (purple oval). Four proteins were no longer associated with surgery status after adjusting for BMI changes even though they were not found to be associated with BMI changes.
Since the 12-year change in weight varies within both the surgery and non-surgery groups, additional PWAS was conducted to find the association of 12-year changes in proteins with the quantitative change in BMI, adjusting for age, sex, and baseline BMI. In the discovery set, 12-year changes in levels of 99 proteins were associated with changes in BMI (p<3.85 × 10⁻⁵). Of these 99 protein changes, 71 were replicated (p<0.05/99=5.1 × 10−4; Figure 1A). Sixty of the 71 identified proteins increased as BMI decreased over the 12 years, including IGFBP2, APOM and ADIPOQ, while 11 proteins decreased, including LEP, CRP, GHR, AFM and MPO (Figure 1A).
Combining the significant results from the two PWAS analyses (Figure 1B), 78 long-term protein changes were associated with change in BMI (N=71) or between surgery and non-surgery groups (N=51). All but 7 protein changes that were significantly different between surgery groups were also associated with change in BMI (Figure 1B). Therefore, the protein change differences between groups were further adjusted for change in BMI to see if some proteins changed independently of BMI change. Twelve of the 51 replicated protein changes that were significantly associated with surgery/non-surgery status remained significantly associated with surgery status even after further adjustment for BMI change (Figure 1B).
Short- vs long-term effect of surgery and weight loss on the proteomic profile
Short-term protein change associations with BMI change were maintained long-term (Figure 2A, Tables S6 and S7). There was a strong correlation of the 12-year follow-up versus the 2-year follow-up standardized beta coefficients (β/SE) associated with the p-values shown in Figure 2A for the 71 proteins (r= 0.93).
Figure 2.
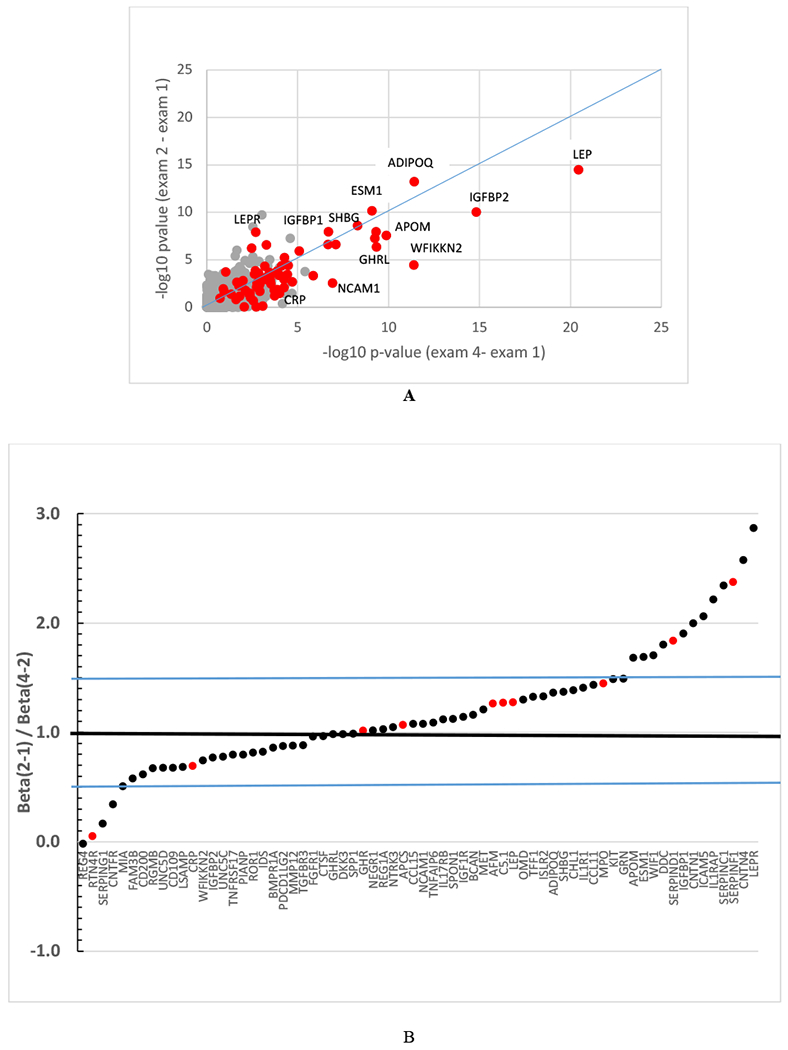
A) Comparison of −log10 p-values from the association of short-term (Exam 2-1) versus long-term (Exam 4-1) protein change associations with BMI change for all 1297 proteins in the combined discovery and replication groups. Red dots indicate the 71 replicated proteins for BMI change. B) Patterns of protein changes per unit BMI change after substantial weight loss (Exam 2-Exam 1) and after some weight regain (Exam 4-Exam 2) obtained from surgery group (N=204 who have measurements at all 3 time points) for the 78 proteins in Figure 1. Ratio of beta coefficients derived from the regression of the protein change on BMI change for the 2-year follow-up (Exam 2-Exam 1; β1-2) divided by the beta coefficient using changes from the subsequent 10 years of follow-up (Exam 4-Exam 2, β2-4). Ratios greater than 1 suggest greater protein change per unit BMI change during the weight-loss period compared to the weight-gain period. Ratios less than 1 suggest greater protein changes per unit BMI change in the weight-gain period compared to the weight-loss period. Proteins shown in red increase with increasing BMI and proteins in black decrease with increasing BMI. Blue lines represent ±50% increase or decrease in the ratio. FCN2, with a ratio of 5.0 is not shown to improve the readability of the figure. SERPINA4 and CDH1 had greater changes during weight loss, but also had negative ratios of −7.0 and −4.8, respectively, indicating that the protein change association with BMI change did not reverse from the weight-loss to the weight-gain period as did the other proteins (points not shown). The beta coefficients used in the ratios can be found in Table S6.
All protein changes except REG4 had the same direction of association with BMI change during weight-loss (exams 2-1) and weight-regain (exams 4-2) time periods (Table S6). If the protein change was positively associated with BMI change from exam 1 to 2 (both decreased over time), it was positively associated from exam 2 to 4 (both increased). If the protein change was inversely associated from exam 1 to 2 (BMI decreased but the protein increased), the protein change was inversely associated with BMI change from exam 2 to 4 (BMI increased but the protein decreased). Therefore, protein changes consistently reflected both BMI decreases and BMI increases.
In addition to the consistent direction of the association of protein change with BMI change, the amount of protein change per unit BMI change was assessed to see if the period of rapid weight loss had a differing effect on a protein than the period of slow weight regain. All but 16 proteins had a protein change per unit BMI change during weight regain that was within 50% (0.5≤ratio of beta coefficients≤1.5) of the change per unit BMI during weight loss (Figure 2B, Table S6). Proteins that changed more per unit BMI change during weight loss than weight regain included LEPR, IGFBP1, APOM and three SERPIN proteins. Only 4 proteins had greater than a 50% change per unit BMI change during the weight regain period than the weight-loss period.
Subjects who regained less than 10% of their baseline pre-surgical weight from exam 2 to exam 4 were compared to subjects who regained more than 10% of their baseline weight (19). Six proteins were significantly associated with weight regain vs weight maintenance (p< 0.05/1297; Figure S1 and Table S8). LEP and APCS were higher at exam 4 in those who regained more than 10% of their baseline weight while IGFBP2, WFIKKN2, HTRA2 and SHBG, were lower. The clinical characteristics of the two groups are presented in Table S9.
Clinical variable associations with the proteome
A heat map of the regression beta-coefficients and the cluster patterns of the 71 protein and 20 clinical variable 12-year changes showed the strongest protein associations with lipids (58 proteins with HDL-C, 47 with LDL-C, 44 with TG), resting energy expenditure (REE; 36 proteins) and uric acid (23 proteins) (Figure 3, Table S10). Surprisingly few associations were seen with variables in the glucose/insulin pathways (fasting glucose with 8; insulin, HOMA-IR and HOMA-B with 0; HbA1c with 4 that included ADIPOQ and SHBG; or with blood pressure (SBP with 4 that included APOM and DBP with 1 that included AFM). Eight protein changes were associated with 12-year remission of diabetes (including APOM, ADIPOQ and SHBG) and 8 proteins increased when BMI decreased and were associated with a decreased 10-year risk of CHD (Table S10).
Figure 3.
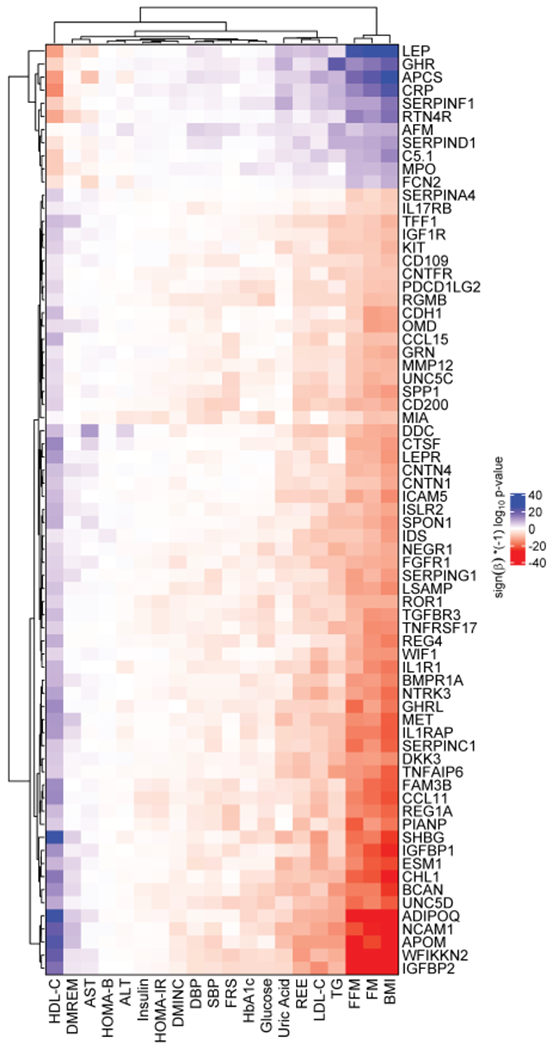
Heatmap of clinical variable associations with the 71 protein changes that were associated with change in BMI from a regression model using combined surgery and non-surgery groups. Colors represent (sign(beta)*(−1)log10(p-value)). Significance level is Bonferroni-corrected p-value (p ≤ 0.05/71/20 = 3.5 × 10⁻⁵) for 71 proteins and 20 clinical variables. Red indicates high significance with negative beta (the protein increases with a decrease in the clinical variable), blue indicates high significance with positive beta. FM: fat mass; FFM: fat free mass; REE: resting energy expenditure; TG: triglycerides; SBP and DBP: systolic and diastolic blood pressure; FRS: Framingham risk score for 10-year CAD risk; DMINC and DMREM: diabetes incidence and remission at 12 years.
Because so few glucose metabolism-related proteins were found among the protein changes that were related to BMI change, a PWAS analysis was done for all 1297 proteins in the surgical group (Figure S2, Table S11). Longitudinal changes in glucose, insulin, HOMA-B, HOMA-IR, HbA1c and blood pressure still did not show highly significant associations with protein changes. The strongest associations of non-BMI related protein changes were with liver function (particularly protein cluster 3 of Figure S2). HDL-C change was associated with ADIPOQ, APOM, WFIKKN2, GHRL, SHBG, SHH and C3. Lower TG was associated with lower AFM, GHR, APOA1, APOE, CRELD1, and CRYZL1, and higher TIMP2. All significant proteins remained significant after repeating the analyses without adjusting the clinical variables for medication use.
Pathway analysis
Over-expressed pathways using gene-set enrichment analysis (GSEA) on all 78 proteins in Figure 1 were identified using the SomaScan panel of proteins as background (Table 2). Pathways over-represented by the proteins altered after weight loss through bariatric surgery involved inflammation, cellular growth, and apoptosis. These pathways were represented by the interleukins, MAPK signaling proteins, immune/complement system proteins, adipogenesis and insulin-like growth-related proteins. CRP, representing acute-phase inflammation, was limited to the complement pathway. In addition to identifying over-expressed pathways, there were 6 diseases that were over-represented by the significant protein changes (Table S12). These diseases or conditions included bone mineral density, obesity/weight, metabolic syndrome and diabetes.
Table 2.
Top differential pathways identified by Gene-Set Enrichment Analysis (GSEA) of genes identified to be associated with quantitative BMI change or surgery group status differences. Protein examples for each pathway are shown only if the protein was among the 78 Bonferroni significant proteins according to Figure 1.
| Pathway | Overlap (BMI change; surgery group) |
P-value (BMI change; surgery group) |
Proteins from BMI change or surgery group comparisons in each pathway |
|---|---|---|---|
| Signaling by interleukins | 128/201; 135/201 | 7.91e-05; 4.97e-04 | CCL11, IL1R1, IL23R, CNTFR, IL17RB |
| Adipogenesis | 16/31; 17/31 | 2.35e-03; 9.33e-03 | LEP, ADIPOQ, CNTFR |
| Cell adhesion molecules (CAMs) | 24/41; 17/41 | 4.67e-03; 1.63e-02 | NCAM1, CDH1, CNTN1, NEGR1, PDCD1LG2 |
| Cytokine signaling in immune system | 194/314; 189/314 | 5.19e-03; 1.87e-02 | NCAM1, CCL11, MET, GHR, IL1R1, TNFRSF17, PSPN, KIT, IL23R, CNTFR, IL17RB |
| MAPK family signaling cascades | 71/98; 60/98 | 6.36e-03; 1.73e-02 | NCAM1, MET, PSPN, KIT |
| Regulation of IGF transport and uptake by IGFBPs | 26/57; 25/57 | 6.83e-03; 2.41e-02 | IGFBP2, IGFBP1, SERPINC1, SPP1, SERPIND1 |
| Synthesis of GPI-anchored proteins | 7/12; 7/12 | 8.81e-03; 2.52e-02 | LSAMP, CNTN4, NEGR1, CD109 |
| Complement cascade | 12/33; 16/33 | 1.44e-02; 3.38e-03 | CRP, C5a, SERPING1, FCN2, C5, C5b/6 complex |
| Interleukin-4 and Interleukin-13 signaling | 43/64; 45/64 | 1.76e-02; 1.45e-03 | CCL11, IL23R |
Pathways were also defined using only the surgery subset of subjects and GSEA (Figure 4). The pathways with the greatest number of significant clinical variable associations with protein changes involved BMI and HDL-C. HDL-C was overexpressed primarily in the inflammation (interleukin signaling) and the immune (cytokine signaling) pathways.
Figure 4.
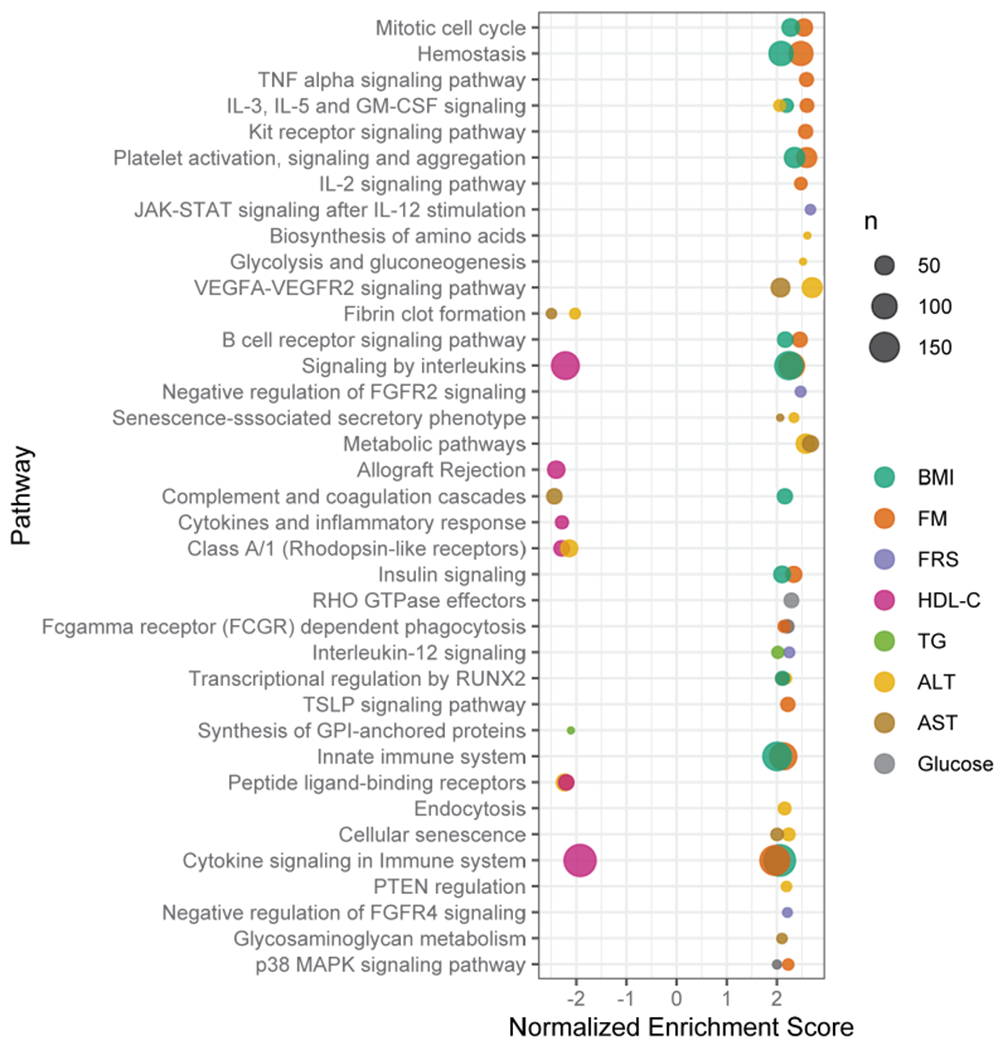
Dot plot from GSEA showing enriched pathways defined by the protein associations with clinical variables. Normalized enrichment score (x-axis) indicates the distribution of pathway proteins using sign(beta)*(−log10(p-value)) from the regression of protein changes with the clinical variable changes. The size of this core-enriched set is visualized by the size of the dots. Pathway enrichment cut-off for plotting is p < 0.022.
Finally, KEGG Brite pathway-based Voronoi treemaps were also created for 950 out of the 1297 panel proteins that could be assigned to a specific KEGG Brite level. Figure S3 panels A, B and C (which can be enlarged to see more detail in any section of the panels), show the −log10(p-value) for categories, pathways within categories, and proteins within pathways, respectively, associated with BMI changes. BMI changes were strongly associated with the Jak-STAT signaling pathway (panel B) within the signal transduction category (panel A). Changes in LEP, LEPR, GHR, and IL19 were the primary signal transduction pathway proteins. Change in BMI was also related to the complement and coagulation cascades, with C7, CFB and CFI being the primary proteins. The PPAR signaling pathway was represented by ADIPOQ. In particular, the HDL-C beta coefficients showed pathway and protein associations very similar to those seen for BMI (Figures S3B and S3C).
Discussion
As bariatric surgery results in substantial long-term weight loss, identifying the underlying reasons for risk factor improvements after this large weight loss has the possibility of developing better interventions for patients with severe obesity without the need for major surgery and bariatric surgery’s required life-long lifestyle changes. The large sample size and long follow-up period of this study allowed us to test if the short-term protein changes observed in this and previous studies are maintained long-term, which maintenance is essential prior to pursuit of efforts to mimic the positive effects of these protein changes.
One of the major findings of this study of 378 individuals was that protein changes following gastric bypass surgery were durable 12 years post-surgery despite some weight regain. The majority of the protein changes were significant within 2 years of surgery after weight loss and the changes reversed direction after the first two years according to the amount of weight regain during the following 10 years. These important results support the clinical data that the health benefits of gastric bypass surgery occur soon after the surgery rather than following a significant period of time but nevertheless are maintained in the long term.
Another important finding is that most of the changes in proteins were associated with changes in BMI per se and not BMI-independent pathways induced by the surgical rerouting of the intestine. Furthermore, most proteins changed approximately the same per unit BMI change regardless of whether weight was lost or weight was regained. These paired within-person results strongly supported the involvement of BMI change with these protein changes, confirming proteins previously implicated with obesity including LEP, SHBG, ADIPOQ, GHRL, WFIKKN2, IGFBP1, and IGFBP2 (20–22). Larger protein changes during rapid weight loss compared to slower weight regain periods were seen for a number of proteins suggesting either BMI-independent or pleiotropic mechanisms involving these proteins were activated during rapid weight loss. While many known obesity-related proteins were confirmed to be related to long-term weight loss, proteins not established as obesity-related proteins were also identified, such as NCAM1.
Finally, the majority of protein changes that were significantly associated with BMI changes were related to changes in lipid levels as opposed to blood pressure, liver function, or glucose- and insulin-associated variables. Our prior studies showed HDL-C had the largest and most consistent, but at the time unexplained, increase after gastric bypass surgery of all the clinical variables measured (3,23). The current study expands the previous findings by suggesting APOM, ghrelin, and SHH (cholesterol transferase activity in the endoplasmic reticulum) were significantly related to HDL-C and the lipoprotein pathway (Figure S2B) and may be part of the underlying reason for the sustained 12-year post-surgical elevation of HDL-C.
At least three of the 8 proteins related to 12-year remission of diabetes are known obesity- and diabetes-related proteins, including SHBG, ADIPOQ and possibly APOM. However, of the 8 proteins associated with fasting glucose, only MIA, related to the secretion of lipoproteins, pre-chylomicrons and pre-VLDLs from the endoplasm (UniProtKB database, accessed 12/23/20), had functions considered to be in a diabetes pathway. Therefore, the proteins associated with diabetes remission do not seem to be directly related to plasma glucose or insulin changes.
Specific protein decreases after gastric bypass surgery
Of the 78 proteins identified, 11 proteins decreased in accordance with their known functions. Decreasing LEP is highly correlated with weight loss (24). Weight loss is known to reduce inflammation in accordance with the reduction in CRP, C5.1, and MPO observed in our study. As tissue growth is being opposed by reduced calorie intake and intestinal reabsorption of nutrients, there is less need for GHR, which decreased. AFM (afamin) decreased, confirming previous findings of higher levels of AFM associated with increased weight, the metabolic syndrome (25) and DM incidence (26). APCS is thought to bind to and remove apoptotic cells and was greatly decreased at 2 years after most of the large tissue losses during the first 2 years stabilized. FCN2 is involved with innate immunity and lectin complement pathway and dramatically changed during weight loss. The complement system has been previously shown to be altered after gastric bypass surgery (8,27).
Specific protein increases after gastric bypass surgery
Proteins with the most significant increases with decreasing BMI included IGFBP1, IGFBP2, ADIPOQ, and APOM. IGFBP1 and IGFBP2 are insulin-like growth factor binding proteins and higher levels have been associated with reduced glucose intolerance, blood pressure or NAFLD in multiple cross-sectional or short-term intervention studies (8,28–33). ADIPOQ has multiple beneficial functions including improvement in most components of the metabolic syndrome, reducing diabetes and atherosclerosis (34).
APOM is a component of HDL and is thought to be responsible for the anti-inflammatory effects of HDL. The higher levels of APOM after bariatric surgery correspond to the reduced inflammation present after weight loss (35), which is also supported by a significant association of APOM with remission of diabetes. Since denser HDL particles are the primary carriers of APOM, one might also expect a shift to more dense HDL particles with increasing APOM after surgery. However, the significant increase in cholesterol content in the HDL particle along with lower ApoA1 (33) at follow-up (Table S1) suggests that the particles were less dense.
Clinical variable associations with protein changes
HDL-C was clearly the mostly strongly associated clinical variable associated with the 71 protein changes that were associated with BMI change over 12 years (Figure 3). HDL-C increased by approximately 25% two years after surgery, which increase was maintained throughout the 12-year follow-up period despite weight regain and was larger than any other clinical change (3). HDL-C has a strong positive association with SHBG even after adjusting for multiple cardiovascular risk factors (36). Polymorphisms in the SHBG gene have been associated with abundance of the SHBG protein, HDL-C, diabetes, and CHD (36–38). SHBG was tightly clustered with IGFBP2, suggesting additional effects beyond HDL-C (31). Additionally, decreases in AFM, APOE (associated with decreased TG), and increases in ADIPOQ and APOM (associated with increased HDL-C) after surgery suggest these proteins may be responsible for the sustained large increase in HDL-C. ADIPOQ, APOM, and SHBG were also associated with 12-year diabetes remission, but not with HbA1c, glucose or insulin.
The direction of the clinical variable associations suggests that CHD risk should be lowered (39) 12 years after surgery. Seven of the 8 protein increases that were related to decreased CHD risk had significant positive associations with HDL-C and negative associations with LDL-C. All 8 protein increases were also associated with the decreased REE that accompanied BMI decreases.
Pathways
The gene-set and Voronoi treemap pathway analyses replicated several pathways associated with weight loss and obesity (21,33). Major pathways associated with BMI are related to lipid metabolism, adipose tissue functionality, inflammation, cell adhesion, immunity and coagulation. Reduced inflammation appeared to be a primary benefit of protein changes associated with weight loss and gastric bypass surgery, as suggested by the over-expression of protein changes in the pathways involving signaling by interleukins and cytokine signaling in the immune system. These pathways coincided with the over-expressed HDL-C pathways, supporting the anti-inflammatory functions of elevated HDL-C. The cytokine signaling pathway contains a number of interleukins and adipocytokines, and adipose tissue colonization by pro-inflammatory macrophages and macrophage-derived factors like TNF-α and IL-β are hallmarks of obesity (40,41).
Voronoi treemaps implicated the AMPK pathway, which regulates cellular energy stores and preservation of ATP and is activated by leptin and adiponectin (42,43), both of which had significant changes in this study. The pathway is involved with inhibition of gluconeogenesis and lipid and protein synthesis. Another pathway, JAK-STAT, can be activated by cytokines (44) and leptin, and functions include regulating cellular division and inflammation processes and proper adipose function. A third pathway, PIK3-AKT-ras pathway, influences cell survival and growth, is involved with lipid phosphorylation and has been associated with diabetes (45).
Proteomic studies with 12-year follow-up or even 5-year follow-up have not been reported, but many of the proteins identified replicated those found in a short-term weight gain and weight loss study (21). In that study, coagulation, complement, and inflammation proteins were in primary pathways involved with weight gain and were reversed with weight loss, similar to our long-term study. Findings in a study of 47 subjects (19 of whom were followed at least 2 years) who had gastric bypass surgery were also similar, with apolipoproteins in particular (including APOM) having the most significant changes, along with complement and inflammation pathways (8). A very low-calorie diet intervention study of 43 subjects found strong apolipoprotein associations at 1 year (20).
Conclusions
Long-term weight loss after gastric bypass surgery resulted in sustained protein changes despite some weight regain occurring over the 12 years. Most protein changes found associated with BMI changes in the discovery sample were replicated in a second sample, although an external long-term replication cohort would have been preferred. The reversal of direction of protein changes after weight loss when weight was partially regained suggest the findings were robust.
Most protein changes were related to changes in BMI rather than non-weight related long-term surgical effects, suggesting that the beneficial changes of these proteins might be obtained by other methods of weight loss besides bariatric surgery. The direction of the protein and clinical variable changes was consistent with the health benefits and decreased mortality observed after bariatric surgery. These BMI-associated protein changes were associated with lipid-related proteins (primarily HDL-C), greater diabetes remission, and pathways that control inflammation, energy conservation, cell replication and apoptosis, and adipocyte function. The non-BMI related protein changes were related to coagulation and organismal injury pathways.
Mechanisms responsible for sustained higher HDL-C after gastric bypass surgery, the nature of HDL-C’s anti-inflammatory functions, the related protein increases of APOM, SHH and GHRL in the lipoprotein pathway and decreases in C3 in multiple pathways need to be clarified in future studies. Known obesity-related proteins that change 1-2 years after bariatric surgery remain changed 12 years after surgery, including LEP, ADIPOQ, SHBG, IGFBP1, IGFBP2, WFIKKN2 and AFM.
Supplementary Material
Study Importance.
What is already known about this subject?
Plasma protein amounts change 1 to 2 years after bariatric surgery.
Many of these proteins are in known obesity-related metabolic pathways and have been associated with improved clinical risk factors for disease.
What are the new findings in your manuscript?
Most short-term, post-surgical plasma protein changes were maintained up to 12 years post-surgery and were related to weight change rather than gastric bypass surgery, per se.
Long-term protein changes were related to improvements in clinical disease risk factors primarily involving lipid pathways rather than diabetic pathways.
Inflammation, complement, and adipocyte function pathways were other important pathways that were over-expressed by the significantly changed proteins.
How might your results change the direction of research or the focus of clinical practice?
Beneficial protein changes identified after gastric bypass surgery are also likely to be induced by non-surgical weight loss.
Identification of plasma proteins involved with improved clinical risk factors may in the future allow a more effective targeting of treatments to reduce adverse clinical outcomes of obesity.
Funding:
Supported by a grant (DK-55006) from the National Institute of Diabetes and Digestive and Kidney Diseases of the National Institutes of Health, a U.S. Public Health Service research grant (MO1-RR00064) from the National Center for Research Resources, Biomedical Research Program funds from Intermountain Healthcare, and from grant #NPRP11S-0114-180299 from the Qatar National Research Fund (a member of Qatar Foundation). The findings herein are solely the responsibility of the authors.
Footnotes
The authors declared no conflict of interest.
References
- 1.Pou KM, Massaro JM, Hoffmann U, et al. Visceral and subcutaneous adipose tissue volumes are cross-sectionally related to markers of inflammation and oxidative stress: the Framingham Heart Study. Circulation 2007;116:1234–1241. [DOI] [PubMed] [Google Scholar]
- 2.Bays H, Kothari SN, Azagury DE, et al. Lipids and bariatric procedures Part 2 of 2: scientific statement from the American Society for Metabolic and Bariatric Surgery (ASMBS), the National Lipid Association (NLA), and Obesity Medicine Association (OMA). Surg Obes Relat Dis 2016;12:468–495. [DOI] [PubMed] [Google Scholar]
- 3.Adams TD, Davidson LE, Litwin SE, et al. Weight and metabolic outcomes 12 years after gastric bypass. N Engl J Med 2017;377:1143–1155. [DOI] [PMC free article] [PubMed] [Google Scholar]
- 4.Kolotkin RL, Kim J, Davidson LE, Crosby RD, Hunt SC, Adams TD. 12-year trajectory of health-related quality of life in gastric bypass patients versus comparison groups. Surg Obes Relat Dis 2018;14:1359–1365. [DOI] [PubMed] [Google Scholar]
- 5.Adams TD, Gress RE, Smith SC, et al. Long-term mortality after gastric bypass surgery. N Engl J Med 2007;357:753–761. [DOI] [PubMed] [Google Scholar]
- 6.Wing RR, Phelan S. Long-term weight loss maintenance. Am J Clin Nutr 2005;82:222S–225S. [DOI] [PubMed] [Google Scholar]
- 7.Zhou K, Wolski K, Malin SK, et al. Impact of weight loss trajectory following randomization to bariatric surgery on long-term diabetes glycemic and cardiometabolic parameters. Endocrine practice : official journal of the American College of Endocrinology and the American Association of Clinical Endocrinologists 2019;25:572–579. [DOI] [PubMed] [Google Scholar]
- 8.Wewer Albrechtsen NJ, Geyer PE, Doll S, et al. Plasma proteome profiling reveals dynamics of inflammatory and lipid homeostasis markers after Roux-en-Y gastric bypass surgery. Cell Syst 2018;7:601–612 e603. [DOI] [PubMed] [Google Scholar]
- 9.Shah RV, Hwang S-J, Yeri A, et al. Proteins altered by surgical weight loss highlight biomarkers of insulin resistance in the community. Arterioscler Thromb Vasc Biol 2019;38:107–115. [DOI] [PMC free article] [PubMed] [Google Scholar]
- 10.Rodriguez-Rivera C, Perez-Garcia C, Munoz-Rodriguez JR, et al. Proteomic identification of biomarkers associated with eating control and bariatric surgery outcomes in patients with morbid obesity. World J Surg 2019;43:744–750. [DOI] [PubMed] [Google Scholar]
- 11.Doulamis IP, Konstantopoulos P, Tzani A, et al. Visceral white adipose tissue and serum proteomic alternations in metabolically healthy obese patients undergoing bariatric surgery. Cytokine 2019;115:76–83. [DOI] [PubMed] [Google Scholar]
- 12.Adams TD, Avelar E, Cloward T, et al. Design and rationale of the Utah obesity study. A study to assess morbidity following gastric bypass surgery. Contemp Clin Trials 2005;26:534–551. [DOI] [PubMed] [Google Scholar]
- 13.Adams TD, Pendleton RC, Strong MB, et al. Health outcomes of gastric bypass patients compared to nonsurgical, nonintervened severely obese. Obesity (Silver Spring) 2010;18:121–130. [DOI] [PMC free article] [PubMed] [Google Scholar]
- 14.Wilson PW, Castelli WP, Kannel WB. Coronary risk prediction in adults (the Framingham Heart Study). Am J Cardiol 1987;59:91G–94G. [DOI] [PubMed] [Google Scholar]
- 15.Davies DR, Gelinas AD, Zhang C, et al. Unique motifs and hydrophobic interactions shape the binding of modified DNA ligands to protein targets. Proc Natl Acad Sci U S A 2012;109:19971–19976. [DOI] [PMC free article] [PubMed] [Google Scholar]
- 16.Korotkevich G, Sukhov V, Sergushichev A. Fast gene set enrichment analysis. bioRxiv 2019. [Google Scholar]
- 17.Yu G, Wang LG, Han Y, He QY. clusterProfiler: an R package for comparing biological themes among gene clusters. OMICS 2012;16:284–287. [DOI] [PMC free article] [PubMed] [Google Scholar]
- 18.Becker KG, Barnes KC, Bright TJ, Wang SA. The genetic association database. Nat Genet 2004;36:431–432. [DOI] [PubMed] [Google Scholar]
- 19.Wing RR, Hill JO. Successful weight loss maintenance. Annu Rev Nutr 2001;21:323–341. [DOI] [PubMed] [Google Scholar]
- 20.Geyer PE, Wewer Albrechtsen NJ, Tyanova S, et al. Proteomics reveals the effects of sustained weight loss on the human plasma proteome. Mol Syst Biol 2016;12:901. [DOI] [PMC free article] [PubMed] [Google Scholar]
- 21.Piening BD, Zhou W, Contrepois K, et al. Integrative personal omics profiles during periods of weight gain and loss. Cell Syst 2018;6:157–170 e158. [DOI] [PMC free article] [PubMed] [Google Scholar]
- 22.Zaghlool SB, Sharma S, Molnar M, et al. Revealing the role of the human blood plasma proteome in obesity using genetic drivers. Nature communications 2021;12:1279. [DOI] [PMC free article] [PubMed] [Google Scholar]
- 23.Sjostrom L, Lindroos AK, Peltonen M, et al. Lifestyle, diabetes, and cardiovascular risk factors 10 years after bariatric surgery. N Engl J Med 2004;351:2683–2693. [DOI] [PubMed] [Google Scholar]
- 24.Rosenbaum M, Nicolson M, Hirsch J, Murphy E, Chu F, Leibel RL. Effects of weight change on plasma leptin concentrations and energy expenditure. J Clin Endocrinol Metab 1997;82:3647–3654. [DOI] [PubMed] [Google Scholar]
- 25.Dieplinger H, Dieplinger B. Afamin--A pleiotropic glycoprotein involved in various disease states. Clin Chim Acta 2015;446:105–110. [DOI] [PubMed] [Google Scholar]
- 26.Kollerits B, Lamina C, Huth C, et al. Plasma concentrations of afamin are associated with prevalent and incident Type 2 diabetes: A pooled analysis in more than 20,000 individuals. Diabetes Care 2017;40:1386–1393. [DOI] [PubMed] [Google Scholar]
- 27.Carayol J, Chabert C, Di Cara A, et al. Protein quantitative trait locus study in obesity during weight-loss identifies a leptin regulator. Nature communications 2017;8:2084. [DOI] [PMC free article] [PubMed] [Google Scholar]
- 28.Sandhu MS, Heald AH, Gibson JM, Cruickshank JK, Dunger DB, Wareham NJ. Circulating concentrations of insulin-like growth factor-I and development of glucose intolerance: a prospective observational study. Lancet 2002;359:1740–1745. [DOI] [PubMed] [Google Scholar]
- 29.Rajwani A, Ezzat V, Smith J, et al. Increasing circulating IGFBP1 levels improves insulin sensitivity, promotes nitric oxide production, lowers blood pressure, and protects against atherosclerosis. Diabetes 2012;61:915–924. [DOI] [PMC free article] [PubMed] [Google Scholar]
- 30.Cominetti O, Nunez Galindo A, Corthesy J, et al. Obesity shows preserved plasma proteome in large independent clinical cohorts. Scientific reports 2018;8:16981. [DOI] [PMC free article] [PubMed] [Google Scholar]
- 31.Choi H, Koh HWL, Zhou L, et al. Plasma Protein and MicroRNA Biomarkers of Insulin Resistance: A Network-Based Integrative -Omics Analysis. Front Physiol 2019;10:379. [DOI] [PMC free article] [PubMed] [Google Scholar]
- 32.Niu L, Geyer PE, Wewer Albrechtsen NJ, et al. Plasma proteome profiling discovers novel proteins associated with non-alcoholic fatty liver disease. Mol Syst Biol 2019;15:e8793. [DOI] [PMC free article] [PubMed] [Google Scholar]
- 33.Bruderer R, Muntel J, Muller S, et al. Analysis of 1508 Plasma Samples by Capillary-Flow Data-Independent Acquisition Profiles Proteomics of Weight Loss and Maintenance. Mol Cell Proteomics 2019;18:1242–1254. [DOI] [PMC free article] [PubMed] [Google Scholar]
- 34.Hotta K, Funahashi T, Arita Y, et al. Plasma concentrations of a novel, adipose-specific protein, adiponectin, in type 2 diabetic patients. Arterioscler Thromb Vasc Biol 2000;20:1595–1599. [DOI] [PubMed] [Google Scholar]
- 35.Frej C, Mendez AJ, Ruiz M, et al. A shift in ApoM/S1P between HDL-particles in women with Type 1 diabetes mellitus is associated with impaired anti-inflammatory effects of the ApoM/S1P complex. Arterioscler Thromb Vasc Biol 2017;37:1194–1205. [DOI] [PubMed] [Google Scholar]
- 36.Kurnaz-Gomleksiz O, Akadam-Teker B, Bugra Z, Omer B, Yilmaz-Aydogan H. Genetic polymorphisms of the SHBG gene can be the effect on SHBG and HDL-cholesterol levels in Coronary Heart Disease: a case-control study. Mol Biol Rep 2019;46:4259–4269. [DOI] [PubMed] [Google Scholar]
- 37.Perry JR, Weedon MN, Langenberg C, et al. Genetic evidence that raised sex hormone binding globulin (SHBG) levels reduce the risk of type 2 diabetes. Hum Mol Genet 2010;19:535–544. [DOI] [PMC free article] [PubMed] [Google Scholar]
- 38.Ding EL, Song Y, Manson JE, et al. Sex hormone-binding globulin and risk of type 2 diabetes in women and men. N Engl J Med 2009;361:1152–1163. [DOI] [PMC free article] [PubMed] [Google Scholar]
- 39.Li T, Yang L, Zhao S, Zhang S. Correlation between apolipoprotein M and inflammatory factors in obese patients. Med Sci Monit 2018;24:5698–5703. [DOI] [PMC free article] [PubMed] [Google Scholar]
- 40.Caer C, Rouault C, Le Roy T, et al. Immune cell-derived cytokines contribute to obesity-related inflammation, fibrogenesis and metabolic deregulation in human adipose tissue. Scientific reports 2017;7:3000. [DOI] [PMC free article] [PubMed] [Google Scholar]
- 41.Schmidt FM, Weschenfelder J, Sander C, et al. Inflammatory cytokines in general and central obesity and modulating effects of physical activity. PloS one 2015;10:e0121971–e0121971. [DOI] [PMC free article] [PubMed] [Google Scholar]
- 42.Martin TL, Alquier T, Asakura K, Furukawa N, Preitner F, Kahn BB. Diet-induced obesity alters AMP kinase activity in hypothalamus and skeletal muscle. J Biol Chem 2006;281:18933–18941. [DOI] [PubMed] [Google Scholar]
- 43.Kubota N, Yano W, Kubota T, et al. Adiponectin stimulates AMP-activated protein kinase in the hypothalamus and increases food intake. Cell Metab 2007;6:55–68. [DOI] [PubMed] [Google Scholar]
- 44.Richard AJ, Stephens JM. The role of JAK-STAT signaling in adipose tissue function. Biochimica et biophysica acta 2014;1842:431–439. [DOI] [PMC free article] [PubMed] [Google Scholar]
- 45.Huang X, Liu G, Guo J, Su Z. The PI3K/AKT pathway in obesity and type 2 diabetes. Int J Biol Sci 2018;14:1483–1496. [DOI] [PMC free article] [PubMed] [Google Scholar]
Associated Data
This section collects any data citations, data availability statements, or supplementary materials included in this article.