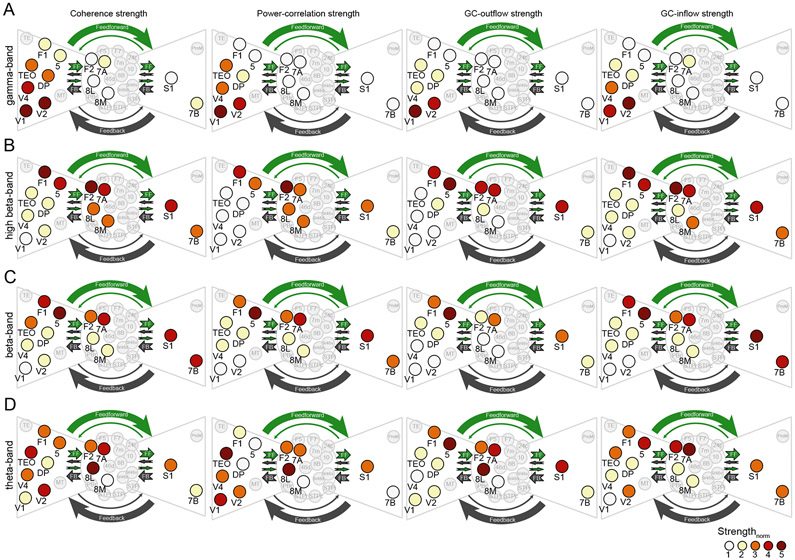
Figure 8. FC strength displayed on the AC-derived core-periphery structure.
For cortical areas both recorded by the ECoG and used to build the core-periphery structure (highlighted areas) (Markov et al., 2013), the color code displays the respective area’s FC strength, separately per FC type (as indicated above the columns), and separately per frequency band (as indicated to the left of the rows). FC strength values were averaged over monkeys before normalization into the range 1-5 (color scale, bottom right), separately for each frequency-band.
See also Figure S3.

