Abstract
Purpose:
The locus coeruleus (LC) is implicated as an early site of protein pathogenesis in Alzheimer’s disease (AD). Tau pathology is hypothesized to propagate in a prion-like manner along the LC-transentorhinal cortex (TEC) white matter (WM) pathway, leading to atrophy of the entorhinal cortex and adjacent cortical regions in a progressive and stereotypical manner. However, WM damage along the LC-TEC pathway may be an earlier observable change that can improve detection of preclinical AD.
Methods:
Diffusion-weighted magnetic resonance imaging (dMRI) allows reconstruction of WM pathways in-vivo, offering promising potential to examine this pathway and enhance our understanding of neural mechanisms underlying the preclinical phase of AD. However, standard dMRI analysis tools have generally been unable to reliably reconstruct this pathway. We apply a novel method, Geometric-Optics Based Entropy Spectrum Pathways (GO-ESP) and produce a new measure of connectivity: the equilibrium probability (EP).
Results:
We demonstrated reliable reconstruction of LC-TEC pathways in 50 cognitively normal older adults and showed a negative association between LC-TEC EP and CSF tau. Using Human Connectome Project data, we demonstrated replicability of the method across acquisition schemes and scanners. Finally, we compared our findings with the only other existing LC-TEC tractography template, and replicated their pathway as well as investigated the source of these discrepant findings.
Conclusions:
AD-related tau pathology may be detectable within GO-ESP-identified LC-TEC pathways. Further, there may be multiple possible routes from LC to TEC, raising important questions for future research on the LC-TEC connectome and its role in AD pathogenesis.
Keywords: Diffusion MRI, locus coeruleus, tractography, aging, Alzheimer’s disease
Introduction
The locus coeruleus (LC) is a small brainstem nucleus containing norepinephrine-synthesizing neurons that send diffuse projections throughout the central nervous system. LC neurons provide the sole source of norepinephrine—a neurotransmitter critical in arousal and neurocognitive functioning—to the neocortex, hippocampus, cerebellum, and most of the thalamus.1,2 It has been well-established that degeneration of LC neurons is a ubiquitous feature of Alzheimer’s disease (AD),3–6 a debilitating, slowly progressive neurodegenerative disorder that affects more than 50 million people globally (a figure expected to increase to 152 million by 20507). Further, recent histochemistry8–10 and unbiased stereology11,12 studies have suggested that nonfibrillar abnormal tau in the LC may be one of the earliest detectable signs of AD-like neuropathology.
In particular, the white matter (WM) connecting the LC to the transentorhinal cortex (TEC) has gained interest as a potential early predilection pathway of pathologic protein transmission and degeneration in AD.9,13 Indeed, Braak recently modified his original neurofibrillary tangle staging system, which posited that AD tau pathology begins in the medial temporal cortex,14 to instead suggest that the pathologic process may begin in the LC.9 Subsequently, tau pre-tangles are thought to propagate along the LC WM pathway to the TEC in a prion-like manner to initiate the stereotypical spread of tau pathology in AD, damaging neuronal tissue and resulting in reduced connectivity.9 Importantly, tau pathology in LC axonal projections do not appear to result in immediate cell death; rather, LC neurons are known to survive until the latest stages of the disease, albeit with reduced functionality (see Braak and Del Tredici15 for a review on this topic). Thus, changes to the LC-TEC pathway may be observable before gray matter tissue loss in either LC or TEC, highlighting the important potential of the integrity of this pathway as an early, sensitive, and specific biomarker of preclinical AD. Establishing a method to examine the microstructural connectivity of this pathway in-vivo would provide an opportunity to enhance our understanding of the role of the LC in AD pathogenesis, and potentially lead to the discovery of novel markers of AD risk that could aid in diagnostic assessments and inform our understanding of the preclinical period of the disease.
Diffusion-weighted magnetic resonance imaging (dMRI), a powerful tool for characterizing the structural connectome of the brain in both healthy and disease states, offers promise to fulfill this goal. This technique allows for non-invasive and quantitative assessment of in-vivo local tissue microstructure. In the case of cerebral WM, for example, dMRI can be used to estimate WM fiber coherence (the degree to which axons are co-aligned). Further, by using estimates of fiber orientations, dMRI can reconstruct WM fiber pathways via a process called tractography.
Notably, standard dMRI analysis methods have had difficulty with successful reconstruction of WM pathways in regions with complex fiber orientations, such as the brainstem. For this reason, it has been especially challenging to use dMRI to assess the connectivity of the LC-TEC pathway in humans. This difficulty is demonstrated by the fact that a reconstruction of this pathway has only very recently been reported for the first time (two reports from the same senior investigator16,17). Even so, these reconstruction approaches understandably employed tight constraints in the form of groupwise consistency or assumed anatomical priors. Since there is currently no agreed upon ground-truth evidence for the spatial trajectory of this pathway in the human brain, particular care must be taken in applying methods with explicit (or implicit) constraints that may bias the construction of fiber pathways.
Reducing such bias was one of the motivating factors in our development of a general principled probabilistic approach to simultaneously estimate both local diffusion characteristics (e.g., anisotropy) and long-range structural connectivity that capitalizes on prior information within the data itself. This method combines geometrical optics and the theory of entropy spectrum pathways (ESP)18 using a probabilistic formulation, and is called Geometric-Optics Based Entropy Spectrum Pathways (GO-ESP)19.
In this work, we demonstrate a unique approach to reconstructing the LC-TEC fiber pathways by using a much more general, flexible, and less biased characterization of the underlying diffusion data. In this study we applied GO-ESP to a sample of 50 dMRI scans from cognitively normal older adults to obtain a reliable and spatially consistent reconstruction of a LC-TEC WM pathway and examined relationships between connectivity in this pathway and CSF measures of amyloid-beta and tau. We also took advantage of high-resolution data from the Human Connectome Project (HCP) and sought replicability across acquisition schemes by applying GO-ESP to a sample of 5 datasets from the MGH HCP Adult Diffusion release.20 Finally, we compared our findings with those of Xia and Shi16 and Sun et al.,17 who present an alternative spatial trajectory of the LC-TEC pathway. We interpret this observed discrepancy to suggest the presence of multiple possible routes from the LC to the TEC and raise important questions to be answered in future research on the LC-TEC connectome and its putative role in AD pathogenesis.
Theory
Entropy spectrum pathways
GO-ESP takes a novel approach to estimate intravoxel diffusion profiles and intervoxel connectivity, based fundamentally on probability theory and statistical mechanics. This process requires that the description of the data be as general and complete as possible. Toward this goal, rather than calculating a 3D displacement probability density distribution in each voxel, which is expensive in terms of data acquisition, we use spherical wave decomposition (SWD)21 to decompose the signal in each voxel into the sum of spherical harmonics and spherical Bessel functions, rewriting the spin density function in terms of this SWD.
This approach provides a description of the intravoxel diffusion in terms of a clearly defined expansion order which we can use to fit a model of diffusion most optimally. The next problem is how to incorporate the intra- and intervoxel information. Critically, GO-ESP does not estimate the diffusion profile in each voxel independently as if the voxels were structurally isolated from one another; rather, the fundamental quantity that is estimated is the transition probability (TP) between voxels, which is influenced not only by the intravoxel diffusion properties, but also by the intervoxel relationships. This is accomplished using the theory of ESP.18
ESP expands upon the concept of a random walk – a process by which a randomly moving object (or walker) moves away from its starting position. This can also be thought of as a path made of a series of random steps on a lattice. In a generic random walk, a step from one point in any direction is equiprobable. However, consider the situation where some points on the lattice are less accessible than others (perhaps due to structural barriers) – a biased random walk. In this case, a step from one point to any other is not equiprobable but is based on some probability distribution influenced by prior information about the relationship between points. GO-ESP expands this concept to dMRI by using a type of biased random walk called the maximum entropy random walk. In this case, our “points” are dMRI voxels, and the prior information about the relationship between these voxels (i.e., which voxels are more accessible and more likely to be physically connected) takes the form of a coupling matrix which characterizes the intervoxel interactions (in this work, these interactions are computed as the inner product of the full diffusion tensors). Once the coupling matrix is known, the probability of stepping from one voxel to another (the TP) can be calculated. Thus, the TP depends not only on the diffusion profile within each voxel, but the similarity of the diffusion profiles between voxels.
The TPs describe the probabilities of various pathways within the data, or trajectories that a random walker may follow. Over time, biased random walkers will tend to localize in more accessible regions, and this final distribution provides the novel dependent measure of GO-ESP - the equilibrium probability (EP). In other words, regions of higher EP represent locations that are more accessible – there are a greater number of ways that these regions can be reached (higher entropy).
Tractography using geometric optics guided by ESP
Tractography is the process of reconstructing WM tracts from dMRI data. In practice, a set of curves are generated that are mere proxies for actual WM tracts. Nevertheless, we refer to these curves as “tracts”, with this understanding in mind.
As mentioned previously, the local diffusion profiles and long-range connectivity are mathematically coupled through the entropy; this is done by modeling the evolution of probabilities with the Fokker-Planck equation where the path entropy plays the role of an external potential that influences the evolution of probabilities18. This is accomplished by recharacterizing the spatial-temporal characteristics of the probability density in terms of the conservation of probability:
Where the flux, JI, consists of diffusive (Jd = −D∇P) and convective (Jc = −LP∇S) components. S is the entropy, where S(x) = k ln W(x), with x representing spatial location, and W(x) representing the density of states. L is the product of k and D, where k is the Onsanger coefficient and D is the diffusion tensor. By combining these relationships, we can represent the relationship between the local and long-range structure:
This Fokker-Planck equation describes information flow in terms of both diffusion and convection, and a geometric optics-like approach is taken to perform ray tracing through the convective modes. This ray tracing takes the place of traditional tract propagation.19
Eigenmode Imaging
After calculating EP maps, tractography is performed at the level of the whole-brain (Figure 1) or individual pathways (Figure 2), depending on the distribution of seeds, which is decided by the user. Either way, the result is a set of tracts. GO-ESP takes an additional, novel step to calculate pathways of high probability based on these tracts - a technique we call EigenMode Imaging (EMI). Briefly, this method involves calculating the eigensystem of the connectivity matrix constructed from the tracts. The resulting eigenvectors represent the spatial distribution of probability corresponding to the most likely pathways within the entire set of all tracts in a volume of interest. Intuitively, if fiber tracts connecting two endpoints A and B are nearly adjacent throughout their trajectories and therefore form a tight bundle between these points, the resulting eigenvector will be the volume that surrounds the bundle trajectory. For example, in the idealized case that the fibers were packed tightly into a perfect flexible cylinder that curved from point A to point B, the eigenmode would just be that cylindrical volume or ‘tube’. These probability pathways are called tract (or connectivity) eigenmodes and are ranked in decreasing order according to their associated eigenvalues. The eigenvector associated with the largest eigenvalue (the principal eigenvector) corresponds to the most probable probability pathway. While multiple eigenmodes provide interesting information about the structure at different spatial scales in the brain (i.e. potential substructures revealing significant connectivity information), in the present paper we are concerned only with the principal eigenvector, since it represents the major communication pathway between two regions.
Figure 1.
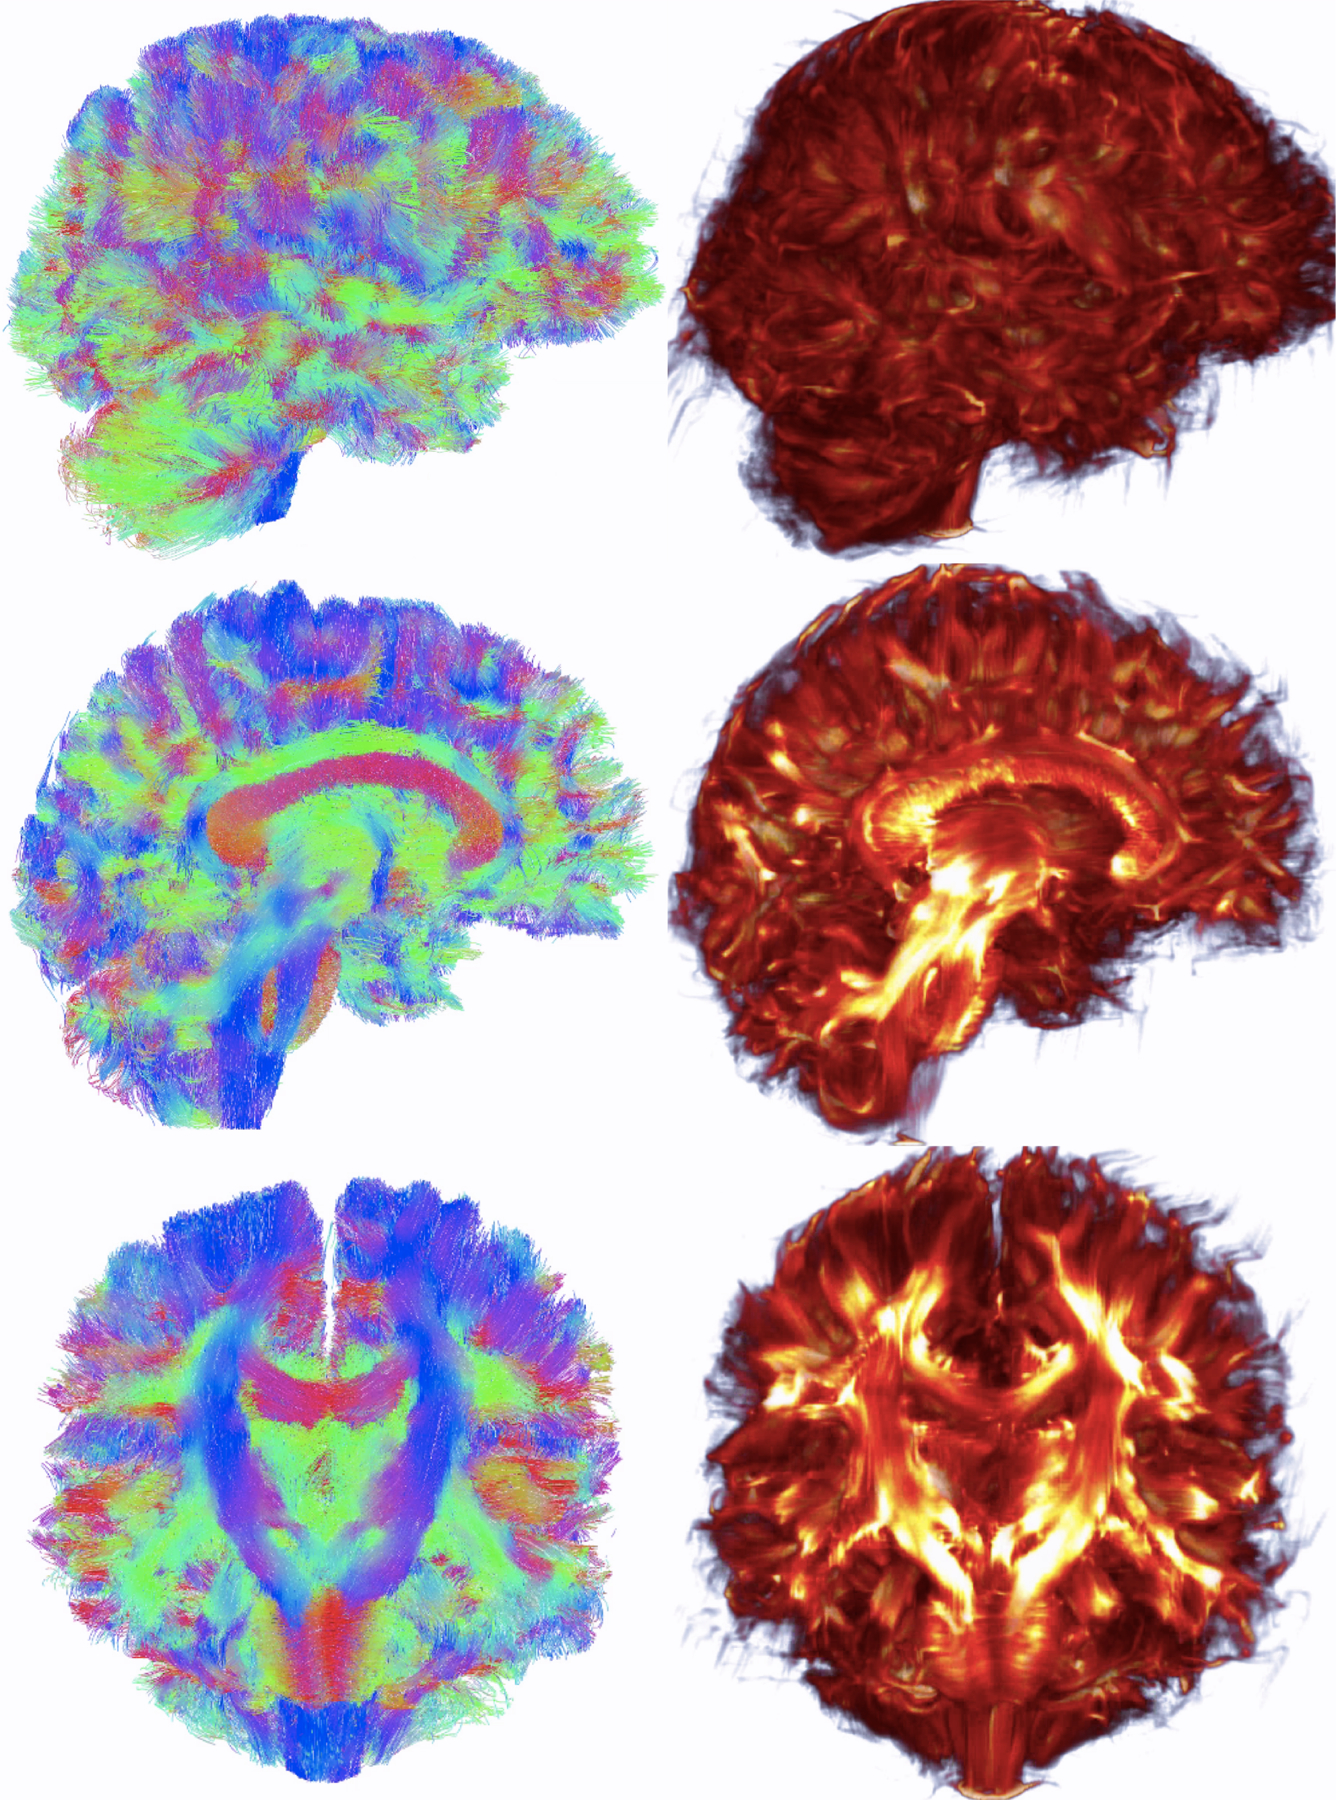
Whole-brain tract vs. eigenmode images. Left: Whole-brain tractography tract results. Right: eigenmode of connectivity matrix. Top: View from right side of brain. Middle: Mid-sagittal sections. Bottom: Coronal sections.
Figure 2.
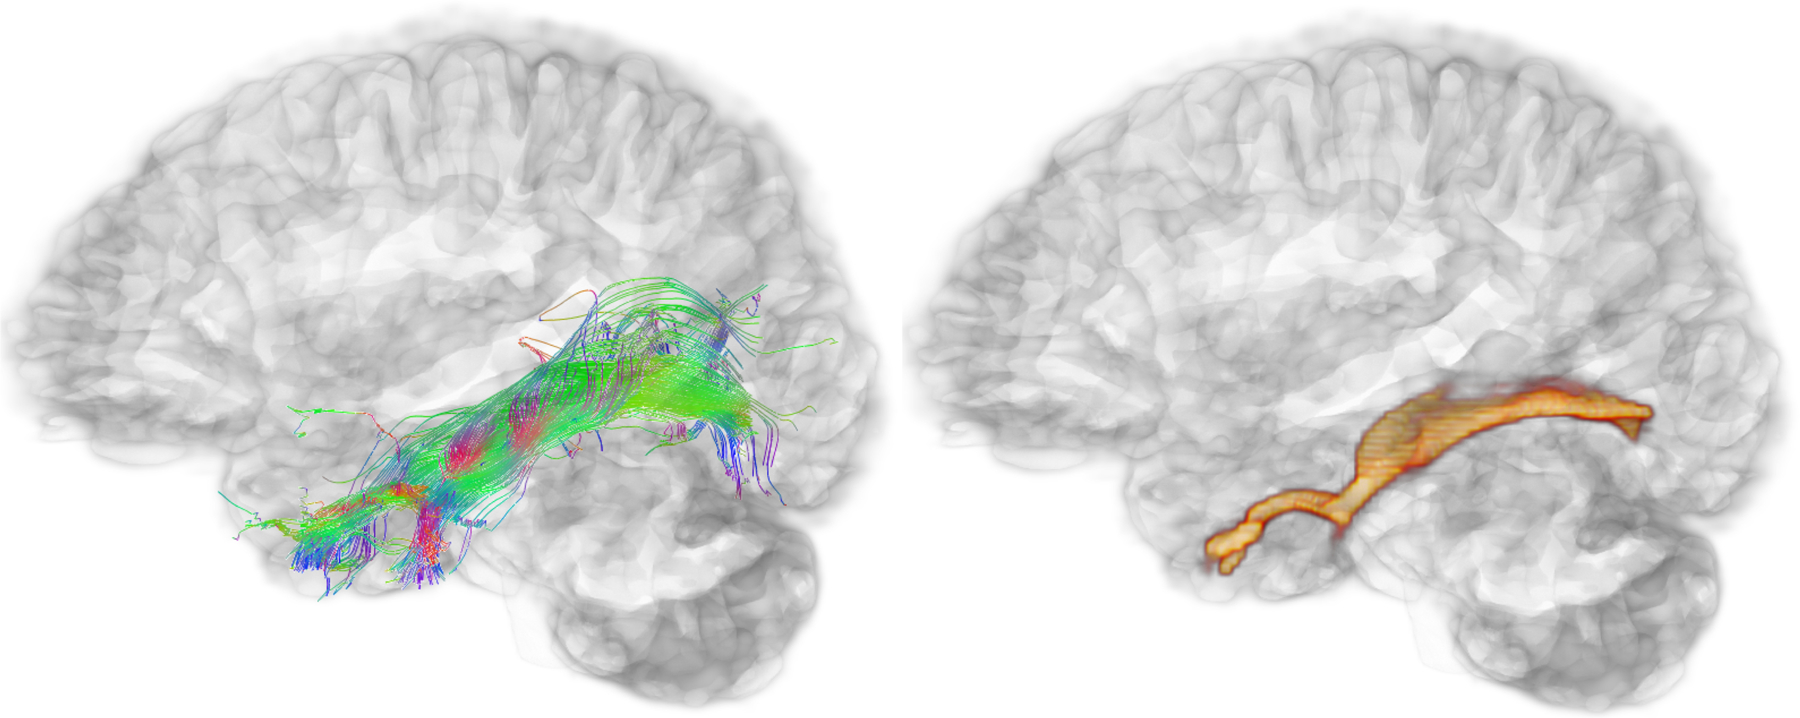
Pathway-specific tract vs. eigenmode images. View from the left side of the brain showing the left inferior longitudinal fasciculus tractography output (left) and corresponding eigenmode image (right).
The computation of tract eigenmodes involves the following steps. The tracts generated from the GO-ESP tractography process are used to generate the connectivity matrix which is of dimensions that are the square of the dimensions of the diffusion dataset. The connectivity matrix records the number of connections from every voxel i to every voxel j where i and j are of dimensions N = nx*ny*nz. This matrix is symmetric, so only N*N/2 elements are needed to store it in full dense form. Even so, the matrix is very large, so we use a sparse representation to store it in the so-called Yale sparse format. The eigenvector/eigenvalue decomposition of the matrix is then performed using the ARPACK package22 that employs the Arnoldi algorithm which can efficiently calculate a subset of eigenvectors. The decomposition of the tractography connectivity matrix into connectivity eigenmodes elucidates and ranks neural connections at multiple spatial scales from the highly complex tractography in a well-defined quantitative, and reproducible procedure.
A visualization of whole-brain tractography and subsequent principle EMI can be seen in Figure 1. An example reconstruction of a specific and well-studied pathway, the inferior longitudinal fasciculus, and its resulting principle EMI can be seen in Figure 2.
Methods
Participants
This study included data from 53 cognitively normal older adults as part of an ongoing study of quantitative neuroimaging metrics of LC connectivity in AD pathogenesis and progression. This study was approved by the University of California, San Diego (UCSD) Institutional Review Board, with written informed consent obtained on all participants.
MRI Acquisition
Scans were performed on a 3 Tesla GE Discovery MR750 scanner at the UCSD Center for Functional MRI using a 32-channel head coil (Nova Medical Inc, Wilmington MA).
Whole-brain dMRI scans were collected using a novel Extended Hybrid Sense EPI acquisition23; data were simultaneously acquired with both polarities of the phase encoding gradient to perform TOPUP gradient and eddy current distortion correction, which was done in offline specialized reconstruction routines that implemented the FMRIB Software Library’s (FSL) Eddy and TOPUP tools24–26 directly within the image reconstruction.23 Multiple diffusion-weighted shells were collected at b-values of 1000, 2000, and 3000s/m2 with the number of directions being 30, 45, and 60, respectively. The data acquisition parameters were: slice thickness=2mm, FOV=20cm, TE=119ms, TR=4.0s, matrix size=100×100×72. Using a SENSE factor of 4, the imaging time was approximately 13 minutes. This is a standard dMRI gradient sampling scheme. Therefore, findings generated from this study are a result of the analysis, not the acquisition, and should be replicable across datasets.
Cerebrospinal Fluid Biomarkers
A subset of our participants (n = 20) underwent lumbar punctures as part of participation in the UCSD Alzheimer’s Disease Research Center with standardization of procedures, preanalytical preparation, and storage of CSF and plasma as previously described27, and in accordance with recommended best practices28. In brief, CSF (15–25 mL) was collected by routine lumbar puncture early in the morning after overnight fasting. Samples were processed, aliquoted into 500 μL fractions in polypropylene microtubes, snap frozen, and stored at −80°C until assayed. All samples were analyzed locally using the automated Lumipulse platform using assays developed with established monoclonal antibodies (Fujirebio Inc)29. The majority of lumbar punctures were conducted within one year of the MRI visit (n = 11), although we included data collected within two (n = 2), three (n = 5), and four (n = 2) years of the visit given research showing the stability of CSF biomarkers over several years30 in an effort to maximize our sample size. CSF measures of Aβ40, Aβ42, total tau, and phosphorylated tau (p-tau) were obtained.
Preprocessing and Quality Assessment
FSL (v.6.025) was used to correct for inter-volume head motion (eddy; b-vectors adjusted for correction26) and remove skull and other non-brain tissue (BET31). Data were resampled to a 1mm3 resolution using our novel registration tool, Symplectomorphic Registration with Phase Space Regularization (SYMREG32).
Quality control consisted of visual inspection for slice-wise signal dropout, image noise, and shifts of head placement between diffusion volumes. Scans were excluded if they had single slices of signal dropout affecting 10 or more diffusion directions, multiple slices of signal dropout on 5 or more diffusion directions, color banding evident in the RGB display of the primary eigenvector image, visible nods or head shakes between diffusion directions, or visible image noise.
GO-ESP diffusion estimation and tractography
For each subject, GO-ESP was used to calculate EP maps, and FSL’s dtifit33 was used to calculate FA maps for comparison to a more commonly used metric. To reconstruct the LC-TEC WM connections, we used GO-ESP to generate tracts intersecting two regions of interest (ROIs): a publicly available LC map,34 and the anterior division of the parahippocampal gyrus, meant to approximate the transentorhinal cortex (TEC), extracted from the Harvard-Oxford cortical structural atlas in FSL (HarvardOxford-cort-maxprob-thr50–1mm). Only the most anterior lateral portion of the anterior parahippocampal gyrus ROI was used to maintain specificity of generated tracts (Figure 3, middle panel). As both ROIs were created in standard Montreal Neurological Institute (MNI) coordinate space, SYMREG32 was used to register each participant’s EP map to the “MNI152_T1_1mm_brain” map from the template in FSL. These registrations were used to transform the ROIs from MNI coordinate space into each subject’s native diffusion space, in which tractography was performed.
Figure 3.
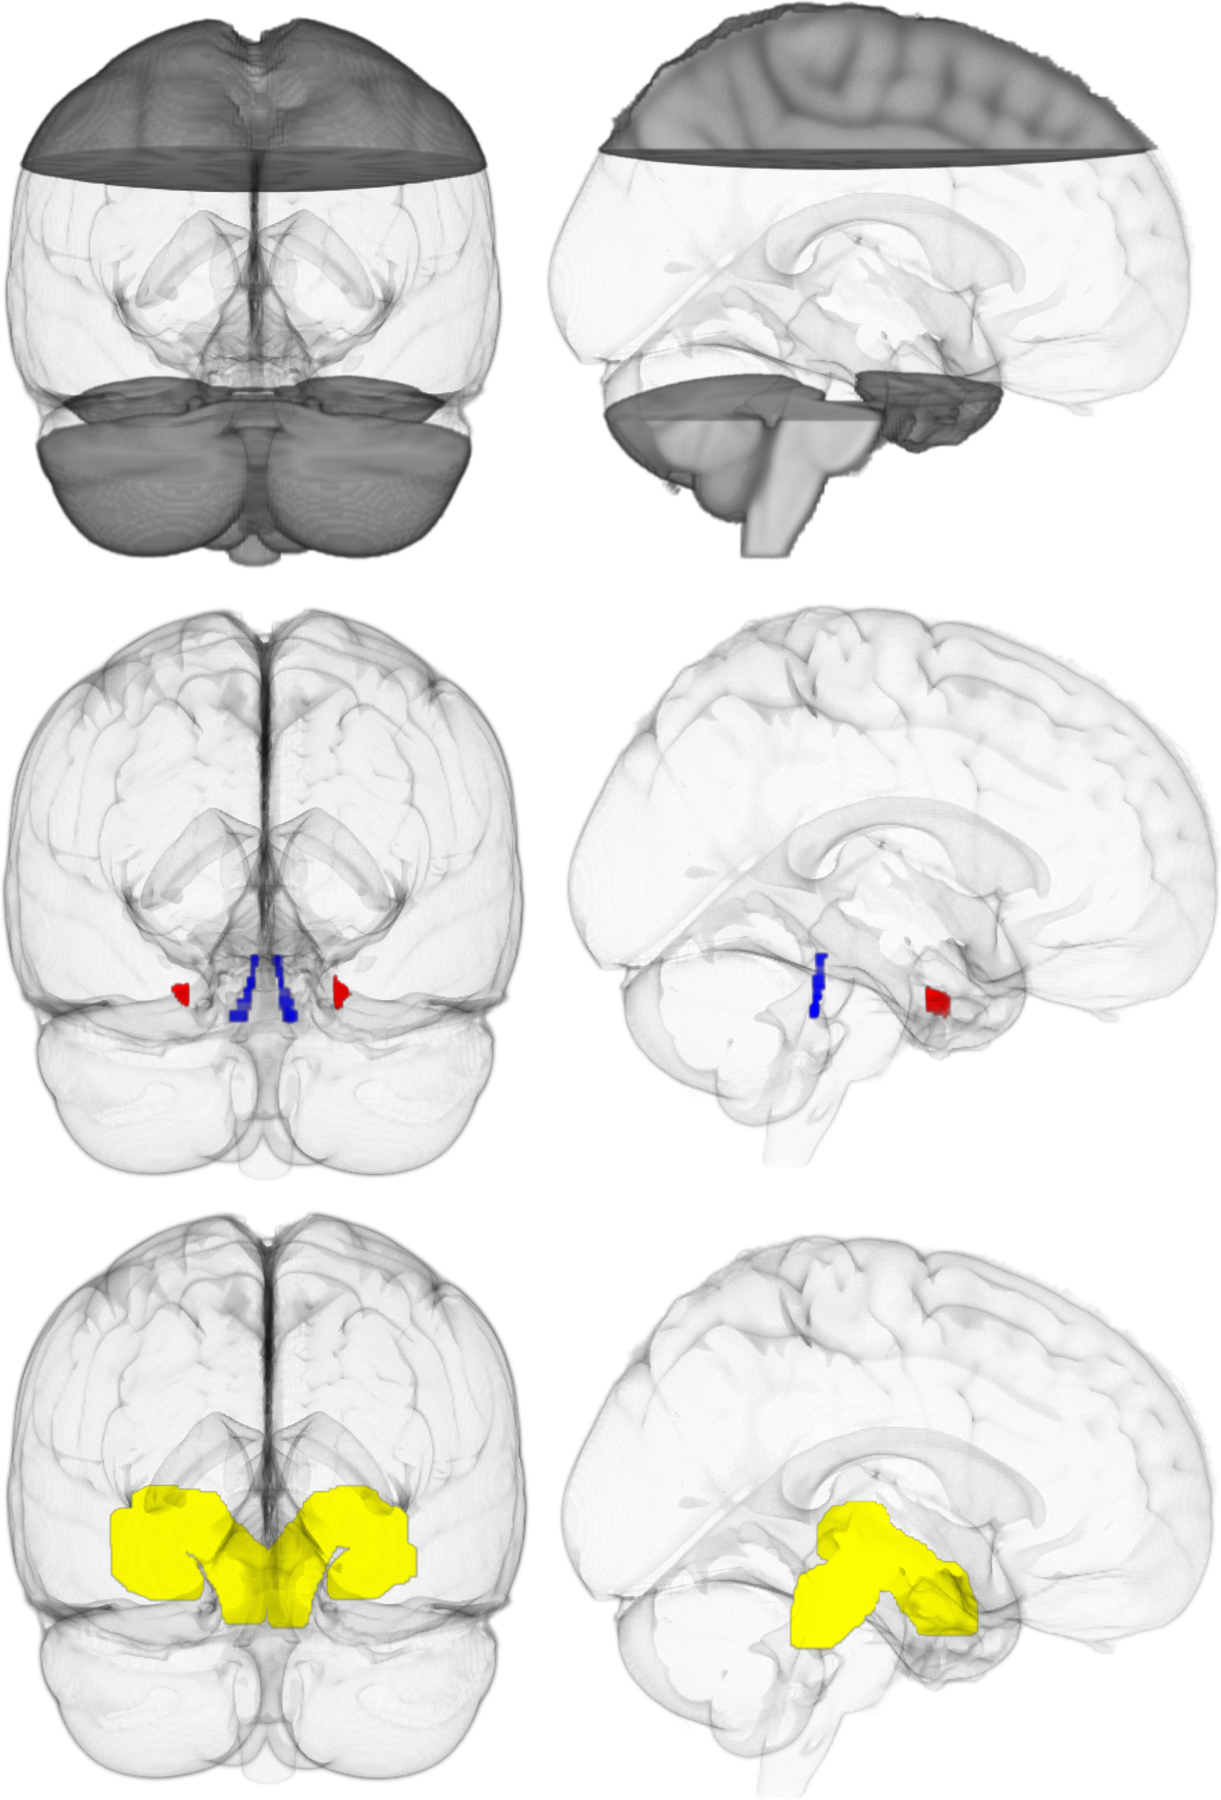
Regions of interest. Top: Clear region indicates the ”widely-distributed” seed region. Middle: Inclusion regions in MNI space. Locus coeruleus (blue) and transentorhinal cortex (red). Bottom: Spatially-weighted seed regions (yellow). Left: View from back of brain. Right: View from right side of brain.
Tractography was performed in two ways. Seeds were first distributed within a boxed region encapsulating the portion of the brain most likely to contain the LC-TEC pathway, excluding only the top part of the cerebral cortex and the brain below the ROIs; this was done instead of distributing seeds throughout the entire brain for efficiency (xyz coordinates in MNI space 0–200, 0–200, 0–142; Figure 3, top panel). Only tracts that intersected both ROIs were kept (Figure 3, middle panel). We refer to this strategy as “widely-distributed” seeding. Next, to increase the spatial consistency of output between subjects, we took the principle eigenmode of a representative LC-TEC pathway reconstruction using widely-distributed seeds, and binarized and dilated this region to obtain a mask that could be used as a more “spatially-weighted” seeding region (Figure 3, bottom panel). In this approach, seeds are still distributed throughout the boxed region described above, but placement is weighted more heavily within the “spatially-weighted” mask. As before, only tracts that intersected both ROIs were kept. For both analyses, two million starting seeds were randomly distributed throughout the seed regions, and tracking was only permitted to pass through regions where the EP was at least 0.5 (this value corresponds reliably with the location of WM). For efficiency and consistency, we have restricted our analyses to the principle eigenmode of the resulting connectivity matrix for all datasets.
To generate masks for visualization and statistical analyses, we applied a threshold to the tract EMIs. The EMIs generated from tractography are automatically normalized so that the sum of all included voxels is equal to one, where higher values correspond with a higher probability. To exclude voxels with the lowest probability of belonging to the pathway, we kept only those highest value voxels whose intensities sum to 0.9. This technique ensures a level of within-subject anatomical consistency. These thresholded EMIs were binarized and used for the statistical analyses as well as visualization in Figs. 5 and 8.
Statistical Analysis
For each participant, we computed the average of left and right LC-TEC pathway EP and FA. To examine associations between average bilateral LC-TEC EP and FA with CSF measures of amyloid (Aβ42/Aβ40), total tau, and p-tau, we performed Pearson’s partial correlations controlling for age.
Replication in HCP datasets
To examine replicability across datasets with different acquisition parameters, we repeated our analysis technique on a sample of 5 randomly selected dMRI datasets from the HCP, which provides multi-shell dMRI at an isotropic resolution of 1.5mm.35,36 We used data from the MGH HCP Adult Diffusion release of 35 young adults.20 These data were collected on a customized MGH Siemens 3 Tesla Connectome scanner, which has 300 mT/m maximum gradient strength for diffusion imaging. Multiple diffusion-weighted shells were collected at b-values of 1000, 2000, 3000, 5000, and 10000s/mm2 with the number of directions being 64, 64, 128, 128, 128, respectively. The data acquisition parameters were: slice thickness=1.5mm, FOV=210×210mm, TR/TE=8800/57ms, matrix size=140×140. The total acquisition time was approximately 89 minutes.
The downloaded HCP data were already minimally preprocessed using tools from Freesurfer V5.3.037 and FSL V5.0.25 Scans were corrected for gradient nonlinearity, bulk head motion,38 and eddy current distortions (b-vectors adjusted for correction26). The only additional preprocessing steps we performed were removal of non-brain tissue using FSL’s BET31 and resampling to a 1mm3 resolution using SYMREG32 to be consistent with our processing scheme. We then applied tractography as before, using the spatially-weighted seeding strategy described above (Figure 3, bottom).
Comparison with previous LC-TEC tractography reports
Because a previous reconstruction of the LC-TEC pathway has been reported16,17 and differs in spatial trajectory from ours (see results; we refer to this as the “medial” pathway to distinguish from the GO-ESP generated pathway), the last stage of our analysis was an exploratory investigation into the source of this discrepancy. Sun et al.17 employed different diffusion estimation and tractography algorithms (state-of-the-art spherical deconvolution and FOD-based probabilistic tractography39), as well as a different, two-stage seeding approach. They first used an amygdala mask as a target ROI to track from the LC, along with a dilated thalamus inclusion ROI and a ventral tegmental area (VTA) exclusion ROI. They then used this output as a mask to track toward the TEC, again using the thalamus inclusion and VTA exclusion ROIs. Thus, we aimed to investigate whether the spatial discrepancy was due to differences in the dMRI algorithms and/or seeding strategies.
To accomplish this, we first applied our spatially-weighted seeding approach, but used the LC-TEC probabilistic atlas generated from Sun et al.17 as a seeding mask rather than the LC-TEC mask from our own data. Next, we applied their seeding strategy in GO-ESP. Then, we compared GO-ESP with spherical deconvolution and FOD-probabilistic tractography in MRtrix340, first replicating the approach of Sun et al.17, and then tracking simply from LC to TEC without additional ROI constraints. Finally, we explored whether we could use GO-ESP to extract the medial pathway within our data, first by examining lower-ranked eigenmodes within our previously-generated tractography output, and then by experimenting with different seeding strategies.
To compare the potential ability to detect AD-related pathology within this medial pathway versus the GO-ESP generated pathway, we registered the medial pathway provided in the publicly available atlas17 to each subject’s native diffusion space, extracted the average EP within this region, and performed additional correlations with CSF biomarkers.
Results
Sample characteristics
The initial pool of data consisted of 53 dMRI scans from cognitively normal older adults. Three scans were excluded during quality inspection. The remaining 50 participants were predominantly women (n=38), with an average age of 73.92 years (range: 62–85, standard deviation = 6.02). Our sample had an average of 15.96 years of education (range: 12–20, standard deviation = 2.11), and was mostly white (n = 44) and non-Hispanic/Latino (n = 45) (See Supporting Information Table S1).
Reconstruction of LC-TEC tracts
Diffusion estimation and tractography were performed using both seeding strategies described above (“widely-distributed” and “spatially-weighted”). Of these, 49 were initially successful (see Figure 4 for example from a representative subject using the spatially-weighted seeding strategy); one participant had failed tractography on the right side. Further inspection revealed a cranial nerve that appeared very bright on the EP map and appeared to connect the brainstem with the medial temporal lobe, resulting in tracts that incorrectly crossed over before the temporal lobe connects with the midbrain. This nerve was manually removed from the EP map, and the tractography was re-run successfully.
Figure 4.

Representative LC-TEC pathway reconstruction using the spatially-weighted seeding strategy. 3D output of principle eigenmode of the LC-TEC tractography connectivity matrix from a representative subject. Left: view from back of brain. Middle left: View of left side of brain. Middle right: View of right side of brain. Right: View from top of brain.
Slice-wise maps demonstrating inter-subject spatial consistency of the principle LC-TEC EMIs generated from GO-ESP are shown in Figure 5. The thresholded EMIs for all participants were registered to standard MNI space, binarized, and summed to create the inter-subject spatial consistency maps (Figure 5). Importantly, no threshold was set for the number of participants having overlapping output in a given voxel, so these maps do not represent a best-case scenario but reveal the full extent of EMI output across participants. While the overall spatial trajectories of the pathways generated using the two seeding strategies were very similar, using a more spatially-weighted seeding strategy resulted in more anatomical consistency between subjects (Figure 5).
Figure 5.
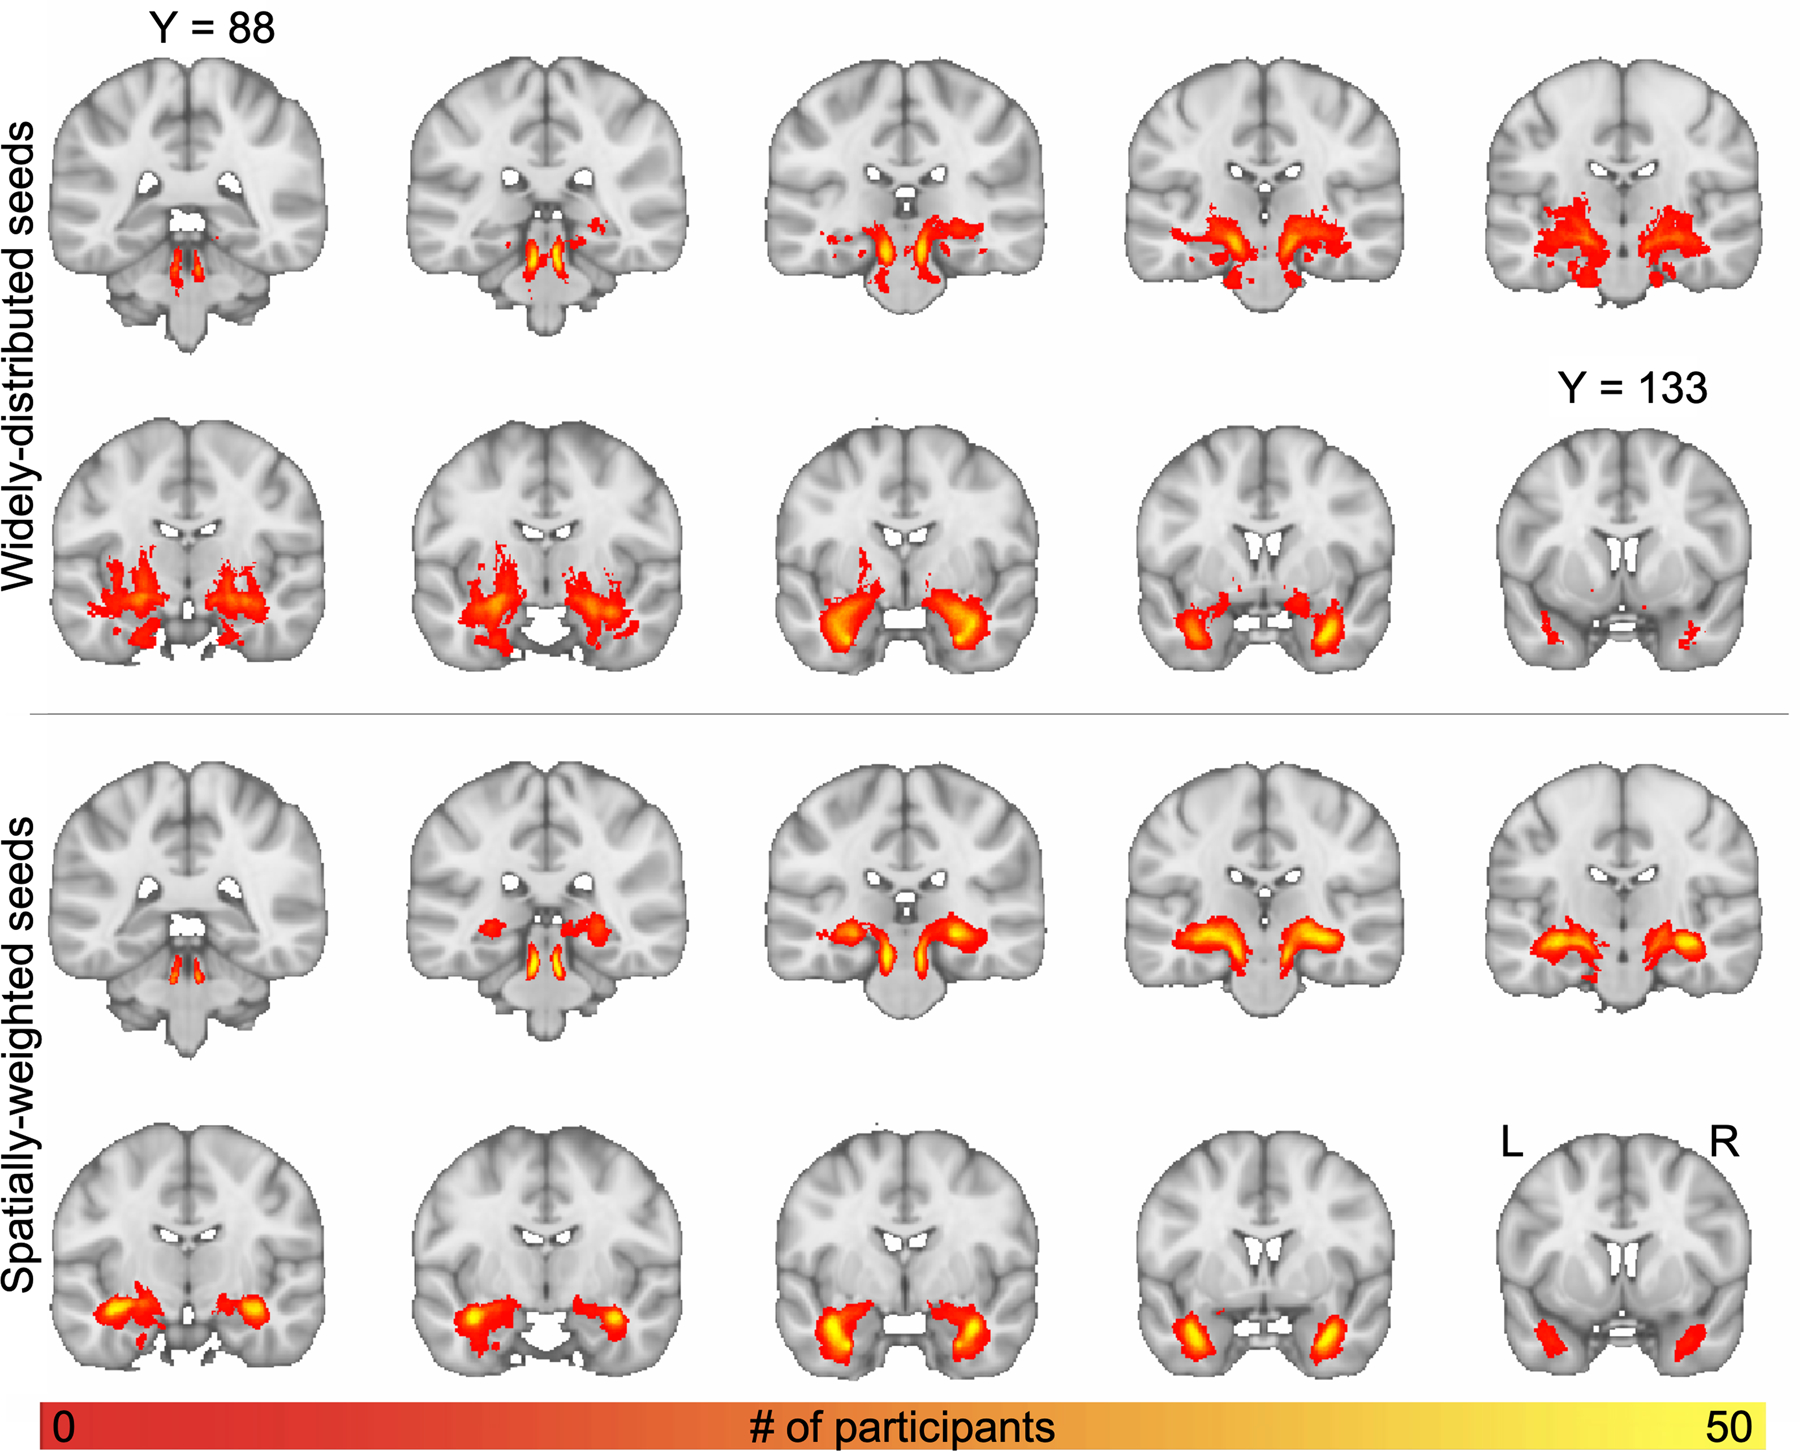
Groupwise spatial frequency map of LC-TEC pathway reconstruction. Top: output generated using widely distributed seeds; bottom: output generated using spatially-weighted seeds. Individual participants’ thresholded principle EMIs were registered to MNI space, binarized, and summed. The intensity represents the number of subjects that had output in each respective voxel.
Associations between LC-TEC Pathway EP and CSF Biomarkers
Twenty of our participants had CSF biomarker data available. Averages and ranges of CSF biomarker data can be found in Supporting Information Table S1. Average bilateral LC-TEC EP was significantly negatively associated with CSF p-tau (r = −0.538, p = 0.018), and was positively, but not significantly, associated with Aβ42/Aβ40 (r = 0.416, p = 0.076). Average bilateral LC-TEC FA was significantly negatively correlated with CSF total tau (r = −0.645, p = 0.003) and p-tau (r = −0.479, p = 0.038), but not Aβ42/Aβ40 (r = 0.037, p = 0.882). Average EP within the bilateral medial pathway was not associated with any CSF biomarkers (Figure 6).
Figure 6.
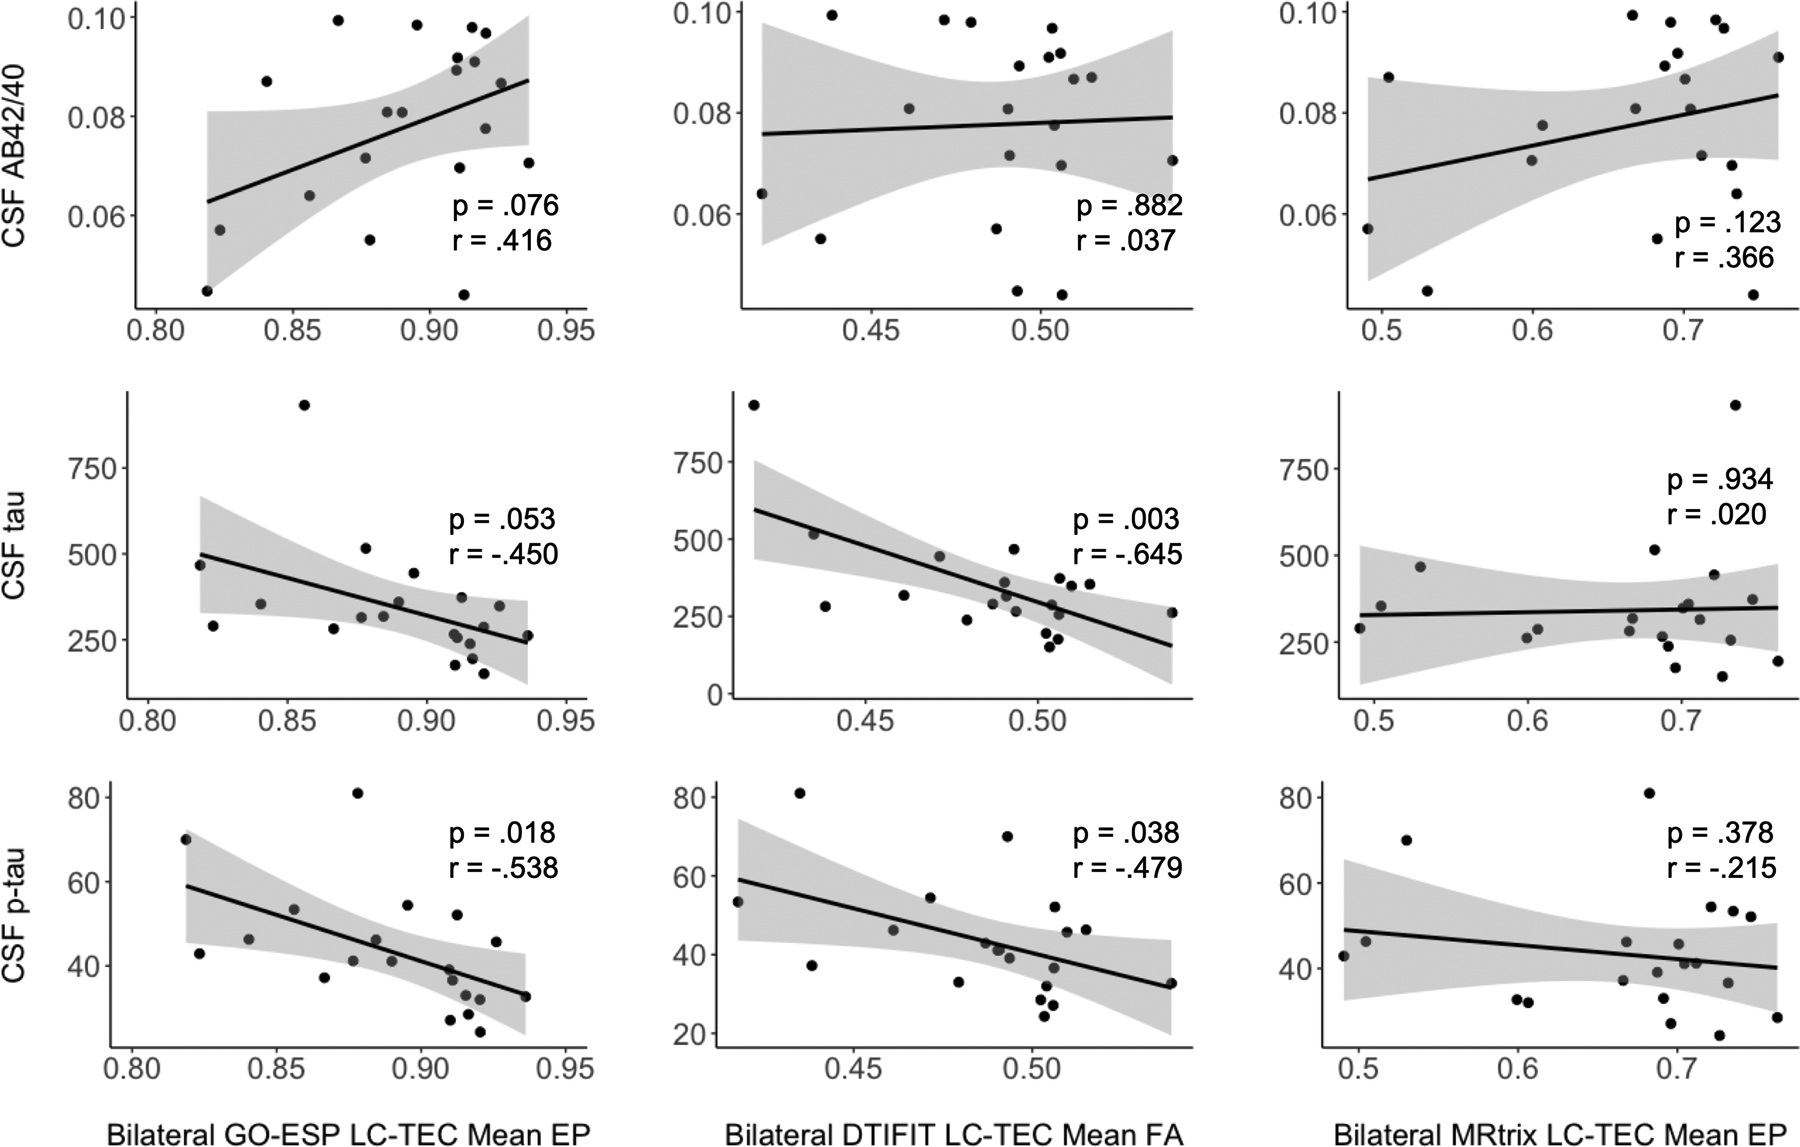
Associations between LC-TEC connectivity metrics and CSF biomarkers. Pearson’s partial correlations were used, controlling for age. Average bilateral LC-TEC EP is significantly negatively correlated with CSF p-tau (r = −0.538, p = 0.018; bottom left). Average bilateral LC-TEC FA is significantly negatively correlated with CSF total tau (r = −0.645, p = 0.003; middle middle) and p-tau (r = −0.479, p = 0.038; bottom middle). Average bilateral medial path EP is not significantly correlated with any CSF biomarkers.
Replication in HCP datasets
Diffusion estimation and tractography were performed using an identical processing pipeline as above for 5 sample HCP subjects, using the spatially-weighted seeding strategy that provided the most consistent output in our data. The reconstructions were anatomically consistent among all subjects (Figure 7). Further, the spatial trajectory of these reconstructions resembled the output generated from our data (Figure 4). Figures 4 and 7 provide three-dimensional representations of the spatial trajectory of the LC-TEC pathway as shown in the slice-wise group frequency maps in Figure 5. Together, these results demonstrate consistency between both individual datasets, as well as between different participant characteristics (i.e., age), acquisition schemes, and MRI machines (GE vs. Siemens).
Figure 7.
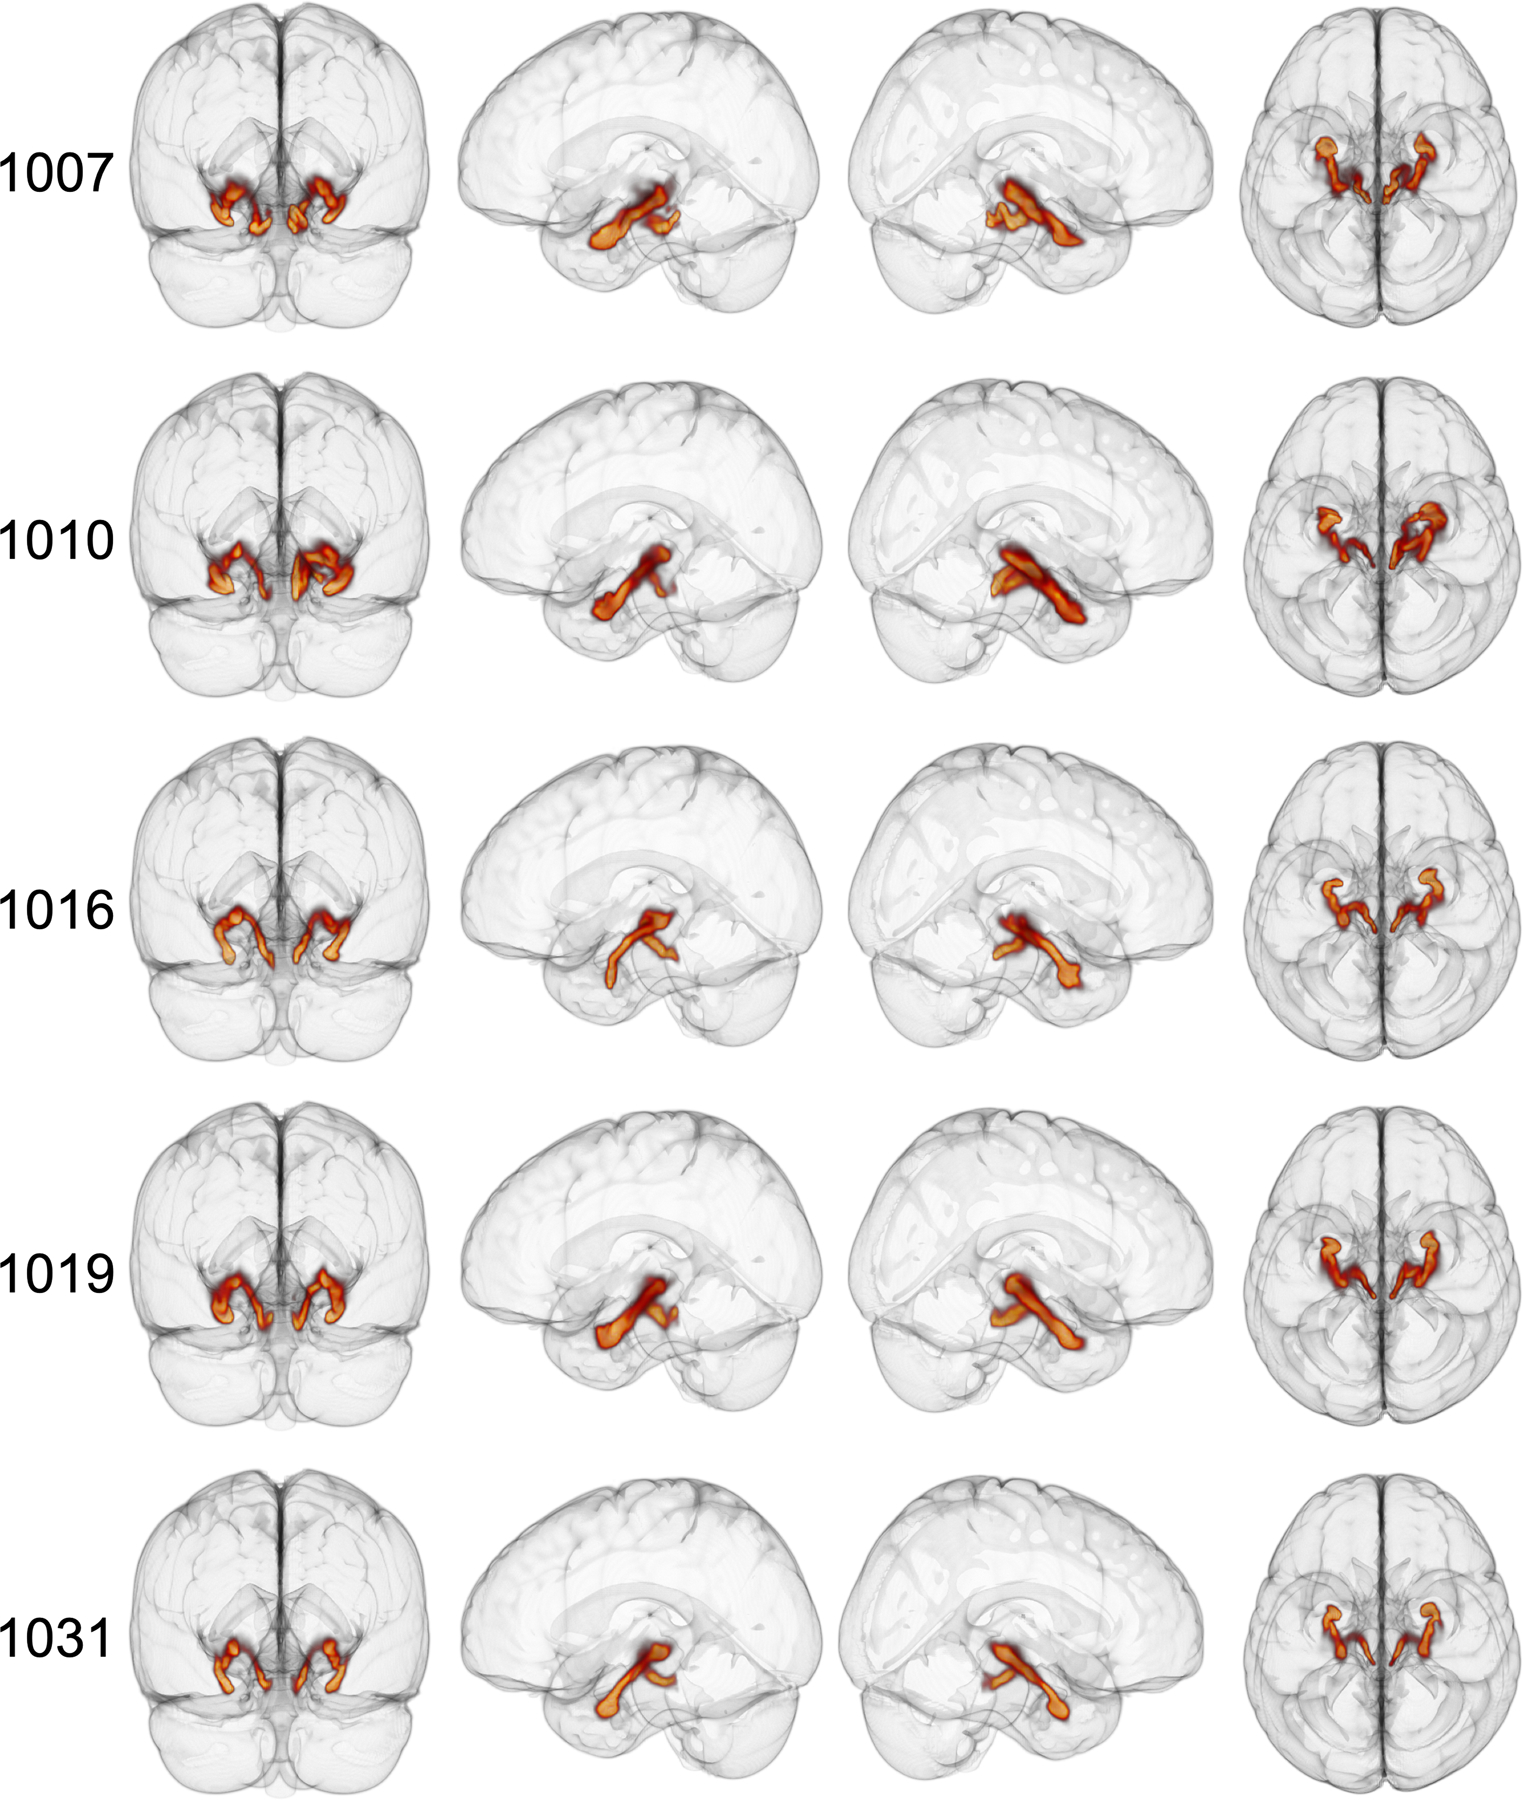
3D LC-TEC principle EMIs for 5 HCP participants using the spatially-weighted seeding strategy. Left: view from back of brain. Middle left: View of left side of brain. Middle right: View of right side of brain. Right: view from top of brain.
Comparison with previous LC-TEC tractography reports
Because reconstruction of the LC-TEC pathway has been reported previously,16,17 we investigated the spatial similarity of these previous results to our own. Strikingly, our results differ significantly in terms of spatial trajectory. While the LC-TEC map generated by Xia and Shi16 and Sun et al.17 stays medial and proximal to the thalamus before turning into the TEC, our LC-TEC map makes the turn from the brainstem into the TEC much sooner (Figure 8). This notable difference prompted us to investigate whether this discrepancy was due to differences in analysis algorithms and/or seeding strategies.
Figure 8.
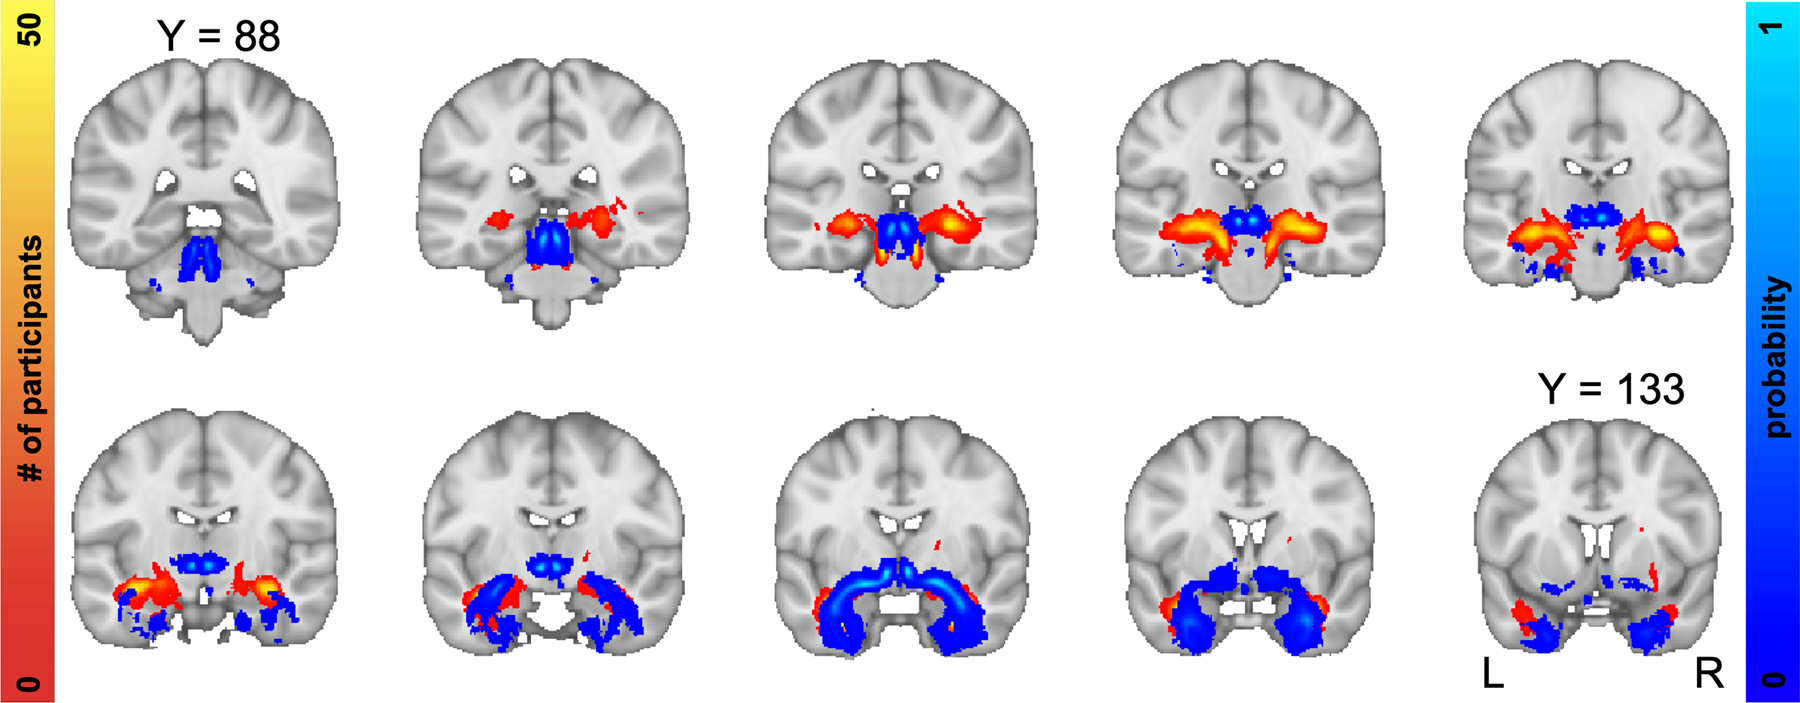
Comparison of our results using the spatially-weighted seeding strategy (in red) with LC-TEC pathway probabilistic atlas from Sun et al. (2020) (in blue).
First, we used GO-ESP and applied our spatially-weighted seeding approach, but used the LC-TEC probabilistic atlas generated from Sun et al.17 as a seeding mask rather than the LC-TEC mask from our own data. Interestingly, the resulting EMIs resembled the pathway we consistently see with our approach rather than the medial pathway (Figure 9A). Next, we used GO-ESP but applied the seeding strategy from Sun et al.17. Again, the resulting EMIs resembled that of our own findings rather than the medial pathway (Figure 9B). Next, we replicated the approach of Sun et al.17 and used the spherical deconvolution and FOD tractography tools in MRtrix3, along with their two-stage seeding approach, and unsurprisingly replicated their medial pathway (Figure 9C). Interestingly, when we used MRtrix3 to track from the LC seed ROI with only the TEC as an inclusion ROI, the resulting pathway resembled the medial tract from Sun et al.17 (Figure 9D). Taken together, these comparative results suggest that the difference in spatial trajectory between our pathway and that of Sun et al.17 looked to be due to the different dMRI analysis algorithms rather than choice of ROIs and seeding strategies.
Figure 9.
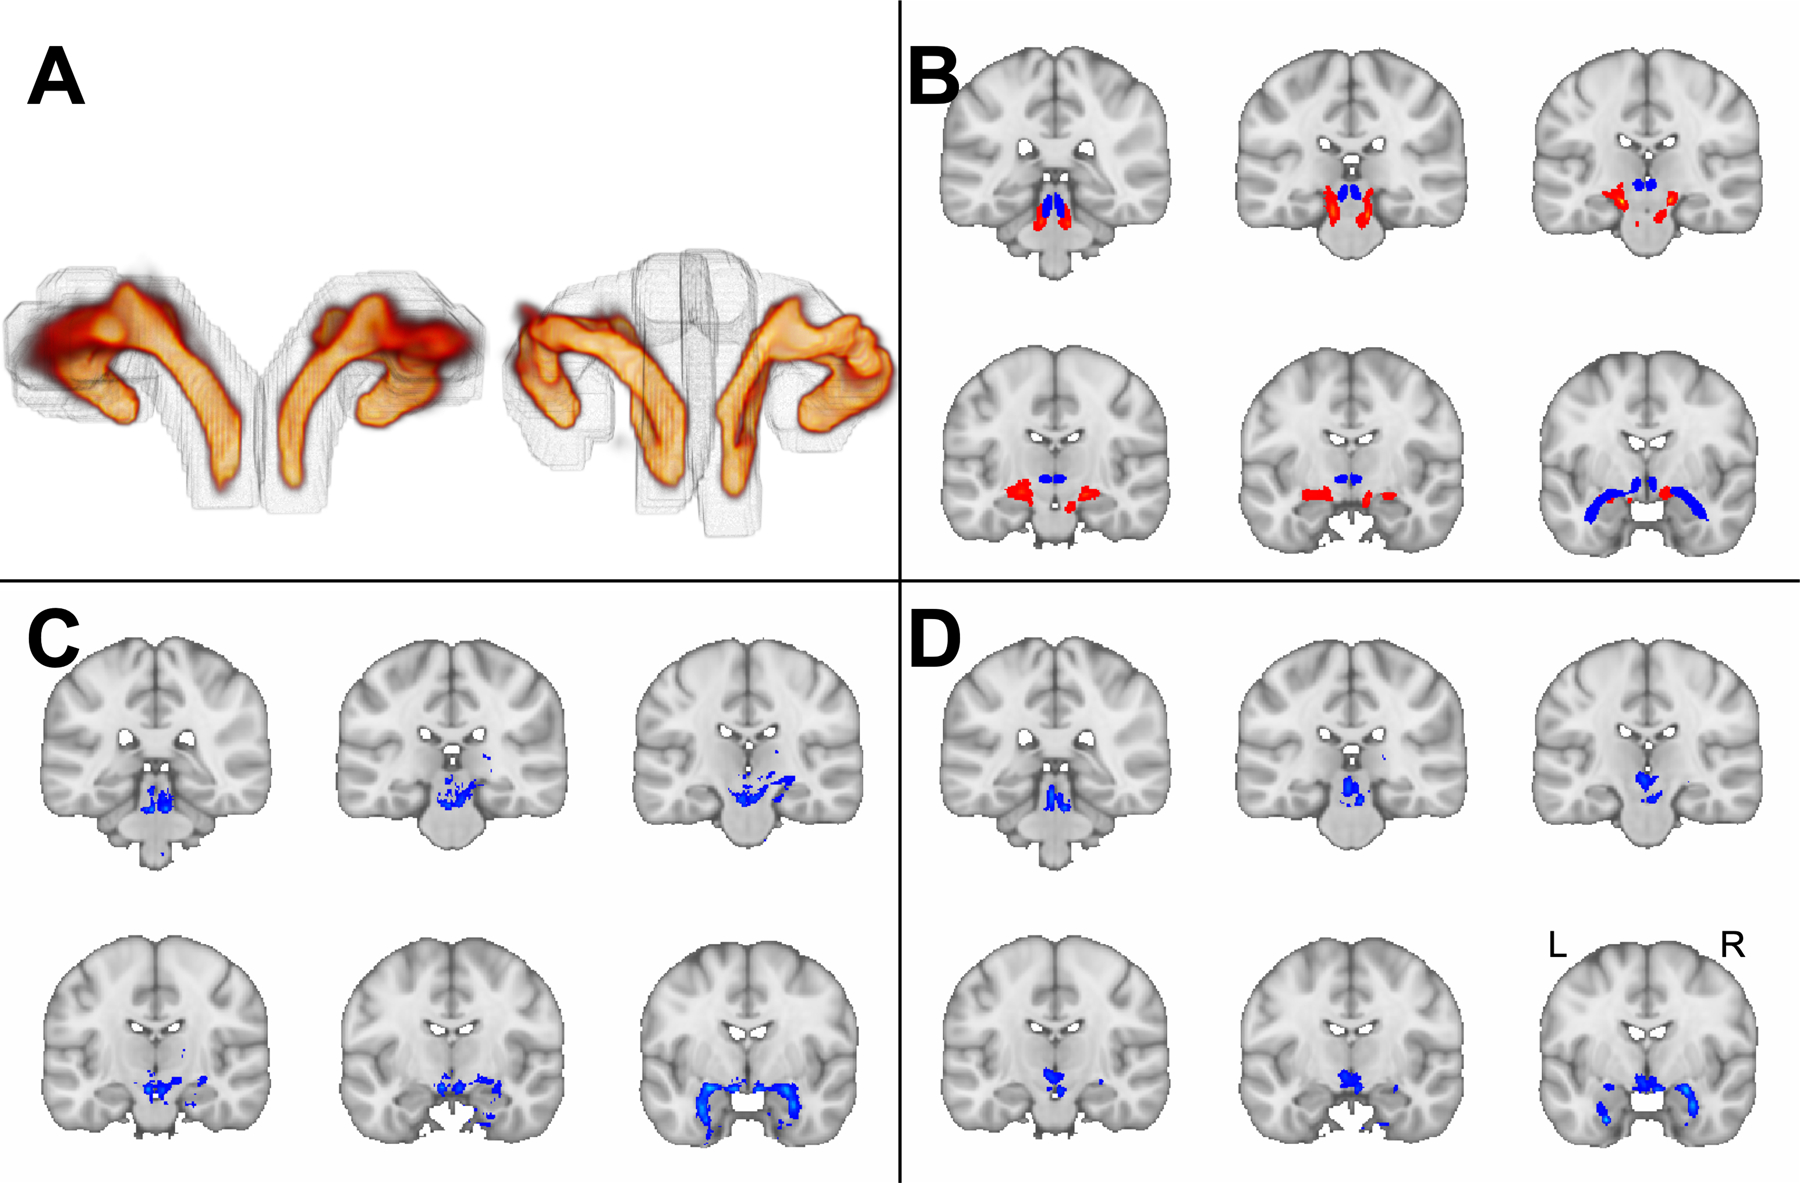
Comparison of GO-ESP with state-of-the-art approach. A: 3D view of GO-ESP generated pathways from the back of brain. Left: principle EMI generated using our spatially-weighted seeding region (grey outline). Right: principle EMI generated using dilated mask of medial pathway from Sun et al. (2020) as seeding region (grey outline). B: Red: principle EMI generated from GO-ESP using LC, amygdala, and dilated thalamus as inclusion regions and VTA as an exclusion region. Blue: medial track from Sun et al. (2020). C: Replication of medial pathway in MRtrix using seeding approach from Sun et al. (2020). D: Generation of medial pathway in MRtrix seeding from LC and using the TEC as the only inclusion region.
Finally, we explored whether we could extract the medial pathway using GO-ESP. We examined some of the lower-ranked eigenmodes from our tractography results, wherein we markedly observed a similar pathway from output generated using the widely-distributed seeding strategy in one HCP subject (Figure 10A). However, this finding appeared to be sporadic, so we next tried different seeding approaches to more reliably extract the medial path. First, we used the most anterior-medial portion of an amygdala ROI as an additional seeding region. This consistently resulted in EMIs closer to the midline, but still not quite resembling that of Sun et al.17 (Figure 10B). We then tried using 2-dimensional disc-shaped ROIs right along the midline, encompassing the most anterior-medial portion of the LC-TEC atlas generated by Sun et al.17 This consistently resulted in EMIs more closely resembling the medial pathway (Figure 10C).
Figure 10.
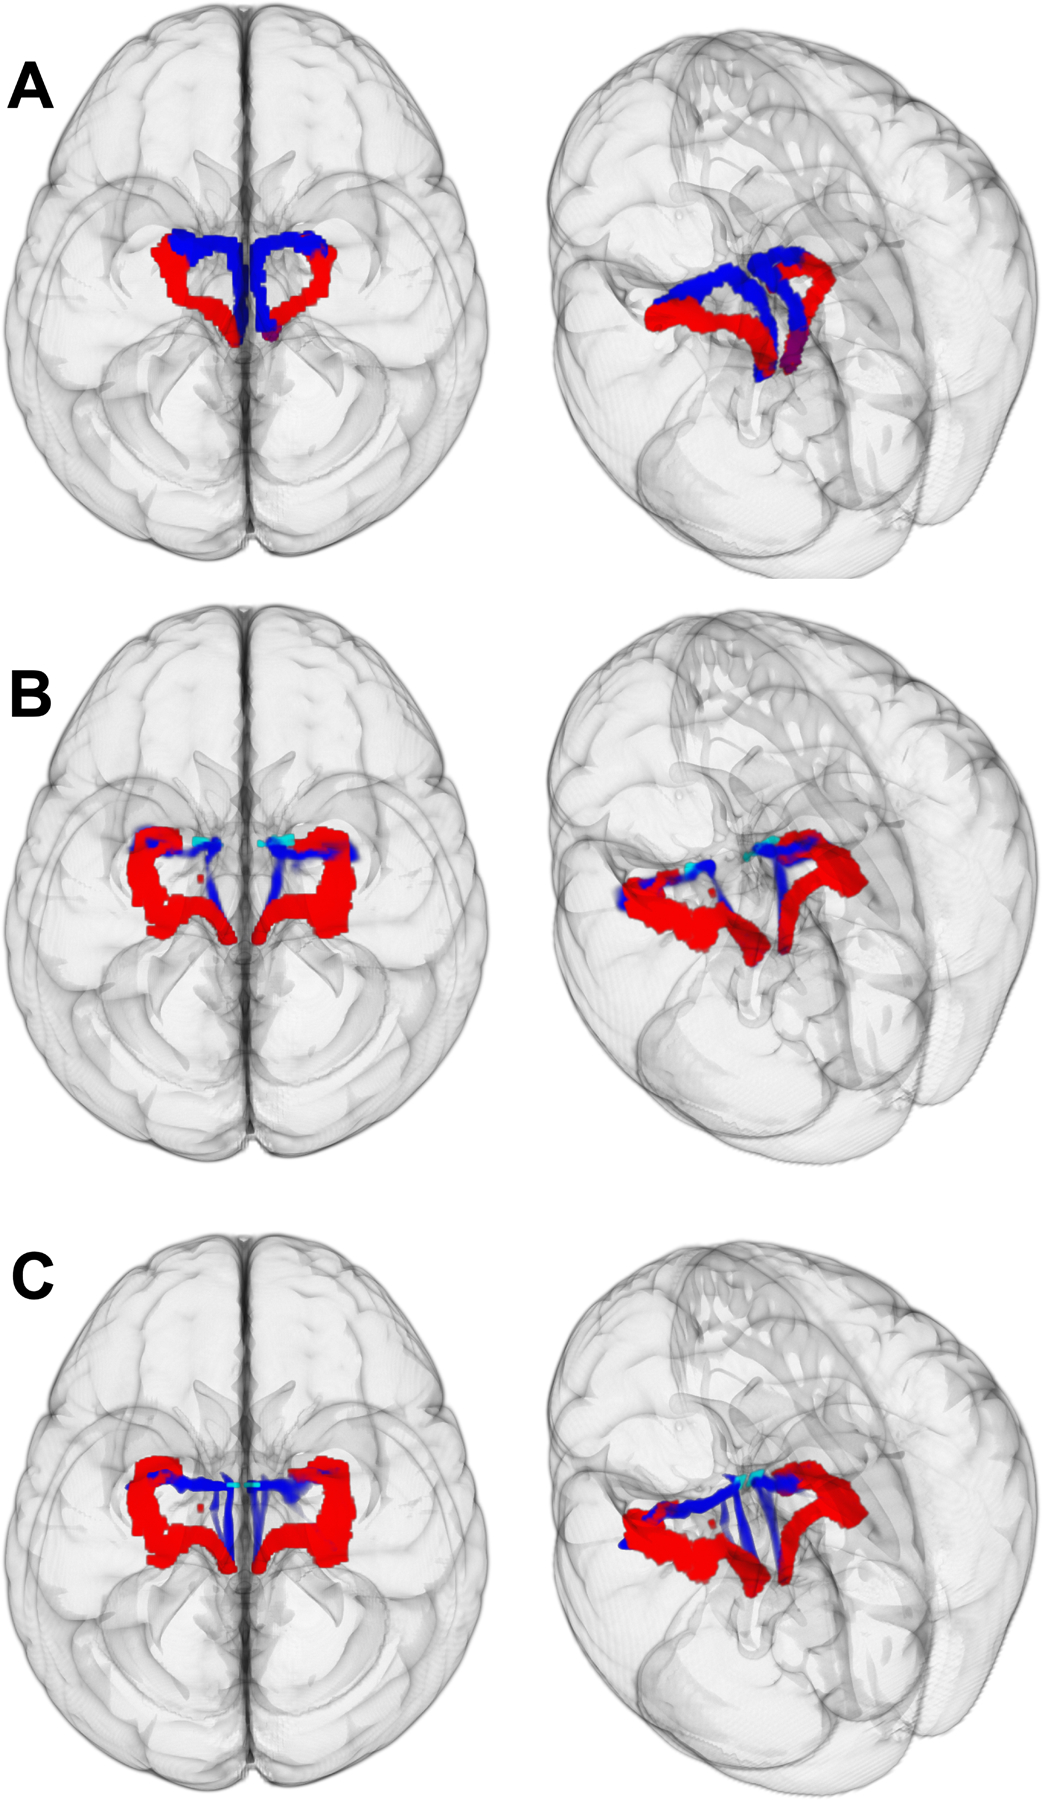
Extracting “medial” pathway using GO-ESP in HCP subjects. Left: View from top of brain. Right: View from top left angle. A: extraction of both pathways with widely-distributed seeding strategy. Red: principle EMI. Blue: 3rd EMI for left hemisphere, and 2nd EMI for the right hemisphere. B: Red: principle GO-ESP generated EMI. Blue: principle GO-ESP generated EMI using anterior-medial amygdala (light blue) as additional seeding region. C: Red: principle GO-ESP generated EMI. Blue: principle GO-ESP generated EMI using a medial disc ROI (light blue) encompassing the anterior-medial portion of pathway from Sun et al. (2020).
Discussion
Diffusion-weighted MRI is the best available tool for in-vivo examination of WM pathways in the human brain. Despite significant progress in dMRI acquisition and analysis techniques, there remain significant limitations in standard analysis methodologies that ultimately limit its clinical utility. The application to tractography in the LC-TEC complex discussed in this paper, a crucial pathway for its putative role in the initiation and progression of AD pathologic changes, highlights the central issue: the difficulty in accurately reconstructing pathways passing through regions with complex fiber orientation distributions. GO-ESP was developed with a motivation to improve upon some of these difficulties, and takes a novel mathematical approach to the problem based fundamentally on probability theory.18,19 We have applied this technique to reconstruct the LC-TEC pathway in a sample of cognitively normal older adults, and a subsample with varying degrees of underlying AD biomarkers, to provide feasibility of in-vivo examination of this important tract in the pathophysiology of AD.
Interestingly, our results show moderate to large negative associations between both LC-TEC pathway EP and FA with CSF measures of p-tau protein accumulation. This relationship is consistent with the assumption that higher CSF tau signifies neurodegeneration, as it is thought that tau-mediated neurofibrillary tangles leak out of dying neurons and diffuse into the CSF. We did not see significant associations between LC-TEC pathway EP or FA with CSF amyloid, although the effect size for the positive association between EP and amyloid was moderate, while that for the FA-amyloid relationship was weak. Thus far, these findings suggest that FA and EP may have similar ability to detect microstructural tau pathology, although EP might have additional sensitivity to detect amyloid pathology. Of course, further investigations with much larger sample sizes are needed to support these hypotheses. Notably, EP computation depends on parameters such as length sensitivity, so it is possible that the calculation can be further optimized to be more sensitive to particular pathology, a worthy avenue of future research. Further, while our results apply only to cognitively normal older individuals, given the evidence for feasibility of LC-TEC tracking in our study and other studies, future investigations will assess the integrity of this pathway in the context of AD, including associations with cognitive decline or other AD biomarkers. Such findings would have implications for an improved understanding of the earliest pathologic changes in AD and may highlight future treatment targets to prevent the spread of pathology prior to the clinical manifestation of dementia.
As noted above, only one other group has published a tractography reconstruction of the LC-TEC pathway in two different reports.16,17 Xia and Shi16 reconstructed the right LC-TEC pathway which required ad hoc tract-filtering depending on group-wise consistency, which, while helping to generate more consistent and anatomically feasible tracts in this case, has the potential to compromise the ability to capture individual or between-group differences in WM structure and may overall reduce the sensitivity of the analysis. In addition, Sun et al.17 used a tract-filtering algorithm based on topographic regularity,41 which produced spatially consistent output between datasets without making assumptions about inter-individual consistency, but employed strict anatomical priors in order to obtain a clean and reliable reconstruction. GO-ESP makes minimal assumptions about the data and no assumptions about the fiber structure.
Interestingly, our results differed in terms of spatial trajectory. We performed several iterations of testing to demonstrate that this discrepancy arose from inherent differences in the choice of dMRI analysis algorithms rather than from the choice of ROIs and seeding strategies (Figure 9). Indeed, even when using minimal seeding and inclusion ROIs (only LC and TEC) with the state-of-the-art MRtrix3 tools, we still obtained a pathway resembling that of Sun et al.17, whereas using the more restrictive seeding strategy (LC, amygdala, thalamus, VTA, and TEC) with GO-ESP still resulted in a more lateral pathway (Figure 5).
A major limitation of all of these studies, including our own, is that the true anatomy of the human LC-TEC pathway is not well described as post-mortem mapping of the posited projections from brainstem LC nuclei have proven quite difficult. While the pathway has been characterized using anatomical tracing methods in rodents42,43, we have no evidence from which to base the spatial trajectory of this pathway in humans. Braak and Del Tredici15 further note that the LC-TEC pathway takes its greatest form only in higher primates, so rodent anatomical work specifying the LC-TEC pathway trajectory may have a paucity of connectivity and be relatively unhelpful. Sun et al.17 state in their report that they are currently collecting high-resolution dMRI of post-mortem human brain tissue and plan to compare with expert delineations on slices of the same tissue to assess the accuracy of the reconstruction. This will be a critical next step to determine what anatomical constraints may or may not be appropriate for accurate reconstruction of the LC-TEC pathway(s). Thus, without a ground truth knowledge of the true anatomy of LC-TEC connections, we posit that both of these pathways could potentially be true. Indeed, it is possible that the two pathways represent alternative routes from the LC to the TEC, as having all projections from the LC to the TEC pass through the amygdala could be problematic from a functional standpoint. In the interim, we believe the option of imposing the fewest assumptions and constraints onto the analyses is a more conservative strategy, and our conservative approach offers an alternative option for an LC-TEC pathway. Indeed, the fact that we are able to detect associations between EP and AD-related CSF biomarkers within the GO-ESP generated pathway and not the medial pathway supports the efficacy of our approach.
In summary, GO-ESP and EMI provide a unique opportunity to obtain more general, less biased descriptions of putative neural fiber tracts from data acquired using standard dMRI acquisition schemes by coupling local diffusion and long-range connectivity information. Using these tools, we have demonstrated consistent tractography of a pathway within a highly complex neuroanatomical region where the limitations of standard analysis methods become the most apparent. This work was carried out in the context of a wider research focus on AD, as the LC-TEC pathway has been implicated as an early region of disease-related pathologic transmission.9 Indeed, we have shown that AD-related pathology may be detectable within GO-ESP derived LC-TEC WM pathways. This study serves as a proof-of-concept that we can reliably reconstruct this pathway, and paves the way for future efforts to apply these techniques to a clinical sample with the goals of exploring how microstructural characteristics of the LC-TEC pathway differ along the aging-AD continuum and how they relate to other markers of AD pathology.
Supplementary Material
Supporting Information Table S1. Sample characteristics. Demographic, cognitive, and CSF biomarker measurements.
Acknowledgements
The authors would like to thank Thomas Lesperance, M.S. at CSCI for his work on the graphical user interface and visualization of results, and Aaron Jacobson, M.A. at CFMRI for assistance in the collection of the data. Finally, we especially thank all those who participated in the study. This work was supported by the National Science Foundation (NSF) Graduate Research Fellowship Program under Grant Nos. DGE-2038238 (SKS) and DGE-1650112 (AJW), and NSF grant ACI-1550405 (LRF and VLG). Any opinions, findings, and conclusions or recommendations expressed in this material are those of the author(s) and do not necessarily reflect the views of the NSF. This work was also supported by NIH awards R01AG054049 (LRF, MWB, and VLG), R01AR070830 (LRF and VLG), and R01HD088437 (LRF), and University of California MPRI award MRP17454755 (LRF and VLG). Data were provided [in part] by the Human Connectome Project, MGH-USC Consortium (Principal Investigators: Bruce R. Rosen, Arthur W. Toga and Van Wedeen; U01MH093765) funded by the NIH Blueprint Initiative for Neuroscience Research grant; the National Institutes of Health grant P41EB015896; and the Instrumentation Grants S10RR023043, 1S10RR023401, 1S10RR019307. HCP data are disseminated by the ConnectomeDB database from the HCP neuroinformatics infrastructure.
References
- 1.Foote SL, Bloom FE, Aston Jones G. Nucleus locus ceruleus: New evidence of anatomical and physiological specificity. Physiol Rev. 1983. doi: 10.1152/physrev.1983.63.3.844 [DOI] [PubMed] [Google Scholar]
- 2.Nagai T, Satoh K, Imamoto K, Maeda T. Divergent projections of catecholamine neurons of the locus coeruleus as revealed by fluorescent retrograde double labeling technique. Neurosci Lett. 1981. doi: 10.1016/0304-3940(81)90027-6 [DOI] [PubMed] [Google Scholar]
- 3.Bondareff W, Mountjoy CQ, Roth M. Loss of neurons of origin of the adrenergic projection to cerebral cortex (nucleus locus ceruleus) in senile dementia. Neurology. 1982. doi: 10.1212/wnl.32.2.164 [DOI] [PubMed] [Google Scholar]
- 4.Mann DM, Yates PO, Hawkes J. The noradrenergic system in Alzheimer and multi-infarct dementias. J Neurol Neurosurg Psychiatry. 1982. doi: 10.1136/jnnp.45.2.113 [DOI] [PMC free article] [PubMed] [Google Scholar]
- 5.Mann DMA, Yates PO, Marcyniuk B. A comparison of changes in the nucleus basalis and locus caeruleus in Alzheimer’s disease. J Neurol Neurosurg Psychiatry. 1984. doi: 10.1136/jnnp.47.2.201 [DOI] [PMC free article] [PubMed] [Google Scholar]
- 6.Tomlinson BE, Irving D, Blessed G. Cell loss in the locus coeruleus in senile dementia of Alzheimer type. J Neurol Sci. 1981. doi: 10.1016/0022-510X(81)90031-9 [DOI] [PubMed] [Google Scholar]
- 7.Alzheimer’s Disease International. World Alzheimer Report 2019: Attitudes to Dementia. Alzheimer’s Dis Int London. 2019. [Google Scholar]
- 8.Andrés-Benito P, Fernández-Dueñas V, Carmona M, et al. Locus coeruleus at asymptomatic early and middle Braak stages of neurofibrillary tangle pathology. Neuropathol Appl Neurobiol. 2017. doi: 10.1111/nan.12386 [DOI] [PubMed] [Google Scholar]
- 9.Braak H, Thal DR, Ghebremedhin E, Tredici K Del. Stages of the Pathologic Process in Alzheimer Disease : Age Categories From 1 to 100 Years. J Neuropathol Exp Neurol. 2011;70(11):960–969. doi: 10.1097/NEN.0b013e318232a379 [DOI] [PubMed] [Google Scholar]
- 10.Grudzien A, Shaw P, Weintraub S, Bigio E, Mash DC, Mesulam MM. Locus coeruleus neurofibrillary degeneration in aging, mild cognitive impairment and early Alzheimer’s disease. Neurobiol Aging. 2007. doi: 10.1016/j.neurobiolaging.2006.02.007 [DOI] [PubMed] [Google Scholar]
- 11.Ehrenberg AJ, Nguy AK, Theofilas P, et al. Quantifying the accretion of hyperphosphorylated tau in the locus coeruleus and dorsal raphe nucleus: the pathological building blocks of early Alzheimer’s disease. Neuropathol Appl Neurobiol. 2017. doi: 10.1111/nan.12387 [DOI] [PMC free article] [PubMed] [Google Scholar]
- 12.Theofilas P, Ehrenberg AJ, Dunlop S, et al. Locus coeruleus volume and cell population changes during Alzheimer’s disease progression: A stereological study in human postmortem brains with potential implication for early-stage biomarker discovery. Alzheimer’s Dement. 2017;13(3):236–246. doi: 10.1016/j.jalz.2016.06.2362 [DOI] [PMC free article] [PubMed] [Google Scholar]
- 13.Braak H, Del Tredici K. Where, when, and in what form does sporadic Alzheimer’s disease begin? Curr Opin Neurol. 2012;25(6):708–714. doi: 10.1097/WCO.0b013e32835a3432 [DOI] [PubMed] [Google Scholar]
- 14.Braak H, Braak E. Neuropathological stageing of Alzheimer-related changes. Acta Neuropathol. 1991. doi: 10.1007/BF00308809 [DOI] [PubMed] [Google Scholar]
- 15.Braak H, Del Tredici K. The preclinical phase of the pathological process underlying sporadic Alzheimer’s disease. Brain. 2015. doi: 10.1093/brain/awv236 [DOI] [PubMed] [Google Scholar]
- 16.Xia Y, Shi Y. Groupwise track filtering via iterative message passing and pruning. Neuroimage. 2020;221(July):117147. doi: 10.1016/j.neuroimage.2020.117147 [DOI] [PMC free article] [PubMed] [Google Scholar]
- 17.Sun W, Tang Y, Qiao Y, et al. A probabilistic atlas of locus coeruleus pathways to transentorhinal cortex for connectome imaging in Alzheimer’s disease. Neuroimage. 2020. doi: 10.1016/j.neuroimage.2020.117301 [DOI] [PMC free article] [PubMed] [Google Scholar]
- 18.Frank LR, Galinsky VL. Information pathways in a disordered lattice. Phys Rev E - Stat Nonlinear, Soft Matter Phys. 2014. doi: 10.1103/PhysRevE.89.032142 [DOI] [PMC free article] [PubMed] [Google Scholar]
- 19.Galinsky VL, Frank LR. Simultaneous multi-scale diffusion estimation and tractography guided by entropy spectrum pathways. IEEE Trans Med Imaging. 2015. doi: 10.1109/TMI.2014.2380812 [DOI] [PMC free article] [PubMed] [Google Scholar]
- 20.Fan Q, Witzel T, Nummenmaa A, et al. MGH-USC Human Connectome Project datasets with ultra-high b-value diffusion MRI. Neuroimage. 2016. doi: 10.1016/j.neuroimage.2015.08.075 [DOI] [PMC free article] [PubMed] [Google Scholar]
- 21.Galinsky VL, Frank LR. Automated segmentation and shape characterization of volumetric data. Neuroimage. 2014;92:156–168. doi: 10.1016/j.neuroimage.2014.01.053 [DOI] [PMC free article] [PubMed] [Google Scholar]
- 22.Lehoucq RB, Sorensen DC, Yang C. ARPACK Users’ Guide. Society for Industrial and Applied Mathematics; 1998. doi: 10.1137/1.9780898719628 [DOI] [Google Scholar]
- 23.Zahneisen B, Aksoy M, Maclaren J, Wuerslin C, Bammer R. Extended hybrid-space SENSE for EPI: Off-resonance and eddy current corrected joint interleaved blip-up/down reconstruction. Neuroimage. 2017;153:97–108. doi: 10.1016/j.neuroimage.2017.03.052 [DOI] [PubMed] [Google Scholar]
- 24.Andersson JLR, Skare S, Ashburner J. How to correct susceptibility distortions in spin-echo echo-planar images: Application to diffusion tensor imaging. Neuroimage. 2003. doi: 10.1016/S1053-8119(03)00336-7 [DOI] [PubMed] [Google Scholar]
- 25.Smith SM, Jenkinson M, Woolrich MW, et al. Advances in functional and structural MR image analysis and implementation as FSL. In: NeuroImage.; 2004. doi: 10.1016/j.neuroimage.2004.07.051 [DOI] [PubMed] [Google Scholar]
- 26.Andersson JLR, Sotiropoulos SN. An integrated approach to correction for off-resonance effects and subject movement in diffusion MR imaging. Neuroimage. 2016. doi: 10.1016/j.neuroimage.2015.10.019 [DOI] [PMC free article] [PubMed] [Google Scholar]
- 27.Xiao M-F, Xu D, Craig MT, et al. NPTX2 and cognitive dysfunction in Alzheimer’s Disease. Elife. 2017;6. doi: 10.7554/eLife.23798 [DOI] [PMC free article] [PubMed] [Google Scholar]
- 28.Vanderstichele H, Bibl M, Engelborghs S, et al. Standardization of preanalytical aspects of cerebrospinal fluid biomarker testing for Alzheimer’s disease diagnosis: a consensus paper from the Alzheimer’s Biomarkers Standardization Initiative. Alzheimers Dement. 2012;8(1):65–73. doi: 10.1016/j.jalz.2011.07.004 [DOI] [PubMed] [Google Scholar]
- 29.Kaplow J, Vandijck M, Gray J, et al. Concordance of Lumipulse cerebrospinal fluid t-tau/Aβ42 ratio with amyloid PET status. Alzheimers Dement. 2020;16(1):144–152. doi: 10.1002/alz.12000 [DOI] [PMC free article] [PubMed] [Google Scholar]
- 30.Lleó A, Alcolea D, Martínez-Lage P, et al. Longitudinal cerebrospinal fluid biomarker trajectories along the Alzheimer’s disease continuum in the BIOMARKAPD study. Alzheimers Dement. 2019;15(6):742–753. doi: 10.1016/j.jalz.2019.01.015 [DOI] [PubMed] [Google Scholar]
- 31.Smith SM. Fast robust automated brain extraction. Hum Brain Mapp. 2002. doi: 10.1002/hbm.10062 [DOI] [PMC free article] [PubMed] [Google Scholar]
- 32.Galinsky VL, Frank LR. Symplectomorphic registration with phase space regularization by entropy spectrum pathways. Magn Reson Med. 2019. doi: 10.1002/mrm.27402 [DOI] [PMC free article] [PubMed] [Google Scholar]
- 33.Jenkinson M, Beckmann CF, Behrens TEJ, Woolrich MW, Smith SM. FSL. Neuroimage. 2012;62(2):782–790. doi: 10.1016/j.neuroimage.2011.09.015 [DOI] [PubMed] [Google Scholar]
- 34.Keren NI, Lozar CT, Harris KC, Morgan PS, Eckert MA. In vivo mapping of the human locus coeruleus. Neuroimage. 2009;47(4):1261–1267. doi: 10.1016/j.neuroimage.2009.06.012 [DOI] [PMC free article] [PubMed] [Google Scholar]
- 35.Setsompop K, Kimmlingen R, Eberlein E, et al. Pushing the limits of in vivo diffusion MRI for the Human Connectome Project. Neuroimage. 2013. doi: 10.1016/j.neuroimage.2013.05.078 [DOI] [PMC free article] [PubMed] [Google Scholar]
- 36.McNab JA, Edlow BL, Witzel T, et al. The Human Connectome Project and beyond: Initial applications of 300mT/m gradients. Neuroimage. 2013. doi: 10.1016/j.neuroimage.2013.05.074 [DOI] [PMC free article] [PubMed] [Google Scholar]
- 37.Fischl B FreeSurfer. Neuroimage. 2012. doi: 10.1016/j.neuroimage.2012.01.021 [DOI] [PMC free article] [PubMed] [Google Scholar]
- 38.Greve DN, Fischl B. Accurate and robust brain image alignment using boundary-based registration. Neuroimage. 2009. doi: 10.1016/j.neuroimage.2009.06.060 [DOI] [PMC free article] [PubMed] [Google Scholar]
- 39.Tran G, Shi Y. Fiber Orientation and Compartment Parameter Estimation From Multi-Shell Diffusion Imaging. IEEE Trans Med Imaging. 2015;34(11):2320–2332. doi: 10.1109/TMI.2015.2430850 [DOI] [PMC free article] [PubMed] [Google Scholar]
- 40.Tournier J-D, Smith R, Raffelt D, et al. MRtrix3: A fast, flexible and open software framework for medical image processing and visualisation. Neuroimage. 2019;202:116137. doi: 10.1016/j.neuroimage.2019.116137 [DOI] [PubMed] [Google Scholar]
- 41.Wang J, Aydogan DB, Varma R, Toga AW, Shi Y. Modeling topographic regularity in structural brain connectivity with application to tractogram filtering. Neuroimage. 2018. doi: 10.1016/j.neuroimage.2018.07.068 [DOI] [PMC free article] [PubMed] [Google Scholar]
- 42.Aston-Jones G CHAPTER 11 - Locus Coeruleus, A5 and A7 Noradrenergic Cell Groups. In: Paxinos G, ed. The Rat Nervous System (Third Edition). Third Edit. Burlington: Academic Press; 2004:259–294. doi: 10.1016/B978-012547638-6/50012-2 [DOI] [Google Scholar]
- 43.Kebschull JM, Garcia da Silva P, Reid AP, Peikon ID, Albeanu DF, Zador AM. High-Throughput Mapping of Single-Neuron Projections by Sequencing of Barcoded RNA. Neuron. 2016;91(5):975–987. doi: 10.1016/j.neuron.2016.07.036 [DOI] [PMC free article] [PubMed] [Google Scholar]
Associated Data
This section collects any data citations, data availability statements, or supplementary materials included in this article.
Supplementary Materials
Supporting Information Table S1. Sample characteristics. Demographic, cognitive, and CSF biomarker measurements.


