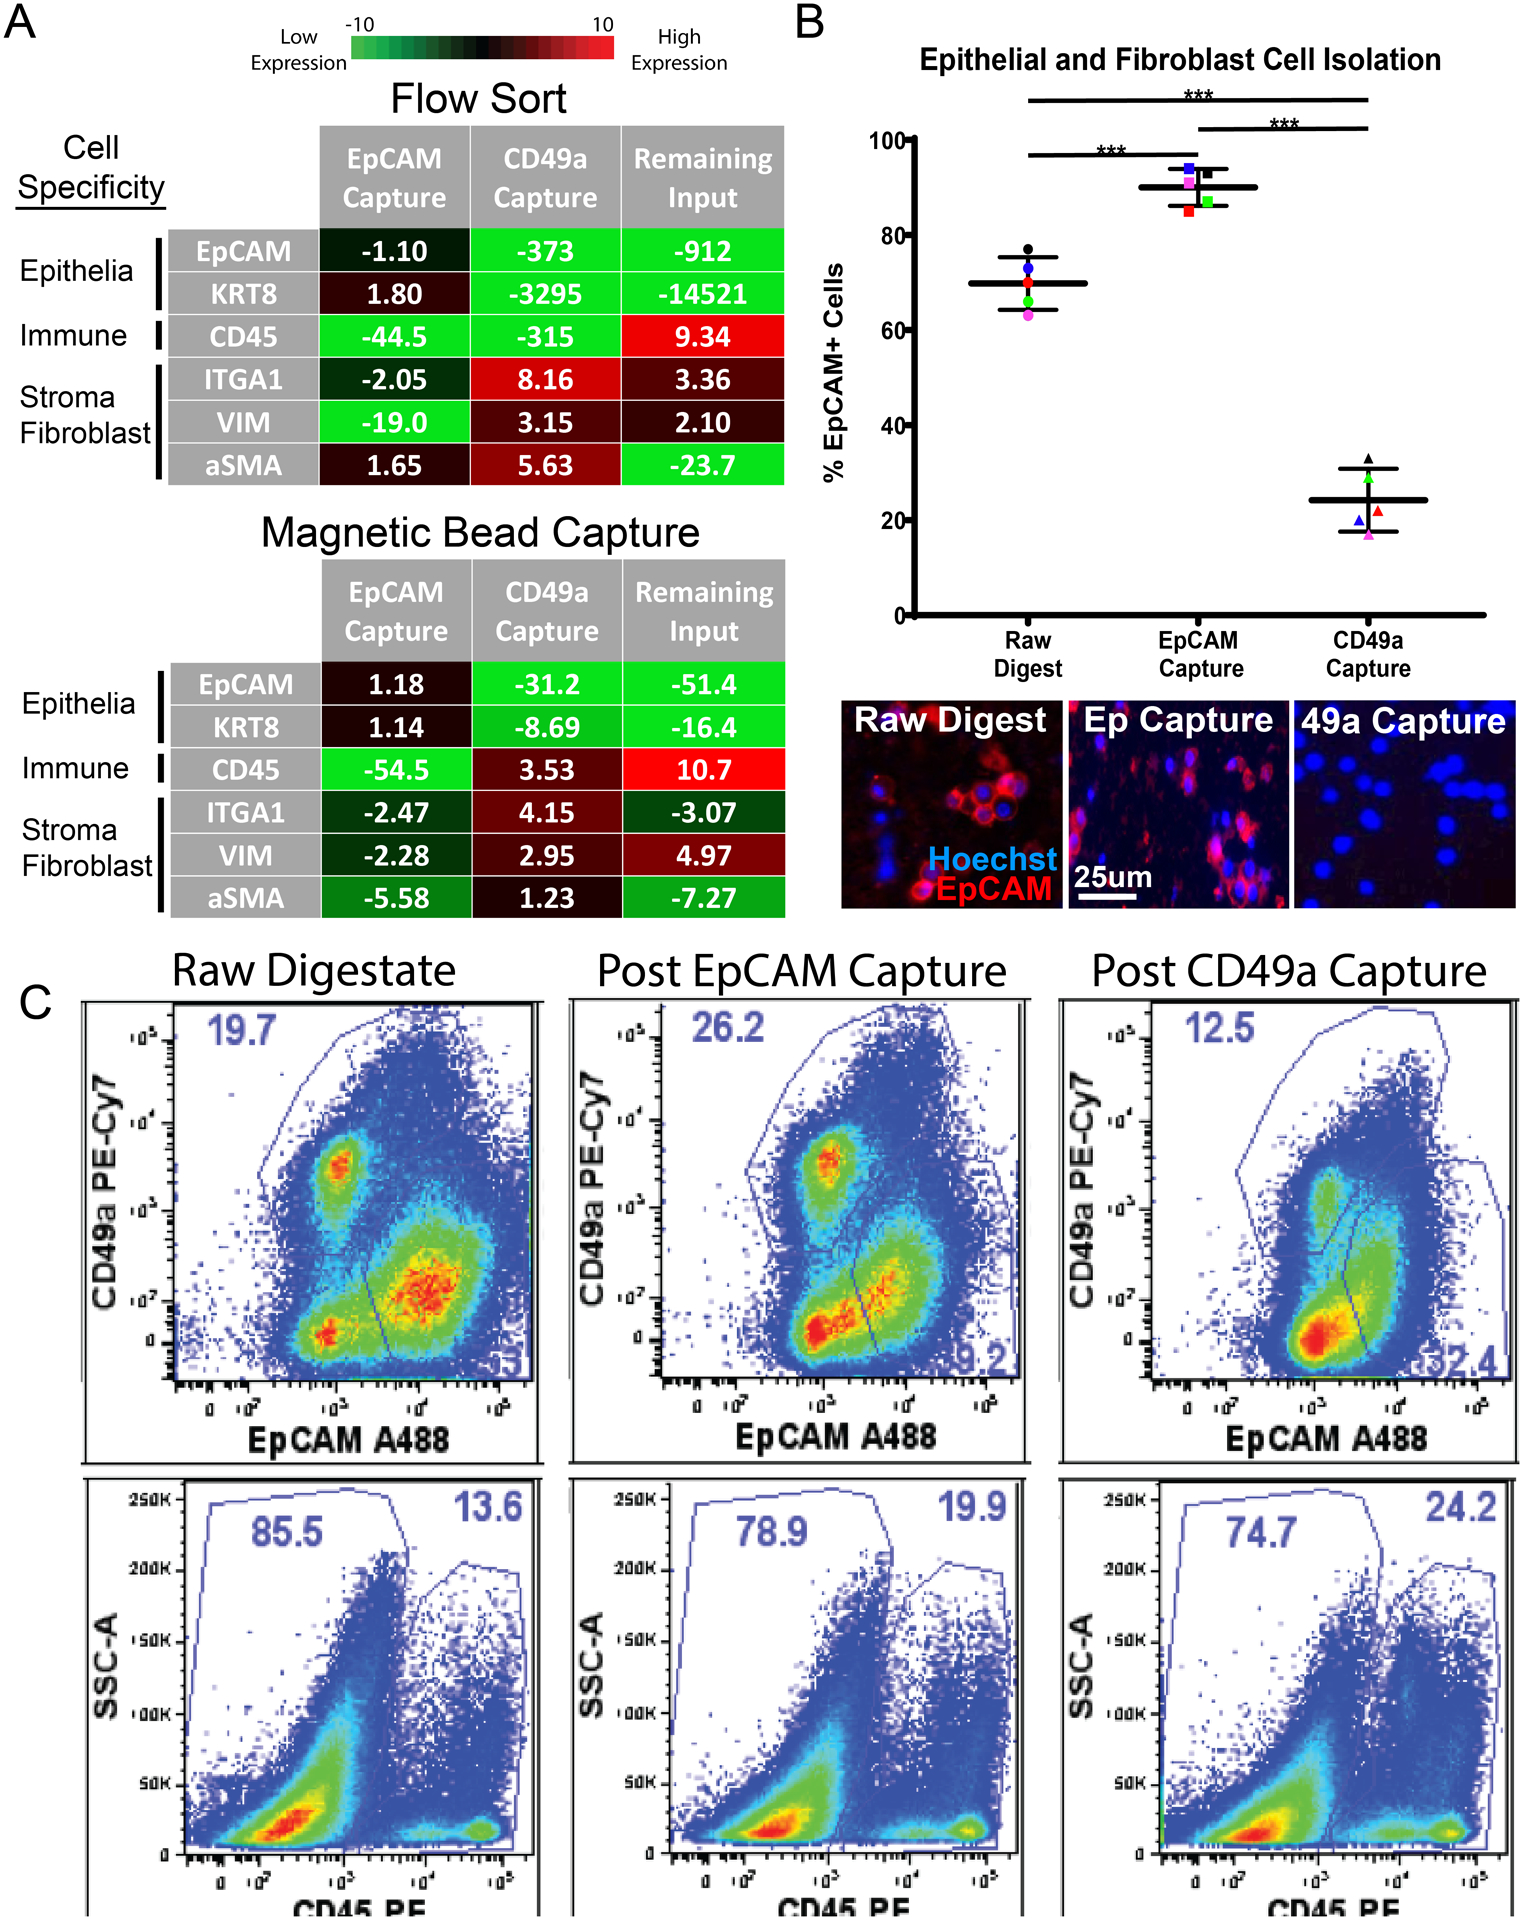
Figure 5: Antibody-labeled PMPs capture cell types of interest from digested cell suspensions.

(A) q-PCR measures epithelial transcripts (EpCAM, KRT8), immune cell transcripts (CD45), and fibroblast transcripts (ITGA1, VIM, aSMA) from cells isolated via FACS and magnetic bead capture. EpCAM Capture represents cells isolated using EpCAM antibody, CD49a Capture represents cells isolated using CD49a antibody, and Remaining Input represents cells left over after EpCAM and CD49a capture. Fold change values are normalized to raw cell suspensions before cell isolation and averaged, n=3. (B) Scatter plot showing the percentage of EpCAM-positive cells throughout magnetic bead cell isolation experiments, quantified via fluorescent microscopy. Representative fluorescent images of digested cell suspensions are shown below. “Raw digestate” represents digested cell suspensions before magnetic bead capture, while “EpCAM Capture” represents cells isolated using EpCAM-labeled PMPs and “CD49a Capture” represents cells isolated using CD49a-labeled PMPs. Cells are stained with EpCAM-PE (epithelial cell marker) and cell nuclei are labeled with hoechst 33342-blue. (*** indicates p-value <0.01). (D) Gated flow cytometry plots display cell populations present during cell isolation experiments. “Raw digestate” columns represent digested cell suspensions before magnetic bead capture, “Post EpCAM Capture” columns represent cell populations remaining after cell capture using EpCAM-labeled PMPs, and “Post CD49a Capture” columns represent cell populations remaining after the second isolation step (cell capture using CD49a-labeled PMPs). The first row represents EpCAM and CD49a expression within the single cell/live/CD45- fraction, the second row shows CD45 expression within the total single/live cells. Data represents frequencies within the parent gate.
