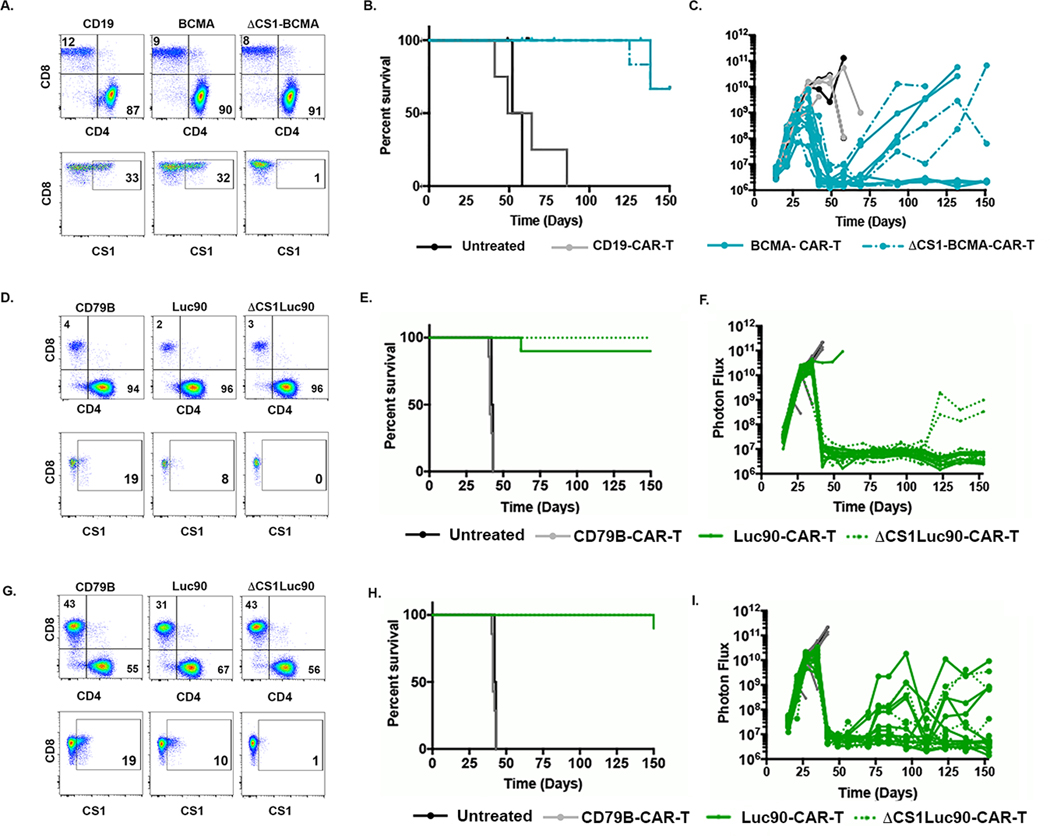
Figure 3. Efficacy Luc90-CAR-T is independent of CD4:CD8 ratio.
A. Flow cytometry was used to assess CD4 and CD8 percentages in CAR-T cultures as shown. Data shown are sorted CAR+ cells B. Kaplan Meier Survival of mice treated with CD19-CAR-T (n=4), BCMA CAR-T (n=8, 4 were tumor free and censored due to infection at housing facility), ΔCS1-BCMA-CAR-T (n=9, 3 were tumor free and censored due to infection at housing facility) or left untreated (n=2). C. Bioluminescent imaging. Each line represents one mouse. D. Flow cytometry was used to assess CD4 and CD8 percentages in CAR-T cultures as shown that were designed to have a high CD4:CD8 ratio. Data shown are sorted CAR+ cells E. Survival and F. BLI of mice treated with Luc90-CAR-T (n= 10), ΔCS1 Luc90-CAR-T(n= 10), CD79B CAR-T (n=3 ) and untreated mice (n=2). G. Flow cytometry showing CD4 and CD8 percentages of CAR-T as shown generated to have a lower CD4:CD8 ratio. H. Survival and I. tumor burden (BLI) in mice treated with Luc90-CAR-T (n= 10), ΔCS1 Luc90-CAR-T (n= 10), CD79B CAR-T (n=3 ) and untreated mice (n=2). Although graphed separately, survival plots show same control mice (CD79B and untreated) since experiment was performed at same time.

