

Abstract
Background:
Microglia have recently been implicated in opioid dependence and withdrawal. Mu Opioid (MOR) receptors are expressed in microglia, and microglia form intimate connections with nearby neurons. Accordingly, opioids have both direct (MOR mediated) and indirect (neuron-interaction mediated) effects on microglia function.
Methods:
To investigate this directly, we used RNA sequencing of ribosome-associated RNAs from striatal microglia (RiboTag-Seq) after the induction of morphine tolerance and followed by naloxone precipitated withdrawal (n=16). We validated the RNA-Seq data by combining fluorescent in-situ hybridization with immunohistochemistry for microglia (n=18). Finally, we expressed and activated the Gi/o-coupled hM4Di DREADD receptor in CX3CR1-expressing cells during morphine withdrawal (n=18).
Results:
We detected large, inverse changes in RNA translation following opioid tolerance and withdrawal. WGCNA analysis revealed an intriguing network of cAMP-associated genes that are known to be involved in microglial motility, morphology, and interactions with neurons that were downregulated with morphine tolerance and upregulated rapidly by withdrawal. Three-dimensional histological reconstruction of microglia allowed for volumetric, visual colocalization of mRNA within individual microglia that validated our bioinformatics results. Direct activation of Gi/o-coupled DREADD receptors in CX3CR1-expressing cells exacerbated signs of opioid withdrawal rather than mimicking the effects of morphine.
Conclusions:
These results indicate that Gi-signaling and cAMP-associated gene networks are inversely engaged during opioid tolerance and early withdrawal, perhaps revealing a role of microglia in mitigating the consequences of opioids.
Introduction
Opioid abuse has reached epidemic proportions in the United States and is responsible for more than 40,000 overdose deaths each year (1, 2). While the motivations for drug use are complex, the threat of withdrawal provokes anticipatory anxiety and avoidance of treatment seeking. Besides substitution therapy, current treatments for opioid withdrawal are not sufficiently effective and developing new strategies for diminishing withdrawal may improve adherence to opioid abstinence. There are consistent mu-opioid receptor (MOR) dependent gene networks that are regulated in the opioid abstinent brain (3–5), and are the target of therapeutic manipulation in neurons (6). However, there is accumulating evidence that other cell types, including microglia, play a prominent role in drug addiction and withdrawal (7–10).
The interface of opioids, microglia, and neuroinflammation is an emerging field, but there is now a substantial body of evidence that MORs are expressed in microglia (11–14), including in the present dataset, where we found consistent MOR (Oprm1) translation in striatal microglia. Microglia also form intimate connections with neurons and sense neuronal excitability (15, 16), so opioids likely have both direct (MOR mediated) and indirect (neuron-microglia interaction mediated) effects on microglia function. Opioid administration decreases the density of Iba-1-positive microglia in cortex and striatum which is increased again after spontaneous withdrawal (17). Microglia inhibition by minocycline or ibudilast (18) or blocking microglia pannexin channels (19) produces a dose-dependent reduction in opioid withdrawal behaviors. Opioid withdrawal can intensify pain sensitivity that appears to involve pro-inflammatory processes including activation of TLR2, TLR4, the NLRP3 inflammasome, and NF-KB (20–24), suggesting that withdrawal engages delayed microglial activation. Opioids are used cyclically, so repeated exposures/withdrawals may prime or condition microglia (17) to produce an exaggerated immune response to subsequent cycles. While several studies of microglia have examined later stages in this process, we hypothesized that microglia function and gene expression are altered rapidly, even during the immediate behavioral changes associated with precipitated withdrawal.
One method for assessing rapidly evolving adaptations to environmental challenges is to investigate RNA translation. Microglial ribosomes are expressed in fine processes where they are presumed to translate mRNA locally, similar to astrocytes (25). Fine processes are not recovered by mechanical methods of isolating microglia, and fluorescence-activated cell sorting of microglia significantly alters immediate early gene expression when compared to RNA isolation using ribosome pulldown (26). Thus, we decided to use the RiboTag strategy to immunopurify ribosome-associated mRNAs specifically from microglia. This approach provides an excellent yield of highly enriched microglia mRNA molecules actively undergoing translation. We utilized a well-characterized morphine administration schedule that produces tolerance (4) and collected ribosome-associated mRNA in order to provide the first complete picture of the translational consequences of opioid tolerance and withdrawal on striatal microglia. Using WGCNA, we identified a network of mRNA actively undergoing translation in microglia that are markedly inhibited by opioid tolerance, and rapidly reversed by naloxone-precipitated withdrawal. This expression pattern was validated among key genes in the network through three-dimensional colocalization of Iba1 immunohistochemistry signal and fluorescent in-situ hybridization signal. Intriguingly, many of the mRNAs are related to cyclic-AMP (cAMP) signaling and inhibiting cAMP-mediated signaling using Gi/o-coupled DREADD activation in CX3CR1-expressing cells exacerbated the acute behavioral signs of withdrawal. Together, these data suggest that microglia are actively involved in both opioid tolerance and acute withdrawal through a compensatory cAMP-mediated mechanism.
Methods
Animals
Experiments were performed in compliance with the Guide for the Care and Use of Laboratory Animals (NIH, 1985; Publication 865–23) and were approved by the Institutional Animal Care and Use Committee, University of Washington.
Experimental Design
Male and female mice were generated by crossing tamoxifen-inducible CX3CR1-CreERT2 hemizygous mice with homozygous floxed RiboTag mice on a C57Bl6 background (Figure 1A). Mice received tamoxifen (75mg/kg ip) for seven days at six weeks (Figure 1B). A 2×2 treatment design (n=6/group) yielded 4 groups: saline + saline (SS), saline + naloxone (SN), morphine + saline (MS), and morphine + naloxone (MN; Figure 1B). At ~11 weeks, mice received either morphine or saline twice daily for five days. Morphine dose escalated daily: 20 mg/kg ip (day 1), 40 mg/kg ip (day 2), 60 mg/kg ip (day 3), 80 mg/kg ip (day 4), 100 mg/kg ip (day 5). On day 6 mice received 100 mg/kg ip morphine or saline. Two hours later they received either naloxone (1 mg/kg sc) or saline and were video recorded for 30 minutes in individual cages from above. Videos were automatically analyzed for withdrawal metrics (distance, contraction, and immobility) using Ethovision xt11 (Noldus, Wageningen NL) and custom MATLAB scripts (Mathworks, Natick MA). Contraction was defined as <65% max body length (hunching), and immobility was defined as <2cm/second of movement. Mice were sacrificed 2 hours after naloxone/vehicle injection and brains were rapidly extracted for RNA processing (Figure 1D). Four samples from each group (2 males, 2 females; total n=16) were processed for sequencing. While we included males and females, the RNA-Seq analysis was not powered to examine for differences in microglial gene expression between sexes. Throughout the manuscript, MS animals are compared to SS animals when discussing the effects of “tolerance”, while MN animals are compared to MS animals when discussing “withdrawal”. Twice daily morphine schedules, both single and escalating dose, have been shown to rapidly induce analgesic tolerance and increase locomotor sensitization (27, 28). However, in the present manuscript “tolerance” refers more generally to the animal’s ability to endure high doses of morphine (100mg/kg) without severe consequences.
Figure 1. Experimental Overview |.
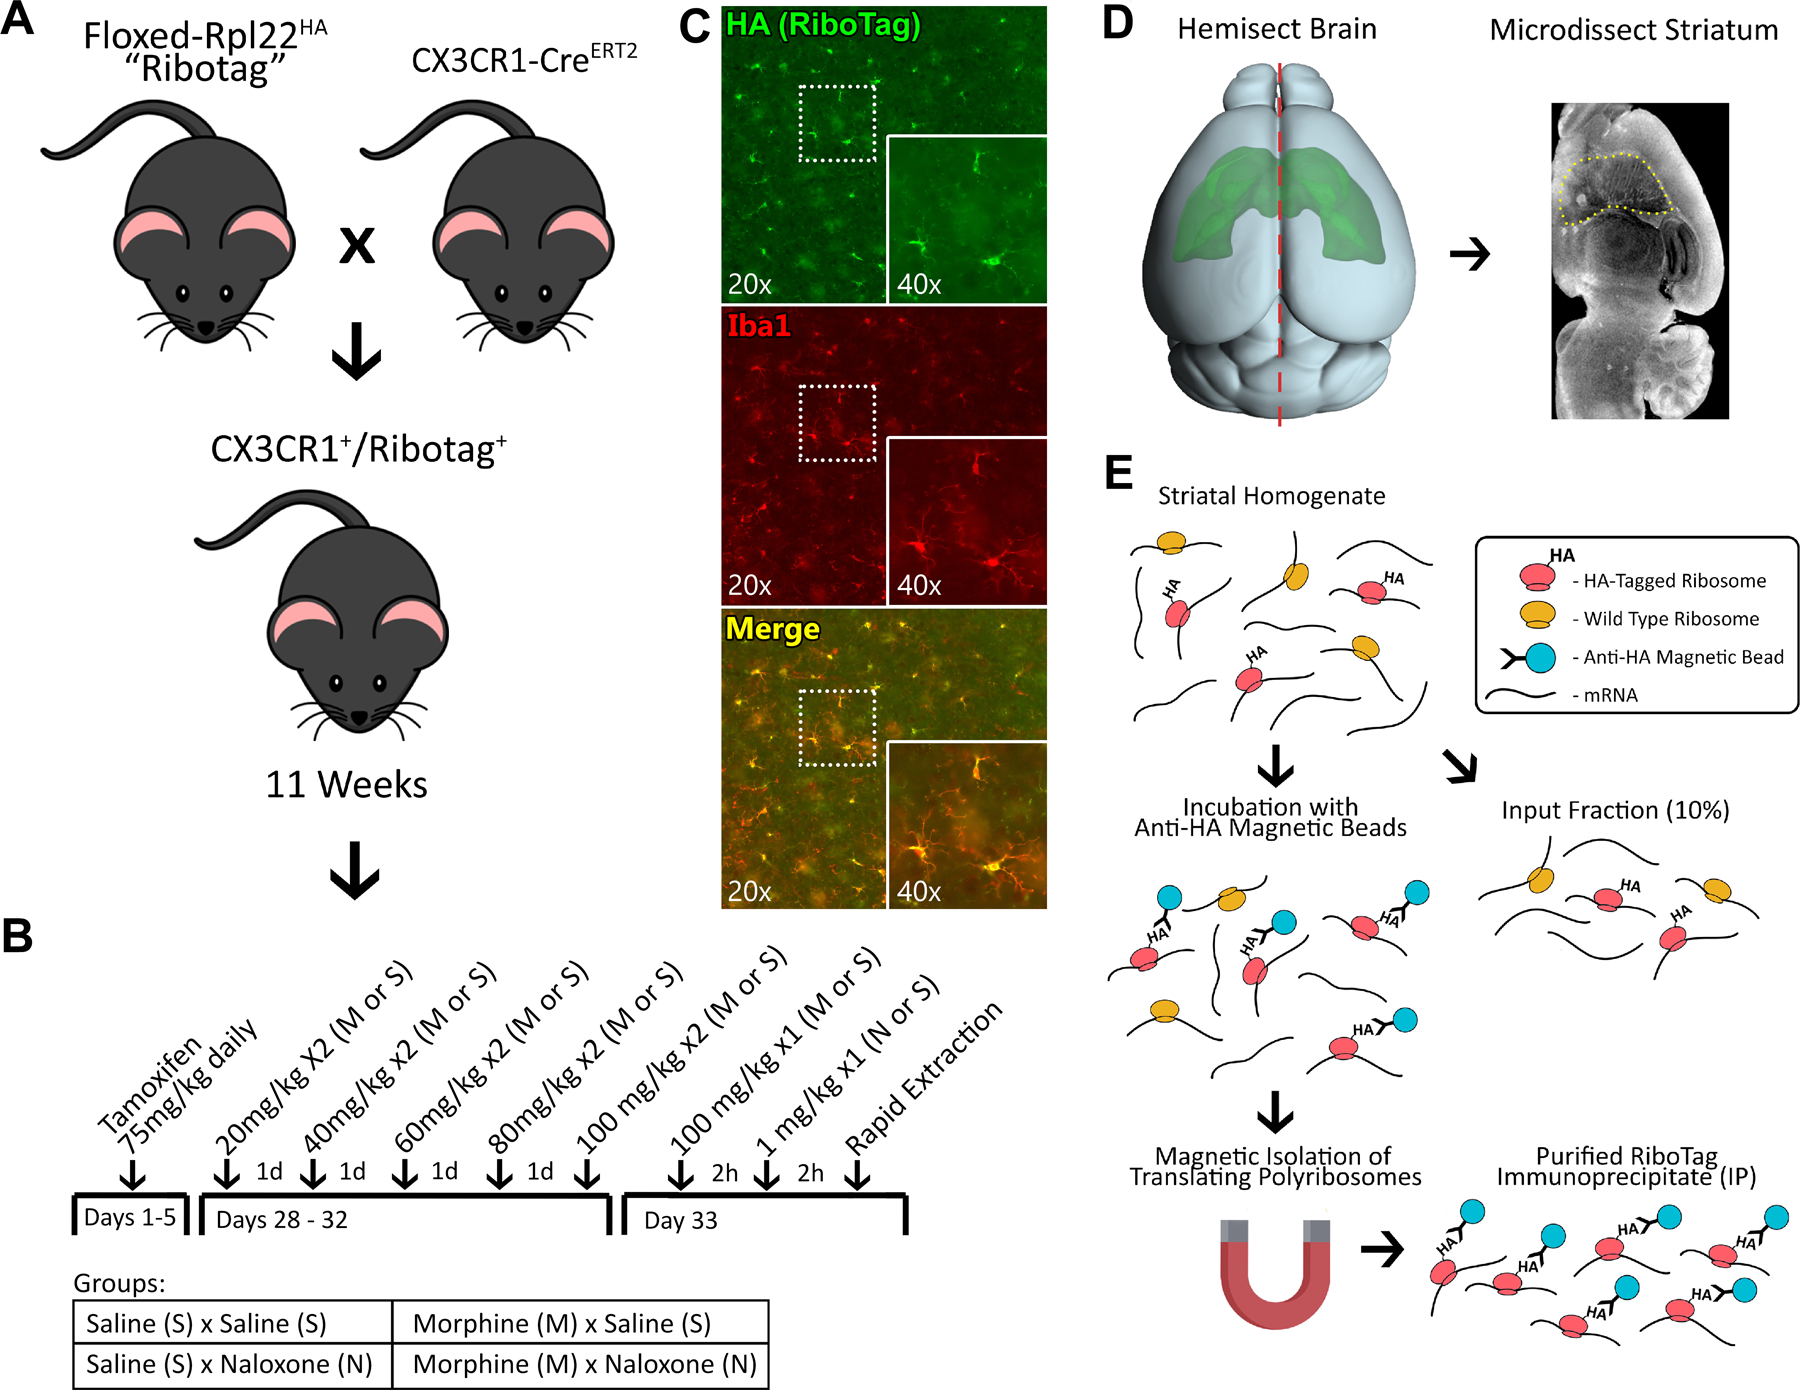
A, Experimental male and female mice were generated by crossing tamoxifen-inducible CX3CR1-CreERT2 hemizygous mice with homozygous floxed RiboTag mice. B, The experiment was performed as a 2×2 design (n=6/group) with all mice receiving tamoxifen for five days at six weeks of age. At ~11 weeks of age the mice received either morphine or saline for five days, on an escalating twice daily schedule. On day 6, the mice received 100 mg/kg ip morphine or equivalent volume saline. Two hours later they received either naloxone (1 mg/kg sc) or saline. C, In experimental animals RiboTag immunostaining colocalizes exclusively with Iba1 immunostaining. D, Brains were rapidly extracted, hemisected, and the striatum was micro-dissected and homogenized for RiboTag. E, RiboTag isolation was accomplished by incubating homogenized tissue with anti-HA magnetic beads and performing magnetic isolation of ribosome bound RNAs.
RiboTag-Seq Processing
Briefly, striatal dissections were homogenized in supplemented homogenization buffer, samples were centrifuged, and supernatant was collected. Ten percent of each sample was set aside as the whole transcriptome sample (input) and the remaining sample was processed to isolate ribosome bound mRNA (IP; Figure 1E). All aspects of tissue processing, immunoprecipitation, and RNA-Seq libraries generation are described in detail in our previous RiboTag-Seq manuscript (29). In the present study, “no Tamoxifen” control mice were used to generate the negative control samples. Raw fastq files were processed through the Galaxy platform (30). Fastq files were inspected for quality using FastQC (Galaxy Version 0.7.0), and then passed to Salmon (31) (Galaxy Version 0.8.2) for quantification of transcripts. The Salmon index was built using the protein coding transcriptome GRCm38-mm10. A small fraction of mRNA captured during immunoprecipitation is non-specific. To mitigate this, we use a computational approach to remove Input contamination from IP samples (32). All IP data presented in main manuscript has undergone this adjustment (Supplementary Method 1).
Differential Expression Analysis
Differential gene expression was calculated using DESeq2 (33) (Galaxy Version 2.11.39; default settings). To determine microglia specific gene enrichment, all IP samples were compared to all Input samples. To determine the effects of naloxone alone, SN IPs were compared to SS IPs. For morphine tolerance, MS IPs were compared to SS IPs. For Withdrawal, MN IPs were compared to MS IPs. A positive Wald statistic means a gene was expressed more in the first group (FDR; q = 0.10).
Gene Set Enrichment Analysis
Wald statics generated by DeSeq2 were used as the ranking variable for gene set enrichment analysis (GSEA). All genes with reliable statistical comparisons (those not filtered by DeSeq2) were entered into WebGestalt 2019 (34) and GSEA was run on all pertinent comparisons. Gene sets analyzed include GO: Biological Process, GO: Molecular Function, Keeg, Wiki Pathway, Transcription Factor Targets, and MicroRNA Targets.
Weighted Gene Coexpression Network Analysis
Weighted gene coexpression network analysis (WGCNA) and module clustering were accomplished using the WGCNA (35) package for R (36). Briefly, the gene count matrix for all IP samples was filtered to remove zero-variance genes, and a signed topological overlap matrix was generated for clustering. Module membership was assigned using a dynamic tree cut, and highly correlated modules were merged by re-clustering module eigengenes. Gene modules were randomly re-named using the “Crayola Color Palette” in order to combat attribution of meaning or importance to numbered modules (37).
Post processing of the topological overlap matrix was completed with a custom MATLAB class (@WGCNA). This class allows for simple object-based analysis of complex WGCNA data. Topological overlap matrices, module membership files, and DeSeq files can be loaded into a single “W” object. @WGCNA allows for calculation and visualization of module eigengenes, merging of modules, analyses of module membership, and differential expression. @WGCNA utilizes MATLAB’s powerful graphing and network analysis functions to generate complete-genome network graphs with module membership or differential expression markers, 2D or 3D graphs from individual modules or individual genes, and includes settings for edge pruning, node appearance, and edge appearance. @WGCNA is available at GitHub.com/MxMarx/WGCNA.
Fluorescent In-Situ Hybridization Validation of Changes in Key cAMP Related mRNA
A new cohort of mice (n=18, 6/group, 3 males and 3 females) was subject to our morphine tolerance and withdrawal procedure (no SN group). Tissue was dual processed for fluorescent in-situ hybridization (FISH) and Iba1 immunohistochemistry (IHC). Two hours following naloxone, mice were anesthetized and perfused with phosphate-buffered saline (PBS), followed by 4% paraformaldehyde (PFA). Brains were post-fixed in 4% PFA for 48h then transferred to 30% sucrose in PBS. Sections (14μm) were mounted 6 brains/slide covering all conditions (1 male, 1 female × SS, MS, MN). RNAscope (ACD Bio Newark, CA) was used to visualize target mRNA; protease incubation was limited to 10m. Iba1 IHC was performed following RNAscope. Tissue was blocked with 4% BSA and 0.3% Triton in PBS for 1h at room temperature, incubated with anti-Iba1 rabbit antibody (1:500; FUJIFILM Wako; #019–19741) in blocking solution for 18h at 4°C, rinsed (PBS; 3x 10m), incubated with Alexa-Fluor 488 Goat anti-rabbit in blocking solution (1:400; ThermoFisher; #A-11008) for 60m at room temperature, rinsed (PBS; 3x 10m), and cover slipped with Pro-Long Gold with DAPI (ThermoFisher; #P36935). Confocal stacks (10μm @40x with 1.25x zoom) of the striatum (AP 0mm; ML 2mm; DV −3mm) were acquired on a Leica SP8X. Individual microglia reconstruction and colocalization analysis was performed using custom MATLAB scripts. Images were processed in a blind batch, and all settings remained identical.
Immunohistochemistry and Image Analysis for Microglia Morphology
A new cohort of mice (n=12, 4/group, 2 males and 2 females) was subject to the above morphine tolerance and withdrawal procedure (no SN group). Two hours following naloxone injections, brains were removed and post-fixed as described above. Sections (40 μm) of the striatum were collected on a sliding-freezing-microtome. Free floating sections were processed for IBa1 IHC as described above. Confocal stacks (30μm @40x with 1x zoom) of the striatum (AP 0mm; ML 2mm; DV −3mm) were acquired on a Leica SP8X confocal microscope. Images from this cohort and from the RNAscope experiment were analyzed together for morphological analysis. Individual microglia reconstruction and quantification was performed using 3DMorph software (38). Images were processed in a blind batch and all image analysis settings remained identical. Morphological parameters (volume, branch points, end points) were calculated and normalized to stack depth and image resolution.
Chemogenetic Inhibition of cAMP signaling in CX3CR1-Expressing Cells via hM4Di
Experimental animals were generated by crossing mice that are hemizygous for tamoxifen-inducible CX3CR1-CreERT2 with mice that are hemizygous for floxed hM4Di. Tamoxifen induction of CRE was performed as described above. Two groups of CX3CR1-hM4Di and 1 group of CX3CR1-CreERT2 controls with 3 males and 3 females per group were used (total n=18). All animals received escalating morphine as described in above; 2h after the final morphine injection (100 mg/kg ip) the mice either received CNO (3 mg/kg ip) or 2% DMSO vehicle 20m prior to naloxone (1 mg/kg sc). Withdrawal was automatically scored using the same custom MATLAB script described above.
Statistical Analyses
For non-bioinformatics analyses, ANOVA were followed by ‘Dunn-Sidak’ corrected contrasts.
Code and Data Availability.
All RNA-Seq files and the RNA-Seq pipeline are available on our Galaxy Server. All code and data used for the figures are available in the supplementary code and data.
Results
Morphine Tolerance Causes Locomotor Sensitization while Naloxone Precipitates Withdrawal
Mice were administered “drug” (morphine or saline) for six days, then given a “treatment” (naloxone or saline). There was a significant main effect of “drug” on distance traveled (f1,15=10.8, p=.005) and a significant interaction of “drug*treatment” (f1,15=23.4, p<.01). Morphine tolerant mice displayed robust locomotor sensitization, traveling significantly greater distance than any other group (Supplementary Figure 1B; *p<.01). There was also a significant main effect of “drug” on hunched body contraction (f1,15=6.6, p=.021) and a significant interaction of “drug*treatment” (f1,15=6.2, p=0.025). Mice in withdrawal spent more time hunched than any other group (Supplementary Figure 1C; *p<.01). There was also a significant interaction of “drug*treatment” on immobility (f1,15=26.3, p<.01); Mice in withdrawal stayed immobile longer than any other group. (Supplementary Figure 1D; *p<.01). Morphine-naive mice treated with naloxone did not differ from morphine-naive mice treated with saline.
Immunoprecipitation and Sequencing
Ribotag immunohistochemistry (IHC) signal colocalized with Iba1 IHC signal, including in microglia processes (Figure 1C). RNA extraction from Input samples yielded 120 ±11 ng (mean±sem) of RNA while IP samples yielded 51±4 ng (mean±sem) of RNA. RNA sequencing from Input samples yielded 4.1±0.5 million reads (mean±sem) while IP samples yielded 2.8±0.2 million reads (mean±sem).
Microglia Specific Markers Are Enriched in RiboTag-Seq Samples
Differential expression analysis of IP vs Input samples showed dramatic enrichment of microglia-specific RNAs (Figure 2A). Among the most enriched genes were canonical microglia markers such as C1qa, Tmem119, and Itgam (CD11B; Figure 2A). Common microglia signaling pathways, such as cytokine binding, purinergic receptor activity, and NF-kB binding were enriched in IP samples (Figure 2B). Normalized counts from IP samples were compared to the top 1000 genes from available scRNA-Seq data for six presumed cell-types (39). Presumed microglia markers were detected at high levels in our IP data, while markers for other cell types were detected at low levels (Figure 2C). Using t-distributed stochastic neighbor embedding (t-SNE), IP samples were shown to be markedly different from Input samples (Figure 2D).
Figure 2. RiboTag Enriches Microglia Markers |.
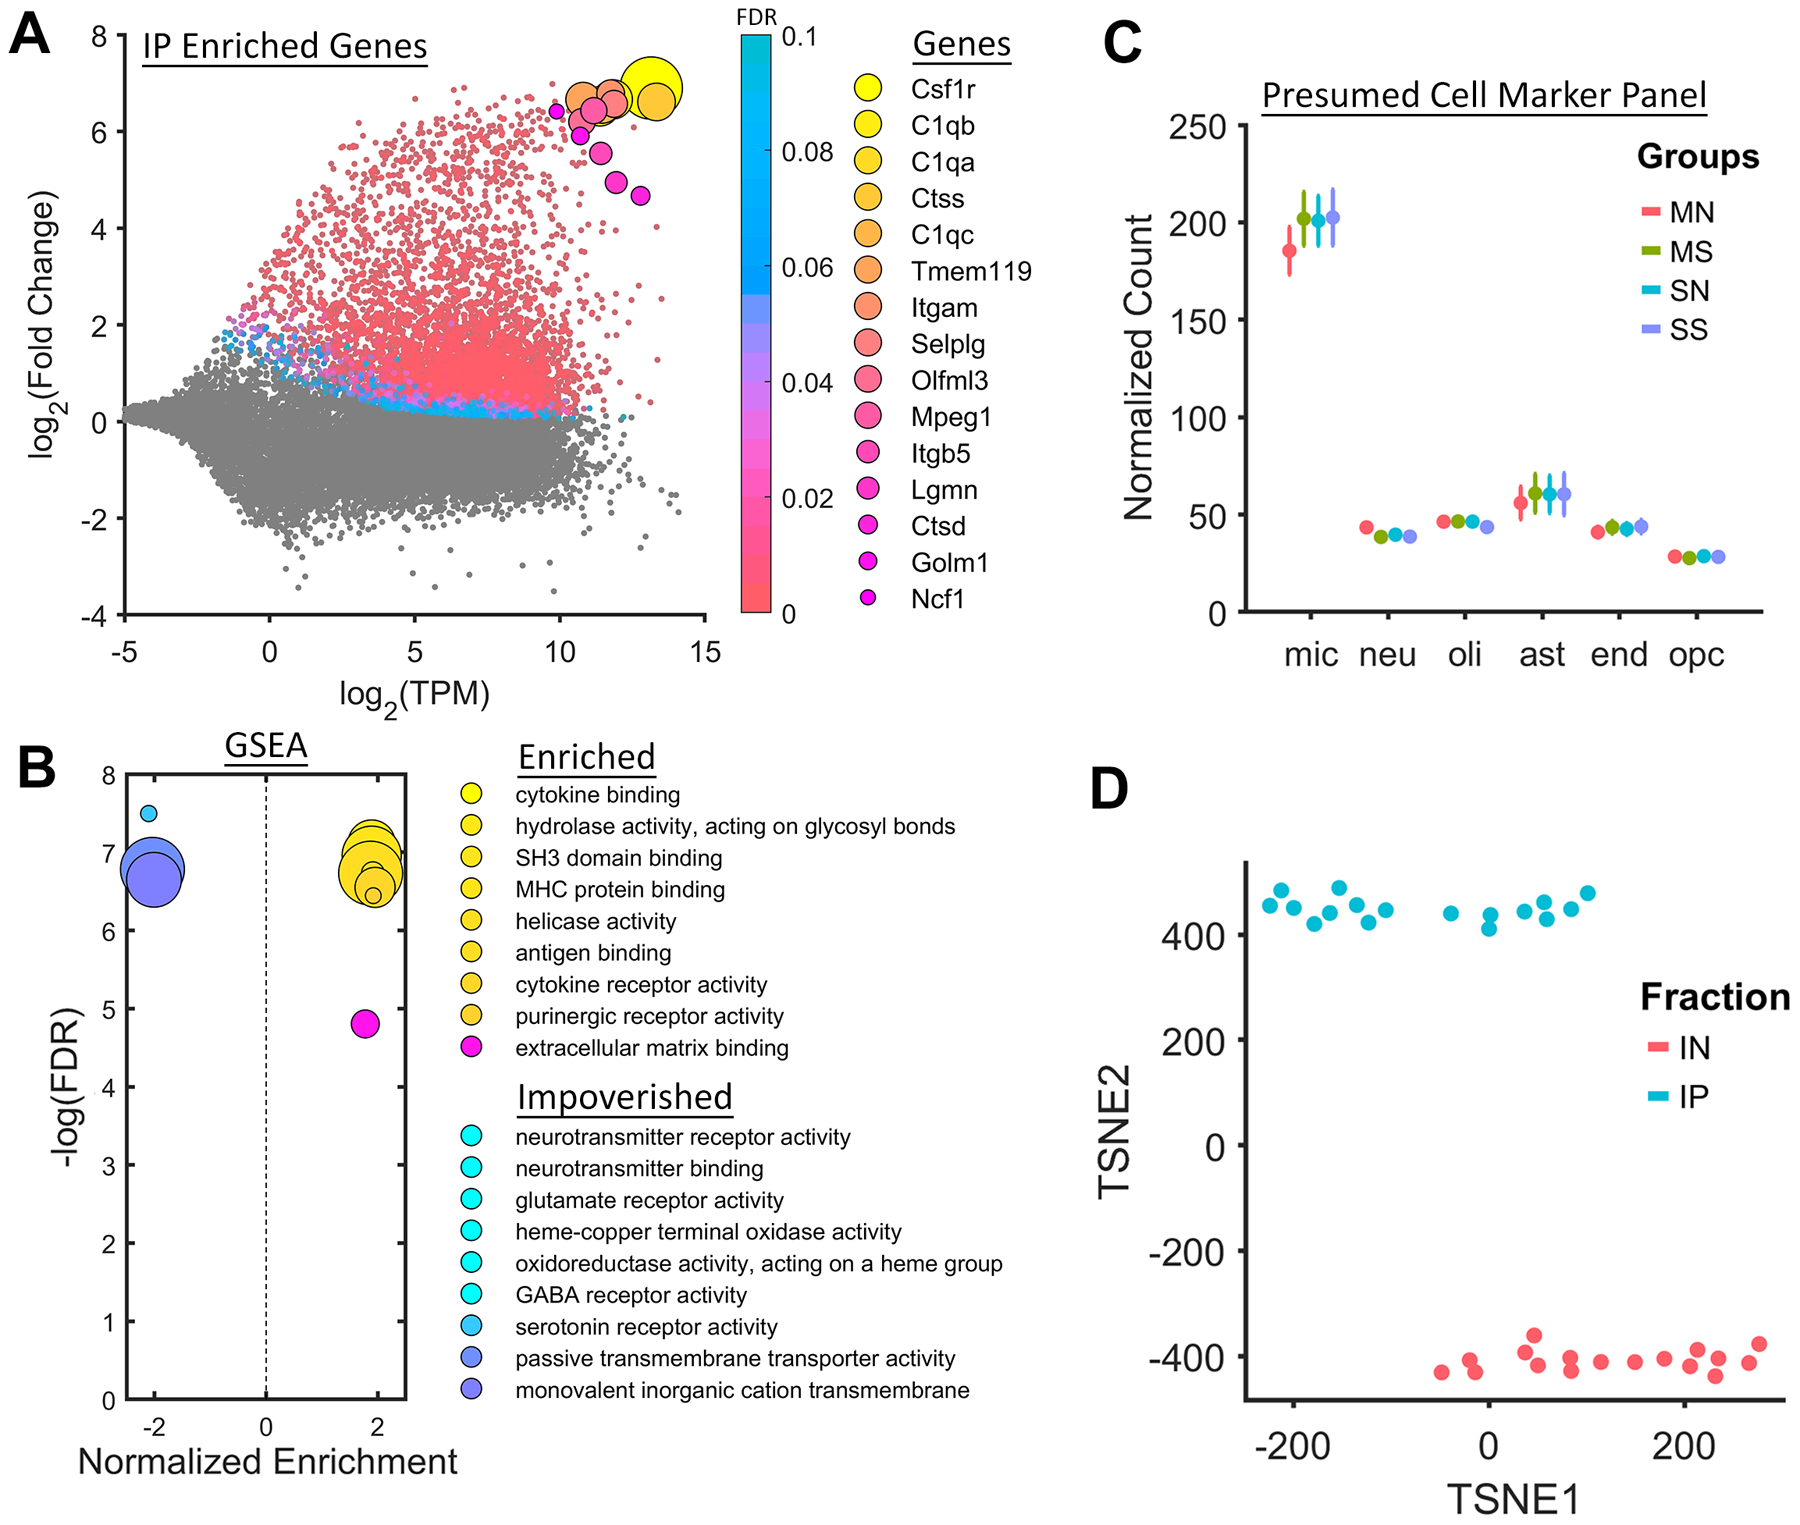
A, RiboTag-Seq samples are dramatically enriched with microglia markers such as Tmem119 and ITGAM (CD11b). B, GSEA reveals an upregulation of genes associated with canonical microglia gene sets such as “cytokine binding” and “purinergic receptor activity”. C, Presumed cell markers for microglia are highly enriched in the IP samples, as compared to markers for neurons, oligodendrocytes, astrocytes, endothelial cells, and oligodendrocyte progenitor cells. D, IP samples are easily separated from Input samples using t-distributed stochastic neighbor embedding (TSNE).
Morphine Tolerance and Withdrawal Produce Inverse Patterns of Differential Gene Expression
Naloxone administration to morphine-naive animals yielded very few differentially expressed genes (DEGs) in microglia (SN vs SS; Figure 3A). Morphine tolerance produced robust changes in microglia, with a similar number of upregulated and downregulated genes (555 up and 653 down; MS vs SS; Figure 3B). By contrast, withdrawal produced a dramatic upregulation in genes with roughly half as many downregulated (706 up and 344 down; MN vs MS; Figure 3C). For DEGs, there was a significant inverse relationship between expression changes during morphine tolerance and withdrawal (R2=0.86, p<.01; Figure 3D). Genes that were downregulated during morphine tolerance were upregulated during withdrawal, and vice-versa. Using t-SNE, tolerant and withdrawn animals were shown to be markedly different from saline animals (Figure 3E). Input sample analyses are available in the supplementary code and data.
Figure 3. Morphine Tolerance and Withdrawal Induce Inverse Differential Expression in Microglia |.
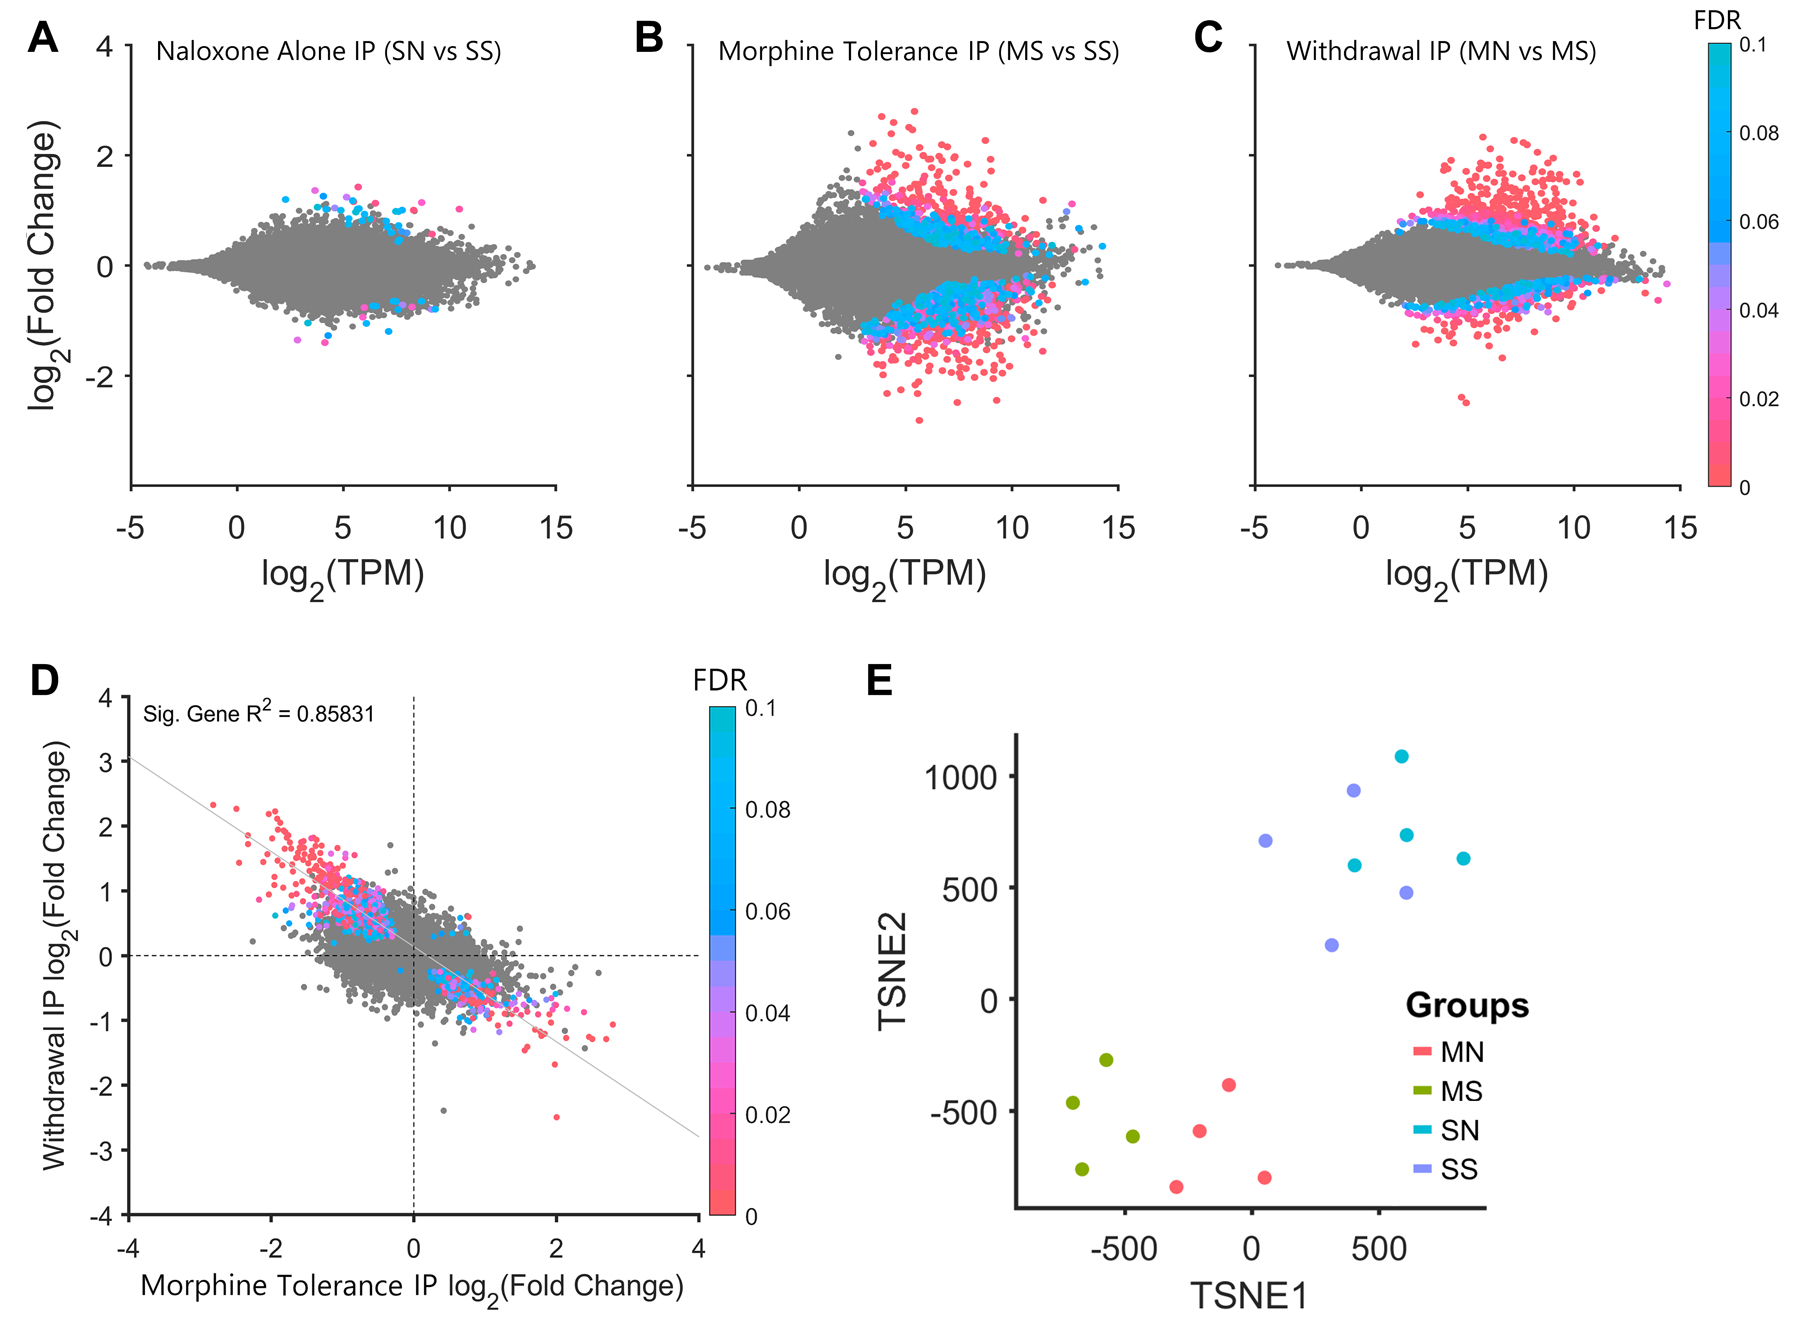
A, Naloxone administration to morphine-naive animals has little effect on gene expression in the IP samples. B, Morphine tolerance produces roughly equal numbers of upregulated and downregulated DEGs and C, naloxone precipitated withdrawal produces mainly upregulation of DEGs. D, Differential expression during withdrawal vs morphine tolerance is inversely correlated. E, Saline, morphine, and withdrawal animals are differentiable based t-distributed stochastic neighbor embedding (TSNE).
Morphine Tolerance and Withdrawal Produce Inverse Regulation of Annotated Gene Sets
Gene Set Enrichment Analysis (GSEA) is a method of inferring biological meaning from differential expression data based on previously annotated data sets. In brief, this analysis revealed inverse changes in numerous annotated gene sets; in particular, gene sets involved in the unfolded protein response and regulation of synaptic structure and function (Supplementary Figure 2). Interactive HTML files for IP and Input GSEA are available in the supplementary code and data.
Morphine Tolerance and Withdrawal Produce Inverse Regulation of a cAMP-Associated Gene Network
Weighted gene coexpression network analysis (WGCNA) (35) was used as an unbiased clustering strategy to identify sets of related genes, including those that were differentially regulated by morphine tolerance and withdrawal (40). The resulting network analysis for the entire RiboTag-Seq dataset is shown in a minimum spanning tree (Figure 4A). Highly significant DEGs formed modules that often overlap for morphine tolerance (Figure 4B) and withdrawal (Figure 4C). Of particular interest are modules that were differentially expressed between treatment groups, such as the “Sheen Green” module, which was downregulated during morphine tolerance and upregulated during withdrawal (Supplementary Figure 3). Individual genes and their network connections were visualized via a circle-network graph (Figure 4D), where the color of each connecting line reflects the statistical similarity between individual gene pairs. Another conventional way to represent these relationships is with “hub and spoke” graphs (Figure 4E); however, “hub” genes should not be misconstrued as directly regulating their neighbors. Rather, these most central genes best reflect the patterns of their neighbors and the module overall (Figure 4E).
Figure 4. A cAMP Regulated Gene Network is Inhibited by Morphine Tolerance and Induced by Withdrawal |.
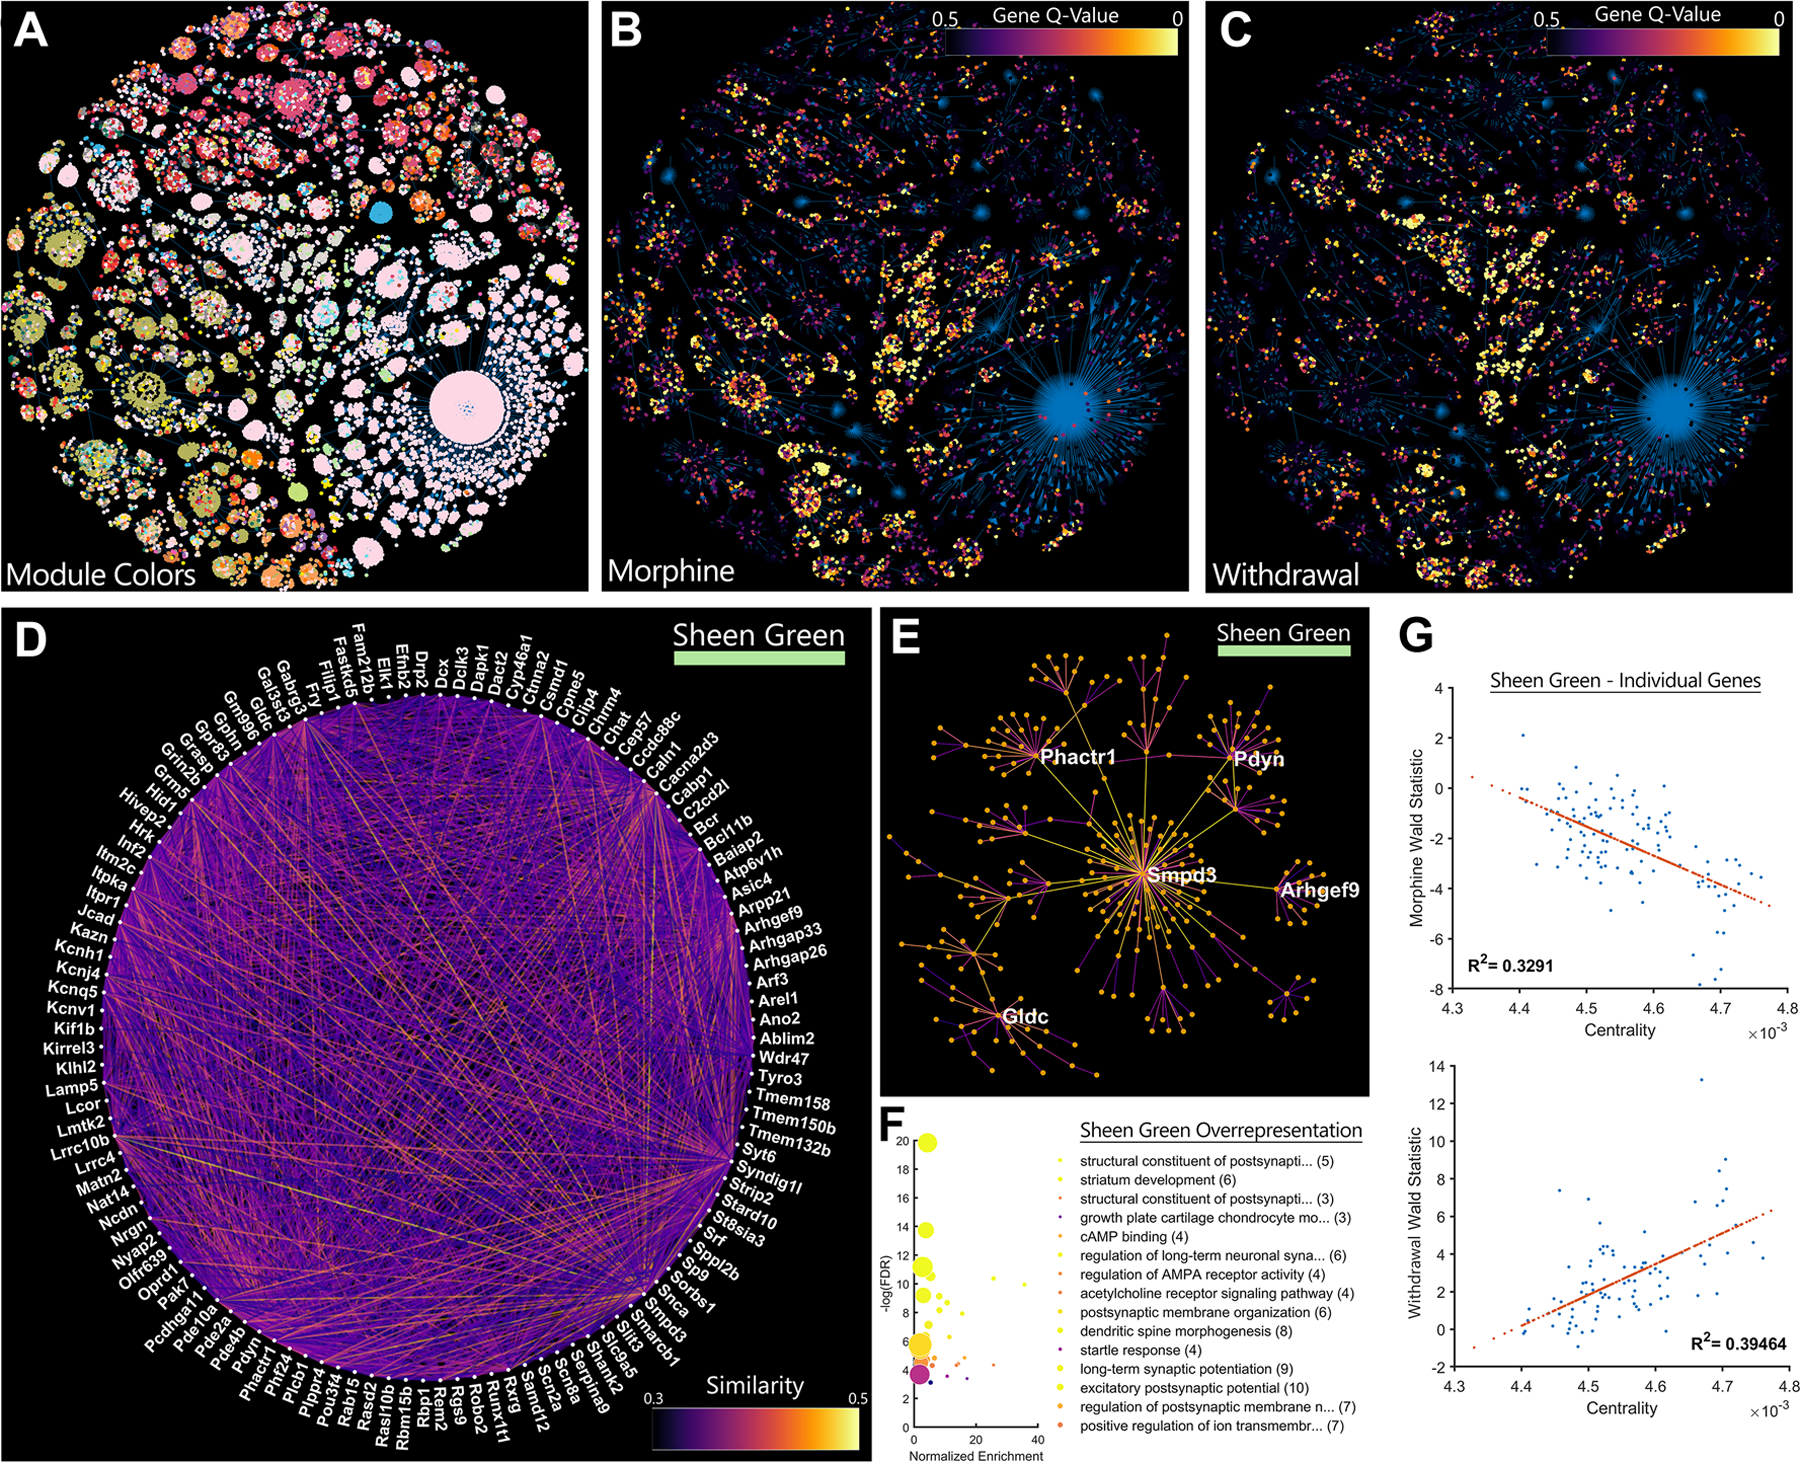
A, Genes are coded by module color and projected into a 2D minimum spanning tree. B, The same genes are coded by differential expression (q-value) data during morphine tolerance and C, withdrawal. Functionally related genes tend cluster in modules. D, The Sheen Green gene module is displayed using a circle layout. Line brightness represents gene similarity as calculated by WGCNA. E, The top 5 most central genes in each network are highlighted in a hub-and-spoke representation of the network. F, Over representation analysis of genes in this network provides clues to their functional relevance. Many genes are downstream targets of cAMP signaling or promote reorganization of synapses and the actin cytoskeleton. Gene-sets are sorted by normalized enrichment while color represents −log(FDR). Centrality in the “Sheen Green” network is highly correlated to differential expression for both G, morphine tolerance and H, withdrawal.
WGCNA does not take into consideration the presumed function of genes, yet the Sheen Green network contains a set of genes that, upon inspection, are indeed functionally related. Many of these genes are downstream targets of cAMP signaling and promote reorganization of synapses and the actin cytoskeleton (Figure 4f). Repeated morphine administration produced a negative correlation between network centrality and differential expression of individual genes in the Sheen Green module (MS vs SS; Figure 4G), whereas withdrawal produced the inverse pattern (MS vs SS; Figure 4H). The more central a gene was to the Sheen Green module, the more strongly it was differentially regulated by opioid tolerance and withdrawal. Other modules that may be of interest, along with all data from the Input samples, can be reviewed in the supplementary code and data.
Validation of Key cAMP Related Genes that are Inhibited by Tolerance and Induced by Withdrawal
Tissue from a new cohort of mice was dual processed for Iba1 IHC and FISH, then imaged by confocal microscopy to permit accurate 3D colocalization of mRNA signals within striatal microglia. The percent of microglia expressing PDE10A (a cAMP hydrolyzing phosphodiesterase) was significantly different across groups (Figure 5B; f2,15=3.8, p=.047), as was the PDE10A signal in microglia (Figure 5C; f2,15=5.0, p=.021); PDE10A expressing microglia and PDE10A signal were both reduced by morphine tolerance (Figure 5B,C; *p<.05), with a trend toward reversal during withdrawal. ARPP21 (a cAMP-regulated phosphoprotein) signal in microglia was significantly different across groups (Figure 5F; f2,15=3.8, p=.047); Microglia ARPP21 signal was increased by withdrawal (Figure 5F; *p<.05). The percent of microglia expressing DRD1 (a Gs coupled, cAMP stimulating receptor) was also significantly different across groups (Figure 5H; f2,15=4.5, p=.030), as was DRD1 signal in microglia (Figure 5I; f2,15=9.6, p=.002); DRD1 expressing microglia and DRD1 signal were both increased by withdrawal (Figure 5H,I; *p<.05). No changes were observed in ITPKA mRNA (Figure 5J), or samples run with a negative control probe (Figure 5M).
Figure 5. Key cAMP Related Genes are Expressed in Microglia, Inhibited by Tolerance, and Induced by Withdrawal |.
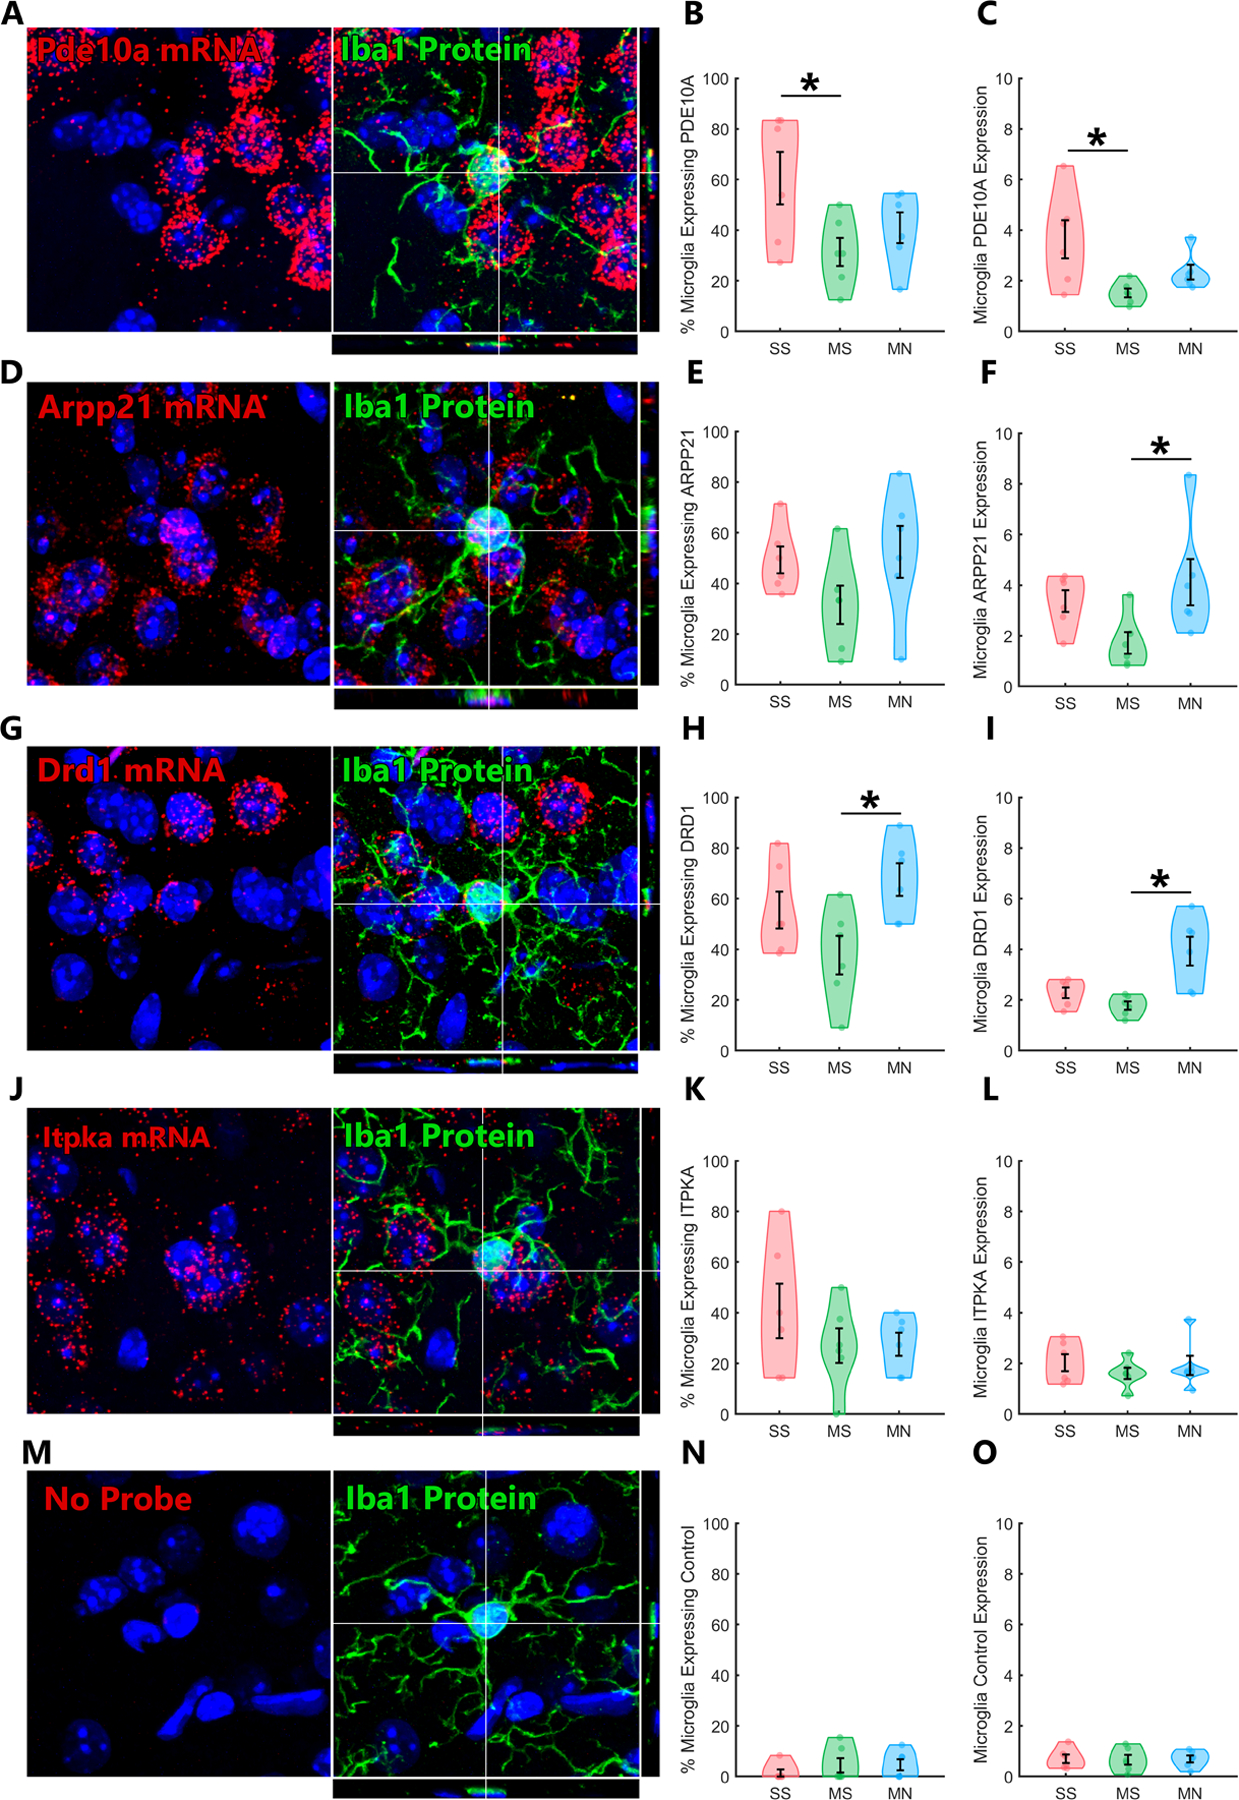
RNAscope was combined with immunohistochemistry for Iba1 and confocal imaging to quantify 3D colocalization of mRNA within microglia. A, PDE10A is expressed in a subset of microglia. B, The percent of microglia that express PDE10A is significantly reduced by morphine tolerance, C, as is the expression of PDE10A in microglia. D, ARPP21 is also expressed in a subset of microglia. E, The percent of microglia that express ARPP21 appears inversely modulated by morphine and withdrawal, but groups did not significantly differ. F, The expression of ARPP21 in microglia is significantly increased by morphine withdrawal. G, DRD1 is expressed in a subset of microglia. H, The percent of microglia that express DRD1 is significantly increased by morphine withdrawal, I, as is the expression of DRD1 in microglia. J, ITPKA is expressed in a subset of microglia, but K,L, is not modulated by morphine tolerance or withdrawal. M, A complete set of “negative control probe” samples was processed with RNAscope and analyzed with same software as the signal-probes. N,O, This technique has extremely low background contamination from non-specific signal detection. *Post-hoc p<.05
Microglia Morphology was Not Altered by Morphine Tolerance and Withdrawal
Confocal image stacks of microglia in the striatum from two cohorts of mice were analyzed using 3DMorph software (38). Despite accurate and reliable 3D reconstruction of individual microglia, we found no significant differences in gross microglia morphology (cell volume, branch points, end points; Supplementary Figure 4C–H). Although we expected morphine tolerance and withdrawal to affect microglia morphology, our current imaging/analysis strategy could not resolve the fine filopodia at the tips of microglia processes that have recently been shown to respond rapidly to changes in cAMP (41). In future studies we aim to directly study filopodia and their interactions with neurons.
Activation of hM4Di in CX3CR1-Expressing Cells Worsened Symptoms of Withdrawal
Given the discovery of cAMP signaling associated gene modules, we decided to test whether manipulating cAMP signaling in CX3CR1-expressing cells altered withdrawal-associated behaviors. Surprisingly, CNO pretreatment of mice expressing inhibitory hM4Di DREADDs selectively in CX3CR1-expressing cells exacerbated naloxone-precipitated withdrawal. The time mice spent in a hunched posture was significantly different across groups (Figure 6B; f2,15=5.5, p=.016); CNO pretreatment increased the time mice in withdrawal spent hunched (Figure 6B; *p<.05). The time mice spent immobile was also significantly different across groups (Figure 6C; f2,15=5.1, p=.019); CNO pretreatment increased the time mice in withdrawal spent immobile (Figure 6C; *p<.05). Directly increasing Gi/0 signaling in CX3CR1-expressing cells did not mimic mu opioid receptor activation but instead aggravated the signs of withdrawal, suggesting that cAMP signaling in microglia may be important in mitigating withdrawal.
Figure 6. Activation of hM4Di in Microglia Exacerbates Withdrawal Signs |.
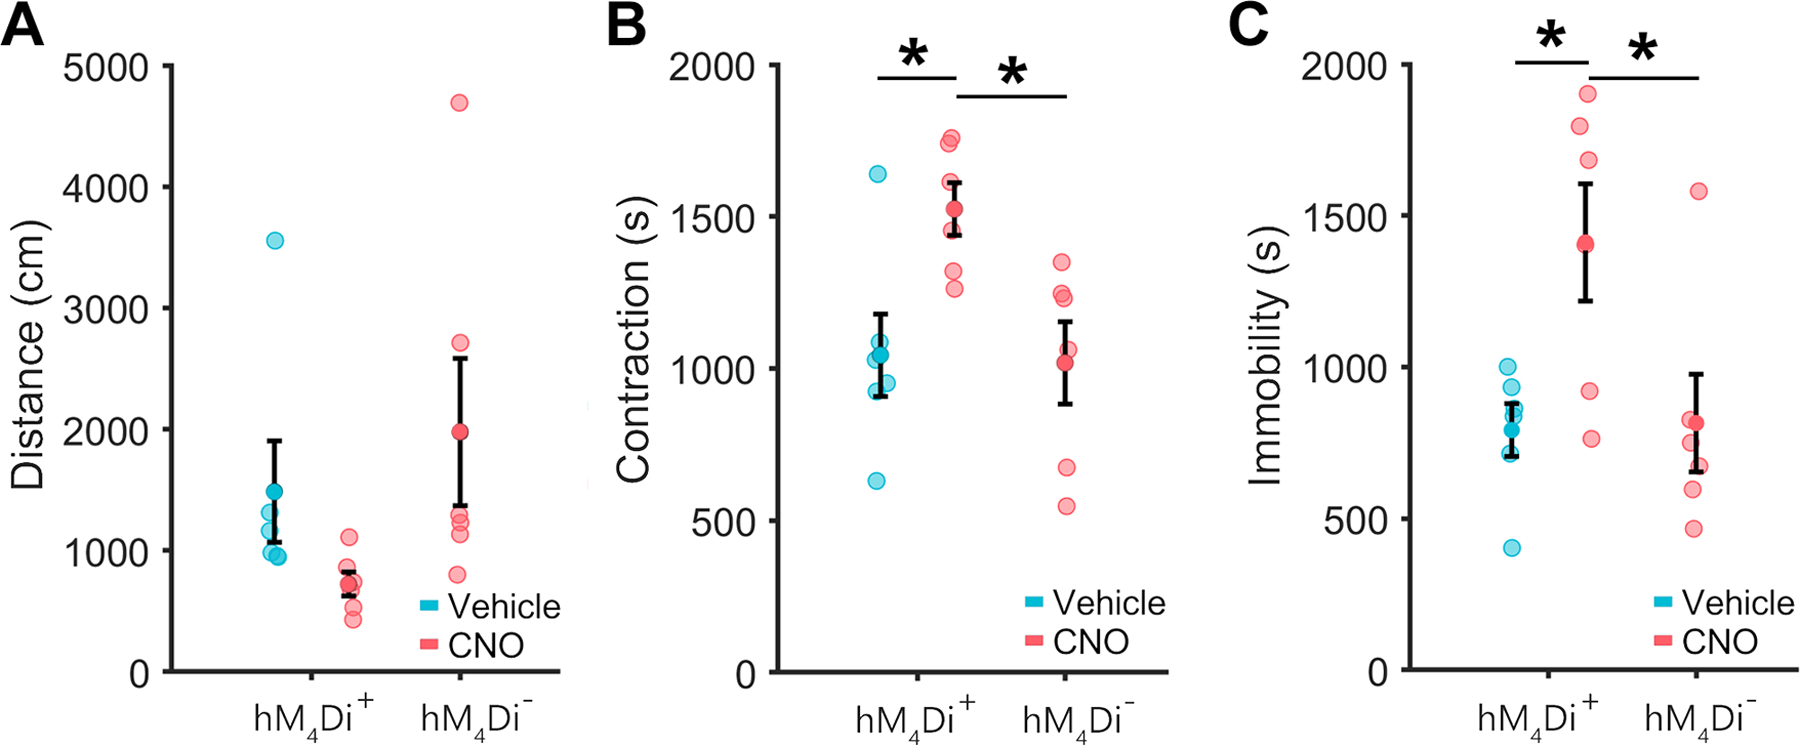
A, Pretreatment of CX3CR1-hM4Di animals with CNO produced a non-significant trend toward reduced locomotion during withdrawal. B, Pretreatment of CX3CR1-hM4Di animals with CNO significantly increases body contraction during withdrawal. C, Pretreatment of CX3CR1-hM4Di animals with CNO significantly increases immobility during withdrawal. CX3CR1-hM4Di animals who received vehicle and CX3CR1-CreERT2 controls who received CNO did not differ significantly on any measure. *Post-hoc p<.05
Discussion
In this report we identified dynamic changes in microglia in the absence of signals typically associated with neuroinflammation. Morphine and acute withdrawal produced inverse changes in the microglia translatome that appear to be cAMP mediated and could be related to microglia-neuron interaction. The induction of cAMP signaling in microglia may be a rapid and early compensatory response to opioid withdrawal.
Morphine Tolerance and Withdrawal Produce Inverse Impacts on the Microglial Translatome
Differential expression analysis revealed a significant inverse correlation between morphine- and withdrawal-induced changes in the microglia translatome. There was a striking overlap between these genes and previously published, abstinence-induced, mu-opioid receptor-dependent gene networks (4). Genes such as ARPP21, PDE10A, HPCA, DRD1, ADORA2A, PDYN and numerous others form a transcriptional gene network that is regulated after protracted abstinence from morphine, and here we show these same genes are rapidly regulated in the microglia translatome during naloxone precipitated withdrawal. These genes play a central role in the WGCNA defined gene network described in detail in this report. While many of these genes are known to be mu- and delta-opioid receptor regulated, the broad range of the changes we report here suggests indirect impacts of opioid withdrawal as well.
A cAMP Responsive Gene Network in Microglia is Inhibited by Morphine Tolerance and Induced by Withdrawal
WGCNA revealed a gene network that was inversely regulated by morphine tolerance and withdrawal. These networks include numerous downstream targets of cAMP signaling, cytoarchitectural adaptation, and modifiers of synaptic organization (Supplementary Table 1). There was a strong association between individual gene’s network centrality and regulation by morphine tolerance and withdrawal. Many of these genes had not previously been associated with opioid tolerance or withdrawal in microglia, so we validated a subset of genes using RNAscope. mRNAs for PDE10A (a cAMP hydrolyzing enzyme), ARPP21 (a cAMP-regulated phosphoprotein), and DRD1 (a cAMP stimulating dopamine receptor) all colocalize within microglia and were inversely regulated by morphine tolerance and withdrawal. Other genes in this network suggest that microglia interact with nearby neurons during withdrawal, including SYNDIG1, which is involved in synapse organization (42), and PHACTR1, which regulates synaptic activity, dendritic morphology, and cAMP induced actin remodeling (43). Since opioid tolerance and withdrawal induce differential effects on synaptic activity (44), it is noteworthy that this microglia gene module was inversely regulated during opioid tolerance and withdrawal.
Previous literature has reported that cAMP signaling is upregulated in neurons and represents a common mechanism of reward tolerance, dependence, and withdrawal (45). A concerted upregulation of the cAMP pathway is thought to be a homeostatic adaptation to chronic opioid exposure which serves to oppose opioid action (tolerance) and drive physical withdrawal symptoms upon removal of the opioid. However, we observed a different result in microglia, where a cAMP related gene network was inversely regulated by morphine tolerance and withdrawal - apparently in the opposite direction than for neurons during opioid tolerance. While these previous studies focused on the neuronal transcriptome, the RNAs discussed here are presumed to be actively undergoing translation and may be affected by regulatory mechanisms other than transcription alone, thereby allowing for rapid and dramatic responses to conditions in the tissue. Further, the relationship between this gene network and the underlying cAMP activity is not entirely clear, as the network contains both cAMP-regulated genes and genes that regulate cAMP production and clearance. Future studies will be necessary to determine if microglia and neurons respond to opiate tolerance and withdrawal with truly inverse underlying cAMP signaling.
Microglia are thought to detect and compensate for changes in neuronal excitability in a Gi-dependent manner (32). Several receptors on microglia respond to neuronal activity, such as CX3CR1 (the fractalkine receptor) and P2Y12 (extracellular ATP/ADP receptor). Genetic deletion or inhibition of pannexin-1 (ATP channel) from microglia reduces the signs of opioid withdrawal (19), while P2Y12 receptors on microglia play a central role in opioid-associated hyperalgesia and neuropathic pain (46–48). Interestingly, both CX3CR1 and P2Y12 are Gi/o-coupled receptors that inhibit cAMP accumulation; it is likely that altered cAMP signaling in microglia is an important consequence of opioid withdrawal that is not directly mediated by opioid receptors.
cAMP Signaling in Striatal Microglia May Mitigate Opioid Withdrawal
The induction of cAMP-regulated genes in response to naloxone inhibition of mu opioid receptors seemed counterintuitive to us, since naloxone decreases Gi/o signaling in cells that express mu and delta opioid receptors (including microglia). To test this notion directly, we expressed the hM4Di DREADD receptor selectively in CX3CR1-expressing cells. The hM4Di DREADD receptor activates Gi/o-coupled signaling, including inhibition of adenylyl cyclase and has been used in microglia previously (22). We found that pretreatment of these mice with CNO exacerbated the signs of opioid withdrawal. These results suggest that cAMP signaling in microglia may mitigate the acute behavioral effects of opioid withdrawal and that the increased translation of cAMP-associated genes may produce compensatory effects in microglia that protect against opioid withdrawal. A potential caveat of this interpretation is that CX3CR1 is expressed in cells outside the CNS, such as monocytes and macrophages. Because CNO was administered systemically, hM4Di receptors on these cells may be contributing to the observed behavioral effects. In future studies, we aim to measure and manipulate microglial cAMP dynamics with greater specificity.
In summary, we used a new bioinformatics pipeline that revealed a dramatic, inverse pattern of RNA translation in striatal microglia during morphine tolerance and the early stage of opioid withdrawal. These changes in the microglia translatome were validated using FISH, appear to be cAMP mediated, and could be related to microglia-neuron interactions. Further, the induction of cAMP signaling in microglia may be an important and early compensatory response to opioid withdrawal, perhaps indicating that microglia help to mitigate withdrawal-induced neuronal hyperexcitability. Future studies should investigate microglia-specific mediators of these signaling events and explore the physical and chemical interaction between microglia and neurons that occurs during withdrawal.
Supplementary Material
Acknowledgments
Supported by NIDA Grants R21 DA044757 and T32 DA007278.
An early version of this manuscript was posted to bioRxiv - DOI: 10.1101/2020.02.10.942953
Footnotes
Competing Interests
Kevin R. Coffey has no conflicts of interest to disclose.
Atom J. Lesiak has no conflicts of interest to disclose.
Russell G. Marx has no conflicts of interest to disclose.
Emily K. Vo has no conflicts of interest to disclose.
Gwenn A. Garden has no conflicts of interest to disclose.
John F. Neumaier has no conflicts of interest to disclose.
References
- 1.O’Donnell JK, Halpin J, Mattson CL, Goldberger BA, Gladden RM (2017): Deaths Involving Fentanyl, Fentanyl Analogs, and U-47700 – 10 States, July-December 2016. MMWR Morb Mortal Wkly Rep. 66:1197–1202. [DOI] [PMC free article] [PubMed] [Google Scholar]
- 2.Rudd RA, Seth P, David F, Scholl L (2016): Increases in Drug and Opioid-Involved Overdose Deaths - United States, 2010–2015. MMWR Morb Mortal Wkly Rep. 65:1445–1452. [DOI] [PubMed] [Google Scholar]
- 3.Becker JAJ, Kieffer BL, Le Merrer J (2017): Differential behavioral and molecular alterations upon protracted abstinence from cocaine versus morphine, nicotine, THC and alcohol. Addict Biol. 22:1205–1217. [DOI] [PMC free article] [PubMed] [Google Scholar]
- 4.Befort K, Filliol D, Ghate A, Darcq E, Matifas A, Muller J, et al. (2008): Mu-opioid receptor activation induces transcriptional plasticity in the central extended amygdala. Eur J Neurosci. 27:2973–2984. [DOI] [PubMed] [Google Scholar]
- 5.Le Merrer J, Befort K, Gardon O, Filliol D, Darcq E, Dembele D, et al. (2012): Protracted abstinence from distinct drugs of abuse shows regulation of a common gene network. Addict Biol. 17:1–12. [DOI] [PubMed] [Google Scholar]
- 6.Bailly J, Del Rossi N, Runtz L, Li JJ, Park D, Scherrer G, et al. (2020): Targeting Morphine-Responsive Neurons: Generation of a Knock-In Mouse Line Expressing Cre Recombinase from the Mu-Opioid Receptor Gene Locus. eNeuro. 7. [DOI] [PMC free article] [PubMed] [Google Scholar]
- 7.Bachtell RK, Jones JD, Heinzerling KG, Beardsley PM, Comer SD (2017): Glial and neuroinflammatory targets for treating substance use disorders. Drug Alcohol Depend. 180:156–170. [DOI] [PMC free article] [PubMed] [Google Scholar]
- 8.Lacagnina MJ, Rivera PD, Bilbo SD (2017): Glial and Neuroimmune Mechanisms as Critical Modulators of Drug Use and Abuse. Neuropsychopharmacology. 42:156–177. [DOI] [PMC free article] [PubMed] [Google Scholar]
- 9.Linker KE, Cross SJ, Leslie FM (2019): Glial mechanisms underlying substance use disorders. Eur J Neurosci. 50:2574–2589. [DOI] [PMC free article] [PubMed] [Google Scholar]
- 10.Salter MW, Stevens B (2017): Microglia emerge as central players in brain disease. Nat Med. 23:1018–1027. [DOI] [PubMed] [Google Scholar]
- 11.Bidlack JM (2000): Detection and function of opioid receptors on cells from the immune system. Clin Diagn Lab Immunol. 7:719–723. [DOI] [PMC free article] [PubMed] [Google Scholar]
- 12.Zou S, Fitting S, Hahn YK, Welch SP, El-Hage N, Hauser KF, et al. (2011): Morphine potentiates neurodegenerative effects of HIV-1 Tat through actions at mu-opioid receptor-expressing glia. Brain. 134:3616–3631. [DOI] [PMC free article] [PubMed] [Google Scholar]
- 13.Maduna T, Audouard E, Dembele D, Mouzaoui N, Reiss D, Massotte D, et al. (2018): Microglia Express Mu Opioid Receptor: Insights From Transcriptomics and Fluorescent Reporter Mice. Frontiers in psychiatry. 9:726. [DOI] [PMC free article] [PubMed] [Google Scholar]
- 14.Leduc-Pessah H, Weilinger NL, Fan CY, Burma NE, Thompson RJ, Trang T (2017): Site-Specific Regulation of P2X7 Receptor Function in Microglia Gates Morphine Analgesic Tolerance. J Neurosci. 37:10154–10172. [DOI] [PMC free article] [PubMed] [Google Scholar]
- 15.Badimon A, Strasburger HJ, Ayata P, Chen X, Nair A, Ikegami A, et al. (2020): Negative feedback control of neuronal activity by microglia. Nature. 586:417–423. [DOI] [PMC free article] [PubMed] [Google Scholar]
- 16.Merlini M, Rafalski VA, Ma K, Kim KY, Bushong EA, Rios Coronado PE, et al. (2021): Microglial Gi-dependent dynamics regulate brain network hyperexcitability. Nat Neurosci. 24:19–23. [DOI] [PMC free article] [PubMed] [Google Scholar]
- 17.Campbell LA, Avdoshina V, Rozzi S, Mocchetti I (2013): CCL5 and cytokine expression in the rat brain: differential modulation by chronic morphine and morphine withdrawal. Brain Behav Immun. 34:130–140. [DOI] [PMC free article] [PubMed] [Google Scholar]
- 18.Hutchinson MR, Lewis SS, Coats BD, Skyba DA, Crysdale NY, Berkelhammer DL, et al. (2009): Reduction of opioid withdrawal and potentiation of acute opioid analgesia by systemic AV411 (ibudilast). Brain Behav Immun. 23:240–250. [DOI] [PMC free article] [PubMed] [Google Scholar]
- 19.Burma NE, Bonin RP, Leduc-Pessah H, Baimel C, Cairncross ZF, Mousseau M, et al. (2017): Blocking microglial pannexin-1 channels alleviates morphine withdrawal in rodents. Nat Med. 23:355–360. [DOI] [PubMed] [Google Scholar]
- 20.Cai Y, Kong H, Pan YB, Jiang L, Pan XX, Hu L, et al. (2016): Procyanidins alleviates morphine tolerance by inhibiting activation of NLRP3 inflammasome in microglia. J Neuroinflammation. 13:53. [DOI] [PMC free article] [PubMed] [Google Scholar]
- 21.Gessi S, Borea PA, Bencivenni S, Fazzi D, Varani K, Merighi S (2016): The activation of mu-opioid receptor potentiates LPS-induced NF-kB promoting an inflammatory phenotype in microglia. FEBS Lett. 590:2813–2826. [DOI] [PubMed] [Google Scholar]
- 22.Grace PM, Strand KA, Galer EL, Urban DJ, Wang X, Baratta MV, et al. (2016): Morphine paradoxically prolongs neuropathic pain in rats by amplifying spinal NLRP3 inflammasome activation. Proc Natl Acad Sci U S A. 113:E3441–3450. [DOI] [PMC free article] [PubMed] [Google Scholar]
- 23.Jacobsen JH, Watkins LR, Hutchinson MR (2014): Discovery of a novel site of opioid action at the innate immune pattern-recognition receptor TLR4 and its role in addiction. Int Rev Neurobiol. 118:129–163. [DOI] [PubMed] [Google Scholar]
- 24.Zhang Y, Li H, Li Y, Sun X, Zhu M, Hanley G, et al. (2011): Essential role of toll-like receptor 2 in morphine-induced microglia activation in mice. Neurosci Lett. 489:43–47. [DOI] [PMC free article] [PubMed] [Google Scholar]
- 25.Sakers K, Lake AM, Khazanchi R, Ouwenga R, Vasek MJ, Dani A, et al. (2017): Astrocytes locally translate transcripts in their peripheral processes. Proc Natl Acad Sci U S A. 114:E3830–E3838. [DOI] [PMC free article] [PubMed] [Google Scholar]
- 26.Haimon Z, Volaski A, Orthgiess J, Boura-Halfon S, Varol D, Shemer A, et al. (2018): Re-evaluating microglia expression profiles using RiboTag and cell isolation strategies. Nat Immunol. 19:636–644. [DOI] [PMC free article] [PubMed] [Google Scholar]
- 27.Contet C, Filliol D, Matifas A, Kieffer BL (2008): Morphine-induced analgesic tolerance, locomotor sensitization and physical dependence do not require modification of mu opioid receptor, cdk5 and adenylate cyclase activity. Neuropharmacology. 54:475–486. [DOI] [PubMed] [Google Scholar]
- 28.Corder G, Tawfik VL, Wang D, Sypek EI, Low SA, Dickinson JR, et al. (2017): Loss of mu opioid receptor signaling in nociceptors, but not microglia, abrogates morphine tolerance without disrupting analgesia. Nat Med. 23:164–173. [DOI] [PMC free article] [PubMed] [Google Scholar]
- 29.Lesiak AJ, Coffey K, Cohen JH, Liang KJ, Chavkin C, Neumaier JF (2020): Sequencing the serotonergic neuron translatome reveals a new role for Fkbp5 in stress. Mol Psychiatry. [DOI] [PMC free article] [PubMed] [Google Scholar]
- 30.Afgan E, Baker D, van den Beek M, Blankenberg D, Bouvier D, Cech M, et al. (2016): The Galaxy platform for accessible, reproducible and collaborative biomedical analyses: 2016 update. Nucleic Acids Res. 44:W3–W10. [DOI] [PMC free article] [PubMed] [Google Scholar]
- 31.Patro R, Duggal G, Love MI, Irizarry RA, Kingsford C (2017): Salmon provides fast and bias-aware quantification of transcript expression. Nature methods. 14:417–419. [DOI] [PMC free article] [PubMed] [Google Scholar]
- 32.Levinstein MR, Coffey KR, Marx RG, Lesiak AJ, Neumaier JF (2020): Stress induces divergent gene expression among lateral habenula efferent pathways. Neurobiology of stress. 13:100268. [DOI] [PMC free article] [PubMed] [Google Scholar]
- 33.Love MI, Huber W, Anders S (2014): Moderated estimation of fold change and dispersion for RNA-seq data with DESeq2. Genome Biol. 15:550. [DOI] [PMC free article] [PubMed] [Google Scholar]
- 34.Liao Y, Wang J, Jaehnig EJ, Shi Z, Zhang B (2019): WebGestalt 2019: gene set analysis toolkit with revamped UIs and APIs. Nucleic Acids Res. 47:W199–W205. [DOI] [PMC free article] [PubMed] [Google Scholar]
- 35.Langfelder P, Horvath S (2008): WGCNA: an R package for weighted correlation network analysis. BMC Bioinformatics. 9:559. [DOI] [PMC free article] [PubMed] [Google Scholar]
- 36.R Development Core Team (2010): R: A language and environment for statistical computing. Vienna, Austria: R Foundation for Statistical Computing. [Google Scholar]
- 37.Cobeldick S (2020): Convert between RGB and Color Names. MATLAB Central File Exchange. [Google Scholar]
- 38.York EM, LeDue JM, Bernier LP, MacVicar BA (2018): 3DMorph Automatic Analysis of Microglial Morphology in Three Dimensions from Ex Vivo and In Vivo Imaging. eNeuro. 5. [DOI] [PMC free article] [PubMed] [Google Scholar]
- 39.McKenzie AT, Wang M, Hauberg ME, Fullard JF, Kozlenkov A, Keenan A, et al. (2018): Brain Cell Type Specific Gene Expression and Co-expression Network Architectures. Sci Rep. 8:8868. [DOI] [PMC free article] [PubMed] [Google Scholar]
- 40.Langfelder P, Zhang B, Horvath S (2008): Defining clusters from a hierarchical cluster tree: the Dynamic Tree Cut package for R. Bioinformatics. 24:719–720. [DOI] [PubMed] [Google Scholar]
- 41.Bernier LP, Bohlen CJ, York EM, Choi HB, Kamyabi A, Dissing-Olesen L, et al. (2019): Nanoscale Surveillance of the Brain by Microglia via cAMP-Regulated Filopodia. Cell reports. 27:2895–2908 e2894. [DOI] [PubMed] [Google Scholar]
- 42.Gerrits E, Heng Y, Boddeke E, Eggen BJL (2019): Transcriptional profiling of microglia; current state of the art and future perspectives. Glia. [DOI] [PMC free article] [PubMed] [Google Scholar]
- 43.Allen PB, Greenfield AT, Svenningsson P, Haspeslagh DC, Greengard P (2004): Phactrs 1–4: A family of protein phosphatase 1 and actin regulatory proteins. Proc Natl Acad Sci U S A. 101:7187–7192. [DOI] [PMC free article] [PubMed] [Google Scholar]
- 44.Han H, Dong Z, Jia Y, Mao R, Zhou Q, Yang Y, et al. (2015): Opioid addiction and withdrawal differentially drive long-term depression of inhibitory synaptic transmission in the hippocampus. Sci Rep. 5:9666. [DOI] [PMC free article] [PubMed] [Google Scholar]
- 45.Quina LA, Tempest L, Ng L, Harris JA, Ferguson S, Jhou TC, et al. (2015): Efferent pathways of the mouse lateral habenula. J Comp Neurol. 523:32–60. [DOI] [PMC free article] [PubMed] [Google Scholar]
- 46.Jing F, Zhang Y, Long T, He W, Qin G, Zhang D, et al. (2019): P2Y12 receptor mediates microglial activation via RhoA/ROCK pathway in the trigeminal nucleus caudalis in a mouse model of chronic migraine. J Neuroinflammation. 16:217. [DOI] [PMC free article] [PubMed] [Google Scholar]
- 47.Gu N, Eyo UB, Murugan M, Peng J, Matta S, Dong H, et al. (2016): Microglial P2Y12 receptors regulate microglial activation and surveillance during neuropathic pain. Brain Behav Immun. 55:82–92. [DOI] [PMC free article] [PubMed] [Google Scholar]
- 48.Horvath G, Goloncser F, Csolle C, Kiraly K, Ando RD, Baranyi M, et al. (2014): Central P2Y12 receptor blockade alleviates inflammatory and neuropathic pain and cytokine production in rodents. Neurobiol Dis. 70:162–178. [DOI] [PMC free article] [PubMed] [Google Scholar]
Associated Data
This section collects any data citations, data availability statements, or supplementary materials included in this article.