Abstract
The macroscale neuronal connections of the lateral preoptic area (LPO) and the caudally adjacent lateral hypothalamic area anterior region (LHAa) were investigated in mice by anterograde and retrograde axonal tracing. Both hypothalamic regions are highly and diversely connected, with connections to >200 gray matter regions spanning the forebrain, midbrain, and rhombicbrain. Intrahypothalamic connections predominate, followed by connections with the cerebral cortex and cerebral nuclei. A similar overall pattern of LPO and LHAa connections contrasts with substantial differences between their input and output connections. Strongest connections include outputs to the lateral habenula, medial septal and diagonal band nuclei, and inputs from rostral and caudal lateral septal nuclei; however, numerous additional robust connections were also observed. The results are discussed in relation to a current model for the mammalian forebrain network that associates LPO and LHAa with a range of functional roles, including reward prediction, innate survival behaviors (including integrated somatomotor and physiological control), and affect. The present data suggest a broad and intricate role for LPO and LHAa in behavioral control, similar in that regard to previously investigated LHA regions, contributing to the finely tuned sensory-motor integration that is necessary for behavioral guidance supporting survival and reproduction.
Keywords: Hypothalamus, lateral hypothalamus, sensory-motor integration, innate behavior, reward
Graphical Abstract
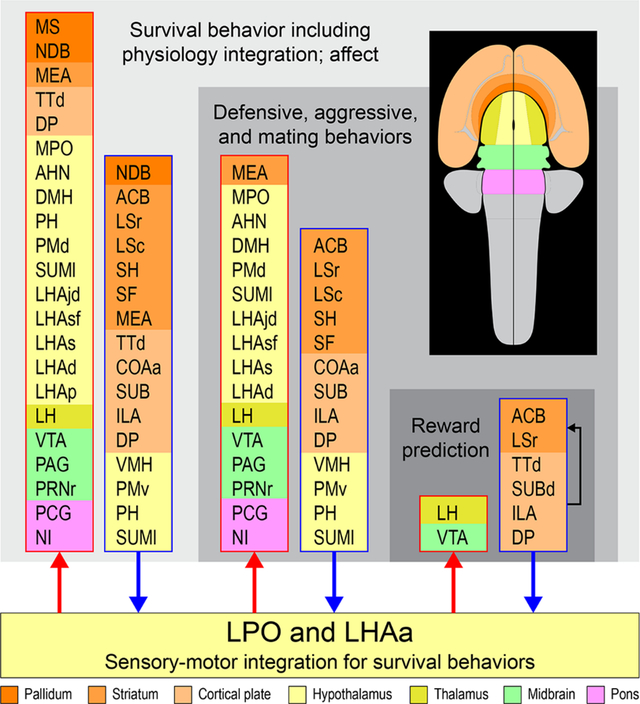
Prominent multilevel lateral preoptic area (LPO) and lateral hypothalamic area anterior region (LHAa) functional associations. Three nested tiers of functional grouping are represented (gray shaded tiles), and for each is listed functional grouping-related gray matter regions with prominent connections to LPO and LHAa; outputs and inputs are indicated respectively by red and blue colored lines and arrows. Regions are color-coded by tiles representing their major brain division (shown on the flatmap insert) and are listed in a topographic arrangement.
1. Introduction
The lateral hypothalamic zone (HYl) (Nauta & Haymaker, 1969) is the lateralmost of three longitudinal divisions of the hypothalamus. Two widely used brain reference atlases for rat (Brain Maps 4.0 [BM4], Swanson, 2018) and mouse (Dong, 2007; available online since 2008 as the Allen Reference Atlas version 1 [ARAv1]: https://mouse.brain-map.org/static/atlas), subdivide HYl into multiple gray matter divisions. Two prominent and spatially extensive HYl divisions that together span the rostral to caudal length of the HYl (and the hypothalamus), are the lateral preoptic area (LPO) and the lateral hypothalamic area (LHA). In ARAv1 (mouse), the LPO and LHA are not subdivided, but in BM4 (rat) a higher spatial resolution parcellation identifies several LHA subdivisions that are assigned to one of three LHA groups: anterior, middle, or posterior. Here we focus on the LHA anterior region (LHAa—one of two gray matter regions comprising the LHA anterior group, the other being the retrochiasmatic area), and the LPO. In addition to its rostralmost position in HYl, the LPO also forms the rostral pole of the hypothalamus (in mouse and rat), and the LPO and caudally adjacent LHAa together form the rostralmost portion of the LHA anterior group.
Although LHAa boundaries in mouse are not previously delineated as they are in rat, equivalent adjacent regions and other fiducials such as white matter tracts (notably the fornix), enable a provisional comparative delineation of mouse LHAa boundaries. In support of this approach as a starting point for investigating LHA subparcellation in the mouse, a recent comparative analysis of cellular parcellation at the level of gray matter regions for the mouse and rat brain, using the same mouse (ARAv1) and rat (BM4) brain reference atlases referred to here, identified very few regions that did not have a clearly identified counterpart in both mammalian species; none was located in the LHA, and only one was located in the hypothalamus (a medial division of the hypothalamic paraventricular nucleus) (Hahn et al., 2021).
Here we investigate mouse LHA subparcellation by performing a comparative analysis of the LPO and LHAa neuronal connections (in so far as the latter is considered a provisional subdivision of mouse LHA with spatial correspondence to LHAa delineated in rat). Our rationale for selecting the LPO and LHAa as a starting point is two-fold: firstly, the connections of both regions are poorly understood, and secondly, direct adjacency of the LPO (a gray matter region without subdivision in either mouse or rat) and LHA (currently undivided in the ARAv1 mouse brain atlas, but with multiple subdivisions in the BM4 rat brain atlas) provides a clear border at the rostral end of provisional LHAa in mouse; well-defined cytoarchitecture and other fiducials in BM4 and ARAv1 delineate other boundaries (Figure 1).
Figure 1.
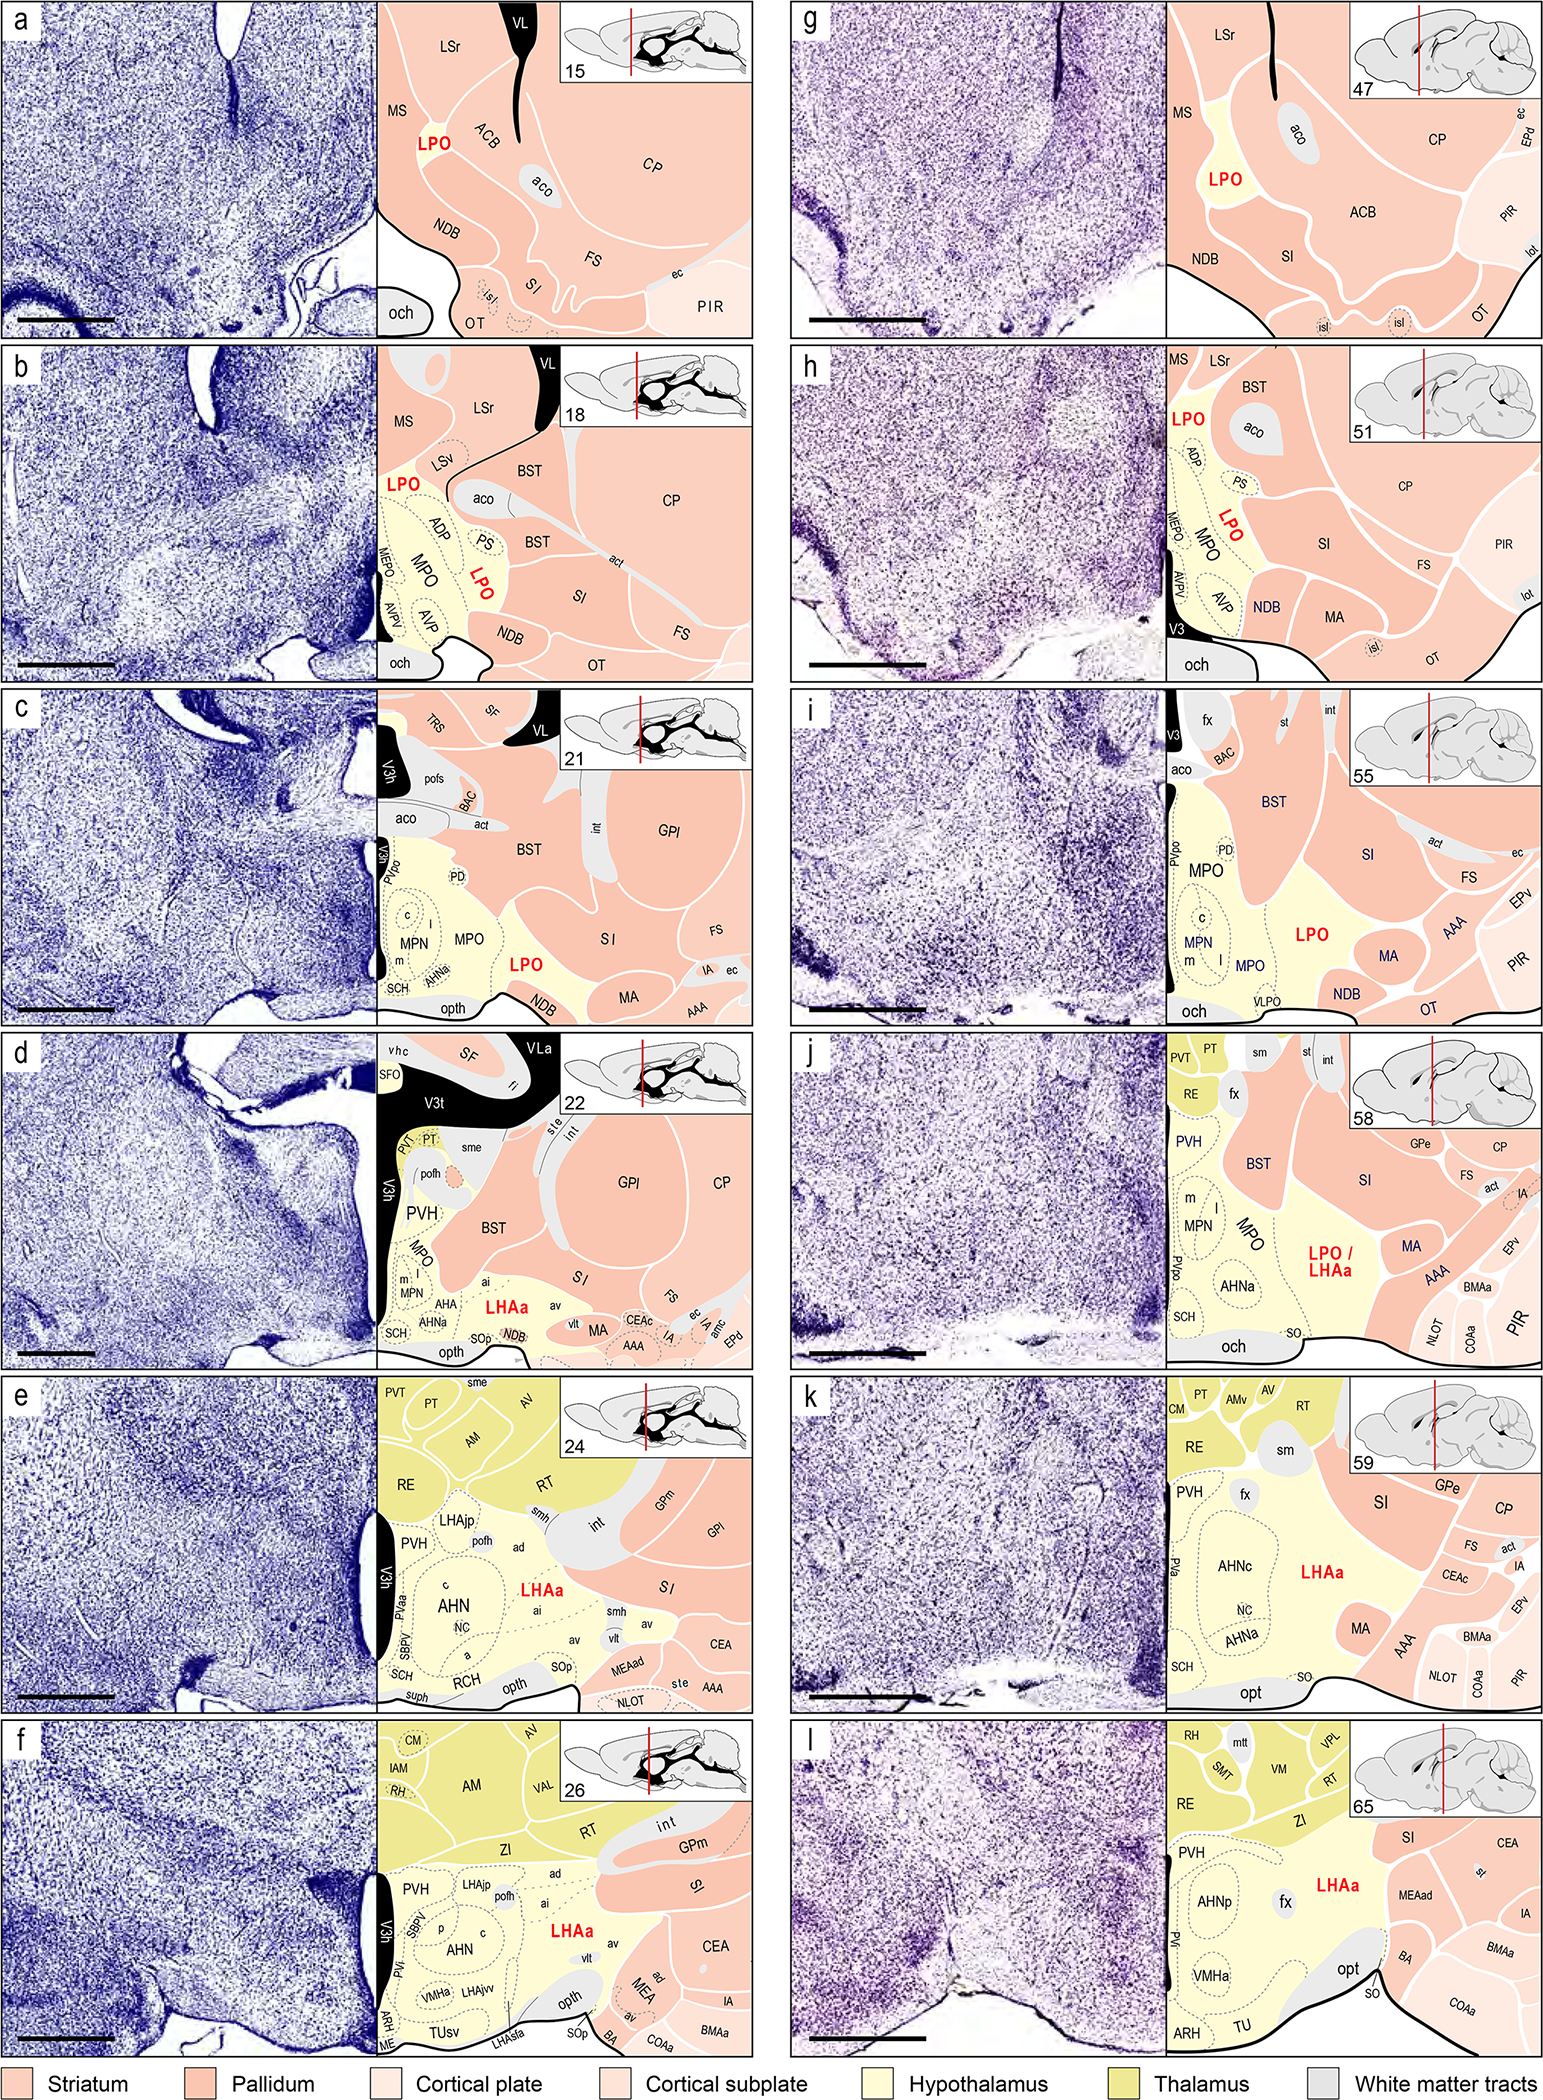
Representative comparative overview of LPO and LHAa cytoarchitectural parcellation in rat and mouse. Two columns each show six comparable atlas levels (from rostral at top to caudal at bottom) and their corresponding Nissl cytoarchitecture, adapted from two widely used brain reference atlases, for rat (left column, a-f; BM4, Swanson, 2018), and mouse (right column, g-l; ARAv1, Dong, 2007). For each atlas level, insets (top right) give the atlas level number and show the rostral-caudal position on a parasagittal schematic of the brain. To facilitate visual comparison, the mouse brain atlas levels are recolored to match the divisional color scheme applied to the rat brain atlas (color key below the figure). Panels a, c, and d, f show the starting (most rostral) and ending (most caudal) atlas levels of (respectively) the rat LPO and LHAa (labeled in red), with intervening atlas levels for each shown in b and e. Panels g-h show comparable atlas levels of the mouse brain atlas. Mouse LHAa provisional parcellation was determined with reference to its parcellation in the rat. According to LHAa parcellation in rat (BM4), it begins at the level of the anterior hypothalamic nucleus anterior part (AHNa); however, at a comparable atlas level in ARAv1 the same region is labeled LPO (indicated in j by LPO / LHAa label). The most caudal level of rat LHAa (f) is identified by the level of the hypothalamic paraventricular nucleus (PVH) immediately before its forniceal part appears; accordingly, a comparable atlas level is selected from ARAv1 as the provisional caudal end of the mouse LHAa (l). Bars are 1 mm (applies to Nissl images and their corresponding atlas levels). For abbreviations see Supporting Information 1.
As was noted in previous analyses of the neuronal connections of several divisions of the LHA middle group in rat, the Nissl-based cytoarchitecture of the LHA (and HYl in general) is generally less distinct than that of the medial and periventricular hypothalamic zones (Hahn & Swanson, 2010, 2012, 2015). This dichotomy is also apparent in mice, and it is reflected in the conservative approach followed in ARAv1 of not subdividing LHA. However, using the fiducials of distinct adjacent neural architecture, supported by comparable mouse and rat stereotaxic brain reference atlases, and combined with existing knowledge of their connections (Hahn et al., 2019; Hahn & Swanson, 2010, 2012, 2015; Swanson et al., 2020), an axonal tracing approach is well suited to investigating subparcellation of mouse LHA.
2. Methods
The methods used here were in part described previously (Hintiryan et al., 2016; Zingg et al., 2014). All experiments involving the use of animals were performed according to the National Institutes of Health guidelines for the care and use of laboratory animals, and all protocols were approved by the Institutional Animal Care and Use Committee of the university of Southern California.
2.1. Animals and surgery
A total of 83 male C57Bl/6J mice (8-week-old; Jackson Laboratories) were used for the axonal tracing experiments targeting the lateral hypothalamic zone. The mice were group-housed in a room that was temperature (21–22 °C), humidity (51%), and light controlled (12-h light/12-h dark cycle); they had free access to potable water and a standard laboratory mouse diet. Prior to surgery for tracer injections, the mice were allowed 1–2 weeks to adapt to their environment. All surgical procedures were performed under constant inhalation anesthesia by isoflurane (Pfizer inc, formerly from Hospira inc). To support reliability and reproducibility of data, we used a combination of four widely used axonal tracers (2 for anterograde tracing and 2 for retrograde tracing) that we have used successfully in several previous studies (Benavidez et al., 2021; Bienkowski et al., 2019; Bienkowski et al., 2018; Foster et al., 2021; Hahn & Swanson, 2010, 2012, 2015; Hintiryan et al., 2021; Hintiryan et al., 2016; Hintiryan et al., 2012; Hsu et al., 2015; Munoz-Castaneda et al., 2021; Noble et al., 2018; Zingg et al., 2018; Zingg et al., 2014). The following axonal tracers, all delivered iontophoretically, were used: (three for anterograde tracing) Phaseolous vulgaris leucoagglutinin (PHAL, 2.5% w/v in PBS pH 7.4; Vector Biolabs), or an adeno-associated virus (AAV) encoding a red (tandem dimer Tomato [tdTomato]) or green (green fluorescent protein [GFP]) fluorescent reporter (AAV1.CAG.tdtomato.WPRE.SV40 [titer: 2.0 × 10¹³] or AAV1.hSyn.eGFP.WPRE.bGH [titer: 2.7 × 10¹³], both from Penn Vector Core at University of Pennsylvania / James M. Wilson); (three for retrograde tracing) Fluorogold (FG, 1% w/v in 0.9% NaCl; Fluorochrome, LLC), cholera toxin B subunit conjugated to fluorescent reporter AlexaFluor 647 (CTB-647, 0.25% w/v in PBS pH 7.4; Invitrogen). The axonal tracers were injected sequentially. Stereotaxic coordinates were determined with reference to ARAv1, and with additional reference to BM4 for provisional delineation of the LHAa (Figure 1), accordingly central coordinates were as follows: LPO, −0.1 mm posterior to Bregma, 1.4 mm lateral to the midline, 5.8 mm ventral to the dorsal brain surface; LHAa, −0.65 mm posterior to Bregma, 1.5 mm lateral to the midline, 6.0 mm ventral to the dorsal brain surface. Glass micropipette tip diameters (inner) for injection were 7–12 μm (AAv-tdTomato and AAV-GFP), 20–24 μm (PHAL, and AAV-retroCre), 28–32 μm (FG). A 5 μA current applied cyclically (7 s on/off) was used to deliver the tracers. Iontophoresis duration was varied for different tracers: 3 min for AAV-tdTomato and AAV-GFP, 5 min for AAV-retroCre and FG, 10 min for PHAL. Three weeks after surgery, under deep pentobarbital anesthesia, the mice were transcardially perfused with 50 ml of 0.9% NaCl followed by 50 ml of 4% paraformaldehyde solution (PFA; pH 9.5).
2.2. Histology
The perfusion-fixed brains were post-fixed in 4% PFA for 24–48 hours at 4°C, after which they were embedded in 3% Type I-B agarose (Sigma-Aldrich) prior to serial sectioning. Four series of coronal sections were sliced at 50-μm thickness with a Compresstome (VF-700, Precisionary Instruments, Greenville, NC), and stored in cryoprotectant at −20°C until further processing for detection of axonal tracers and Nissl staining. Immunocytochemical detection of PHAL in free-floating sections was accomplished with a polyclonal rabbit anti-PHAL primary antibody (diluted 1:5,000; Vector Labs #AS-2300), followed by a polyclonal donkey anti-rabbit secondary antibody conjugated to AlexaFluor 488 (diluted 1:1,000; Jackson ImmunoResearch #711–545-152). Detection of FG, CTB-647, AAV-tdTomato, and AAV-GFP tracers was accomplished without immunocytochemistry. Sections were counterstained with a fluorescent Nissl stain (NeuroTrace 435/455, diluted 1:500; Invitrogen, #N21479) and then were mounted and coverslipped using 65% glycerol mountant.
2.3. Imaging
The slide-mounted sections were scanned digitally by a VS120 automated slide scanner (Olympus) using a 10x objective, generating a pixel resolution of <1 μm/pixel (at section surface). Equal exposure parameters were applied across scans, and the scans were encoded as virtual slide image (VSI) files (an Olympus image file format). Depending on the number of tracers used, up to 5 channels were scanned sequentially (always including one channel for the Nissl-stained sections).
2.4. Data analysis
Experimental sections with fluorescent Nissl counterstain were visually compared to the reference atlas (ARAv1) to determine correspondence. Differences in the plane of section were noted, so that if a given section from an experiment selected for analysis intersected more than one atlas level then the corresponding portion of that section was mapped to its corresponding atlas level. Data analysis was aided by an Excel spreadsheet with columns representing all ARAv1 atlas levels, and rows representing all gray matter divisions and their subdivisions represented in the atlas, enabling data entry for any combination of represented gray matter division and reference atlas level; the layout of this spreadsheet is shown in in Supporting Information 1. All data entered into the spreadsheet occurred after careful and direct visual comparison of labeled tracer in relation to the fluorescent Nissl counterstain and the reference atlas. The most extensive analysis was applied to the optimal experiments (for LPO and LHAa), determined according to the following criteria: 1) coverage and restriction of tracer injection site to region of interest, 2) similarity of tissue section plane to that of the reference atlas, 3) histology quality (reporter signal strength, tissue integrity), 4) imaging quality (consistent, least artifacts).
For macroscale analysis, with one exception (LHA), data were aggregated at the ARAv1 gray matter region level of granularity. For the LHA, because it was not subdivided in ARAv1, and because a central aim of the present study was to determine the connections of an LHA provisional subdivision (LHAa) in mouse that was previously identified as a gray matter region in rat, provisional mouse hypothalamus counterparts were identified for the other LHA gray matter region subdivisions identified in rat. This was accomplished by careful visual comparison of cytoarchitecture, and other fiducials present in both species and depicted in their corresponding reference atlases (the same approach that was used to delineate mouse LHAa provisional parcellation). Additionally, an internuclear region that is medially adjacent to the LHA was also delineated (that in ARAv1 is not delineated separately from the LHA). This approach enabled a more fine-grained comparative analysis of mouse provisional LHAa in relation to other provisional mouse LHA subdivisions (rather than taking the cruder approach of comparing LHAa connectivity to the rest of the LHA as a single undifferentiated subdivision), and it also generated preliminary data for future comparative LHA subdivision analysis in mice.
Anterograde axonal tracing data were assigned a score from 1 (very weak) to 7 (very strong) reflecting the abundance and density of axonal labeling (a value of zero was used to denote absence of labeling). This approach, employing an ordinal 0–7 scale metric to quantify macroscale connections, follows its previous use for this purpose (Hahn et al., 2019; Swanson et al., 2020). Retrograde axonal tracing data were recorded as a count of retrogradely neurons by region (gray matter division) and atlas level. A labeled neuron was counted only if its soma could be clearly distinguished. The division of tissue sections into four collated series prior to tracer visualization and imaging obviated potential double-count errors. To facilitate direct comparison of anterograde and retrograde tracing data, the raw retrograde tracing (count) data were binned into 7 ordinal bins (1–7). To preserve qualitative fidelity of the retrograde tracing data, prior to calculation of mean averages and highest values, a non-linear binning approach was used to reduce skew resulting from the wide range of neuropil volume occupied by different gray matter divisions (Table 1). Following this rationale, for both retrograde and anterograde tracing data, mean averages for regions across their atlas levels were calculated based on positive data (present connections), because tracer injection region of interest coverage is typically partial and more spatially extensive regions will tend to have more zero values across their atlas levels. For the binned retrograde tracing data, a wider bin range for the 1–7 positive data bins was applied to the calculation of highest values because those tend naturally to be higher than mean values (Table 1) (the same consideration did not apply to the anterograde tracing data that was entered using the 1–7 ordinal scale bins).
Table 1. Assignment of bins for retrograde pathway tracing data.
Retrograde tracing data were assigned to one of seven bins according to the range of positively identified labeled neurons that were counted. A different bin range was used for calculation of average (mean) and highest value data (see Methods for details).
| Descriptor | Mean average | Highest value | ||
|---|---|---|---|---|
|
| ||||
| Neuron count | Binned value | Neuron count | Binned value | |
|
| ||||
| very weak | 1 to <2 | 1 | 1 to <5 | 1 |
| weak | 2 to <5 | 2 | 5 to <8 | 2 |
| weak-moderate | 5 to <8 | 3 | 8 to <13 | 3 |
| moderate | 8 to <13 | 4 | 13 to <21 | 4 |
| moderate-strong | 13 to <21 | 5 | 21 to <34 | 5 |
| very strong | 21 to <34 | 6 | 34 to <55 | 6 |
| strong | >34 | 7 | >55 | 7 |
3. Results
Analysis of axonal tracing data from LPO or LHAa tracer injections that were centered in, and mostly restricted to, either lateral hypothalamic region (Figure 2, 3, and Supporting Information 1) and supported by confirmatory data from additional experiments (see Results section 3.4), revealed at the level of major brain divisions substantial similarity in the connection patterns (inputs and outputs) of LPO and LHAa across their rostral-caudal extents (Figure 3, 4), and also in terms of the relative proportion of their connections to each major brain division (Figure 5). Additionally, although the pattern and strengths of LPO and LHAa connections differed substantially with respect to their inputs and outputs, LPO and LHAa connections were broadly similar (Figure 3, 6). In contrast, some divergence between LPO and LHAa connectivity was apparent at the resolution of individual gray matter regions (and/or subregionally for individual reference atlas levels, Figure 3), but marked differences were relatively few. We first describe the results for LPO and LHAa output connections, and then for their input connections.
Figure 2.
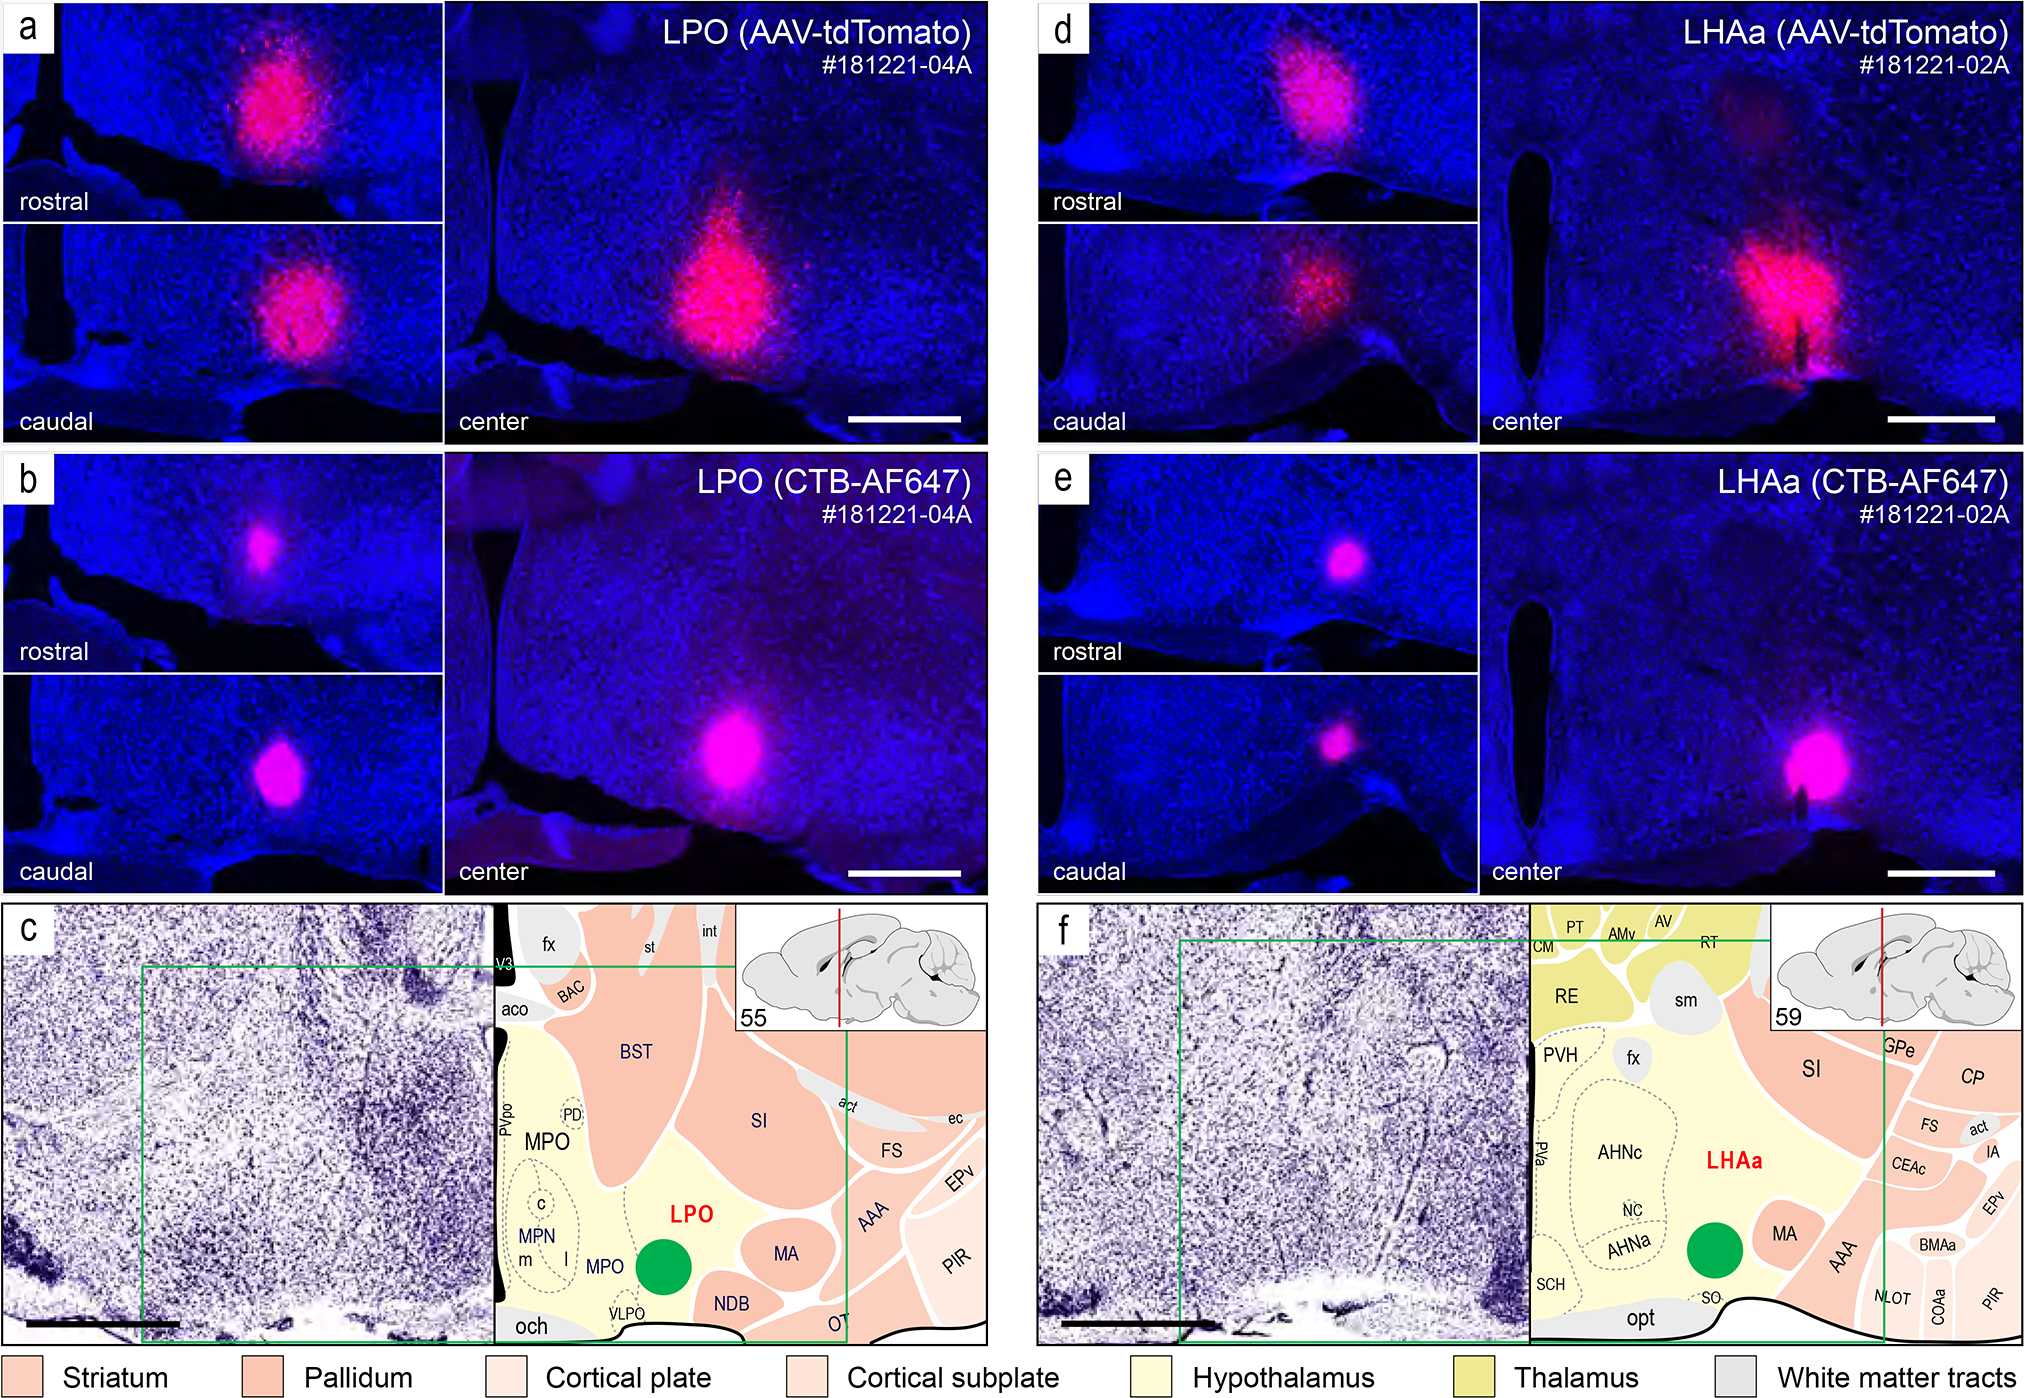
Injection sites from two representative axonal tracing experiments (181221–04A [LPO], and 181221–02A [LHAa]) that were mostly restricted to a midventral part of the LPO (a-c) and LHAa (d-f). For each experiment, a combination of two axonal tracers was injected in series: AAV-tdTomato (a and d, red) and CTB-647 (b and e, pink). The tissue sections were counterstained with a fluorescent Nissl stain (see Methods for details) to facilitate mapping to a reference atlas (c and e, adapted from Dong, 2007). The atlas levels shown in c and e are the closest match for the center of the injection sites. The green box in c and e represents the approximate area of the corresponding images above, and the green discs represent the approximate location and local spread of the axonal tracers at the center of the injection sites. The left upper and left lower images in a, b, d, e show spread of the tracers rostral (upper left) and caudal (lower left) within the LPO (a and b) and LHAa (c and e) from the center of the corresponding injection sites. Scale bars are 500 μm. For abbreviations see Supporting Information 1.
Figure 3.
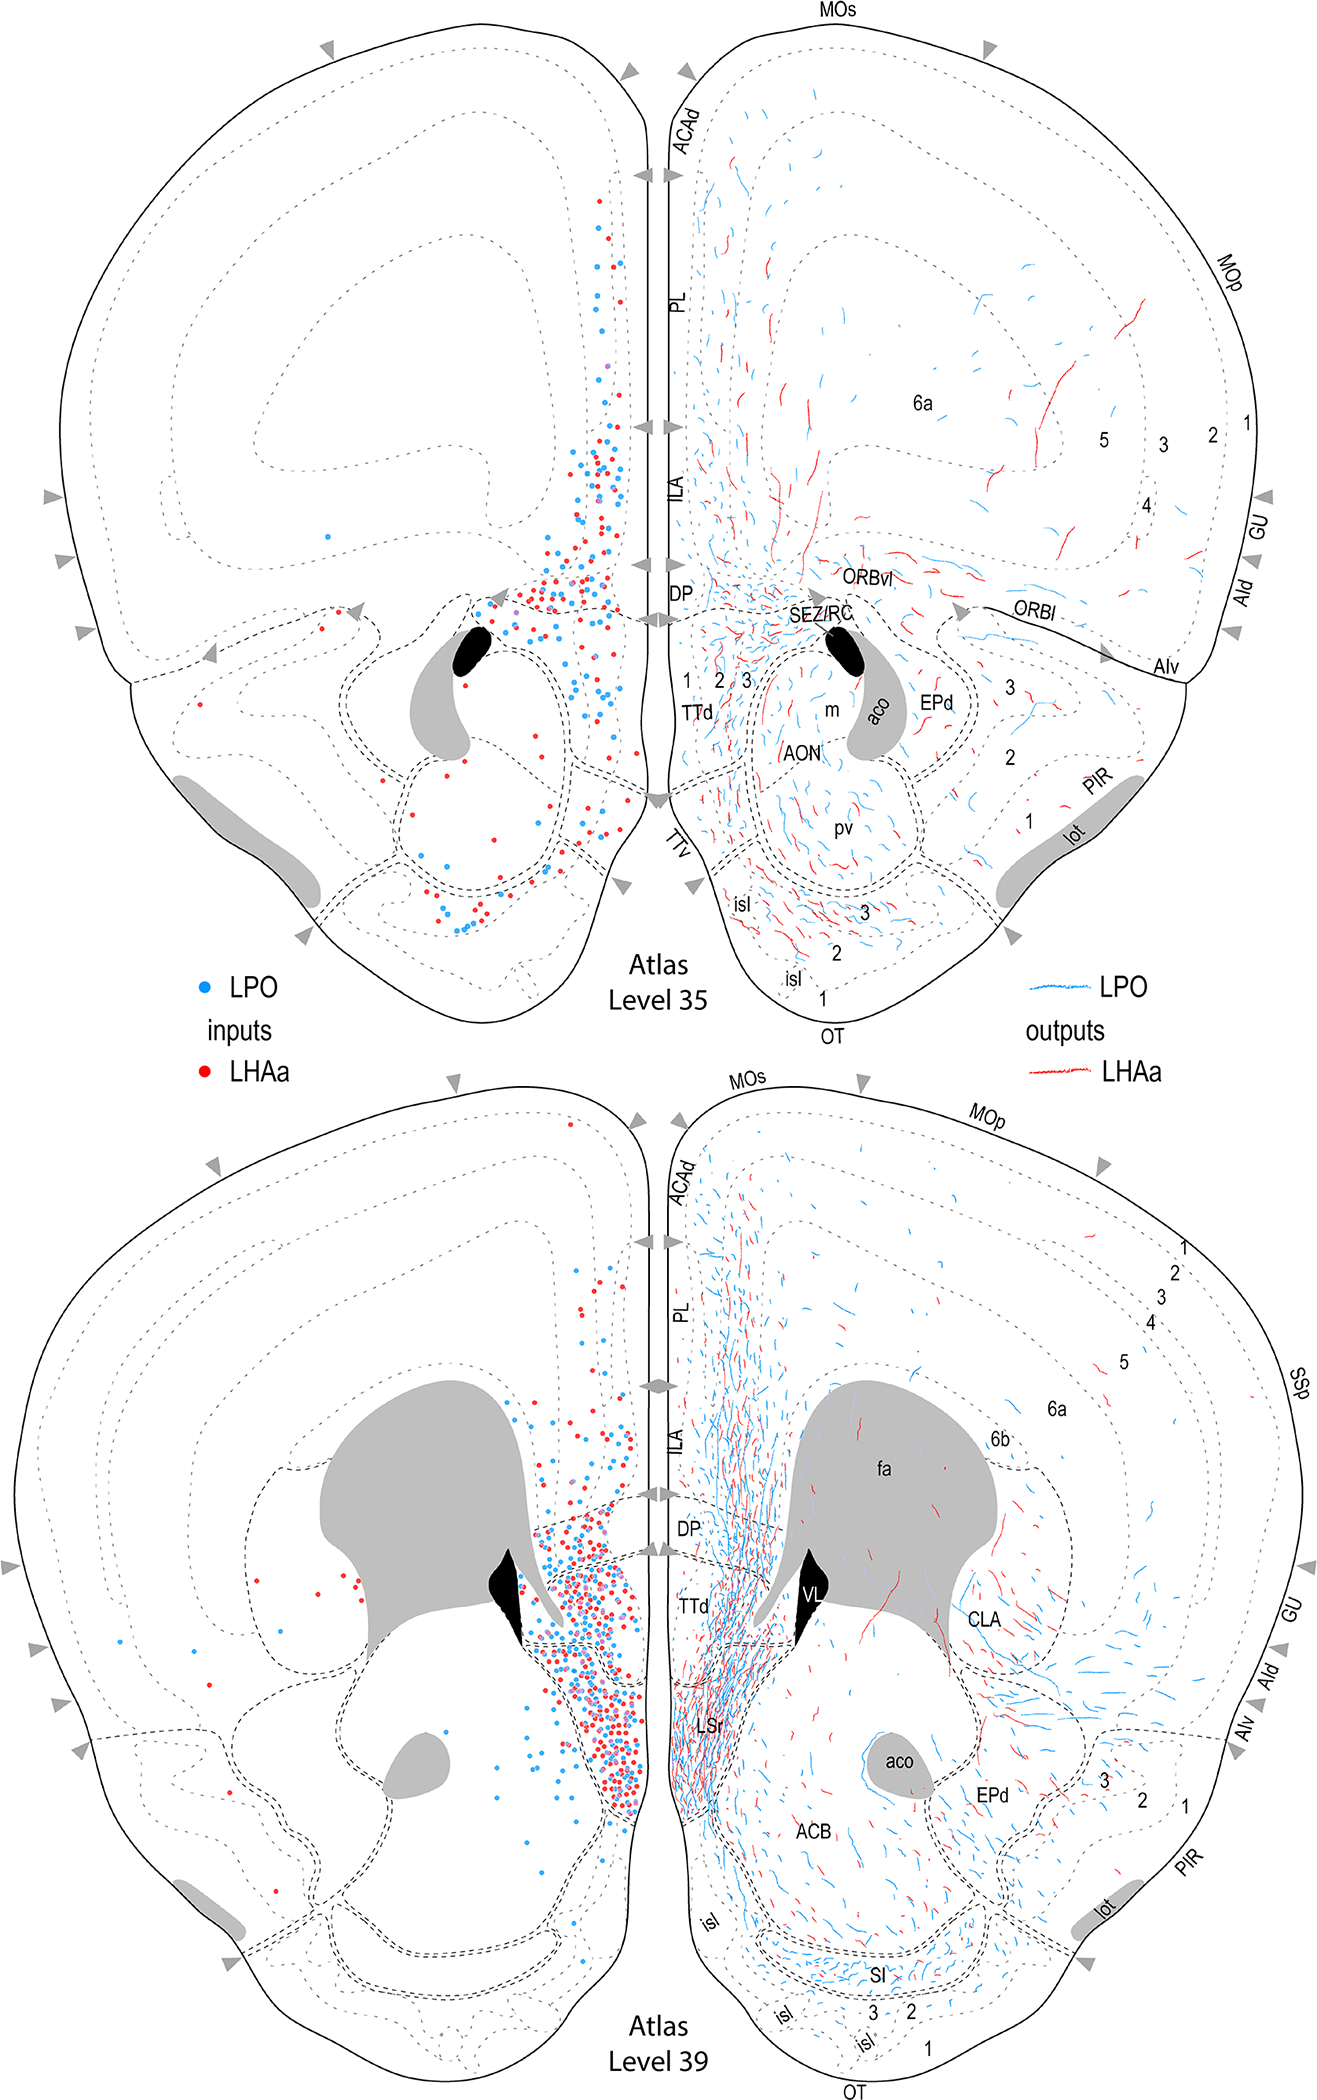
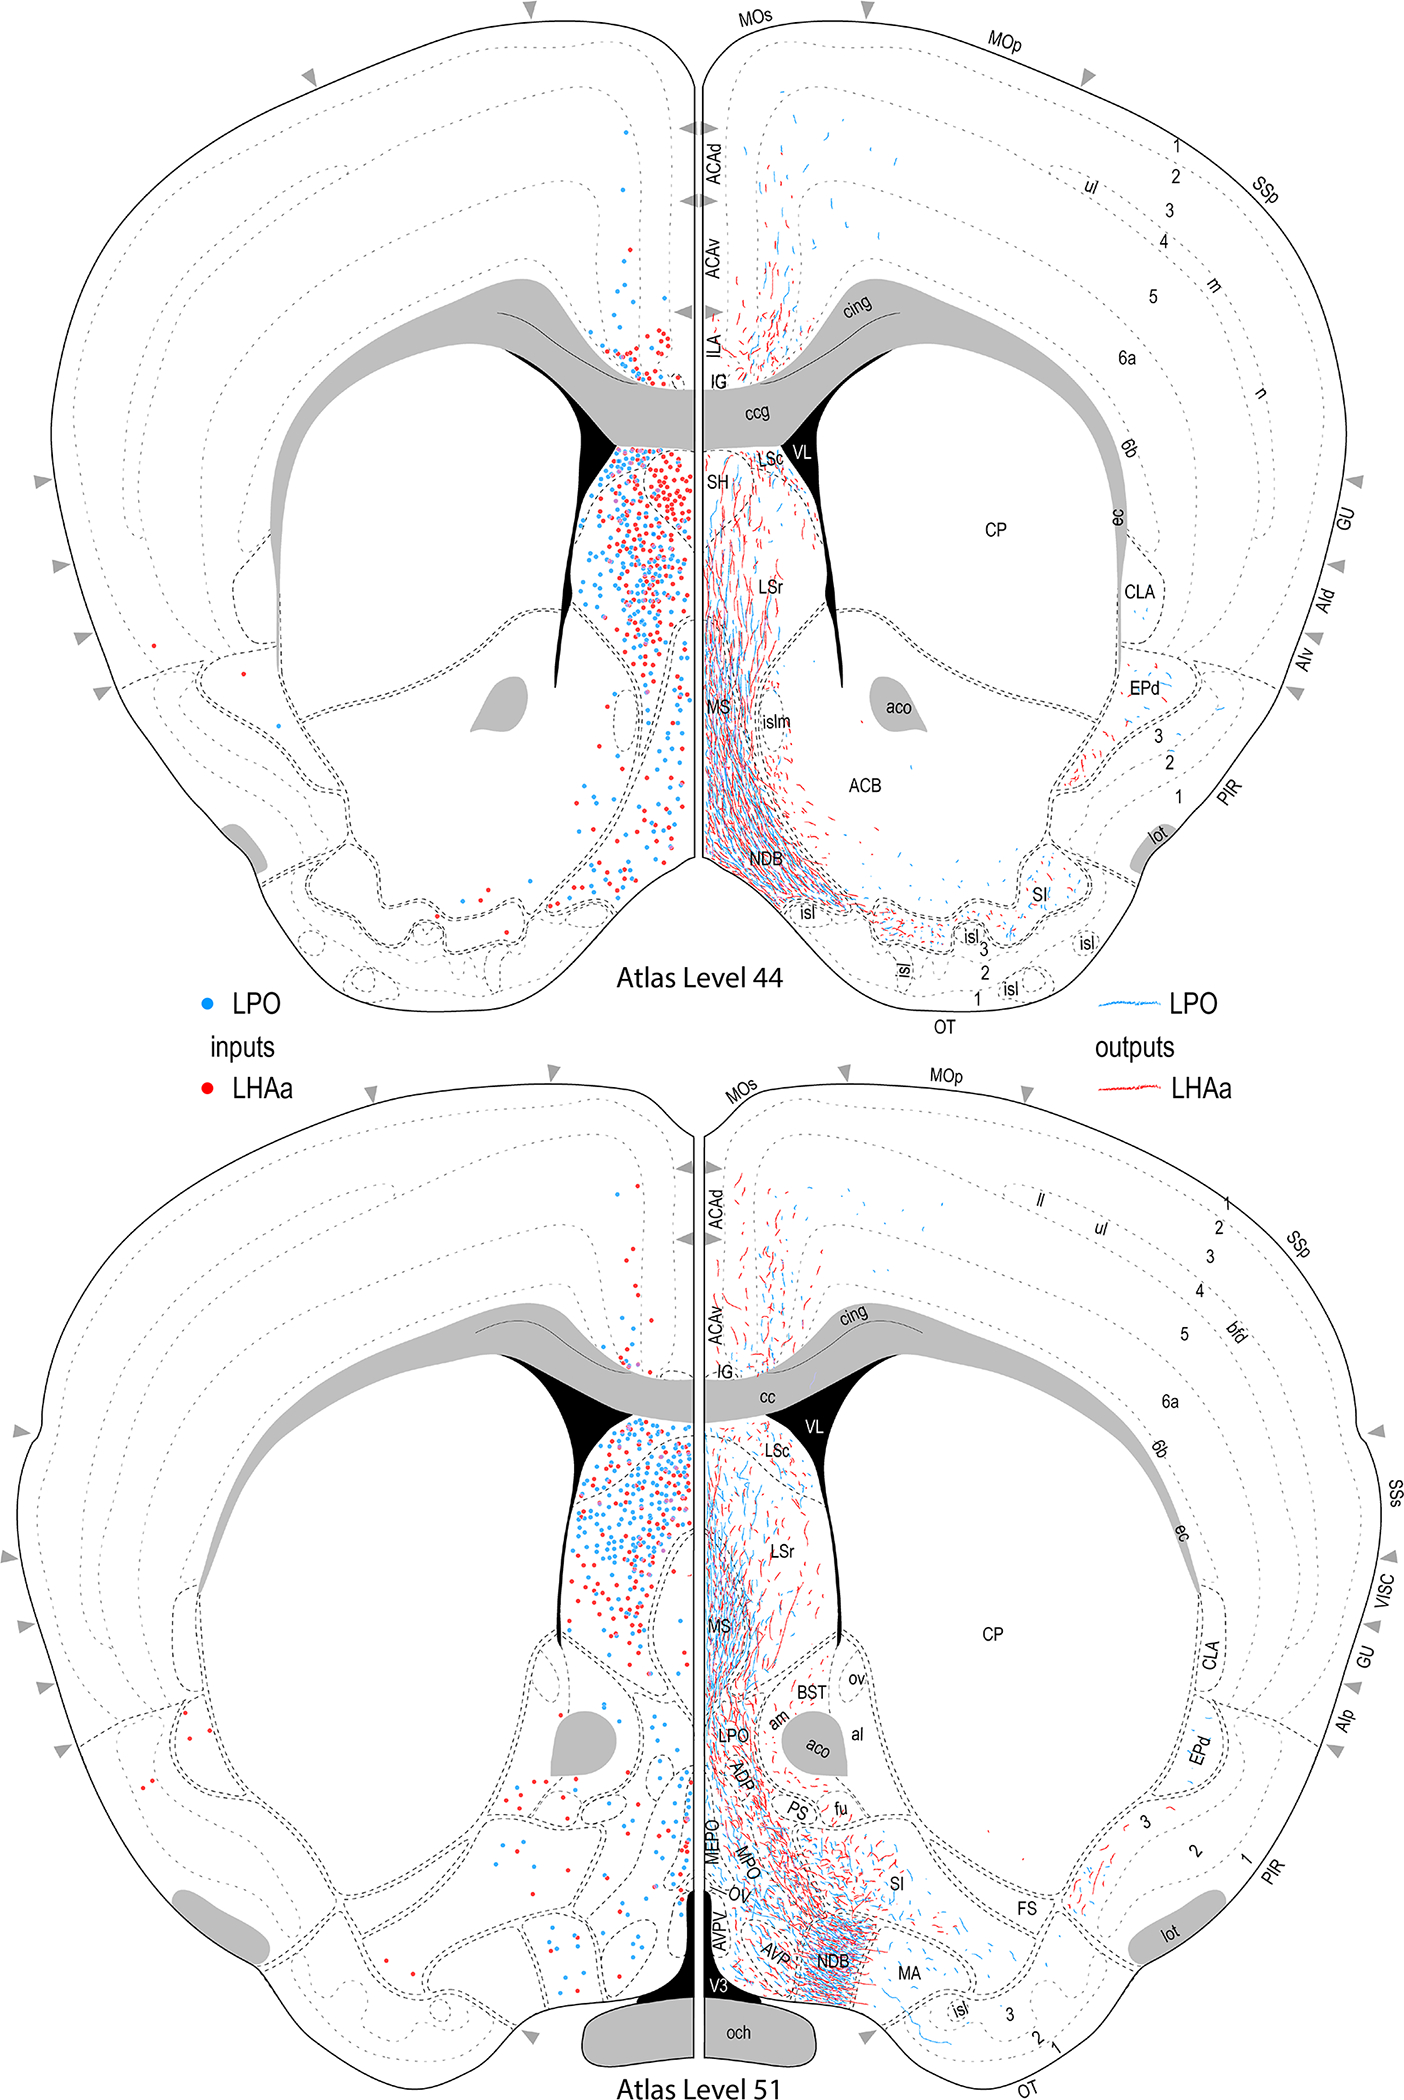
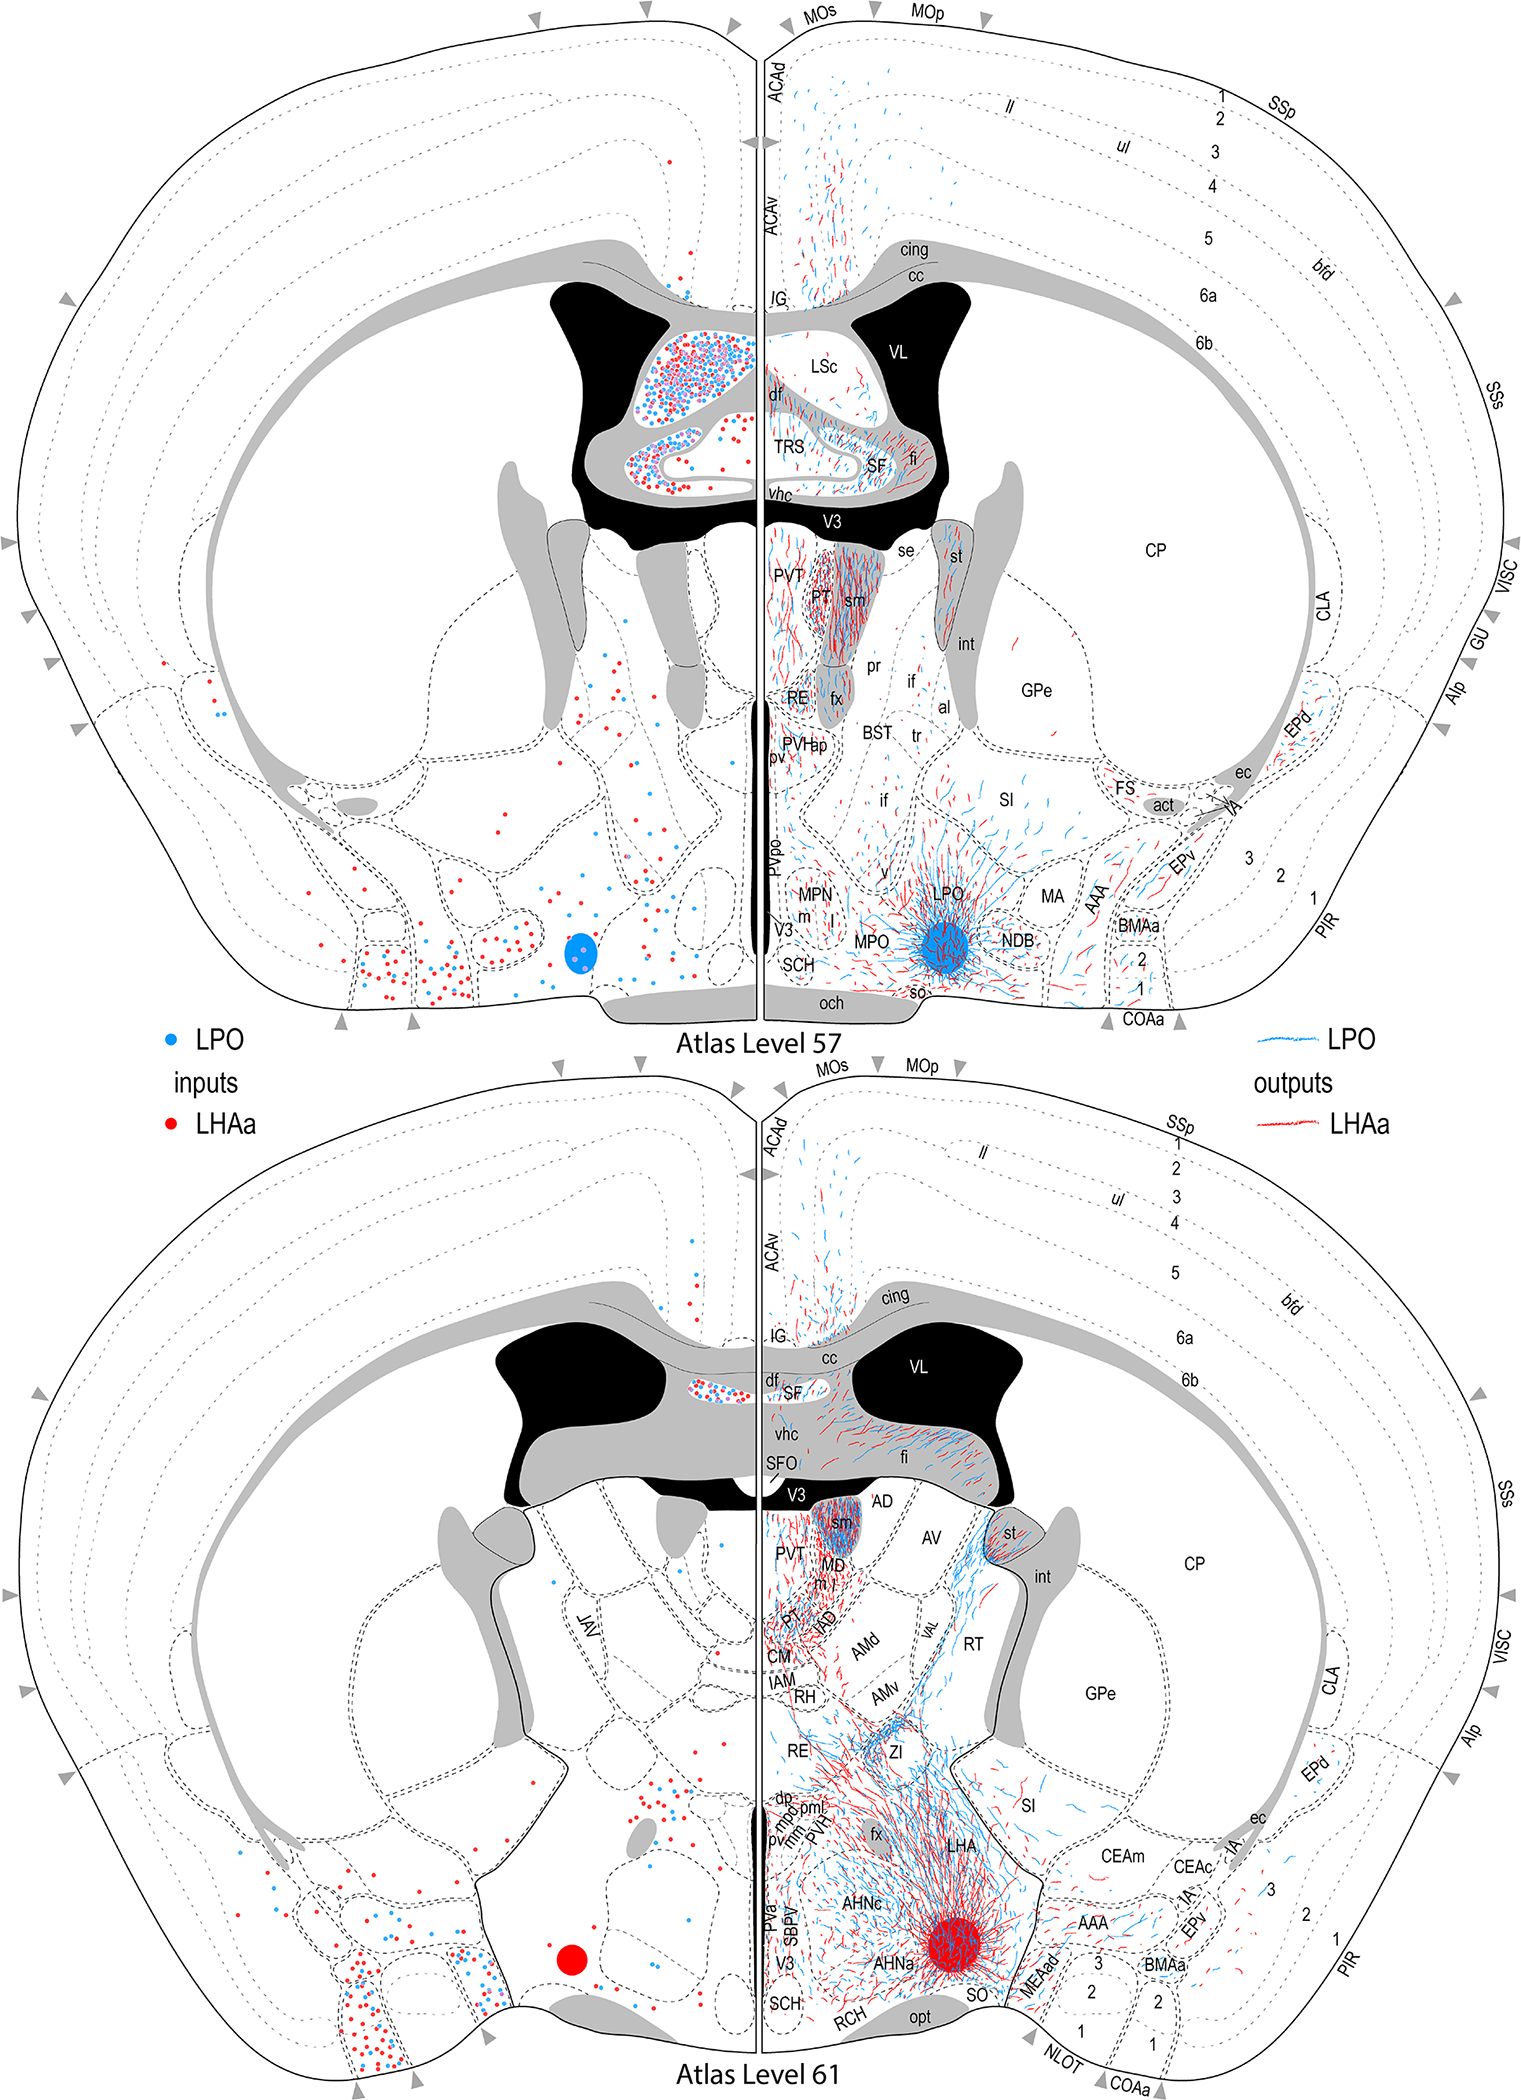
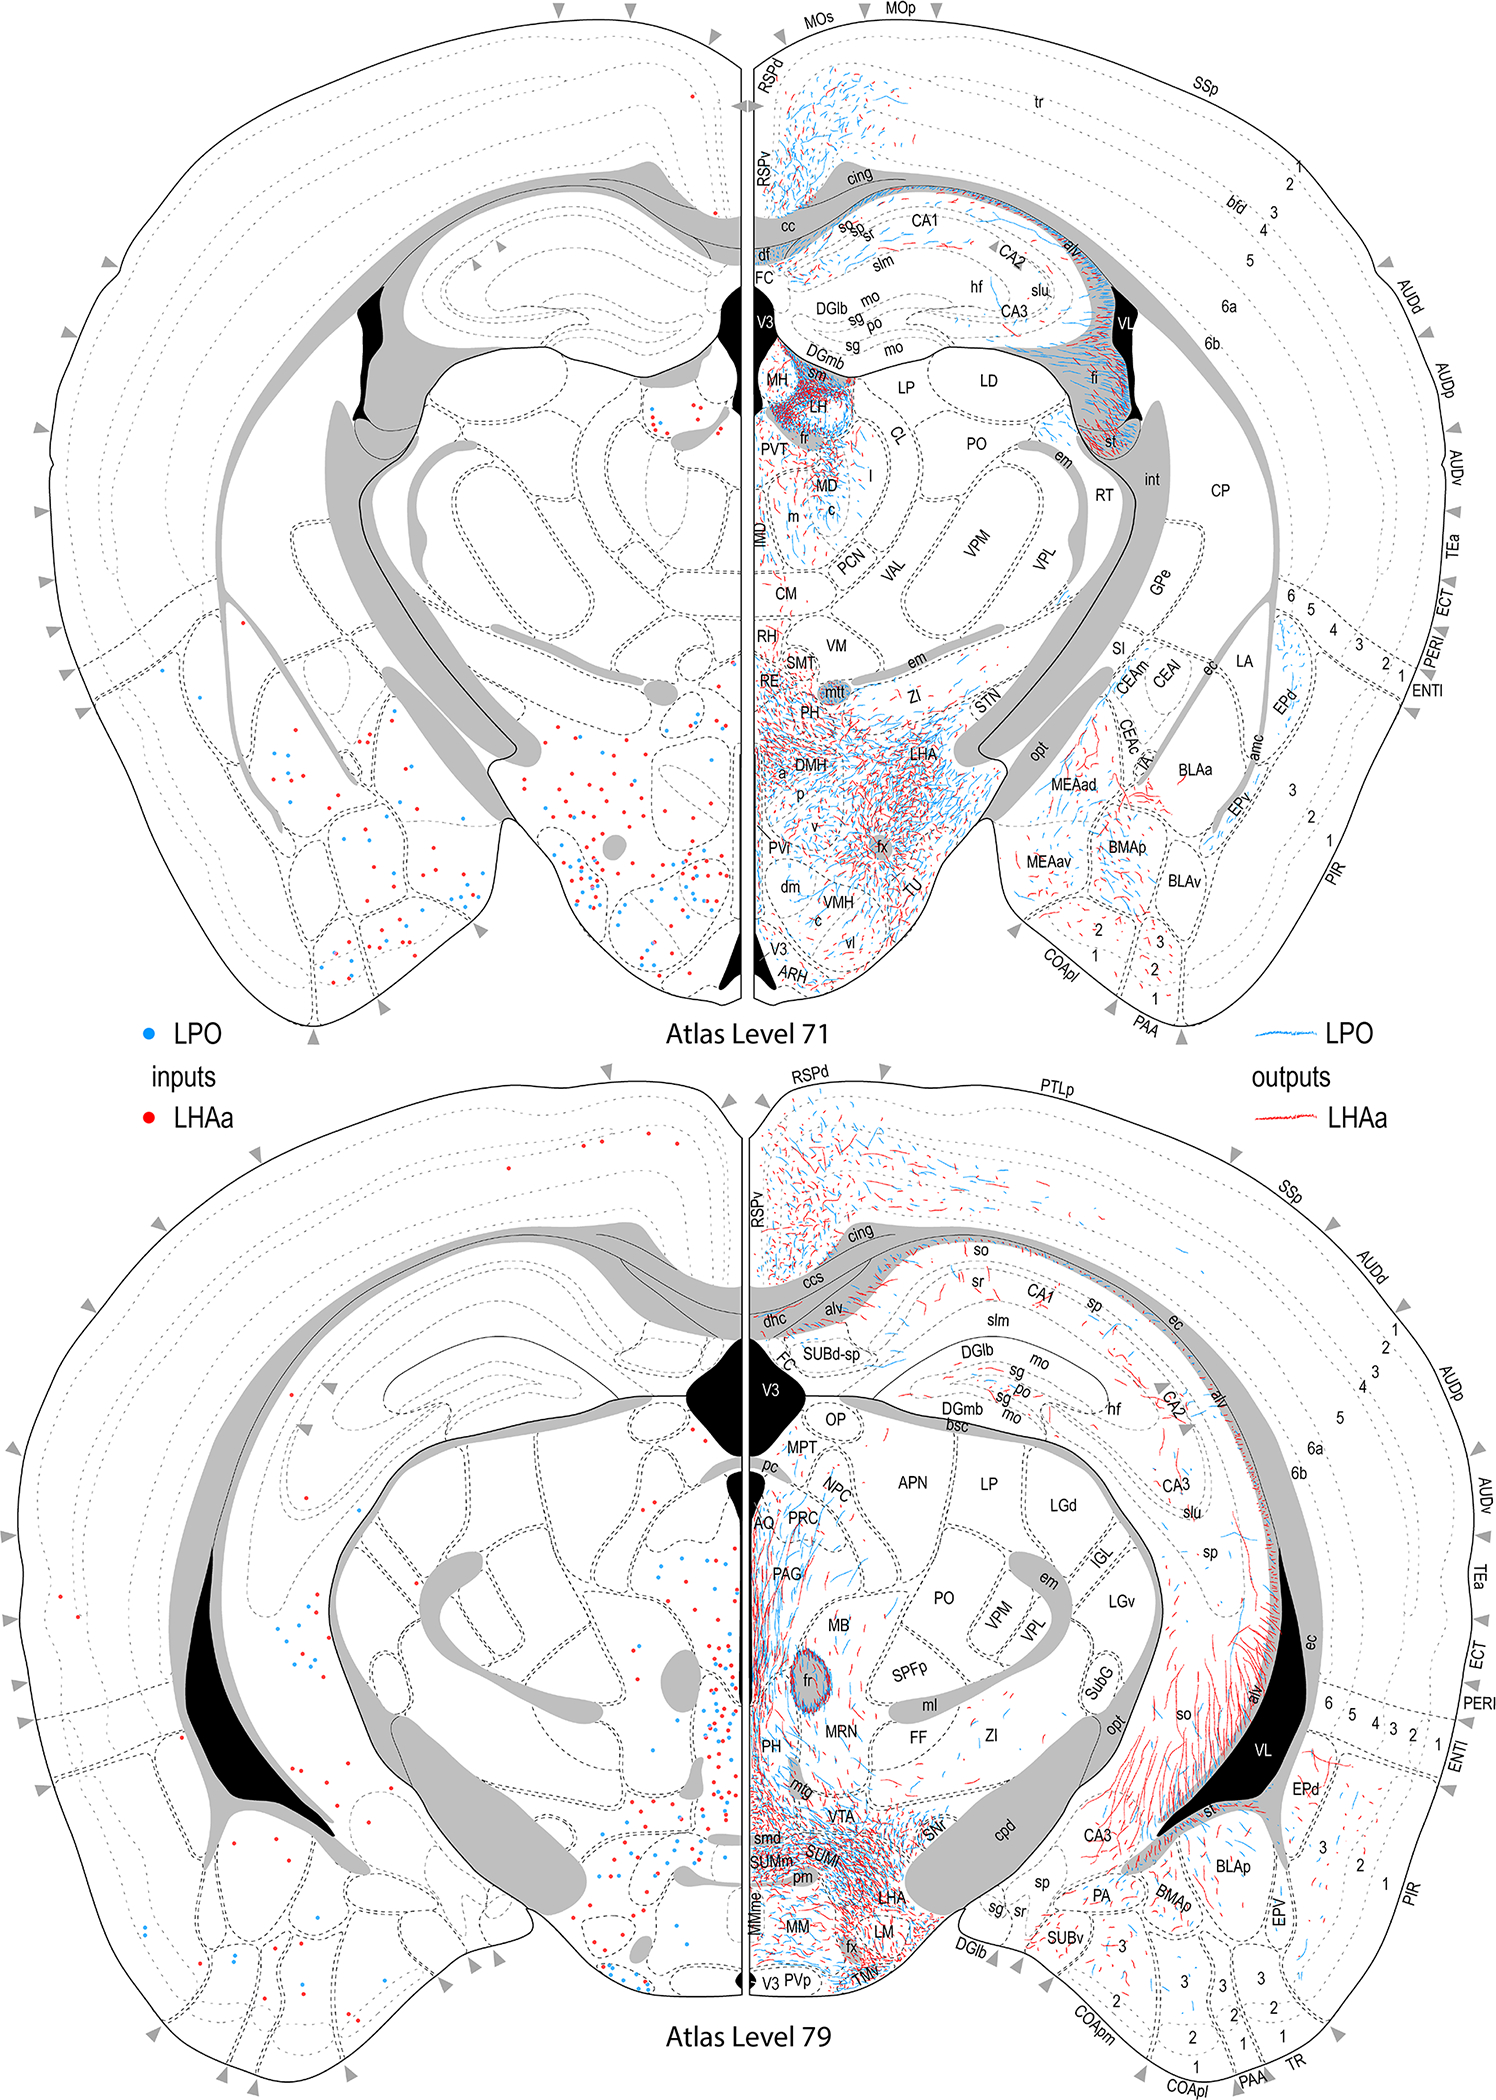
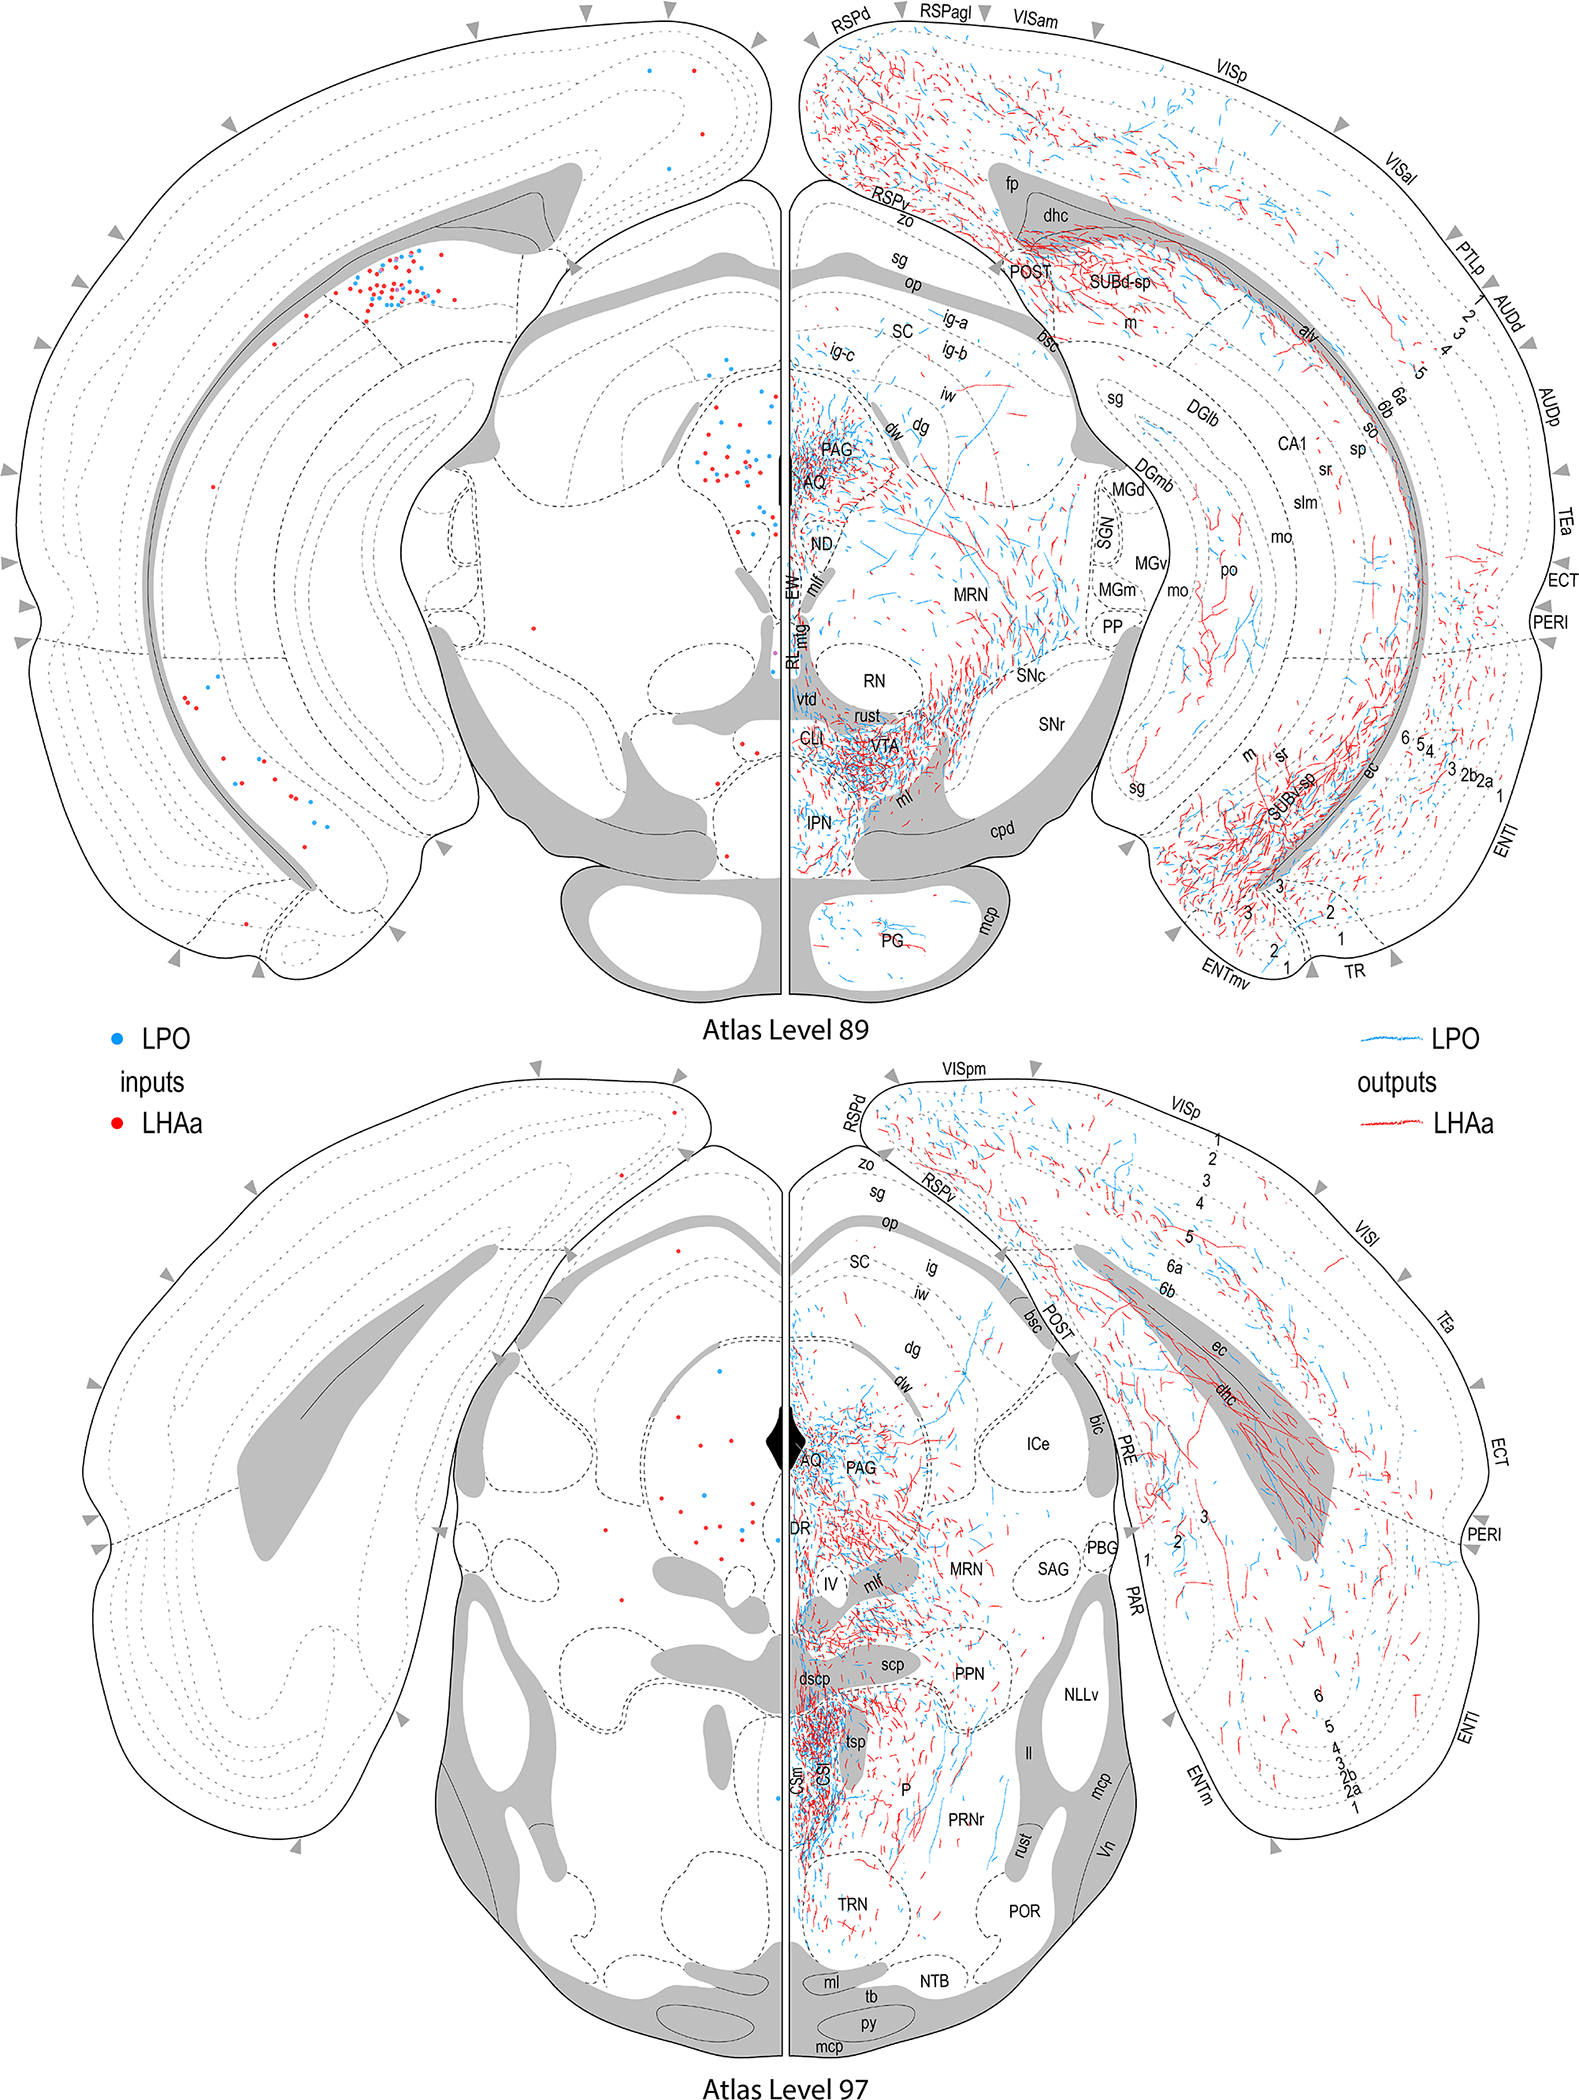
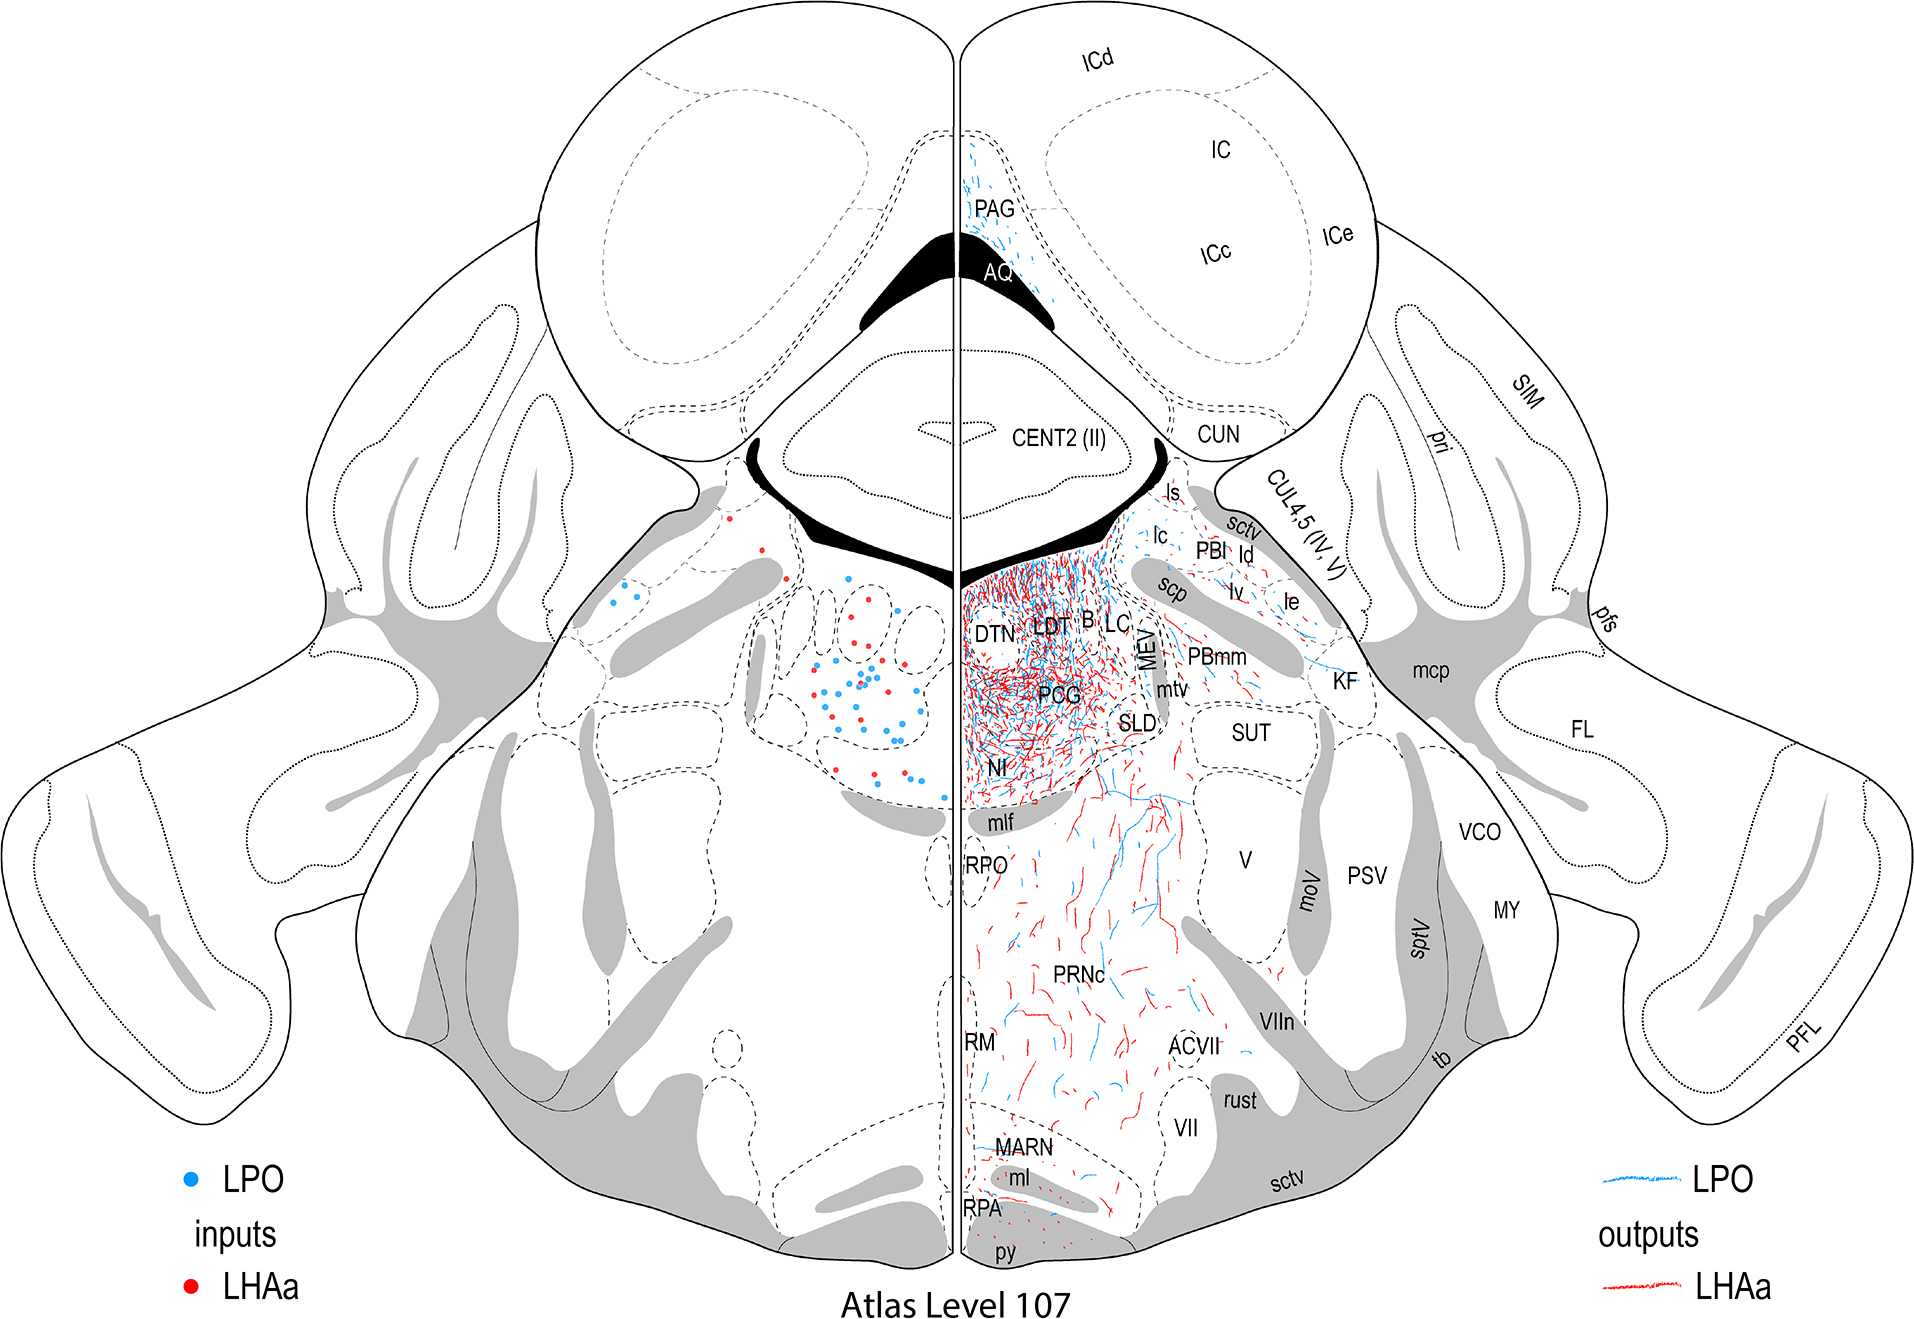
Reference atlas maps of ipsilateral axonal outputs and inputs of the LPO (blue) and LHAa (red) shown for 11 representative atlas levels in a rostral-caudal sequence for experiments #181221–04A (LPO) and #181221–02A (LHAa). The outputs (anterograde axonal labeling) are represented as colored lines, and inputs (axonal retrograde labeling of cell bodies) are represented as colored dots (tracer injection sites are represented on two atlas levels, for their additional extent see Figure 2). To facilitate direct comparison of the ipsilateral inputs and outputs, the inputs are reflected on the vertical axis (a gap is left intentionally between the reflected and non-reflected sides to emphasize that the reflected side showing the inputs is not the contralateral side). Numbers below each map correspond to the atlas level numbers in the reference atlas from which the maps are adapted (Dong, 2007). For abbreviations see Supporting Information 1.
Figure 4.
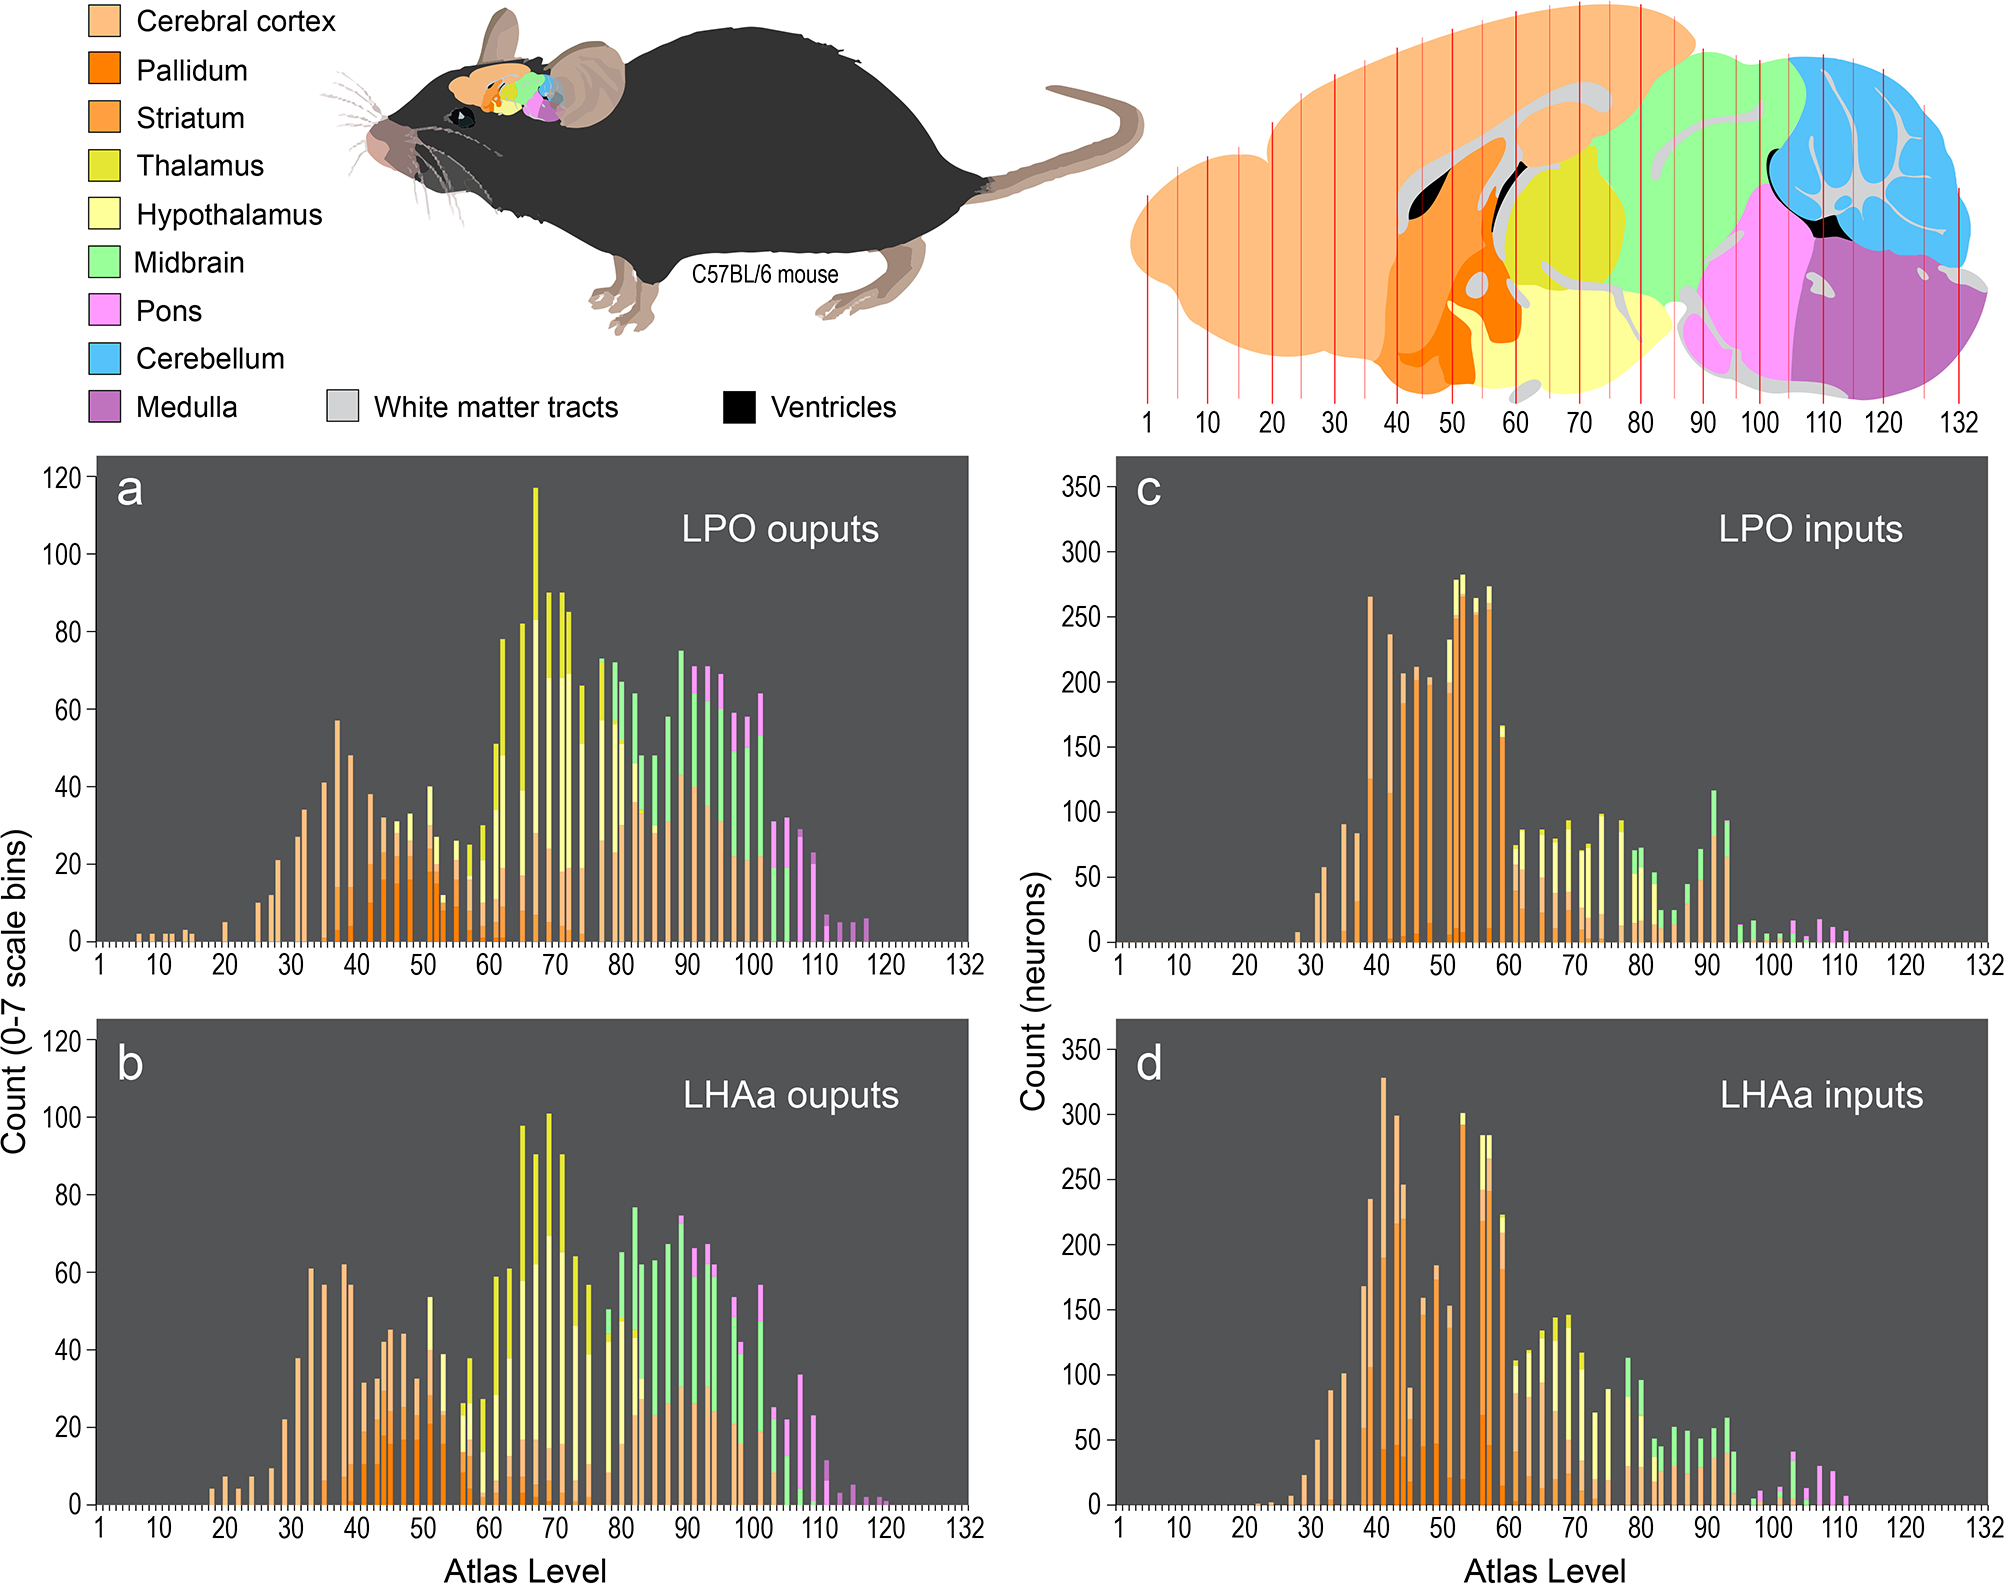
Rostral to caudal distribution and connection weights of LPO and LHAa macroconnections for major brain divisions. The four bar charts (a-d) show for 9 major brain divisions (encompassing the whole brain except for the spinal cord) the relative weight of LPO (a, c) and LHAa (b, d) macroconnection outputs (a, b; anterograde tracing) and inputs (c, d; retrograde tracing) ipsilateral to tracer injection sites for two representative experiments (#181221–04A [LPO], #181221–02A [LHAa]). Each staked bar represents an individual mouse brain reference atlas level (x-axis), and the relative proportion of major brain division connectivity for each atlas level is indicated by the length of the differently colored stacked segments (arranged topographically) that compose each bar. For output connections, the y-axis represents the total count of retrogradely labeled neurons for each atlas level; for input connections, the y-axis represents the sum of connection weights for each atlas level (using an ordinal scale (0–7) representing relative labeling abundance from absent (0) to very strong (7) [see Methods for further detail]). The color scheme applied to the major brain divisions (color key top left) is also applied to a parasagittal schematic (top right) showing the general rostral-caudal topography of the 9 major brain across the reference atlas levels; the same schematic is scaled and oriented to show the approximate position and relative size of the mouse brain within the mouse (top middle).
Figure 5.
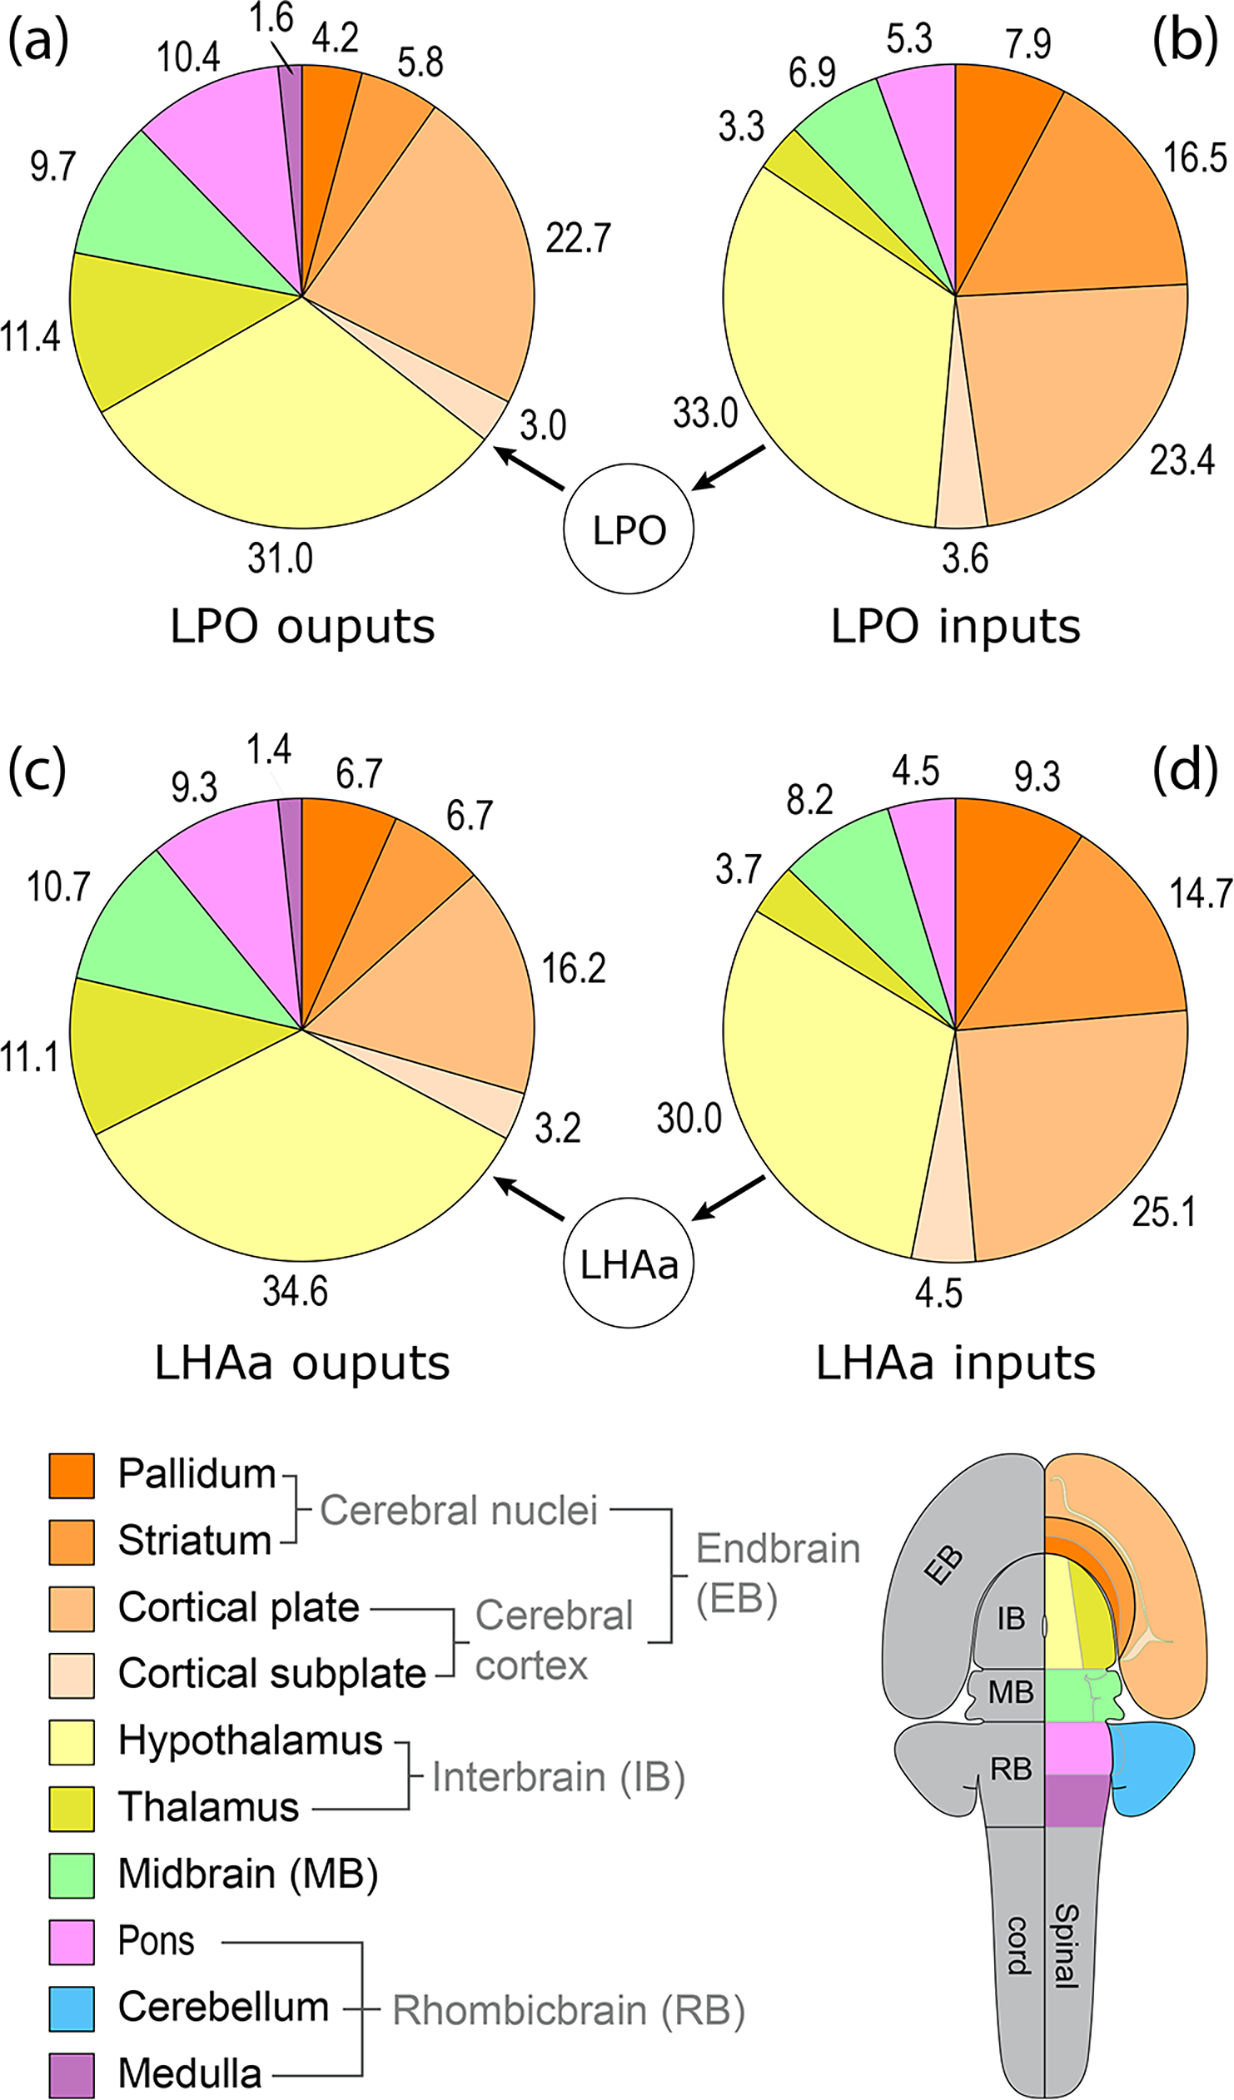
Proportion of LPO and LHAa macroconnections with each of 10 major brain divisions. Four pie charts (a-d) show for 10 major brain divisions (encompassing the whole brain except for the spinal cord) the relative percentage of LPO (a, b) and LHAa (c, d) macroconnection outputs (a, c; anterograde tracing) and inputs (b, d; retrograde tracing) associated with them. The data are derived from two representative experiments (#181221–04A [LPO], #181221–02A [LHAa]). The relative percentage for each division (numbers adjacent to pie segments) reflects the proportion of the average connection weight. For output connections, averages are calculated from ordinal values ranging from 1–7; for input connections the averages are calculated from neuron counts assigned to 1 of 7 bins (see Table 1). Pie chart segment colors represent the brain divisions shown in the flatmap (bottom right), and their divisional relationships and parent divisions are shown in the hierarchy tree below (bottom left).
Figure 6.
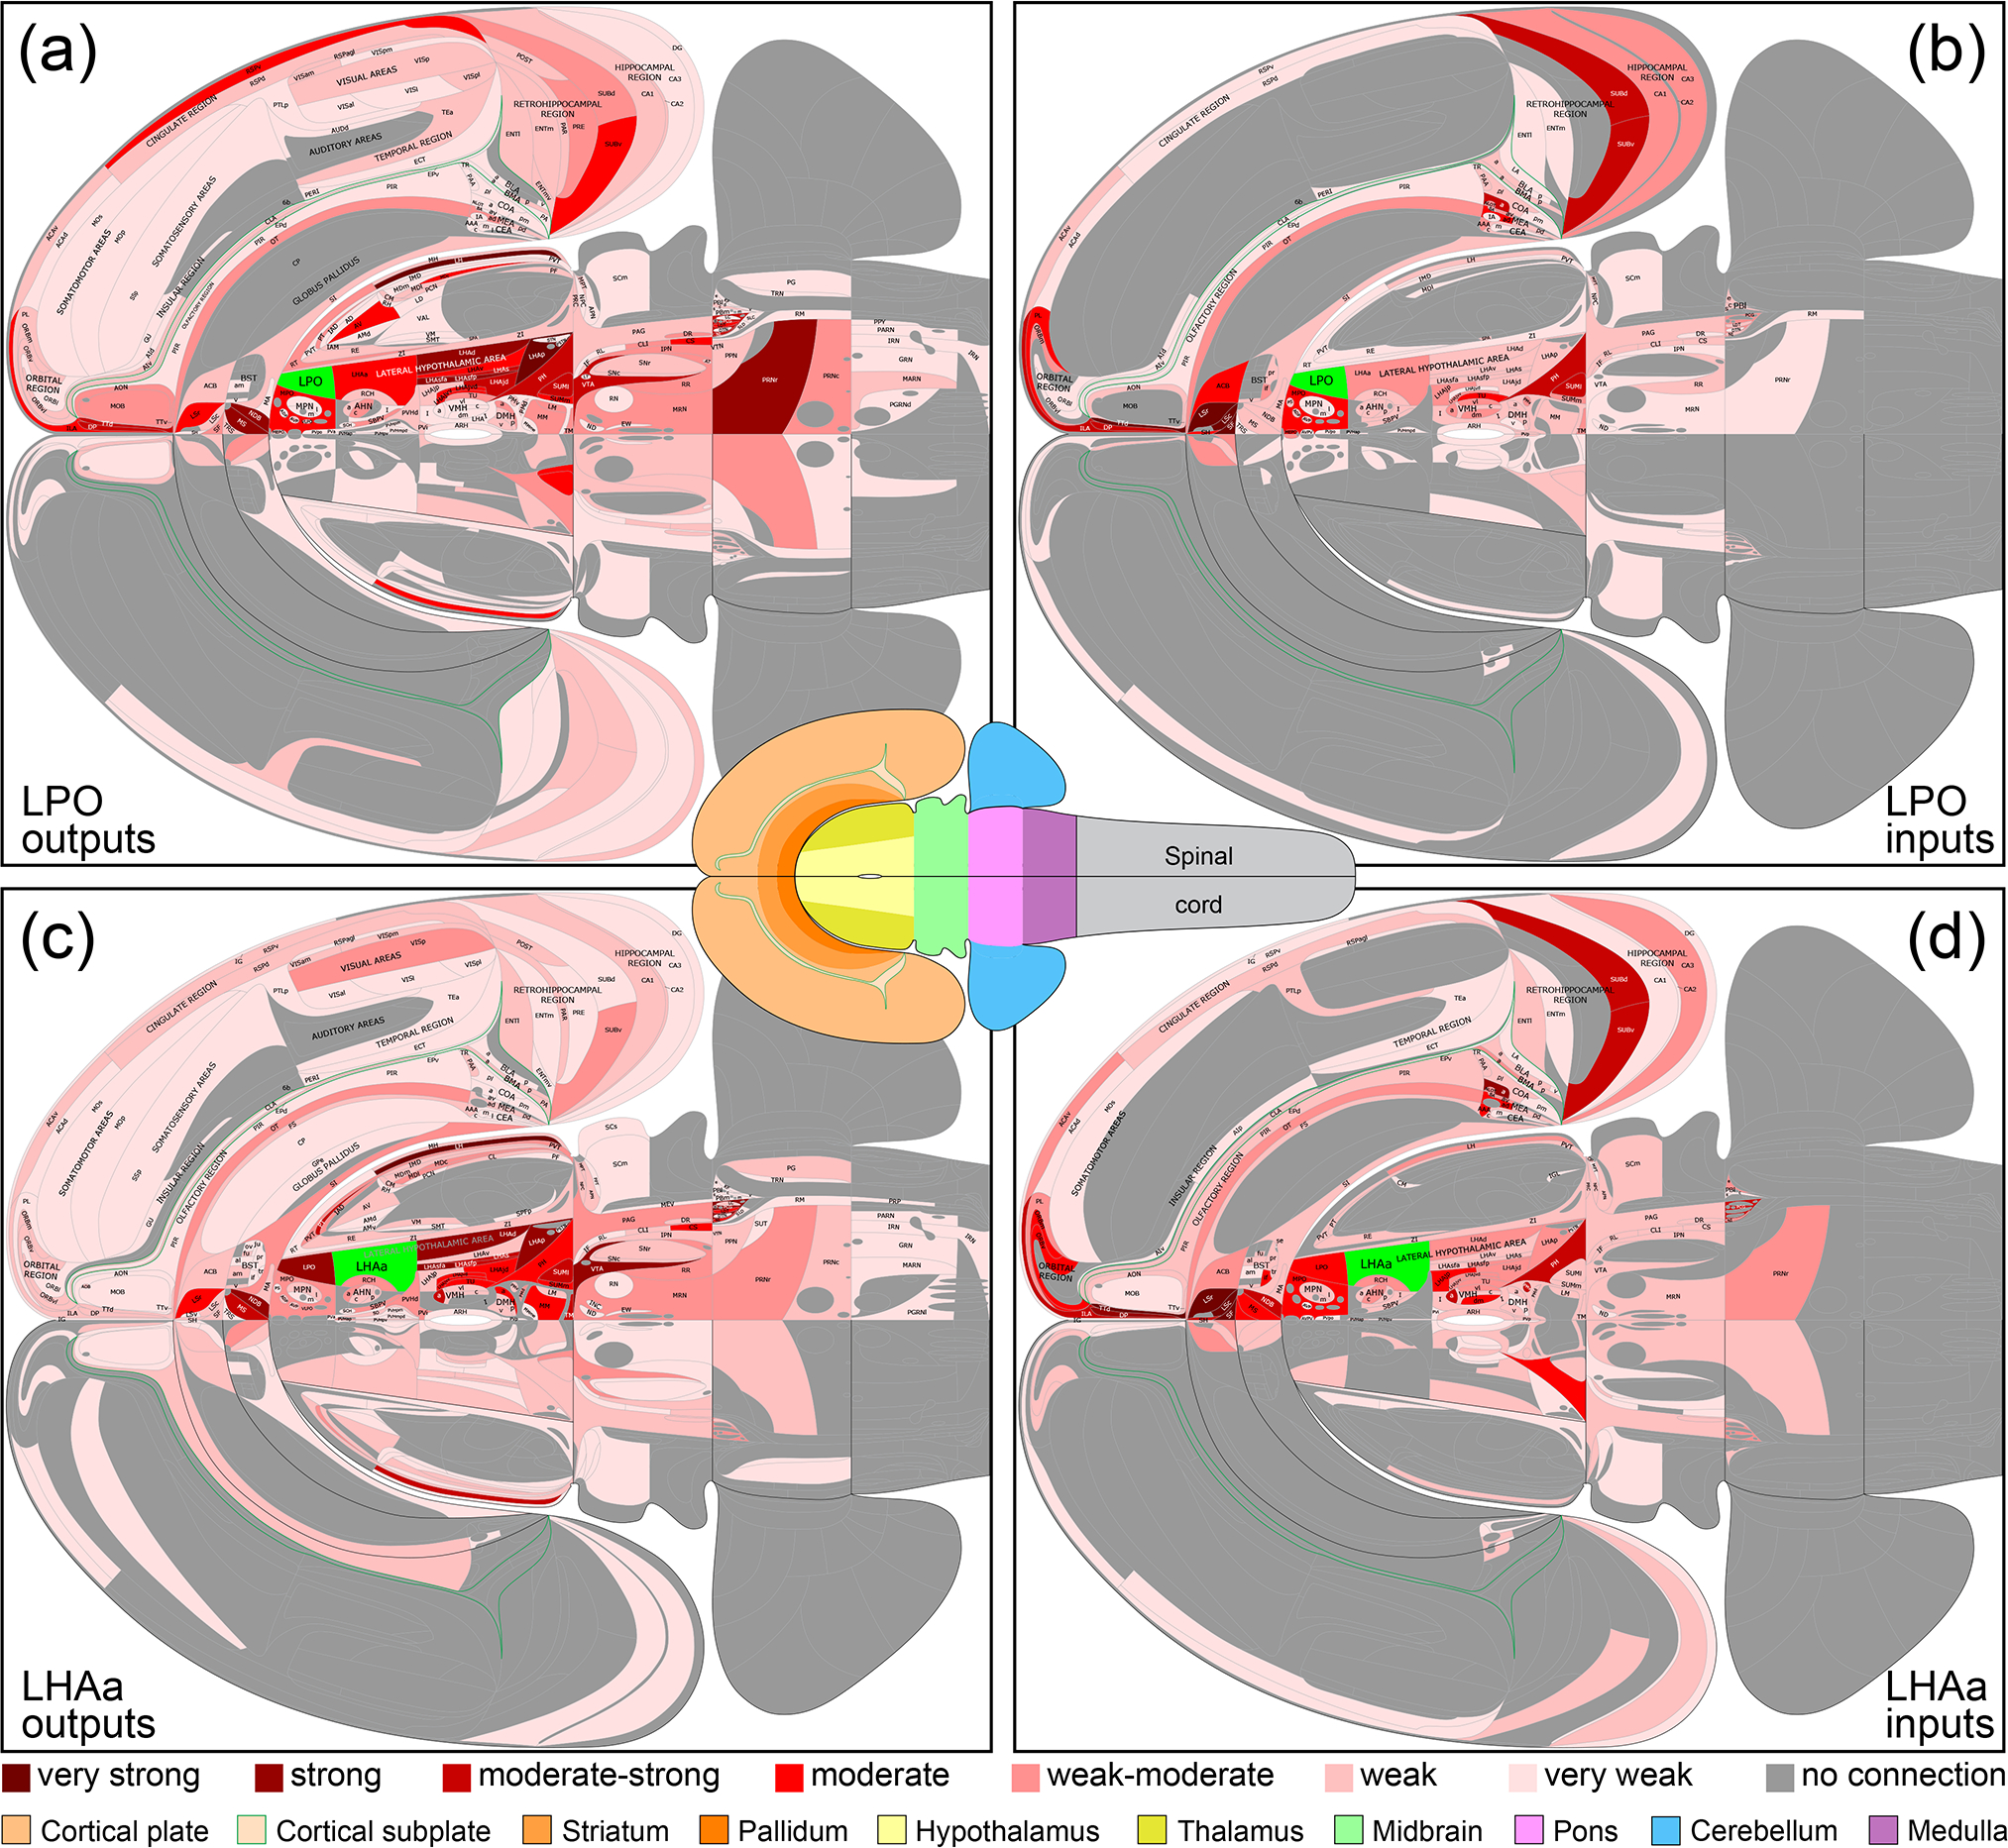
Summary of LPO (a, b) and LHAa (c, d) macroconnections on a flatmap representation of the mouse brain (adapted from Hahn et al., 2021). The flatmaps are truncated at the spinal cord and do not include the retina (neither was analyzed) A mini brain flatmap (center inset) shows the spinal cord and is color-coded for the other major brain divisions included in the larger flatmaps [key at bottom]). A 7-point red-pink color scale (key at bottom) represents the connection weight for positive data (present connections); negative data (absent connections) are indicated by dark gray. LPO and LHAa are colored bright green on their respective connection flatmaps. The data shown are mean average connection weights for each gray matter region across their analyzed atlas levels (shown in Figure 4 and reported in Supporting Information 1). Averages were calculated separately for connections ipsilateral or contralateral to unilateral tracer injections (all performed on the right side of the brain). For output connections (a, c; anterograde tracing data), analysis was performed using the same 7-point qualitative scale; for input connections (b, d; retrograde tracing data), initial count data was assigned to 1 of 7 bins representing the 7-point qualitative scale, according to the number of counted labeled neurons (see Methods and Table 1 for additional details). A high-resolution scalable vector graphics version of this figure is available as Supporting Information 2. An alternative flatmap representation showing the highest connection weight across all atlas levels is also included in Supporting Information 2.
For the experiments selected as best representative of LPO and LHAa connections (Figure 2) (for selection criteria see Methods), injection site central location, and the clearly visible volume of tracer deposit, was (with one exception) restricted to LPO or LHAa. The exception applies to the selected LHAa anterograde tracing experiment (Figure 2d). In the latter case, while the majority of tracer-labeled somata were in the LHAa within the main volume of the injection site, a small contingent of supraoptic nucleus somata was also labeled (Figure 2d), likely resulting from tracer uptake by dorsally extending supraoptic nucleus dendrites. Inclusion of the supraoptic nucleus was confirmed by the presence of robust axonal labeling in the external layer of the median eminence, consistent with the well-known neuroendocrine projection of the supraoptic nucleus to the posterior pituitary. However, given no previous report of substantial extrinsic supraoptic nucleus connections within the brain (and no evidence of lateral hypothalamic area connections to the posterior pituitary), the potential confounding effect of supraoptic nucleus neuron labeling was negated.
3.1. Outputs from LPO and LHAa
Comprehensive analysis of anterograde axonal tracing data from unilateral tracer injection sites highly restricted to LPO and LHAa (Figure 2a, d) revealed that LPO and LHAa each send output connections to more than 200 different gray matter regions (LPO to 206 and LHAa to 212). Output connections ipsilateral to the tracer injection side predominated (206 of 288 LPO output connections; 211 of 312 LHAa output connections), and they were similarly proportioned for both regions, ranging in percentage of total connection weight from 75% (LHAa) to 78% (LPO). For both regions, excepting contralateral homotopic LPO and LHAa connections (connections to the same region as the injection site on the opposite side of the brain), there was no instance of a contralateral region receiving an input without its ipsilateral counterpart also receiving an input.
However, more than half of all regions receiving an input from LPO and LHAa are exclusively ipsilateral (60% / 124 regions for LPO, 53% / 111 regions for LHAa). Nevertheless, for both LPO and LHAa, the great majority (90% for LPO and 93% for LHAa) of these exclusively ipsilateral outputs are weak or less, none is very strong, and less than 3% are stronger than moderate, for a total of 5 regions: from LPO to three nearby LHA regions with provisional correspondence to the following regions identified in rat: LHA subfornical region anterior part (strong), LHA suprafornical region (moderate-strong), LHA juxtadorsomedial region (moderate-strong); and from LHAa to LHA subfornical region (strong), and to the paratenial nucleus (moderate-strong).
Considering the scarcity of output connections that are both substantial and exclusively ipsilateral, together with the general mirroring of connection patterns between sides, raises the question of their significance. In that regard it is noteworthy that anterograde axonal labeling proximal to an injection site is typically robust and includes axons of passage (because all direct connections from a given region, whether proximal or distal, must follow an unbroken path to reach their destinations); furthermore, the axonal morphology of LHAa axons in the paratenial nucleus was characterized by densely clustered axons aligned generally in parallel with few branches (typical of axons of passage), but with numerous varicosities. Whether or not side imbalances in anterograde labeling are predictive of the presence of axons of passage remains to be investigated.
A similar number of gray matter regions received ipsilateral input from LPO (206) and LHAa (211), and the regions targeted were mostly the same: 86% (178 of 211) of LPO-targeted regions also received LHAa input, and 84% (178 of 206) of LHAa-targeted regions also received LPO input (Figure 6a, c). For the ~15% of regions that received exclusive LPO or LHAa input, with one exception (a weak-moderate ipsilateral connection from LPO to the thalamic reticular nucleus), all the connections were weak or less, and they were distributed between different major brain divisions (Figure 6a, c). Only one region, the epithalamic lateral habenula, received a contralateral input with an average connection strength greater than moderate (moderate-strong from LHAa; moderate from LPO) (Figure 8a, b); similarly, two regions (medial and lateral parts of supramammillary nucleus) received a moderate contralateral input (from the LPO; weak to weak-moderate from the LHAa); all the other contralateral output connections of LPO and LHAa were weaker, and most of them were very weak.
Figure 8.
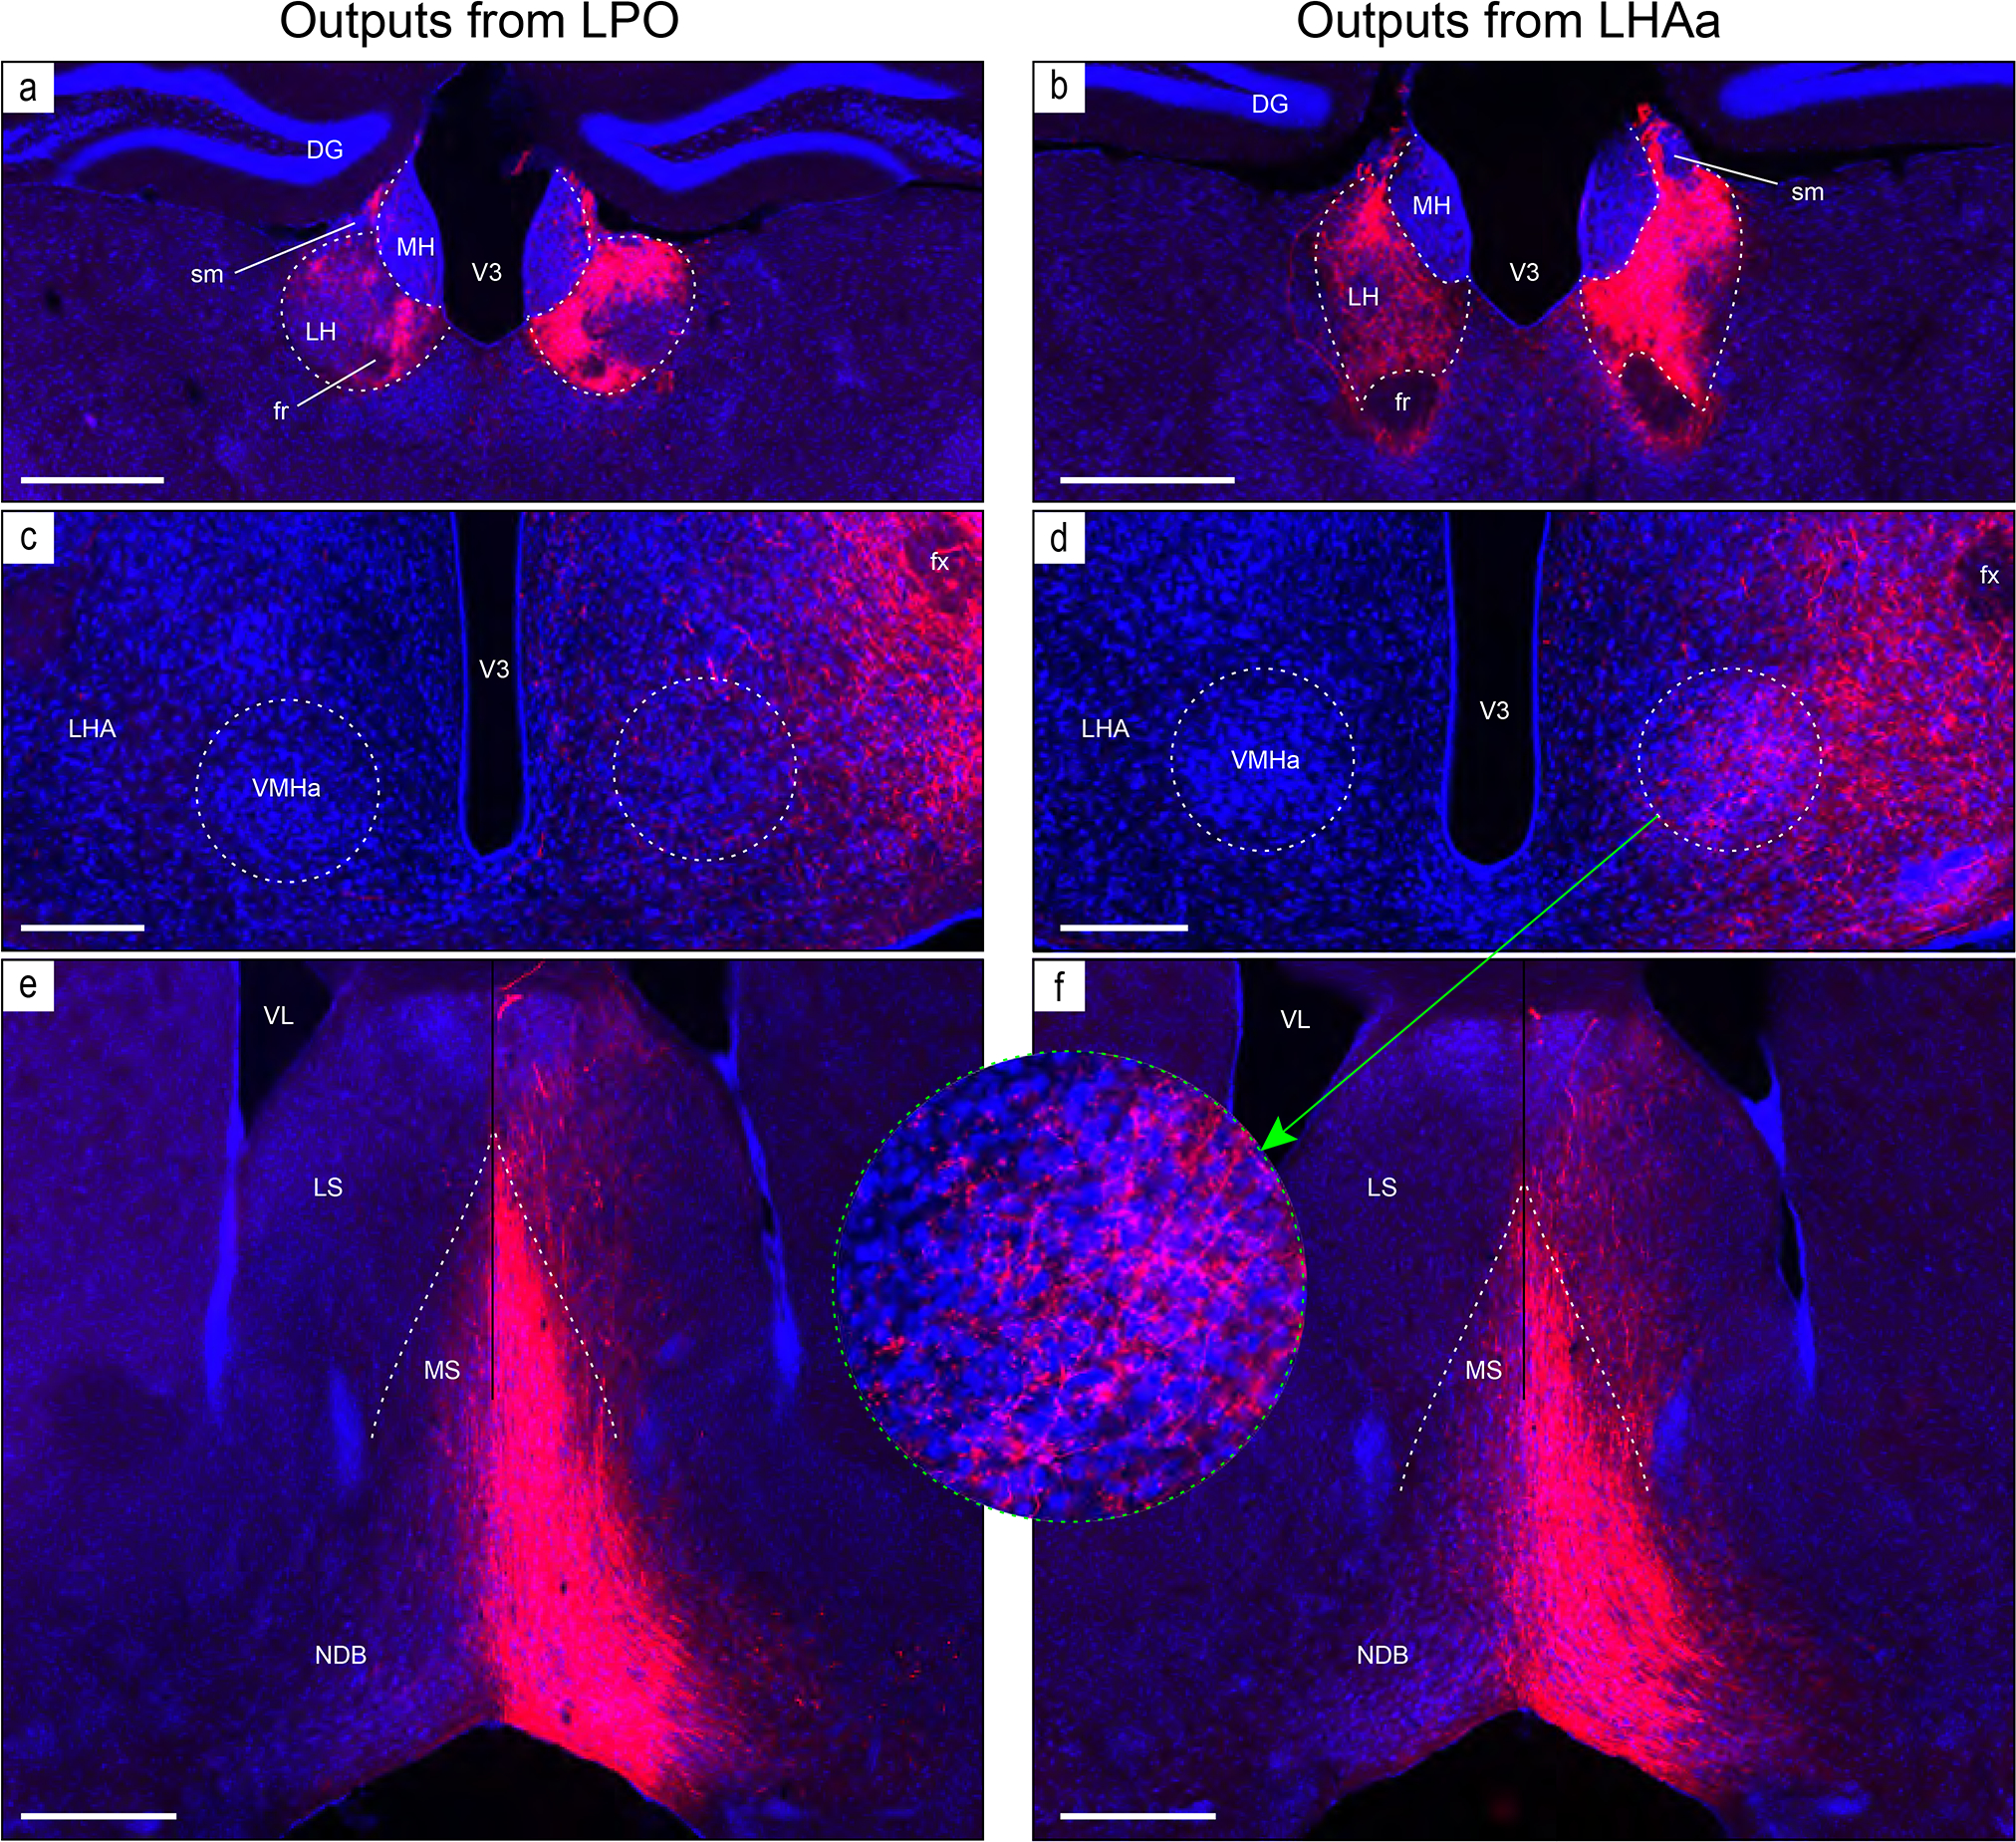
Examples of anterograde axonal labeling (AAV-tdTomato) arising from unilateral tracer injections in the LPO (#181221–04A) and LHAa (#181221–02A). (a and b) Dense ipsilateral, and substantial contralateral, innervation of the lateral habenula (LH) from LPO (a), and even denser input from the LHAa (b) at a more caudal LH level. (c and d) A substantially stronger input to ventromedial hypothalamic nucleus anterior part (VMHa) from LHAa (d, and outset) compared to LPO (c) (note the absence of a contralateral VMHa input from either region). Also at this level, substantial axonal labeling is apparent in the LHA laterally adjacent to the VMHa (see Figure 1l for the mouse brain reference atlas level and Figure 1f for rat LHA parcellation at a corresponding atlas level). (e and f) Similar very dense ipsilateral labeling of the medial septal (MS) and diagonal band (NDB) nuclei; comparatively weaker labeling is also present in the lateral septal nucleus (LS). Dashed lines indicate approximate cytoarchitectural boundaries corresponding to reference atlas parcellation. Additional abbreviations: DG, dentate gyrus; fr, fasciculus retroflexus; MH, medial habenula; sm, stria medullaris; V3, third ventricle. Scale bars are 500 μm (a,b,d,e), 250 μm (c,d).
However, considering highest versus average connection strengths tends to increase the maximum strength because (to recap from the Methods) the highest connection strength represents the highest connection strength recorded for a given region across its analyzed atlas levels. For regions represented on more than one atlas level, the spatial resolution of atlas level is considered mesoscale because it is a level more granular than the macroscale level which applies to the whole region. By this measure, considering contralateral connections rated as stronger than moderate, LPO sends a moderate-strong connection to three regions (supramammillary nucleus lateral part, lateral habenula, and periaqueductal gray), and LHAa sends a strong connection to the lateral habenula (Figure 8b). Nevertheless, given the relatively minor contribution of contralateral connections overall, in the following results sections we focus on the predominant ipsilateral connections. For a comparison of highest versus average connection strengths for both contralateral and ipsilateral connections, see Supporting Information 2.
A large majority of LPO (78.2%) and LHAa (78.7%) output connections remained within the forebrain (Figure 5); about two-thirds of these targeted (mostly) the hypothalamus (LPO, 39.8%; LHAa 44.0%), and (secondarily) the cortical plate of the cerebral cortex (LPO, 29.1%; LHAa, 20.6%). The relative proportion of all LPO and LHAa output connections to other major brain divisions was as follows: 9–11% to (respectively) thalamus, midbrain, and pons, 6–7% to striatum, 4–7% to pallidum, 3% to cortical subplate, and 1–2% to medulla (Figure 5). As alluded to earlier, at a more granular resolution, some more pronounced LPO and LHAa output connection differences emerged, although these were generally the exception. A review of LPO and LHAa outputs that generated on average a moderately strong or stronger connection identifies the most notable of these differences (Figure 7).
Figure 7.
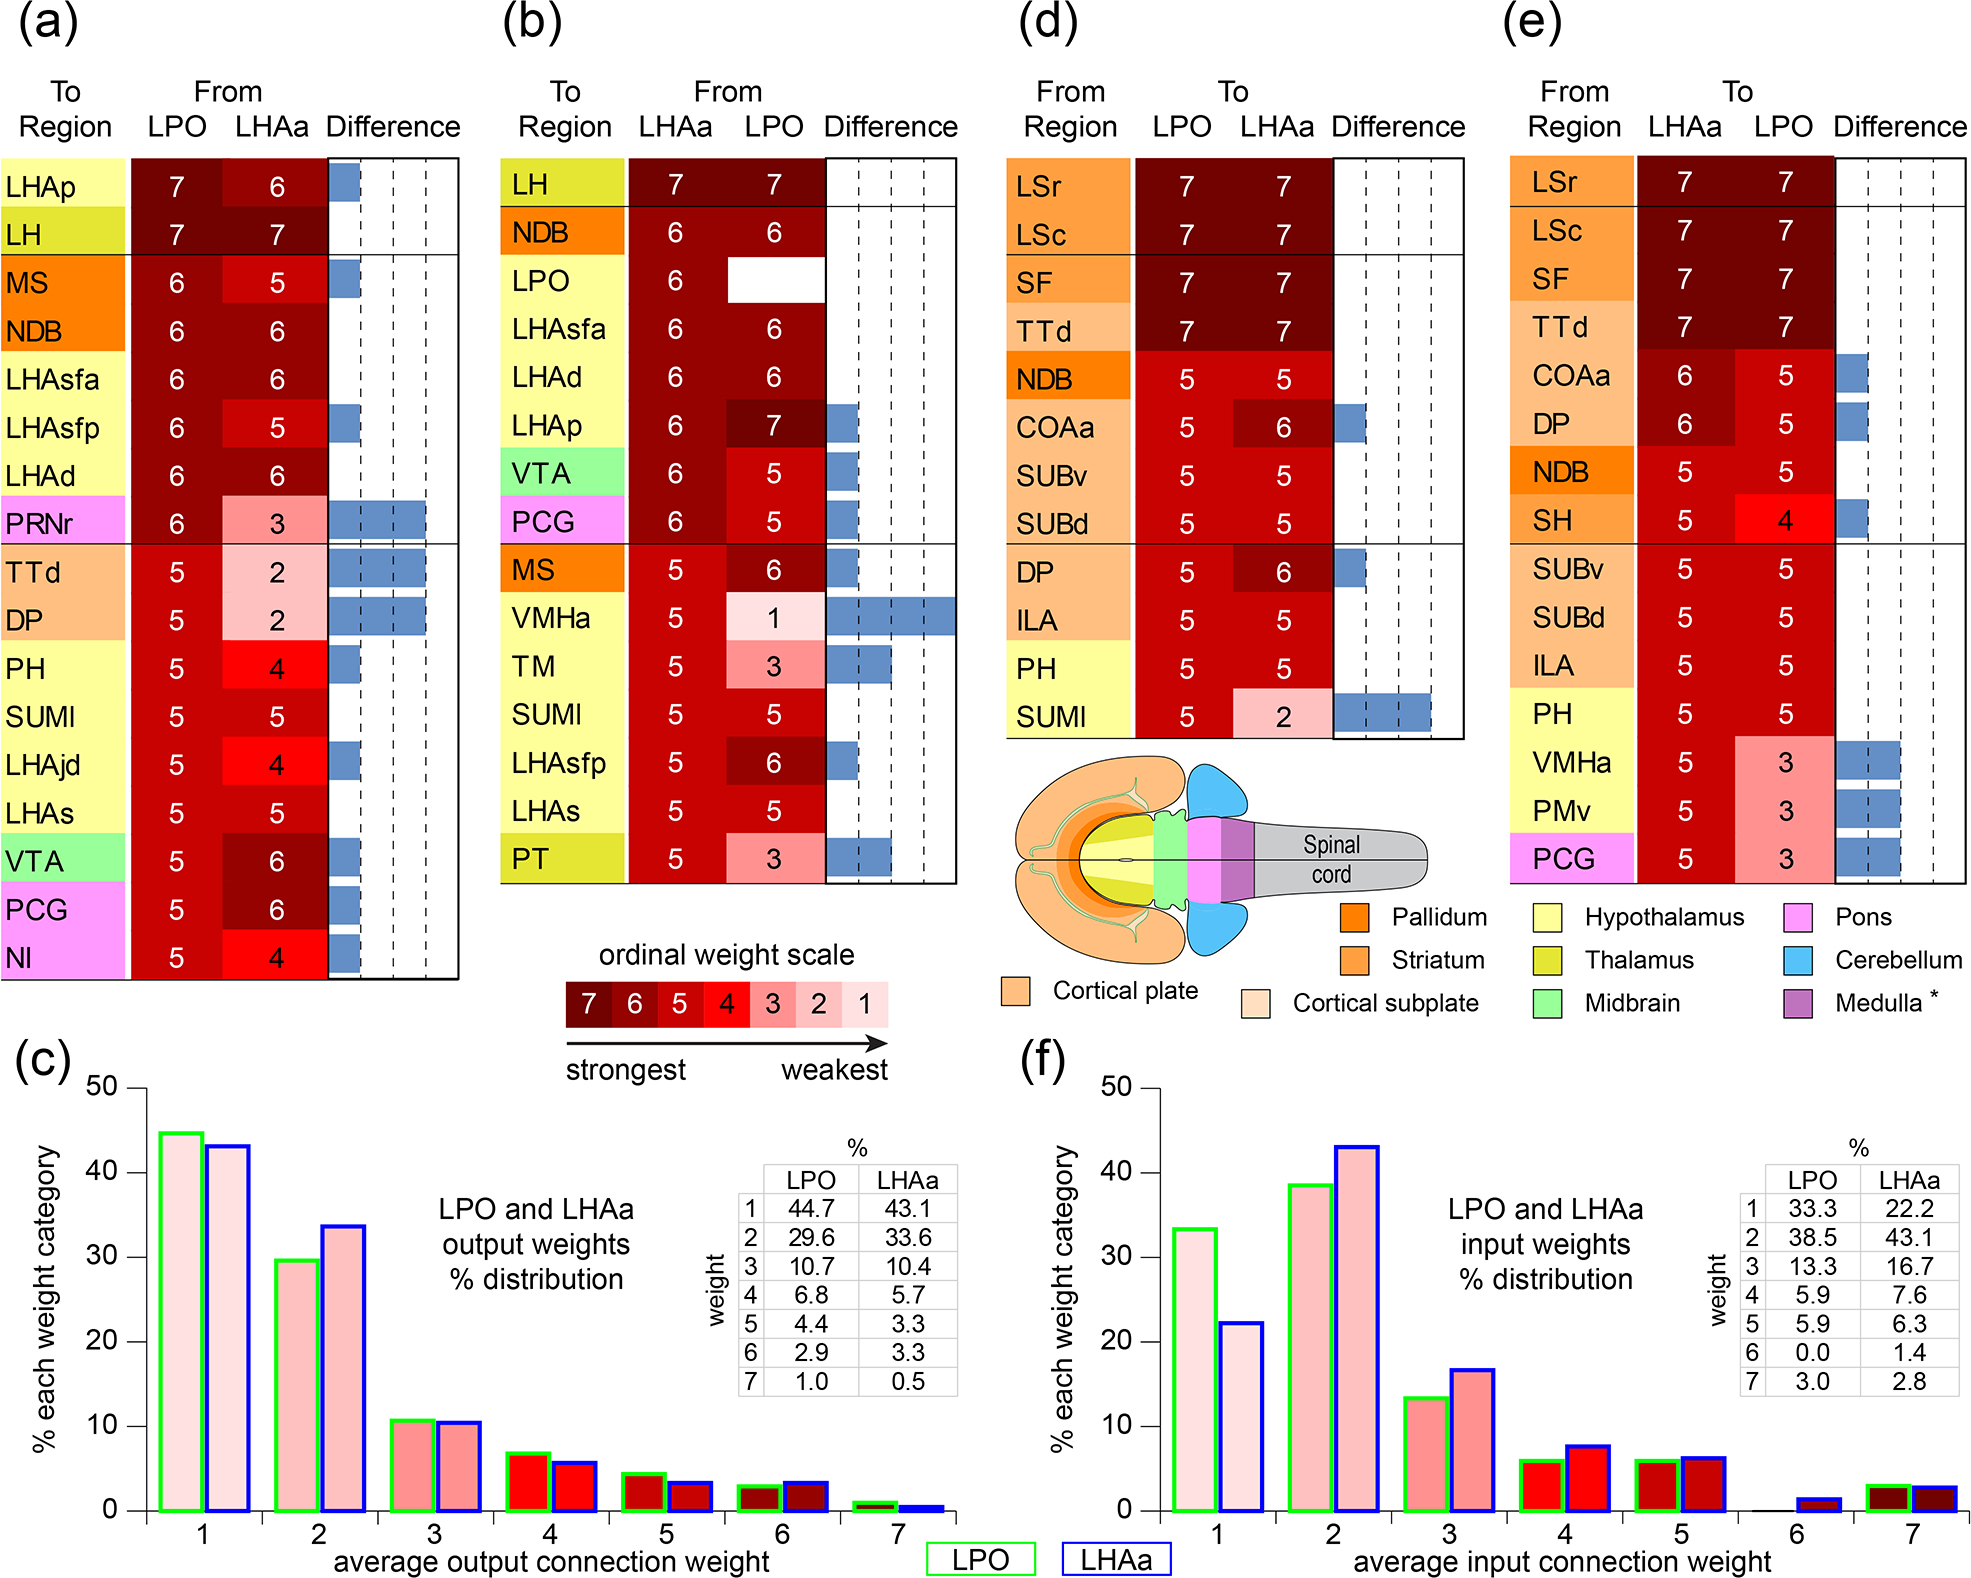
Comparison of major LPO and LHAa connections. (a,b,d,e) LPO (a,d) and LHAa (b,e) output (a,b) and input (d,e) connections of moderately strong or stronger weight are compared and represented as a 7-point ordinal scale. Blue bars (right columns) indicate individual region connection weight differences between LPO and LHAa. Background colors applied to region abbreviations (left columns) correspond to each region’s major brain division (see flatmap insert with corresponding color key). An entry for an LPO self-connection (at the target / tracer injection site) is left blank intentionally. (c,f) Histograms of average connection weights for LPO and LHAa outputs (c) and inputs (f). For abbreviations see Supporting Information 1.
As shown in Figure 7, the maximum average difference in connection weight (on a 7-point ordinal weight scale) between LPO and LHAa connections (that were at least moderately strong) to any region, was 4. There was one connection in this category, to the ventromedial hypothalamic nucleus anterior part, that was stronger for LHAa (moderate-strong from LHAa, very weak from LPO) (Figure 8c, d). An ordinal difference of 3 applied to three connections, each stronger for the LPO: to tenia tecta dorsal part, to dorsal peduncular nucleus, and to pontine reticular nucleus rostral part; a difference of 2 applied to two connections, both stronger for the LHAa: to paratenial nucleus, and tuberomammillary nucleus (Figure 7).
The LPO and LHAa send strong or very strong connections (weight averaged) to a total of 10 regions (including a strong connection from the LHAa to the LPO, that is moderately strong in the opposite direction) (Figure 7); three of these are illustrated in Figure 8 (to lateral habenula, medial septal and diagonal band nuclei). Also shown (Figure 7c) are the distribution of LPO and LHAa average output connection weights. The distribution is very similar for both regions, and weak or very weak connections predominate—equating to about 75% of connections for both regions; moderately strong or stronger connections account for only 7–8% of LPO and LHAa output connections (Figure 7c).
3.2. Inputs to LPO and LHAa
Retrograde axonal tracing from LPO and LHAa revealed a broadly similar pattern of input connections, similar in that regard to their output connections; however, as noted earlier, the pattern of LPO and LHAa input and output connections are very different (Figure 3, 4, 6). Comprehensive analysis of retrograde axonal tracing data from unilateral tracer injection sites highly restricted to LPO and LHAa (Figure 2b, e), revealed that each region receives input from a similar number of unique gray matter regions, between 135 (LPO) and 144 (LHAa). It is recalled that LPO and LHAa also send outputs to a similar number of regions, but the numbers are ~50% higher (206 for LPO, and 211 for LHAa), giving a region-level input/output ratio of <1 (0.66 for LPO; 0.68 for LHAa), indicating substantially more region-level output divergence than input convergence.
Input connections to LPO and LHAa ipsilateral to the side of tracer injections predominated (135 of 172 for LPO; 144 of 204 for LHAa), and they were similarly proportioned for both regions, ranging in percentage of total connection weight from 79% (LHAa) to 86% (LPO); as reported above for the output connections, LPO and LHAa outputs show a similar relative proportionality with respect to brain side, but the ipsilateral input weight percentages are slightly higher than those of the output connections (which are 75% for LHAa, and 78% for LPO). As was observed for LPO and LHAa output connections (excepting LPO and LHAa homotopic connections), there was no instance of a contralateral region providing an input without its ipsilateral counterpart also providing an input, but there were instances of the reverse. However, in contrast to exclusively ipsilateral LPO and LHAa outputs that accounted for most output connections by region, no more than about a fifth of all LPO (16.3% / 22 regions) and LHAa (21% / 30 regions) input regions were exclusively ipsilateral. Additionally, about 90% of these connections were weak or less (to both LPO and LHAa), and none was stronger than moderate.
The regions providing input to LPO and LHAa are mostly the same: 84% (114 of 135) of LPO input regions also provide input to the LHAa, and 79% (114 of 144) of LHAa input regions also provide input to the LPO (Figure 6b, d). For the ~15–20% of regions providing exclusive LPO or LHAa input, >95% of the connections were weak or less and none was stronger than moderate (Figure 6b, d), accounting for just two LHAa connections: to LHAa from triangular septal nucleus, and ventral orbital area.
The strongest average contralateral input from any gray matter region to either LPO or LHAa was moderate, and there was only one connection of this type, from the posterior hypothalamus to the LHAa (weak to the LPO) (Figure 9c, d). For the other regions providing (on average) weaker than moderate contralateral input to LPO (37 regions) and LHAa (58 regions), 94% of the connections were weak, or weaker, and most were very weak. However, considering the highest versus average contralateral LPO and LHAa input connection weight increases slightly the strength of the posterior hypothalamus to LPO connection from weak to weak-moderate (the connection strength to the LHAa remains moderate) (Figure 9c, d), and identifies one additional region, the lateral septal nucleus rostral part (LSr), that sends a moderate input to LPO, and a moderately strong input to LHAa; nevertheless, the contralateral LSr retrograde labeling pales in comparison to very abundant ipsilateral LSr retrograde labeling from both LPO and LHAa (classified as very strong—the highest possible weight category) (Figure 9a, b) (for review of connection data for highest and average connection weights see Supporting Information 1 and 2).
Figure 9.
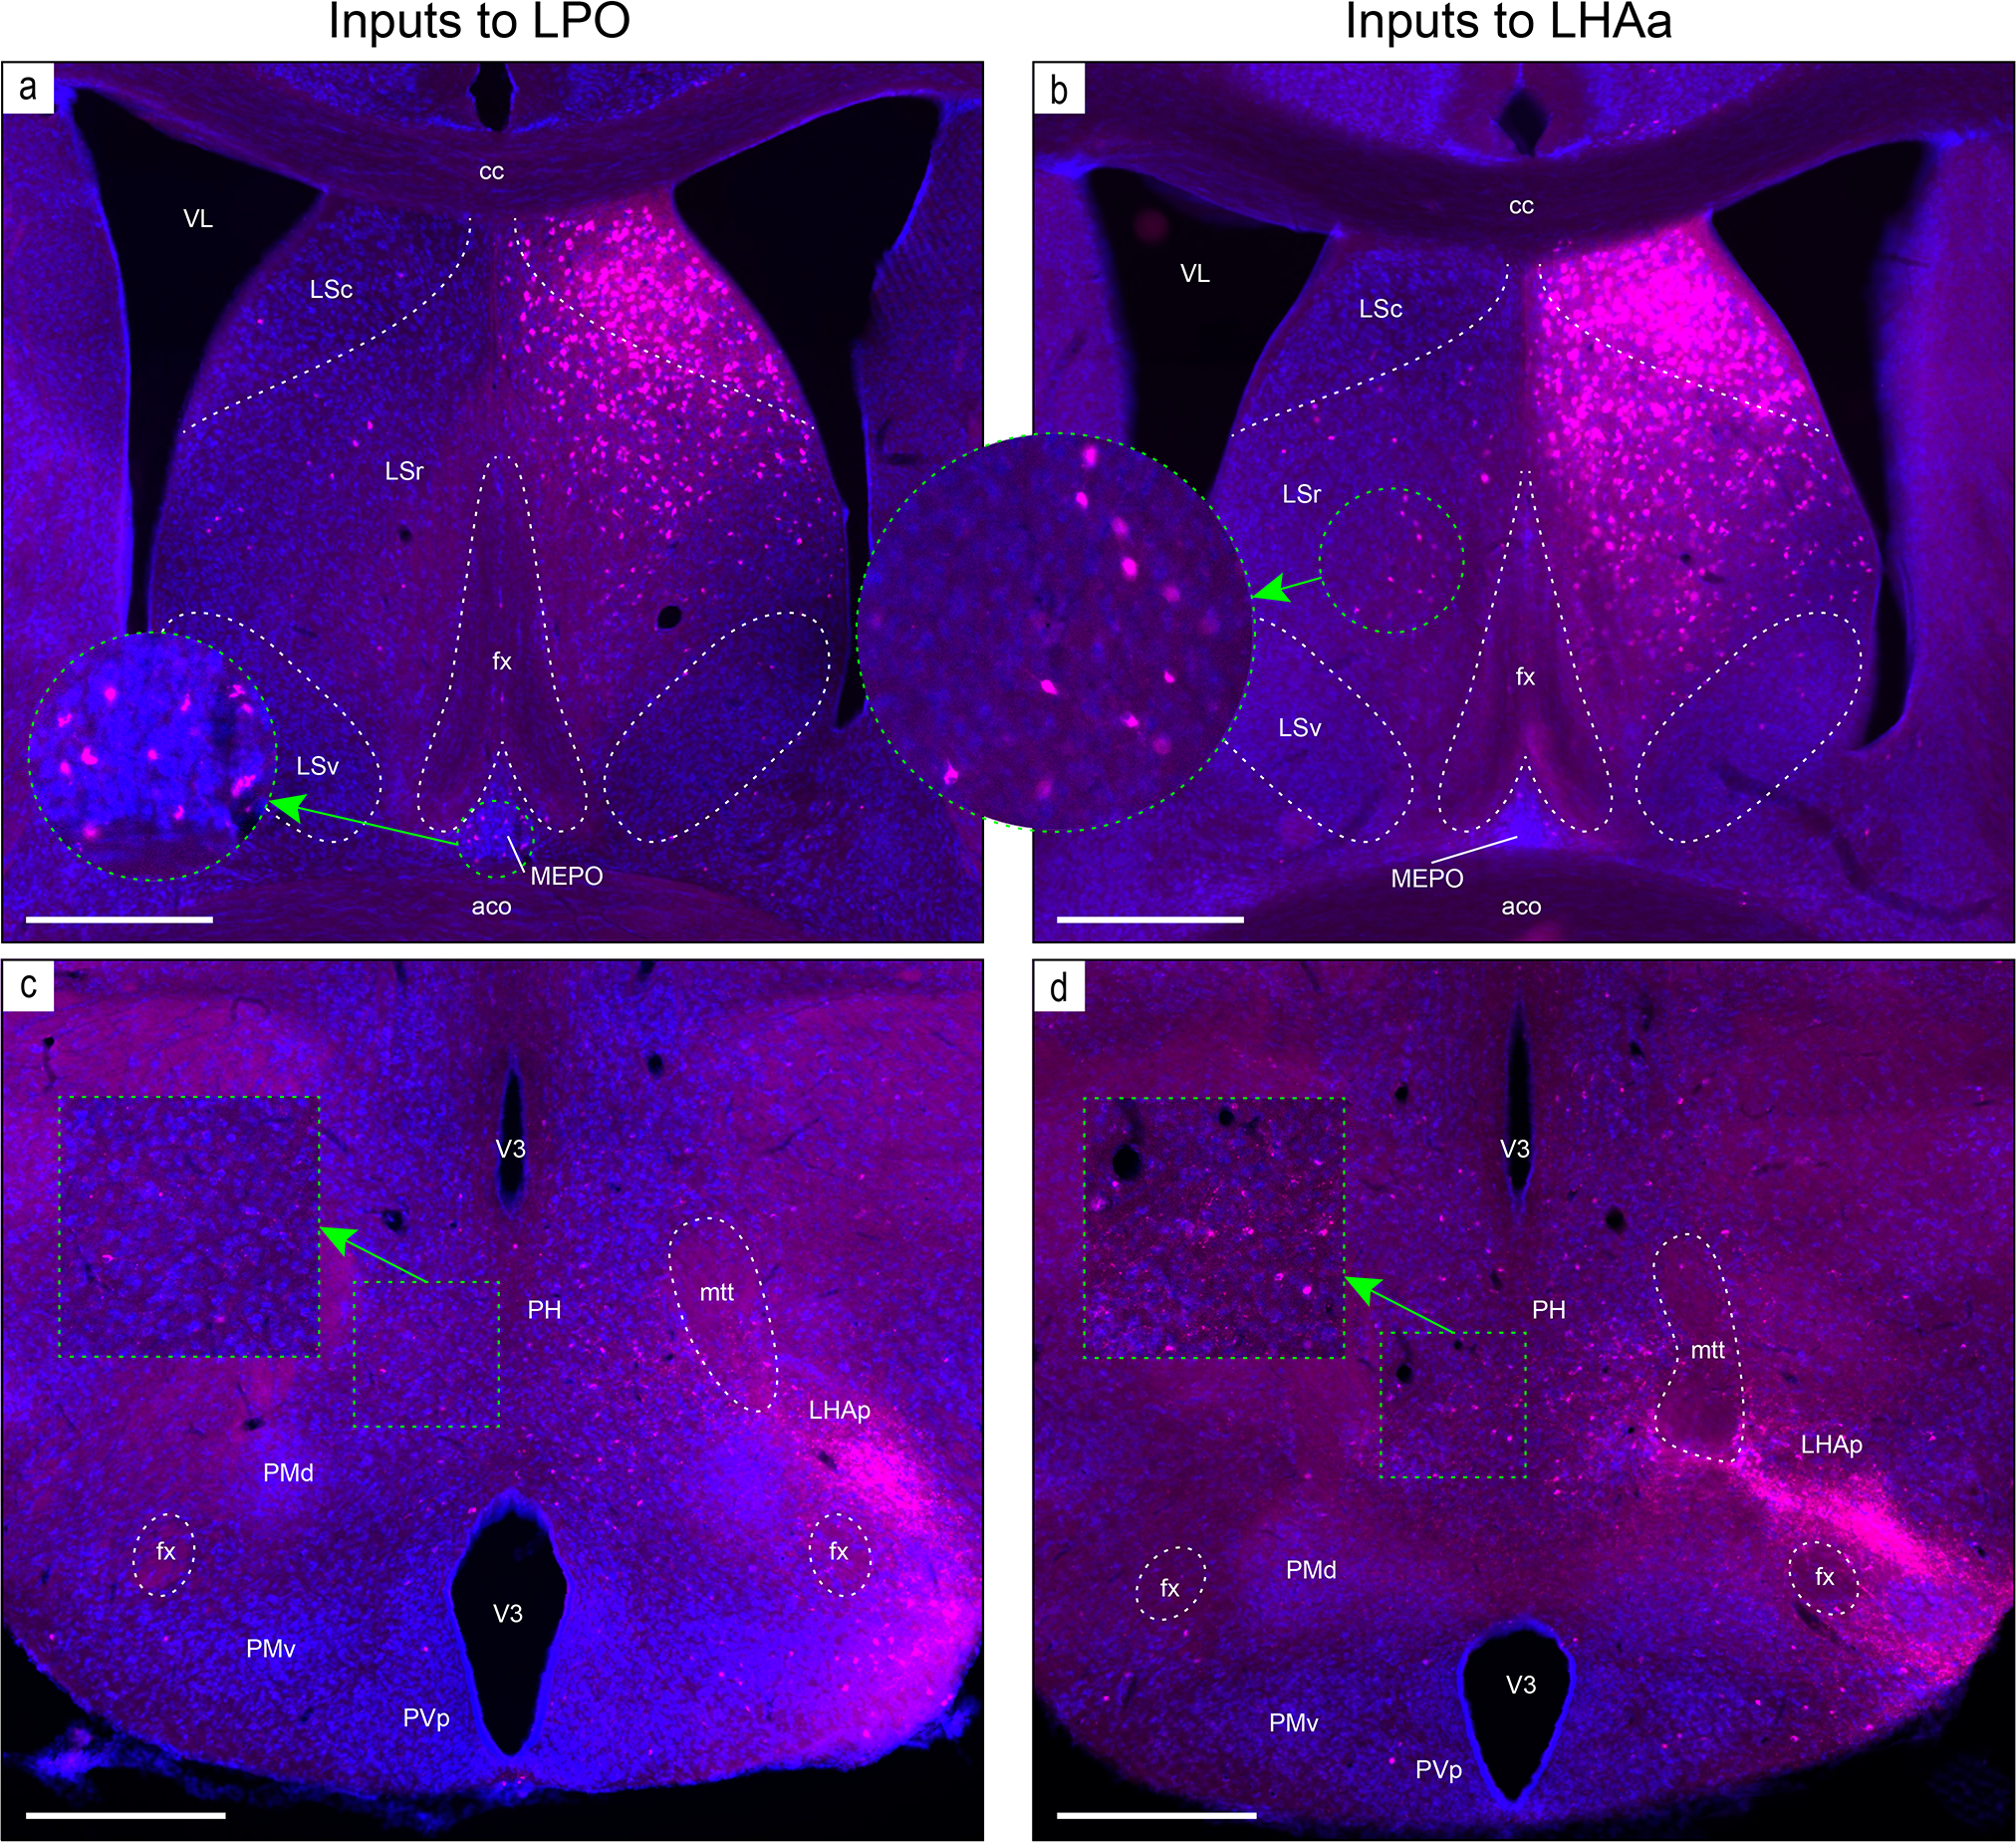
Examples of retrograde axonal labeling (CTB) resulting from unilateral tracer injections in the LPO (#181221–04A) and LHAa (#181221–02A). (a and b) Very abundant ipsilateral retrograde labeling from LPO (a) and LHAa (b) in the lateral septal nucleus rostral (LSr) and caudal (LSc) parts; substantial (but far less abundant) retrograde labeling was also present at this level in the contralateral LSr from the LHAa (b, and outset), and a prominent cluster of contralateral retrograde labeling from the LPO (a, and outset) is visible in the median preoptic nucleus (MEPO). (c and d) Retrograde labeling in the vicinity of the posterior hypothalamus (PH), with noticeably more contralateral labeling from the LHAa (d, and outset) than LPO (c, and outset). Also at this posterior hypothalamic level, strong anterograde labeling is present in an LHA region corresponding to the rat LHA posterior region (LHAp). Dashed lines indicate approximate cytoarchitectural boundaries corresponding to reference atlas parcellation. Additional abbreviations: aco, anterior commissure (olfactory limb); cc, corpus callosum; fx, fornix; LSv, lateral septal nucleus ventral part; mtt, mammillothalamic tract; PMd, dorsal premammillary nucleus; PMv, ventral premammillary nucleus; PVp, periventricular hypothalamic nucleus posterior part; V3, third ventricle; VL, lateral ventricle. Scale bars are 500 μm.
Returning to the predominant ipsilateral LPO and LHAa input connections, the great majority of these remained within the forebrain (LPO, 87.8; LHAa, 87.4%—an even higher proportion than the approximately four-fifths of all LPO and LHAa output connections to the forebrain) (Figure 5b, d); about two-thirds of these originated in (mostly) the hypothalamus (LPO, 37.6%; LHAa, 34.9%), and (secondarily) the cortical plate (LPO, 26.7%; LHAa, 28.5%). Overall, the hypothalamic and cortical plate proportion of LPO and LHAa inputs and outputs is similar (Figure 5b, d). The relative proportion of all LPO and LHAa input connections from other major brain divisions was as follows: 15–17% from striatum, 8–9% from pallidum, 7–8% from midbrain, 4–5% from cortical subplate and pons, and 3–4% from thalamus. Comparing the divisional proportions of LPO and LHAa inputs and outputs, the most notable differences apply to the striatum, thalamus, and pons: the proportion of LPO and LHAa striatal inputs is ~100–200% higher than the outputs, whereas LPO and LHAa thalamic and pontine outputs are (respectively) ~200% and ~100% higher than the inputs (Figure 5). Also, no input to either the LPO or LHAa from the medulla was observed, in contrast to a slight medullary projection arising from both hypothalamic regions.
A comparison of LPO and LHAa inputs that generated on average a moderately strong or stronger connection identifies the most prominent connection weight differences (Figure 7d, e). Compared to LPO and LHAa outputs (Figure 7a, b), there were fewer regional differences in the connection strength of LPO and LHAa inputs. For input connections that were stronger than moderate, the majority were of equal weight, and 80–90% were of equal weight or different by only one degree (Figure 7d, e). Only one stronger than moderate input connection had a weight difference of more than 2 (a moderately strong connection from the supramammillary nucleus lateral part to the LPO, compared to a weak connection to the LHAa).
The LPO and LHAa receive moderately strong or stronger input from 16 regions (Figure 7d), accounting for between 9–11% of all input connections (Figure 7f) (slightly higher than the 7–8% of output connections in the same weight categories, Figure 7c). About 94% (15 regions) of the major inputs come from other forebrain regions and are composed solely of input from the endbrain (73%, 11 regions) and hypothalamus (27%, 4 regions); a single hindbrain region, the pontine central gray, provides a moderately strong input to the LHAa (weak-moderate to the LPO). The sources of strong or very strong LPO and LHAa input are limited to a total of six regions in the cerebral cortex and striatum (Figure 7d, e): strong input to the LHAa (moderately strong to LPO) comes from two cortical regions (cortical amygdala area anterior part, and dorsal peduncular nucleus); very strong input to both LPO and LHAa comes from one cortical region (tenia tecta dorsal part), and three striatal regions (septofimbrial nucleus, and rostral and caudal parts of the lateral septal nucleus). The most abundant retrograde labeling from both LPO and LHAa was found in the rostral and caudal parts of the lateral septal nucleus (Figure 9a, b).
3.3. Bidirectionality of LPO and LHAa connections
In addition to evaluating LPO and LHAa input and output connections individually, the network model is informed by evaluating their integration and differentiation as a function of bidirectional vs unidirectional connections for each region, and for both regions combined. Bidirectional connections accounted for about four-fifths of LPO (80.9%) and LHAa (79.2%) connectivity as a proportion of total connection weight, and the weight of these connections was divided about evenly between outputs (LPO, 42.0%; LHAa 38.5%) and inputs (LPO, 38.9%, LHAa, 40.7%). Conversely, the approximately 20% minority of unidirectional connectivity was divided unequally between outputs (LPO, 16.8%; LHAa 16.2%) and inputs (LPO, 2.3%; LHAa, 4.6%). Moreover, the average strength (0–7 scale binned) of the bidirectional connections (2.4 for both LPO and LHAa) was >40% higher than the average strength of the unidirectional connections (LPO, 1.5; LHAa 1.7). These data show that the bulk of LPO and LHAa connectivity is bidirectional, with the remaining minority composed of weaker, predominantly output, unidirectional connections (Figure 10a, b).
Figure 10.
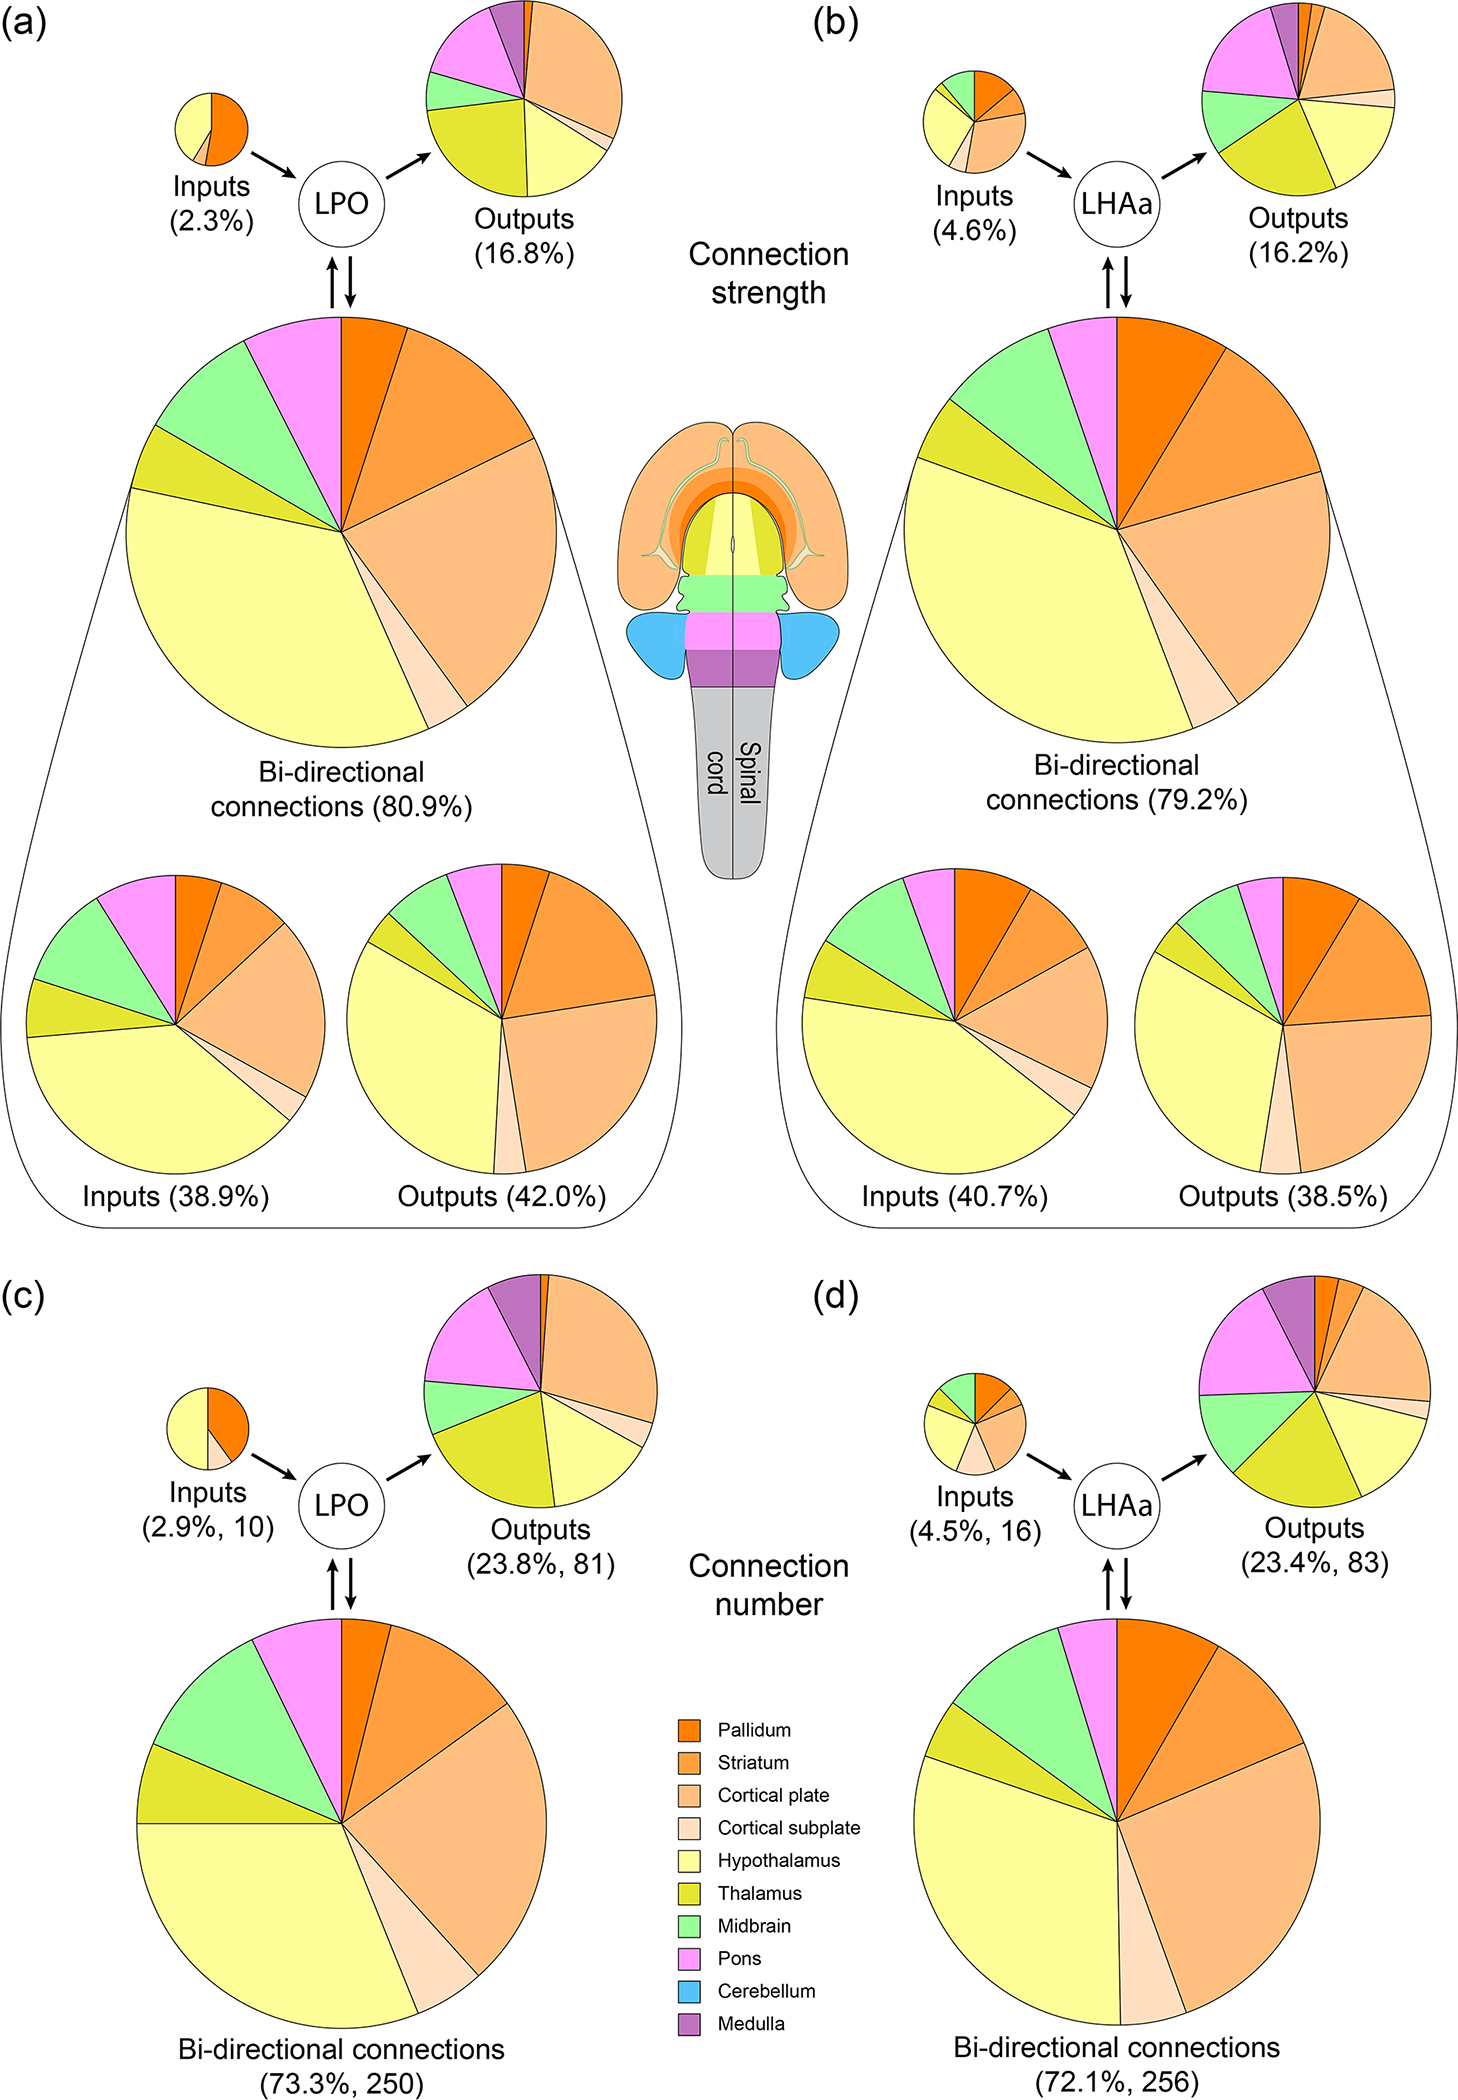
Summary of LPO and LHAa bidirectional and unidirectional connections with major brain divisions. The area of each pie chart (and their segments) is directly proportional to the percentage of each represented connection category for the LPO (a and c) and LHAa (b and d), as a proportion of either the total connection weight (as a sum of the average macroconnection weights) (a and b), or the total number of connections (c and d). Pie chart segment colors correspond to major brain divisions (flatmap and color key insets).
A complementary measure of bidirectionality is obtained by quantifying the number of connections in each connection category (bidirectional, unidirectional outputs, and unidirectional inputs). In this analysis, the number of connections in the unidirectional categories is equal to the number of gray matter regions; whereas it is half the number of connections for the bidirectional connections. Bidirectional connections accounted for 73.3% (250) of LPO and 72.1% (256) of LHAa connections—a slightly lower proportion than the ~80% of bidirectional connections by connection weight. Consequently, a larger minority of connections are unidirectional with respect to the number of connections (27–28%) than with respect to their connection weight (19–21%), and the largest contingent of these is unidirectional output connections that account for nearly a quarter of all LPO (23.8% / 81) and LHAa (23.4% / 83) connections. In contrast, <5% of LPO (2.9% / 10) and LHAa (4.5% / 16) connections are unidirectional inputs (Figure 10c, d).
The smaller proportion of bidirectional connection number (72–73%) compared to the proportion of bidirectional connection weight (79–81%), combined with the stronger average bidirectional vs unidirectional connection strength, amplify their predominance. Furthermore, about 90% of regions providing input to LPO (92.6%) and LHAa (88.9%) are bidirectionally connected, compared to 61% of regions that receive input (60.7% for both LPO and LHAa), indicating substantially more bidirectionally with respect to LPO and LHAa input connections than output connections. Also noteworthy is that the same set of major brain divisions are represented for the LPO and LHAa for both unidirectional and bidirectional connections, and the proportionality of bidirectional LPO and LHAa connections with the major brain divisions is very similar (Figure 10). The major division distribution of connections is also similar to that described earlier for LPO and LHAa input and output connections separately (Results section 3.1 and 3.2), with forebrain connections predominating, and within the forebrain, in descending order of proportion, the following four major divisions: hypothalamus, cerebral cortex, striatum, and pallidum (compare Figure 5 and 10).
For further analysis of bidirectionality, we evaluated sites of potential interaction between LPO and LHAa (as was evaluated separately for LPO and LHAa input and output connections in Results sections 3.1 and 3.2). That is, we asked 1) which gray matter regions that provide an input to LPO, receive an input from LHAa, and vice versa? 2) What is the strength of these connections, and 3) how are they distributed between the major brain divisions? Beginning with LPO, 240 combinatorial connections (involving 120 gray matter regions, 35.2% of all LPO connected regions) composed of LPO inputs and LHAa outputs (one of four combinatorial categories) accounted for 40.7% of combinatorial connections; LPO numbers for the other three combinatorial categories were as follows: 43.5% / 256 connections (37.5% for 128 regions) for combined LPO outputs and LHAa inputs; 13.2% / 78 connections (22.8% for 78 regions) for regions that receive LPO output but provide no LHAa input; 2.6% / 15 connections (4.4% for 15 regions) for regions that provide LPO input but receive no LHAa output (Figure 11c). Combinatorial bidirectional connections for the LHAa showed a similar proportionality: 39.8% / 240 connections (33.8% for 120 regions) for combined LHAa outputs and LPO inputs; 42.5% / 256 connections (36.1% for 128 regions) for combined LHAa inputs and LPO outputs; 15.1% / 91 connections (25.6% for 91 regions) for regions that receive LHAa output but provide no LPO input; 2.6% / 16 connections (4.5% for 16 regions) for regions that provide LHAa input but receive no LPO output (Figure 11d). Note that comparative numbers in parenthesis are calculated as a proportion of gray matter regions instead of the total number of connections in each category, resulting in relative proportional increases for the unidirectional combinatorial categories, and decreases for the bidirectional combinatorial categories.
Figure 11.
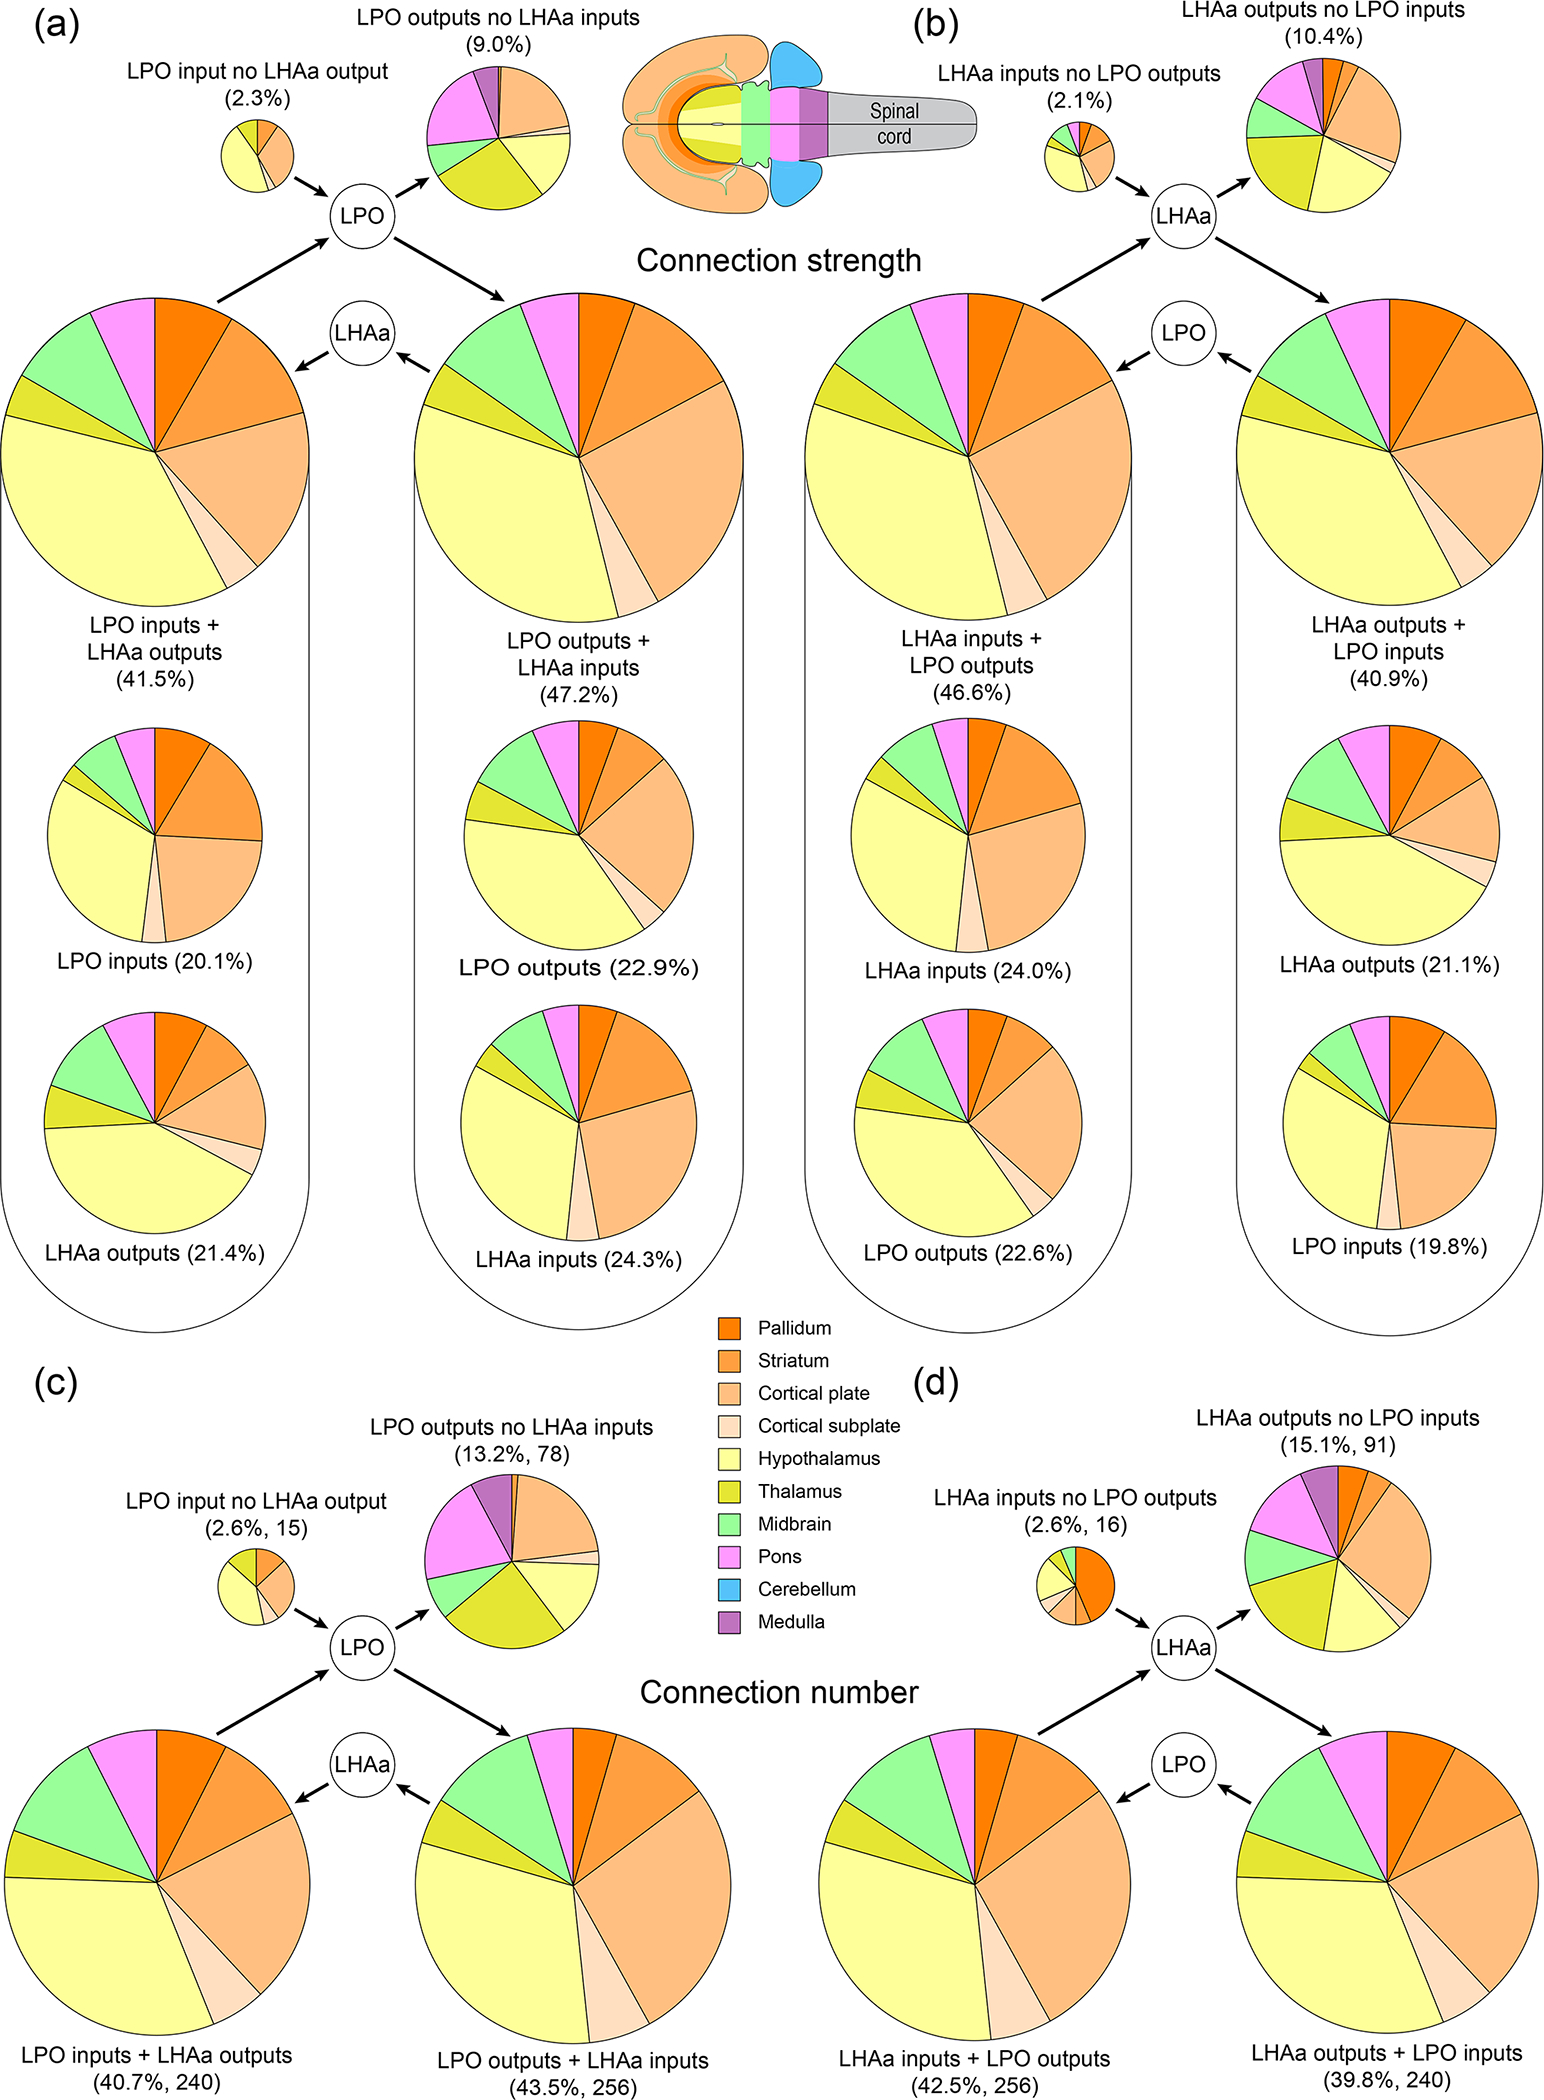
Summary of LPO and LHAa combinatorial bidirectional connectivity with major brain divisions. The area of each pie chart (and their segments) is directly proportional to the percentage of each represented connection category for the LPO (a and c) and LHAa (b and d), as a proportion of either the total connection weight (as a sum of the average macroconnection weights) (a and b), or the total number of connections (c and d). For the bidirectional connection categories in (a) and (b), the proportional contribution of each connection subcategory (inputs and outputs) is also shown. Pie chart segment colors correspond to major brain divisions (flatmap and color key insets).
Numbers for the connection weights for the same four combinatorial connection categories for LPO and LHAa were as follows. For LPO (Figure 11a): LPO input + LHA output, 41.5% (37.1% of LPO connection weight); LPO output + LHAa input, 47.2% (42.2% of LPO connection weight); LPO input with no LHAa output, 2.3% (4.2% of LPO connection weight); LPO output with no LHAa input, 9.0% (16.5% of LPO connection weight). For LHAa (Figure 11b): LHAa input + LPO output, 46.6% (41.2% of LHAa connection weight); LHAa output + LPO input, 40.9% (36.1% of LHAa connection weight); LHA input with no LPO output, 2.1% (3.8% of LHAa connection weight); LHA output with no LPO input, 10.4% (18.9% of LHAa connection weight).
The major brain division distribution of combinatorial bidirectional connections was similar for both connection weights and numbers (compare Figure 11a and b with Figure 11c and d), and also when comparing LPO to LHAa (Figure 11a and c compared to Figure 11 b and d). Furthermore, the divisional distribution is also similar to those for LPO and LHAa bidirectional connections for each region individually (Figure 10), reflecting the prevailing similarity of LPO and LHAa macroconnections in general. However, some differences were apparent, and they were most pronounced for the minority of connections in the two unidirectional combinatorial categories, that accounted in total for <20% of all combinatorial connections. The largest portion of this minority was for the combinatorial category of output connections from LPO and LHAa where the recipient region provided no input to connections to the other region (i.e., LPO recipient regions that provide no input to the LHAa and vice versa). These connections accounted for between 13–15% of connections across all four combinatorial categories, or between 23–26% of connections as a proportion of connected gray matter regions (Figure 11c, d). Nevertheless, our analysis of bidirectionality for LPO and LHA reveals that the great majority of LPO and LHAa connections are individually and collectively bidirectional.
3.4. Control injections
The validity of the main results was tested by comparative analysis with data from additional axonal tracing experiments in which the injection sites partially included the LPO and/or LHAa and neighboring regions (control injections). Additionally, control data included analysis of retrograde labeling obtained from and FG as well as CTB, and anterograde labeling from PHAL as well as AAV. As described below, the results of these analyses concur and support reproducibility of the main results. A comparative focus is provided by regions that were found to connect strongly to the LPO and LHAa based on the main analysis (for outputs: lateral habenula, medial septal and diagonal band nuclei; for inputs: lateral septal nuclei). For the LPO, LHAa, and especially for their neighboring regions, a substantial body of macroscale brain connection data in the primary literature provides a comparative frame of reference. Currently, the most complete set of such data is for the rat (a cognate member of the muroidea rodent superfamily); these data were recently comprehensively collated for the forebrain (Swanson et al., 2020). Additional tracer injections that included either the LPO or LHAa produced labeling patterns (anterograde and retrograde) that generally recapitulated the main results. Inclusion of adjacent regions resulted in additional labeling patterns according to the specific regions included, and these were validated with reference to their previously determined macroscale connections. Lastly, two methodological interpretive points are noteworthy. Firstly, we found no evidence for transneuronal AAV transport (no AAV-labeled cell bodies distant to an AAV injection site), consistent with earlier work from our group indicating a very low level of AAV transneuronal transport that is not visually detectable (Zingg et al., 2017). Secondly, although the presence of axon terminals and boutons are consistent with the presence of a neuronal connection, our use of the term “connection” in this manuscript indicates the inferred existence of a synaptic connection.
3.4.1. LPO Control injections
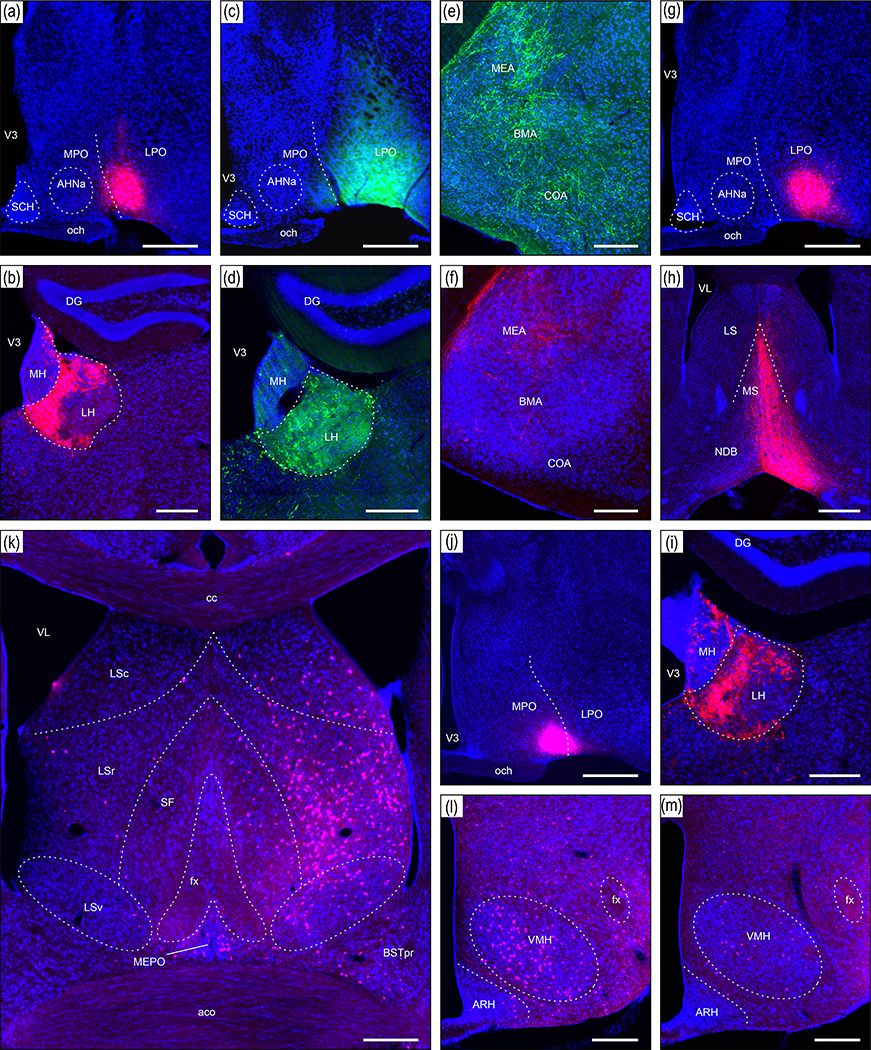
The results of several additional experiments where the injection site included the LPO are shown in Figure 12. An AAV-tdTomato injection site that was centered at a caudal level of the LPO is shown in Figure 12a. The injection site was restricted to the LPO mostly, but also included the rostral end of the LHAa; it produced a very similar labeling pattern to that described in the main results for a more rostral LPO AAV-tdTomato injection (Figure 2a). For example, a strikingly similar innervation (in terms of the spatial distribution and density of labeled axons) was observed in the lateral habenula (compare Figure 12b and 9a). A PHAL injection centered at a similar level of the LPO (Figure 12c), but with a lateral extension into the anterior amygdala area (AAA), and medial amygdala nucleus anterodorsal part (MEAad), also produced strong labeling in the lateral habenula (Figure 12d). In addition, extensive labeling was observed in regions of the basolateral and cortical amygdalar complex (Figure 12e), consistent with previously reported strong intra-amygdala connections involving the AAA and MEAad in mice (Pardo-Bellver et al., 2012) and rats (Canteras et al., 1995). In contrast, weak labeling was found in these amygdala regions from a restricted LPO injection (Figure 12f, from the AAV-RFP injection site shown in Figure 2a; note also in Figure 12f the presence of a weak to moderate connection to the MEA).
Figure 12.
Examples of connections resulting from tracer injection sites including the LPO and neighboring regions (control injections). (a) An AAV-tdTomato injection site in the LPO (#SW181214–01B). (b) Anterograde AAV-tdTomato labeling in the lateral habenula (LH) arising from (a). (c) A PHAL injection site mostly in the LPO, with lateral extension into parts of the amygdala (#SW181214–02B). (d) Anterograde PHAL labeling in the LH arising from (c). (e) Extensive labeling in medial (MEA), basomedial (BMA) and cortical (COA) amygdala nuclei arising from (c). (f) Moderate AAV-tdTomato anterograde labeling in the MEA but comparatively weak BMA and COA labeling arising from a restricted LPO injection (injection site shown in Figure 2a). (g) An AAV-tdTomato injection site mostly in the LPO (SW181214–04B). (h) and (i) Very strong anterograde labeling in medial septal (MS) and diagonal band (NDB) nuclei (h), and LH (i) arising from (g). (j) A CTB-647 injection site mostly within the medial preoptic area (MPO), with slight LPO inclusion (#SW181221–01A). (k) Abundant retrograde labeling in the lateral septal nucleus rostral part (LSr), and less abundant labeling in the LS caudal part (LSc), BSTpr, and MEPO arising from (j). (l) Abundant VMH retrograde labeling arising from (j), in contrast to relatively weak retrograde VMH labeling resulting from an LPO-restricted CTB-647 injection (injection site shown in Figure 2b). See text for further details. Dashed lines indicate approximate cytoarchitectural boundaries corresponding to reference atlas parcellation. Additional abbreviations: aco, anterior commissure (olfactory limb); AHNa, anterior hypothalamic nucleus anterior part; ARH, arcuate hypothalamic nucleus; BSTpr, bed nuclei of terminal stria principal nucleus; cc, corpus callosum, DG, dentate gyrus; fx, fornix; LSv, lateral septal nucleus ventral part; MH, medial habenula; och, optic chiasm; SCH, suprachiasmatic nucleus; SF, septofimbrial nucleus; V3, third ventricle; VL, lateral ventricle; VMH, ventromedial hypothalamic nucleus. Scale bars are 500 μm in a, c, g, h, j; 250 μm in b, d, e, f, i, k, l, m.
Another AAV-tdTomato injection (Figure 12g) that was similar in location and extent to that shown in Figure 12a produced a comparable pattern of labeling to the main results, shown here for labeling in the medial septal and diagonal band nuclei (Figure 12h; compare to Figure 9e), and the lateral habenula (Figure 12i). Conversely, retrograde labeling from a CTB injection site largely within the medial preoptic area (medially adjacent to the LPO), with minor LPO inclusion (Figure 12j), generated a pattern of labeling (Figure 12k) generally consistent with MPO connections reported previously. For example, the MPO is reported to receive strong input from the lateral septal nucleus rostral part (LSr), a moderate input from the ventral part (LSv), and a comparatively weak input from the caudal part (LSc) (Risold & Swanson, 1997); whereas here for the LPO, much stronger retrograde labeling was found in the LSc than the LSr, and the LSv was devoid of labeling (Figure 9a). In addition, a moderate connection from the BST principal nucleus (BSTpr) to the MPO was previously reported (Gu et al., 2003), consistent with moderate BSTpr retrograde labeling shown here (Figure 12k), arising from the MPO (Figure 12j); whereas very little BSTpr retrograde labeling was observed from the LPO (Figure 9a). Abundant VMH retrograde labeling from the MPO was also observed here (Figure 12l), consistent with previously reported substantial VMH to LPO connections (Canteras et al., 1994), in contrast to a weak VMH to LPO connection indicated here by retrograde labeling (Figure 12m; see Figure 2b for injection site).
3.4.2. LHAa Control injections.
The results of several additional experiments where the injection site included the LHAa are shown in Figure 13. An injection of FG that was centered at a mid level of the LHAa (Figure 13a), with minor encroachment caudally into tuberal and subfornical LHA regions, and the LPO rostrally, generated a pattern of labeling similar to that obtained from a more restricted LHAa injection (main results, Figure 2c). For example, a very similar labeling pattern was found in the LSr and LSc (compare Figures 12c and 8b); in contrast, a moderate level of retrograde labeling in the median preoptic nucleus (MEPO) is consistent with minor LPO inclusion (see Figure 9a), and both MEPO and BSTpr retrograde labeling shown in Figure 13c are consistent with previously reported connections from these forebrain regions to tuberal and subfornical LHA regions (Dong & Swanson, 2004; Gu et al., 2003; Thompson & Swanson, 2003; Uschakov et al., 2007).
Figure 13.
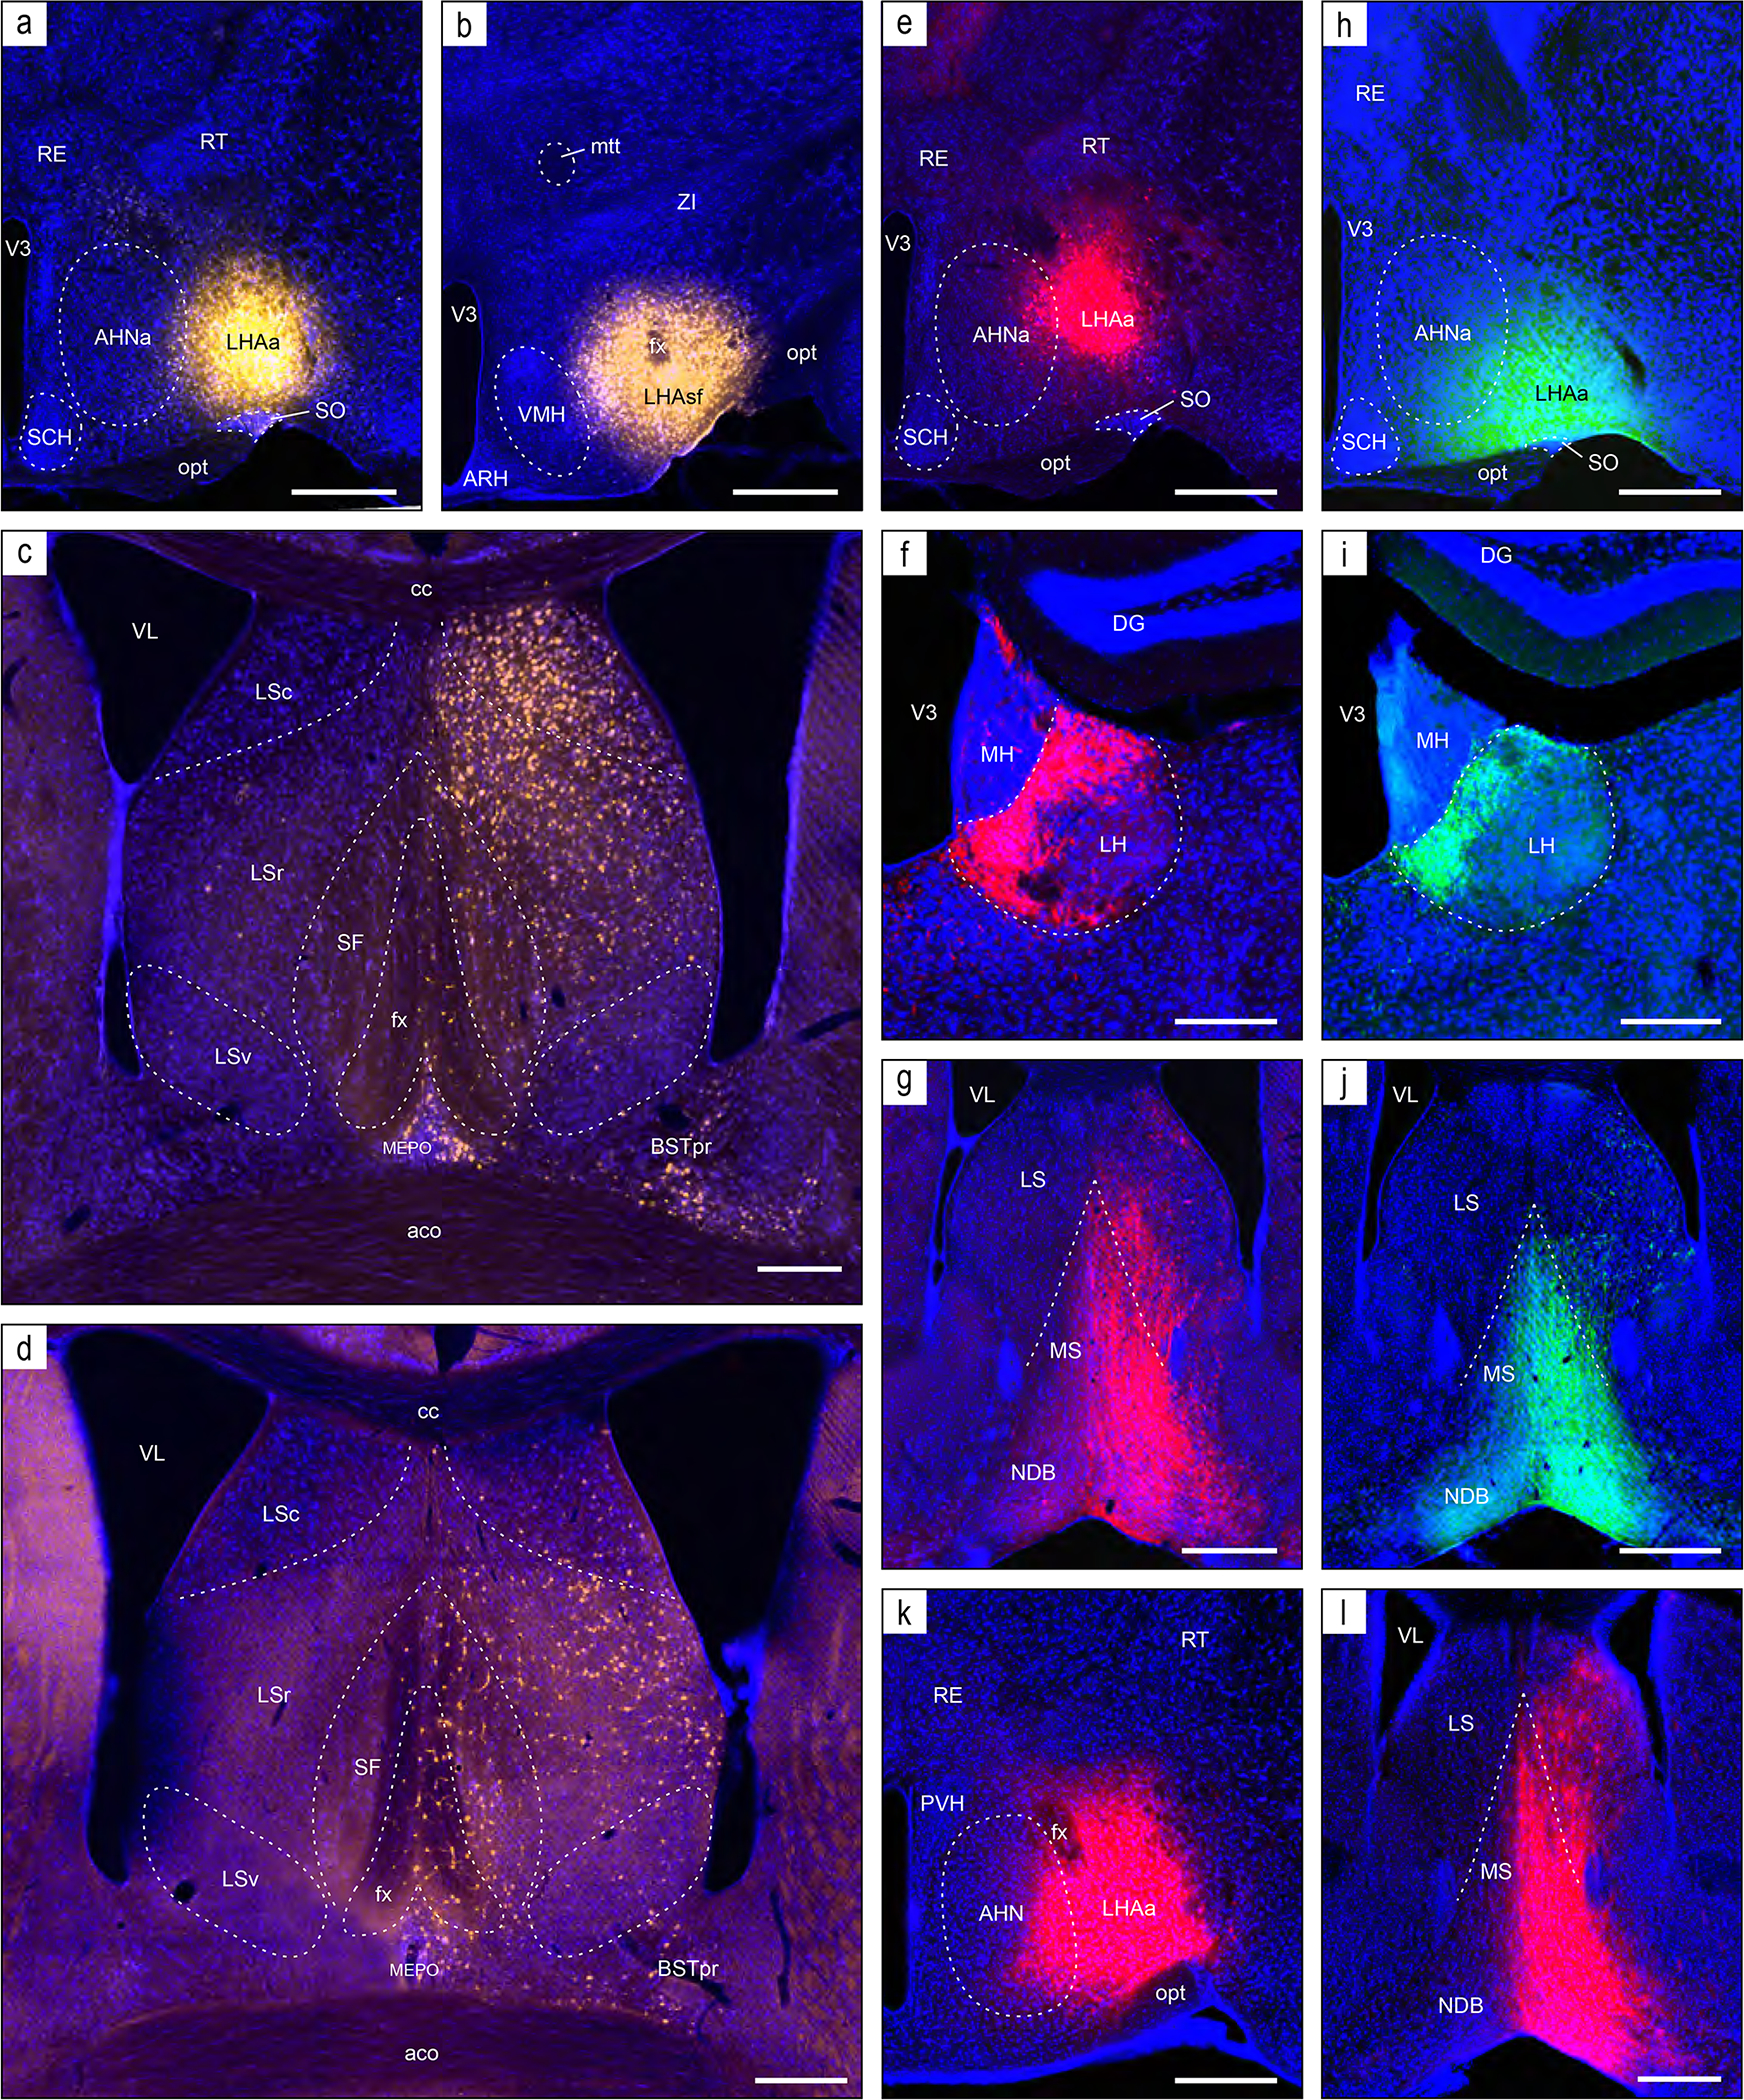
Examples of connections resulting from tracer injection sites including the LHAa and neighboring regions (control injections). (a) A FG injection (#SW181109–03B) in the LHAa. (b) A FG injection (#SW171207–03A) mostly in the subfornical LHA (LHAsf), with slight LHA inclusion rostrally. (c) Very abundant retrograde FG labeling in the lateral septal nucleus caudal part (LSc), and abundant retrograde labeling in the LS rostral part (LSr), arising from (a); retrograde labeling is also present in the BSTpr and MEPO. (d) Weak LSc and moderate LSr retrograde FG labeling arising from (b). (e) An AAV-tdTomato injection (#SW181109–03B) mostly in the LHAa. (f) and (g) Very strong anterograde AAV-tdTomato labeling in the lateral habenula (LH), and medial septal and diagonal band (NDB) nuclei arising from (e). (h) A PHAL injection (#SW181214–04B) mostly in the LHAa. (i) and (j) Very strong anterograde PHAL labeling in the LH and NBD arising from (h). (k) A large AAV-tdTomato injection (#SW210402–03A) in the LHAa, with AHNa inclusion. (l) Extremely strong anterograde AAV-tdTomato labeling in the MS and NDB, and more moderate LS labeling, arising from (k). See text for further details. Dashed lines indicate approximate cytoarchitectural boundaries corresponding to reference atlas parcellation. Additional abbreviations: aco, anterior commissure (olfactory limb); AHN, anterior hypothalamic nucleus; ARH, arcuate hypothalamic nucleus; BSTpr, bed nuclei of terminal stria principal nucleus; cc, corpus callosum, DG, dentate gyrus; fx, fornix; LSv, lateral septal nucleus ventral part; MH, medial habenula; mtt, mammillothalamic tract; opt, optic tract; PVH, paraventricular hypothalamic nucleus; RE, nucleus reuniens; RT, reticular thalamic nucleus; SCH, suprachiasmatic nucleus; SF, septofimbrial nucleus; V3, third ventricle; VL, lateral ventricle. Scale bars are 500 μm in a, b, e, h, g, j, k; 250 μm in c, d, f, i, l.
The results just described contrast with those obtained from a different FG experiment with an injection site centered just caudal to the LHAa in the LHA subfornical region (Figure 13b); the injection site extended ventrally into the tuberal LHA, and rostrally to include slightly the caudalmost level of the LHAa. Comparing retrograde labeling in the lateral septal nucleus from this experiment to the results of more restricted and extensive LHAa injections (Figure 9a and 13c), less abundant labeling was evident in the LSr, and labeling in the LSc was sparse. These results are consistent with a combination of slight LHAa inclusion (based on the current results), together with previously reported weak (maximum) connections from the LSc to both the tuberal and subfornical LHA regions, and moderate (maximum) connections from the LSr to the tuberal nucleus (Risold & Swanson, 1997).
Further comparison is provided by the results of an AAV-tdTomato injection that was mostly restricted to the LHAa (Figure 13e) which generally recapitulated the anterograde labeling described in the main results from a similarly restricted AAV-tdTomato LHAa injection (Figure 2d). The connectional similarity is exemplified by the connections to the LH (Figure 13f, compare to Figure 9b), and to the MS and NDB (Figure 13g, compare to 8f). Similar results were also obtained from a PHAL injection site that was centered near to the rostral end of the LHAa (Figure 13h), as shown here for anterograde labeling in the LH (Figure 13i), and MS and NDB (Figure 13j). Lastly, a large LHAa-centered AAV-tdTomato injection (Figure 13k), that also included the anterior hypothalamic nucleus (AHN), generated anterograde labeling that was mostly denser but similar in distribution to more restricted LHAa injections, shown here for the MS and NBD (Figure 13l).
4. Discussion
Among the multiple findings that emerge from the current axonal tracing analysis of LPO and LHAa regional connectivity, five are prominent. Firstly, both lateral hypothalamic regions are predominantly ipsilaterally connected: (by weight) ipsilateral output connections account for between 75% (LHAa) to 78% (LPO) of connections, and ipsilateral input connections account for between 79% (LHAa) to 86% (LPO) of connections. Secondly, both LPO and LHAa are very highly connected, with each region sending output to, and receiving input from, several hundred different gray matter regions (outputs: LPO = 206, LHAa = 212; inputs: LPO = 135, LHAa = 144). Previous investigations of LHA medial and perifornical tier regions in rat using similar methods (Hahn & Swanson, 2010, 2012, 2015), also described very high levels of connectivity, with each region receiving input from, and sending output to, >100 other regions, which at the time was the highest degree of macroscale connectivity identified for individual gray matter regions. The present findings reveal an even higher degree of connectivity for the LHAa and LPO. The high degree of connectivity in the previous investigations, rather than being associated with a narrowly defined functional role, was thought to reflect broad thematic roles for each LHA region with respect their involvement in behavioral control. As will be discussed, the current results support a similar hypothesis for the LPO and LHAa.
A third major finding of the present study is that while the pattern of input and output connectivity differs substantially for both LPO and LHAa, the macroscale connections of both regions are broadly similar, a finding that is expressed at the level of gray matter regions (Figure 3, 6, 8, 9), and by extension at the level of their parent divisions (Figure 4, 5). Regarding the latter, about one-third of all LPO and LHAa input and output connections remain within the hypothalamus; the second most highly LPO and LHAa connected main brain division is the cerebral cortex, followed by the cerebral nuclei (basal ganglia) (Figure 4). Fourthly, approximately 80% of LPO and LHAa connections are bidirectional (Figure 10) and, fifthly, the proportion of combinatorial bidirectionality is even higher, with approximately 90% of LPO and LHAa connections being shared, in contrast to a relative paucity of exclusively unidirectional connections for either region (Figure 11).
Together, these data show that in terms of their macroscale connectivity, the LPO and LHAa are rather similar. This finding concurs broadly with the results of earlier anterograde tracing studies in the rat, including autoradiographic tracing of LPO/LHAa connections (Swanson, 1976), and (more recently) PHAL tracing of LHAa connections (Canteras et al., 2011). The data from the earlier studies were used in a recent network meta-analysis of macroscale connectivity for the mammalian forebrain (Swanson et al., 2020), in which the LPO and LHAa were found to cluster together to six levels deep in a subsystem hierarchy, splitting only at the very bottom of the hierarchy into two lowest-level subsystems, one composed of the LPO and lateral habenula, and the other including the LHAa, LHA subfornical region anterior zone (LHAsfa), and dorsal premammillary nucleus (PMd) (see Figure 6 in Swanson et al., 2020). It is recalled that the LHAsfa and lateral habenula are both ranked very highly on the list of regions with strong LPO and LHAa connectivity in the present study (Figure 7). Also noteworthy is that the LHAa was identified in the forebrain network analysis as being a member of a “rich club” (a network analysis term that applies to highly connected and interconnected nodes within a network). Given the present results, it is perhaps surprising that the LPO was not categorized similarly. However, gaps in the primary literature for rat LPO macroconnection data may have contributed to the difference (Swanson et al., 2020), as could also a slightly higher overall level of LHAa than LPO connectivity (the current data show that the LHAa forms about 4% more macroconnections than the LPO).
The tight clustering of the PMd with the LHAa (slightly less tight with the LPO) based on the rat forebrain network analysis is notable because here we found only weak-moderate connectivity from the LHAa to the PMd (slightly weaker from the LPO). A previous report of strong connectivity from LHAa to PMd (in rat) focused on a very discrete LHAa subregion juxtaposed dorsally to the supraoptic nucleus that receives retinal input, and is referred to as the retinorecipient region of the LHAa ventral zone (LHAavr) (Canteras et al., 2011). One possible explanation for the difference between the current and previous results in the reported strength of the LHAa to PMd connection is that the anterograde tracer injection selected here for the main analysis (Figure 2d) labeled few somata in a region corresponding spatially to the tiny LHAavr in the rat. This interpretation is supported by the results of a larger PHAL injection in the LHAa (injection site shown in Figure 13h) that included the region corresponding to the rat LHAavr and generated more substantial PMd labeling. Moreover, the connections of the LHAavr are reported to differ in other respects from the adjacent gray matter of the LHAa. Notably, control injections described in the previous report that were centered just dorsal to the LHAavr (corresponding roughly to the center of the injection site here shown in Figure 2d), reportedly resulted in a more moderate LHAa connection to the PMd, and a massive connection to the lateral habenula (that received a comparatively weak input from the LHAavr) (Canteras et al., 2011). These findings are consistent with the present data, which support the earlier interpretation of the LHAavr as a discrete LHAa subregion with a similar pattern of connectivity but differences in connection strength compared to the majority of the LHAa spatial volume (Canteras et al., 2011); they also support the existence of a similar discrete LHAa subregion in both rats and mice.
The aforementioned recent macroscale network model for the rat forebrain provides a framework for exploring general functional associations for LPO and LHAa in relation to the current results. It should be noted that for the forebrain network analysis different forebrain network models were generated for male and female rat based on statistically significant sexually dimorphic differences for a very few connections; however, none of these directly involved the LPO or LHAa. Moving up the forebrain subsystem hierarchy from the LPO and LHAa, functional associations that were assigned to the subsystems based on current evidence included the following (in ascending subsystem hierarchical order): defensive behavior, reward prediction, agonistic and mating behaviors, luminance inputs for circadian rhythms and arousal, and lastly innate survival behavior (including integrated somatomotor and physiological control), and affect (see Figure 6 in Swanson et al., 2020). An overview summary of prominent forebrain network functional associations in relation to the present data and discussion is shown in Figure 14.
Figure 14.
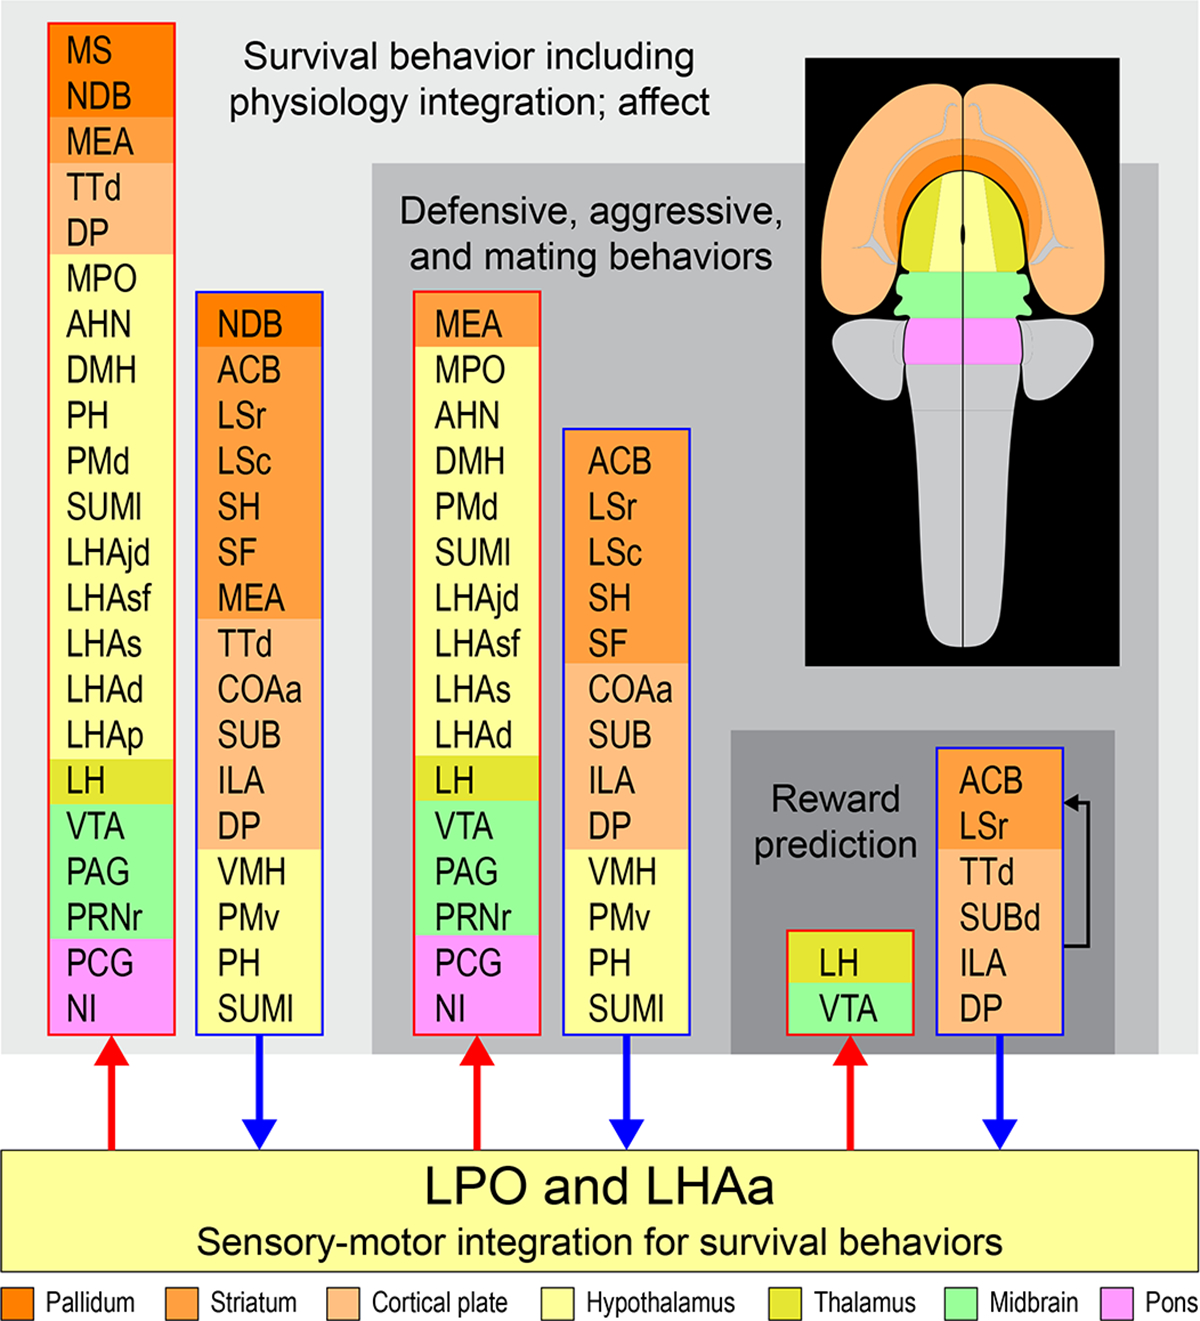
Prominent multilevel LPO and LHAa functional associations suggested by a recent mammalian forebrain network model (Swanson et al., 2020). Three nested tiers of functional grouping are represented (gray shaded tiles), and for each is listed functional grouping-related gray matter regions with prominent connections to LPO and LHAa; outputs and inputs are indicated respectively by red and blue colored lines and arrows. For the lowest tier represented, four regions of the cerebral cortex that are not directly associated with the indicated functional association of “reward prediction” are included because they provide robust inputs to LPO and LHAa as well as to the striatal regions within the same tier (indicated by the black arrow). Regions are color-coded by tiles representing their major brain division (shown on the flatmap insert) and are listed in a topographic arrangement. See text for additional details. For abbreviations see Supporting Information 1.
In light of the hundreds of LPO and LHAa connections identified in the current study, it is infeasible to discuss them all in detail here. Accordingly, exploration of the forebrain network functional associations in relation to the current data is guided by the major LPO and LHAa connections. To recap, stronger than moderate LPO and LHAa connections (inputs and outputs) are shown in Figure 7. The strongest LHAa and LPO outputs are to lateral habenula. A surge in lateral habenula research that began about a decade ago coincided with the discovery of a role for the habenula in responding to negative reward—a counterpoint to positive reward that is classically associated with the nucleus accumbens, and narrowed to a ‘hedonic hotspot’ in the nucleus accumbens shell (for review see Berridge & Kringelbach, 2015). More specifically in this regard, lateral habenula neurons appear to play a role in negative reward prediction error (responding to stimuli indicative of a more negative outcome of a behavioral action than was expected).
It is noteworthy that the LPO and LHAa projection to the lateral habenula targets primarily its medial, dorsal, and ventral subregions, with much less dense input laterally (Figure 8a and b). A similar terminal distribution has been shown in rats with PHAL (Zahm & Root, 2017), and confirmed in other studies (for review see Hu et al., 2020). The similarity of LPO and LHAa projections to the lateral habenula, and the similarity of their macroscale connections in general, contrasts with an appreciable difference in the expression levels of excitatory and inhibitory neuronal markers in LHAa (predominantly excitatory) and LPO (predominantly inhibitory) in both rat (Hahn et al., 2019) and mouse (Supporting Information 3). While this raises the possibility of an opposing or complimentary role at the region level, neither region is exclusively one sign, and functional studies at subregional levels suggest more complex functional dynamics. For example, despite an abundance of GABAergic neurons in the LPO, its projection to the lateral habenula is reported to be primarily glutamatergic (Barker et al., 2017). Moreover, in the same study it was shown that LPO input to individual lateral habenula neurons can be both GABAergic and glutamatergic, and while both inputs are activated by aversive stimuli, independent activation of the glutamatergic inputs is reported to be aversive, while activation of the GABAergic inputs is reportedly rewarding (Barker et al., 2017).
Considering an indicated role relating to reward processing for the LPO and LHAa via their connections to the lateral habenula connections, it is notable that here we found up to moderate retrograde labeling in the nucleus accumbens (mostly in its shell region) from the LPO and LHAa. A substantial direct connection from a discrete subregion of the nucleus accumbens shell to the LHAa was previously shown in rat by anterograde tracing (Thompson & Swanson, 2010), as was also (in the same study) a massive direct connection from the LHAa to the lateral habenula. The present findings indicate the existence of a direct connection from the nucleus accumbens shell to both LPO and LHAa and from both LPO and LHAa to the lateral habenula—the latter consistent with a much earlier classic retrograde tracing study (Herkenham & Nauta, 1977). From a functional perspective, based on the current evidence, this suggests LPO and LHAa receive information associated with positive valence stimuli (arriving from the nucleus accumbens shell) and transmit information to the lateral habenula that is associated with encoding negative valance stimuli.
Given that the nucleus accumbens shell does not project directly to the lateral habenula (Thompson & Swanson, 2003), the LPO and LHAa are therefore well placed to form part of an integrative circuit that could influence the encoding of negative reward prediction error in the lateral habenula in response to activity in the ‘hedonic hotspot’ of the nucleus accumbens. Prominent directionality of this circuit is suggested by an indicated weak direct projection from the lateral habenula to LPO and LHAa, and a weak connection from either region to the nucleus accumbens. Also noteworthy in relation to this are strong LPO and LHAa connections to the ventral tegmental area (VTA) that is a crucial node for the integration of motivation-related information (arriving directly and indirectly from the nucleus accumbens) with control of motor output for locomotor behavior (Morales & Margolis, 2017) (Swanson, 2000).
The most abundant retrograde labeling from LPO and LHAa was found in the lateral septal nucleus rostral (LSr) and caudal (LSc) parts, septofimbrial nucleus (SF), and tenia tecta dorsal part (TTd). Strongest inputs to the LS in turn come from the hippocampal formation, and more specifically from all fields of Ammon’s horn (predominantly from CA1 to the LSr, and CA3 to LSc) (Bienkowski et al., 2018; Cenquizca & Swanson, 2006, 2007; van Groen & Wyss, 1990), and from (mostly) ventral subiculum to LSr (Bienkowski et al., 2018; Canteras & Swanson, 1992), and (mostly) dorsal subiculum to LSc (Witter et al., 1990). Strongest inputs to the SF also arise from CA3 (Gaykema et al., 1991). The topographically organized hippocampal to septal neural connections are implicated centrally in cognitive control of behavior relating to both exteroceptive (predominantly dorsal hippocampus in rodents) and interoceptive (predominantly ventral hippocampus in rodents) stimuli (Andersen et al., 2007; Risold & Swanson, 1997; Risold et al., 1997). Accordingly, the very abundant retrograde labeling from both LPO and LHAa that we found in the LS, indicate that LPO and LHAa are major downstream recipient regions for topographically organized cognitive information streams that are broadly relevant to survival behaviors. This suggested role is underscored further by the present data that also revealed substantial direct connections between CA1, CA3, subiculum, and LHA, LPO, including a bidirectional LPO and LHAa connection with the subiculum (moderate to strong from LPO and LHAa to subiculum, and generally moderate to the subiculum), and (up to moderate) CA1 and CA3 projections to LPO (mostly from CA1) and LHAa (mostly from CA3). In addition to these connections is noted a robust input to LPO and LHAa from TTd (present data) that in turn receives substantial input from multiple cerebral cortical regions (Zingg et al., 2014), including a moderate input from ventral CA1 (Cenquizca & Swanson, 2007), and notably from the piriform area that plays a central role in olfactory sensory processing (Luskin & Price, 1983; Zingg et al., 2014).
Returning to discussion of LPO and LHAa outputs, considering what was just discussed regarding lateral septal and hippocampal inputs to LPO and LHAa, it is salient to consider the massive projection from the LHAa and LPO to the medial septal (MS) and diagonal band (NDB) nuclei (Figure 8e, f). The MS and spatially-adjacent NDB are often considered together owing to their similar chemoarchitecture (notably cholinergic neurons) (Kiss et al., 1990a), as well as overlap and complementarity in their connections, notably their hippocampal outputs (Gaykema et al., 1991; Kiss et al., 1990b; Swanson & Cowan, 1979) and lateral septal inputs (Risold & Swanson, 1997), and putative function, especially as it relates to the hippocampal theta rhythm (Roland et al., 2014; Tsanov et al., 2014; Vertes & Kocsis, 1997) that is indicated to facilitate temporal sequencing for locomotion (Nunez & Buno, 2021). Considering on the one hand a massive input to the LPO and LHAa from the LS, and on the other hand a massive output from LPO and LHAa to the MS and NDB, suggests a complex interplay whereby LPO and LHAa connections to NDB/MS may influence activity of the hippocampal theta rhythm (and thereby locomotor activity), in response to hippocampal theta activity and a broad array of exteroceptive and interoceptive sensory information streams transmitted from the hippocampus to the LHAa and LPO via the LS, and (to a lesser extent) directly from the hippocampus.
From the discussion thus far, it is evident that several of the forebrain network subsystem functional associations assigned to both LHAa and LPO are consistent with the current results, including reward prediction (nucleus accumbens, lateral habenula, and VTA connections), luminance inputs (via the retinorecipient LHAavr) relevant to circadian rhythms and arousal, and information relevant to survival behaviors including physiology integration, and affect (via septal and hippocampal connections and their concomitant information streams). For the remainder of the discussion, we consider the remaining forebrain network functional associations linked to LHAa and LPO-inclusive subsystems that relate to specific behaviors: defensive, agonistic (includes defensive and aggressive behaviors), and mating behaviors.
A major forebrain network association for the LPO and LHAa with defensive behaviors merits attention, and a current model for the neurocircuitry of innate and learned mammalian defensive responses (Canteras & Graeff, 2014) provides a comparative resource. Table 2 and 3 compare LPO and LHAa connections with brain divisions identified in the defensive behavior model for four different categories of threat stimulus: predator, social, interoceptive (for innate/unconditioned responses), and painful (for learned/conditioned responses). Viewing Table 2 and 3 it is evident that LPO and LHAa connect to regions associated with all threat stimulus categories. However, output connections from LPO and LHAa to these regions collectively outweigh inputs by 31%, and the output connections associated with the stimulus categories of social and interoceptive threat (average weight = 4) are much stronger than those associated with predator threat and painful stimuli (average weight = 2). Overall, strongest LPO and LHAa connections (inputs and outputs) are with regions identified in the model as relating to social threat. Nevertheless, for learned/conditioned defensive responses (Table 3), very strong LPO and LHAa septohippocampal connections also suggest participation in learned responses to predatory and painful threat stimuli. Taken together, these findings suggest a central role for LPO and LHAa in innate and learned defensive responses to multiple types of threat, but especially those that include a social or interoceptive component.
Table 2.
Comparison of LPO and LHAa connections with other gray matter regions and circuits identified in three models of innate (unconditioned) defensive behavioral responses relating to three different categories of threat stimuli: predator, social, and interoceptive (Canteras & Graeff, 2014). For each stimulus category, three separate columns associated with the model list (from left to right): 1) stimuli and responses, 2) major brain divisions involved, 3) gray matter regions involved. Arrows in the first two columns indicate direction of information flow. Two columns on either side of the Regions column list LPO and LHAa output and input connections with the associated regions. LPO and LHAa connection weights are highest binned values following a 1–7 / weakest-strongest color scale (see Supporting Information 1 and 2, and text for further details). Note that for the dorsal premammillary nucleus (PMd), a distinction is made in the behavioral model between ventrolateral and dorsomedial subdivisions; however, no clear distinction in this regard was apparent in LPO and LHAa PMd connections, therefore the same PMd connection value was applied to both. Additionally, for divisions identified in the behavioral model that contain more than one gray matter region (that are listed in the Regions column), the highest LPO and LHAa connection weights across all constituent regions was selected, which applies to the following divisions: Septohippocampal system (SHS) that includes the septal nuclei and the hippocampal formation; anterior hypothalamic nucleus (AHN), dorsomedial hypothalamic nucleus (DMH), and central amygdalar nucleus (CEA). Additional abbreviations: BLA, basolateral amygdalar nucleus; BMAp, basomedial amygdalar nucleus posterior part; LA, lateral amygdalar nucleus; LHAjd, lateral hypothalamic area juxtadorsomedial region; LHAs, lateral hypothalamic area suprafornical region; MEAad, medial amygdalar nucleus anterodorsal part; MEApd, medial amygdalar nucleus posterodorsal part; MEApv, medial amygdalar nucleus posteroventral part; MPO, medial preoptic area; PAGdl, periaqueductal gray dorsolateral column; PAGdm, periaqueductal gray dorsomedial column; PAGl, periaqueductal gray lateral column; PAGvl, periaqueductal gray ventrolateral column; PMv, ventral premammillary nucleus; VMHdm, ventromedial hypothalamic nucleus dorsomedial part; VMHvl, ventromedial hypothalamic nucleus ventrolateral part.
| Neural circuits underlying innate (unconditioned) responses to threat stimuli | ||||||
| Predator threat |
LPO & LHA
Outputs |
Regions |
LPO & LHA
Inputs |
|||
| LPO | LHAa | LPO | LHAa | |||
|
| ||||||
| Polymodal sensory predator cues → |
Amygdala ↓ | 0 | 0 | LA | 1 | 1 |
| 3 | 2 | BMAp | 2 | 2 | ||
| Predator odor → | 0 | 0 | MEApv | 0 | 0 | |
|
| ||||||
| Predator-responsive hypothalamic circuit ↓ | 4 | 3 | AHN | 2 | 2 | |
| 1 | 0 | VMHdm | 3 | 4 | ||
| 2 | 4 | PMd (vl) | 0 | 1 | ||
|
| ||||||
| Unconditioned behavioral responses to predator threat | ← Brainstem | 2 | 2 | PAGdl | 1 | 1 |
|
| ||||||
| Social threat |
LPO & LHA
Outputs |
Regions |
LPO & LHA
Inputs |
|||
| LPO | LHAa | LPO | LHAa | |||
|
| ||||||
| Constraint stress → |
Septo-hippocampal system (SHS) |
7 | 7 | SHS | 7 | 7 |
| Conspecific cues → | Amygdala ↓ | 3 | 3 | MEAad | 4 | 3 |
| 0 | 0 | MEApv | 0 | 0 | ||
|
| ||||||
| Conspecific-responsive hypothalamic circuit ↓ | 6 | 4 | LHAjd | 2 | 3 | |
| 6 | 6 | LHAs | 1 | 3 | ||
| 2 | 4 | PMd (dm) | 0 | 1 | ||
| 4 | 3 | MPO | 4 | 4 | ||
| 1 | 3 | VMHvl | 3 | 3 | ||
| 2 | 2 | PMv | 2 | 4 | ||
|
| ||||||
| Unconditioned behavioral responses to social threat | ← Brainstem | 5 | 6 | PAGl | 3 | 3 |
| 1 | 2 | PAGdm | 2 | 1 | ||
|
| ||||||
| Interoceptive threat |
LPO & LHA
Outputs |
Regions |
LPO & LHA
Inputs |
|||
| LPO | LHAa | LPO | LHAa | |||
|
| ||||||
| Hypothalamus (interoceptive inputs to periventricular zone, PVZ) ↓ |
4 | 5 | DMH | 3 | 1 | |
| 6 | 4 | LHAjd | 2 | 3 | ||
| 6 | 6 | LHAs | 1 | 3 | ||
| 2 | 4 | PMd (dm) | 0 | 1 | ||
|
| ||||||
| Unconditioned behavioral responses to interoceptive threat | ← Brainstem | 5 | 6 | PAGl | 3 | 3 |
| 1 | 2 | PAGdm | 2 | 1 | ||
Table 3.
Comparison of LPO and LHAa connections with other gray matter regions and circuits identified in three models of learned (conditioned) defensive behavioral responses relating to three different categories of threat stimuli: predator, social, and painful (Canteras & Graeff, 2014). For each stimulus category, three separate columns associated with the model list (from left to right): 1) stimuli and responses, 2) major brain divisions involved, 3) gray matter regions involved. Arrows in the first two columns indicate direction of information flow. Two columns on either side of the Regions column list LPO and LHAa output and input connections with the associated regions. LPO and LHAa connection weights are highest binned values following a 1–7 / weakest-strongest color scale (see Supporting Information 1 and 2, and text for further details). Note that for the dorsal premammillary nucleus (PMd), a distinction is made in the behavioral model between ventrolateral and dorsomedial subdivisions; however, no clear distinction in this regard was apparent in LPO and LHAa PMd connections, therefore the same PMd connection value was applied to both. Additionally, for divisions identified in the behavioral model that contain more than one gray matter region (that are listed in the Regions column), the highest LPO and LHAa connection weights across all constituent regions was selected, which applies to the following divisions: Septohippocampal system (SHS) that includes the septal nuclei and the hippocampal formation; anterior hypothalamic nucleus (AHN), dorsomedial hypothalamic nucleus (DMH), and central amygdalar nucleus (CEA). Additional abbreviations: BLA, basolateral amygdalar nucleus; BMAp, basomedial amygdalar nucleus posterior part; LA, lateral amygdalar nucleus; LHAjd, lateral hypothalamic area juxtadorsomedial region; LHAs, lateral hypothalamic area suprafornical region; MEAad, medial amygdalar nucleus anterodorsal part; MEApd, medial amygdalar nucleus posterodorsal part; MEApv, medial amygdalar nucleus posteroventral part; MPO, medial preoptic area; PAGdl, periaqueductal gray dorsolateral column; PAGdm, periaqueductal gray dorsomedial column; PAGl, periaqueductal gray lateral column; PAGvl, periaqueductal gray ventrolateral column; PMv, ventral premammillary nucleus; VMHdm, ventromedial hypothalamic nucleus dorsomedial part; VMHvl, ventromedial hypothalamic nucleus ventrolateral part.
| Neural circuits underlying learned (conditioned) responses to threat stimuli | ||||||
| Predator threat |
LPO & LHA
Outputs |
Regions |
LPO & LHA
Inputs |
|||
| LPO | LHAa | LPO | LHAa | |||
|
| ||||||
| Predatory contextual cues → | Septo-hippocampal system (SHS) |
7 | 7 | SHS | 7 | 7 |
| Amygdala ↓ | 0 | 0 | LA | 1 | 1 | |
| 3 | 2 | BMAp | 2 | 2 | ||
|
| ||||||
| Predator-responsive hypothalamic circuit ↓ | 4 | 3 | AHN | 2 | 2 | |
| 1 | 0 | VMHdm | 3 | 4 | ||
| 2 | 4 | PMd (vl) | 0 | 1 | ||
|
| ||||||
| Conditioned behavioral responses to predator threat | ← Brainstem | 2 | 2 | PAGdl | 1 | 1 |
|
| ||||||
| Social defeat |
LPO & LHA
Outputs |
Regions |
LPO & LHA
Inputs |
|||
| LPO | LHAa | LPO | LHAa | |||
|
| ||||||
| Contextual cues → |
Septo-hippocampal system (SHS) |
7 | 7 | SHS | 7 | 7 |
| Odor cues from an aggressive conspecific → | Amygdala ↓ | 3 | 3 | MEAad | 4 | 3 |
| 2 | 2 | MEApd | 1 | 1 | ||
|
| ||||||
| Conspecific-responsive hypothalamic circuit ↓ | 6 | 4 | LHAjd | 2 | 3 | |
| 6 | 6 | LHAs | 1 | 3 | ||
| 2 | 4 | PMd (dm) | 0 | 1 | ||
| 4 | 3 | MPO | 4 | 4 | ||
| 1 | 3 | VMHvl | 3 | 3 | ||
| 2 | 2 | PMv | 2 | 4 | ||
|
| ||||||
| Conditioned behavioral responses to social threat | ← Brainstem | 1 | 2 | PAGdm | 2 | 1 |
|
| ||||||
| Painful stimulus |
LPO & LHA
Outputs |
Regions |
LPO & LHA
Inputs |
|||
| LPO | LHAa | LPO | LHAa | |||
|
| ||||||
| Contextual cues (previously paired with painful stimuli) → | Septo-hippocampal system (SHS) ↓ | 7 | 7 | SHS | 7 | 7 |
|
| ||||||
| ↑ Amygdala ↓ | 0 | 0 | LA | 1 | 1 | |
| 0 | 0 | BLA | 0 | 0 | ||
| 2 | 1 | CEA | 1 | 2 | ||
|
| ||||||
| Conditioned behavioral responses to painful stimulus | ← Brainstem | 4 | 2 | PAGvl | 1 | 2 |
In addition to a prominent indicated role for the LPO and LHAa in relation to defensive behaviors, a role for LPO and LHAa in aggressive and mating behaviors is also suggested by their connections. Although multiple neural circuits participate in the sensory-motor integration that is necessary for the control and expression of these and other complex behaviors, for the present discussion a central focus is provided by the ventromedial hypothalamic nucleus ventrolateral part (VMHvl) that has emerged as a critical node for control of both aggressive and mating behaviors (Hashikawa et al., 2017; Lin et al., 2011). Direct LPO and LHAa connections with the VMHvl are weak to moderate; however, substantial LPO and LHAa connections exist with regions that in turn connect with the VMHvl and that are implicated in aggressive and/or mating behavior. These include lateral septal nuclei (very strong LPO and LHAa connections), medial preoptic area (moderate LPO and LHAa connections), ventral premammillary nucleus (weak to moderate LPO and LHA connections), and medial amygdala (weak to moderate LPO and LHA connections) (Yamaguchi, 2021; Yamaguchi & Lin, 2018). Also noteworthy are moderate to strong LPO and LHAa connections with the LHA region juxtaposed to the VMH, identified in rat as the juxtaventromedial (LHAjv) region that has very strong bidirectional VMH connections (Hahn & Swanson, 2015).
Several additional substantial LPO and LHAa connections exist that may also have broad relevance to innate agonistic, mating, and other survival behaviors (in terms of motor control, physiological integration, and affect as suggested by the forebrain network top-level subsystem for the LPO and LHAa). These include intrahypothalamic LPO and LHAa connections to other LHA regions implicated in innate behavioral control whose connections are known (LHA subfornical (Goto et al., 2005), suprafornical (Hahn & Swanson, 2010), and juxtadorsomedial (Hahn & Swanson, 2012; Rangel et al., 2016) regions), as well as to LHA regions whose connections remain to be determined systematically (LHA dorsal and posterior regions). With regard to affective cognition, additional LPO and LHAa cerebral cortical connections of note include strong inputs from the cingulate region (infralimbic and dorsal peduncular areas), and anterior part of the cortical amygdala area (involved in visceral and olfaction-related sensorimotor processing). Thalamic connections of note include a moderate LPO connection to the anteroventral and mediodorsal thalamic nuclei (weaker from the LHAa) that are indicated to play a role in spatial navigation and learning (Mitchell & Chakraborty, 2013; Tsanov et al., 2011; van Groen et al., 2002), and a moderately strong LHAa connection to the paratenial nucleus (weaker from the LPO) that may contribute to behavioral guidance (Vertes et al., 2015). Lastly, strong LPO and LHAa outputs to three pontine regions are noted: to pontine reticular nucleus rostral part, pontine central gray, and nucleus incertus. Pontine reticular connections are implicated in control of motor output relating to agonistic and mating behaviors (Hashikawa et al., 2016), and the nucleus incertus is implicated in anxiety-related behavioral arousal (Banerjee et al., 2010; Cano et al., 2008; Goto et al., 2001; Smith et al., 2011).
Concluding remarks.
The numerous and widely distributed macroscale connections of the LPO and LHAa implicate them in a diverse array of functions relating to sensory-motor integration, with broad relevance to control of behaviors that are critical for an animal’s survival. Further dissection and determination of specific functional roles for these lateral hypothalamic regions will require higher scale and multiscale cell type analysis of their constituent neurons, using approaches such as those that were applied recently to the mouse primary motor cortex (Muñoz-Castañeda et al., 2020), and to neighboring regions of the preoptic area (Moffitt et al., 2018) and LHA (Wang et al., 2021).
Supplementary Material
Supporting Information 1. Data tables and a list of abbreviations for neuroanatomical terms for all figures in Microsoft Excel workbook (Excel) file format. Data worksheets are provided for retrograde and anterograde axonal tracing analysis of representative LPO (181221–04A) and LHAa (181221–04A) experiments; separate worksheets are included for analysis ipsilateral and contralateral to the side of axonal tracer injection sites. A table of workbook contents is provided on the first worksheet.
Supporting Information 2. Summary of LPO (a, b) and LHAa (c, d) macroconnections on a flatmap representation of the mouse brain (adapted from Hahn et al., 2021). The flatmaps are truncated at the spinal cord and do not include the retina. A mini brain flatmap (center inset) shows the spinal cord and is color-coded for the other major brain divisions included in the larger flatmaps [key at bottom]). A 7-point red-pink color scale (key at bottom) represents the connection weight for positive data (present connections); negative data (absent connections) are indicated by dark gray. LPO and LHAa are colored bright green on their respective connection flatmaps. Data are shown in separate layers of the PDF file for highest and average (mean) connection weights (the latter also represented in Figure 6) for each gray matter region across their analyzed atlas levels (shown in Figure 4 and reported in Supporting Information 1). Connection weight values were recorded separately for connections ipsilateral or contralateral to unilateral tracer injections (all performed on the right side of the brain). For output connections (a, c; anterograde tracing data), analysis was performed using the same 7-point scale; for input connections (b, d; retrograde tracing data), initial count data was assigned to 1 of 7 bins, according to the number of counted labeled neurons (see Methods and Table 1 for additional details). The diagrams were created with illustration software (Adobe Illustrator (Ai), version 25), and the Ai file was then saved in Adobe’s portable document format (PDF) with compatibility for version 8.0 and later of Adobe Acrobat or Adobe Reader. The PDF file retains the properties of the original Ai file when it is opened in Ai software.
Supporting Information 3. Distribution of C57BL/6J mouse brain molecular markers (in situ hybridization, ISH) for excitatory (a, e, g, k: Slc17a6 for VGLUT2, exp. #7172496) and inhibitory (b, f, h, l: Slc32a1 for VGAT, exp. #1098) neurons shown in coronal section for a mid rostrocaudal level of the LPO (a-f) and LHAa (g-l). The ISH data are represented in brightfield images (top row: a, b, g, h), and as heatmaps (bottom row: e, f, k, l), with corresponding Nissl staining (middle row: c, d, i, j). Fiducial labeling and approximate divisional borders (dashed lines) are based on the Nissl staining. Data and images retrieved from the open access Allen Brain Atlas data portal (for these and additional details see: https://mouse.brain-map.org/). Additional abbreviations: aco, anterior commissure; AHN, anterior hypothalamic nucleus; fx, fornix; MEA, medial amygdalar nucleus; MPN, medial preoptic nucleus; MPO, medial preoptic area; NDB, nucleus of diagonal band; och, optic chiasm; opt, optic tract; PVH, paraventricular hypothalamic nucleus; RCH, retrochiasmatic area; SCH, suprachiasmatic nucleus. Scale bars are 500 μm.
Acknowledgements
For technical assistance with some of the axonal tracing experiments and histology we thank Marlene Becerra. This work was supported by National Institutes of Health grants: (U01)-MH114829 (HWD), (R01)-MH094360 (HWD), (RF1)-MH114112 (HWD); (U19)-MH114821 (J Huang/P Arlotta).
Footnotes
Data sharing: Data tables of primary data that formed the basis of the analysis are provided as Supporting Information.
References
- Andersen P, Morris R, Amaral D, Bliss T, & O’Keefe J (2007). The Hippocampus Book (1 ed.): Oxford University Press. [Google Scholar]
- Banerjee A, Shen PJ, Ma S, Bathgate RA, & Gundlach AL (2010). Swim stress excitation of nucleus incertus and rapid induction of relaxin-3 expression via CRF1 activation. Neuropharmacology, 58(1), 145–155. doi:S0028–3908(09)00176–2 [pii]; 10.1016/j.neuropharm.2009.06.019 [doi] [DOI] [PubMed] [Google Scholar]
- Barker DJ, Miranda-Barrientos J, Zhang S, Root DH, Wang HL, Liu B, Calipari ES, & Morales M (2017). Lateral Preoptic Control of the Lateral Habenula through Convergent Glutamate and GABA Transmission. Cell Rep, 21(7), 1757–1769. doi: 10.1016/j.celrep.2017.10.066 [DOI] [PMC free article] [PubMed] [Google Scholar]
- Benavidez NL, Bienkowski MS, Zhu M, Garcia LH, Fayzullina M, Gao L, Bowman I, Gou L, Khanjani N, Cotter KR, Korobkova L, Becerra M, Cao C, Song MY, Zhang B, Yamashita S, Tugangui AJ, Zingg B, Rose K, Lo D, Foster NN, Boesen T, Mun HS, Aquino S, Wickersham IR, Ascoli GA, Hintiryan H, & Dong HW (2021). Organization of the inputs and outputs of the mouse superior colliculus. Nat Commun, 12(1), 4004. doi: 10.1038/s41467-021-24241-2 [DOI] [PMC free article] [PubMed] [Google Scholar]
- Berridge KC, & Kringelbach ML (2015). Pleasure systems in the brain. Neuron, 86(3), 646–664. doi: 10.1016/j.neuron.2015.02.018 [DOI] [PMC free article] [PubMed] [Google Scholar]
- Bienkowski MS, Benavidez NL, Wu K, Gou L, Becerra M, & Dong HW (2019). Extrastriate connectivity of the mouse dorsal lateral geniculate thalamic nucleus. J Comp Neurol, 527(9), 1419–1442. doi: 10.1002/cne.24627 [DOI] [PMC free article] [PubMed] [Google Scholar]
- Bienkowski MS, Bowman I, Song MY, Gou L, Ard T, Cotter K, Zhu M, Benavidez NL, Yamashita S, Abu-Jaber J, Azam S, Lo D, Foster NN, Hintiryan H, & Dong HW (2018). Integration of gene expression and brain-wide connectivity reveals the multiscale organization of mouse hippocampal networks. Nat Neurosci, 21(11), 1628–1643. doi: 10.1038/s41593-018-0241-y [DOI] [PMC free article] [PubMed] [Google Scholar]
- Cano G, Mochizuki T, & Saper CB (2008). Neural circuitry of stress-induced insomnia in rats. J.Neurosci, 28(40), 10167–10184. doi:28/40/10167 [pii]; 10.1523/JNEUROSCI.1809-08.2008 [doi] [DOI] [PMC free article] [PubMed] [Google Scholar]
- Canteras NS, & Graeff FG (2014). Executive and modulatory neural circuits of defensive reactions: Implications for panic disorder. Neurosci Biobehav Rev, 46P3, 352–364. doi: 10.1016/j.neubiorev.2014.03.020 [DOI] [PubMed] [Google Scholar]
- Canteras NS, Ribeiro-Barbosa ER, Goto M, Cipolla-Neto J, & Swanson LW (2011). The retinohypothalamic tract: comparison of axonal projection patterns from four major targets. Brain Res.Rev, 65(2), 150–183. doi:S0165–0173(10)00108–6 [pii]; 10.1016/j.brainresrev.2010.09.006 [doi] [DOI] [PubMed] [Google Scholar]
- Canteras NS, Simerly RB, & Swanson LW (1994). Organization of projections from the ventromedial nucleus of the hypothalamus: a Phaseolus vulgaris-leucoagglutinin study in the rat. J.Comp Neurol, 348(1), 41–79. doi: 10.1002/cne.903480103 [doi] [DOI] [PubMed] [Google Scholar]
- Canteras NS, Simerly RB, & Swanson LW (1995). Organization of Projections from the Medial Nucleus of the Amygdala - a Phal Study in the Rat. Journal of Comparative Neurology, 360(2), 213–245. doi:DOI 10.1002/cne.903600203 [DOI] [PubMed] [Google Scholar]
- Canteras NS, & Swanson LW (1992). Projections of the ventral subiculum to the amygdala, septum, and hypothalamus: a PHAL anterograde tract-tracing study in the rat. J Comp Neurol, 324(2), 180–194. doi: 10.1002/cne.903240204 [DOI] [PubMed] [Google Scholar]
- Cenquizca LA, & Swanson LW (2006). Analysis of direct hippocampal cortical field CA1 axonal projections to diencephalon in the rat. J Comp Neurol, 497(1), 101–114. [DOI] [PMC free article] [PubMed] [Google Scholar]
- Cenquizca LA, & Swanson LW (2007). Spatial organization of direct hippocampal field CA1 axonal projections to the rest of the cerebral cortex. Brain Res.Rev, 56(1), 1–26. [DOI] [PMC free article] [PubMed] [Google Scholar]
- Dong HW (2007). The Allen Reference Atlas, (Book + CD-ROM): A Digital Color Brain Atlas of the C57BL/6J Male Mouse. Hoboken, USA: Wiley. [Google Scholar]
- Dong HW, & Swanson LW (2004). Projections from bed nuclei of the stria terminalis, posterior division: implications for cerebral hemisphere regulation of defensive and reproductive behaviors. J Comp Neurol, 471(4), 396–433. doi: 10.1002/cne.20002 [DOI] [PubMed] [Google Scholar]
- Foster NN, Barry J, Korobkova L, Garcia L, Gao L, Becerra M, Sherafat Y, Peng B, Li X, Choi JH, Gou L, Zingg B, Azam S, Lo D, Khanjani N, Zhang B, Stanis J, Bowman I, Cotter K, Cao C, Yamashita S, Tugangui A, Li A, Jiang T, Jia X, Feng Z, Aquino S, Mun HS, Zhu M, Santarelli A, Benavidez NL, Song M, Dan G, Fayzullina M, Ustrell S, Boesen T, Johnson DL, Xu H, Bienkowski MS, Yang XW, Gong H, Levine MS, Wickersham I, Luo Q, Hahn JD, Lim BK, Zhang LI, Cepeda C, Hintiryan H, & Dong HW (2021). The mouse cortico-basal ganglia-thalamic network. Nature, 598(7879), 188–194. doi: 10.1038/s41586-021-03993-3 [DOI] [PMC free article] [PubMed] [Google Scholar]
- Gaykema RP, van der Kuil J, Hersh LB, & Luiten PG (1991). Patterns of direct projections from the hippocampus to the medial septum-diagonal band complex: anterograde tracing with Phaseolus vulgaris leucoagglutinin combined with immunohistochemistry of choline acetyltransferase. Neuroscience, 43(2–3), 349–360. doi: 10.1016/0306-4522(91)90299-4 [DOI] [PubMed] [Google Scholar]
- Goto M, Canteras NS, Burns G, & Swanson LW (2005). Projections from the subfornical region of the lateral hypothalamic area. J Comp Neurol, 493(3), 412–438. [DOI] [PMC free article] [PubMed] [Google Scholar]
- Goto M, Swanson LW, & Canteras NS (2001). Connections of the nucleus incertus. J.Comp Neurol, 438(1), 86–122. [DOI] [PubMed] [Google Scholar]
- Gu G, Cornea A, & Simerly RB (2003). Sexual differentiation of projections from the principal nucleus of the bed nuclei of the stria terminalis. J Comp Neurol, 460(4), 542–562. doi: 10.1002/cne.10677 [DOI] [PubMed] [Google Scholar]
- Hahn JD, Sporns O, Watts AG, & Swanson LW (2019). Macroscale intrinsic network architecture of the hypothalamus. Proc Natl Acad Sci U S A, 116(16), 8018–8027. doi: 10.1073/pnas.1819448116 [DOI] [PMC free article] [PubMed] [Google Scholar]
- Hahn JD, & Swanson LW (2010). Distinct patterns of neuronal inputs and outputs of the juxtaparaventricular and suprafornical regions of the lateral hypothalamic area in the male rat. Brain Research Reviews, 64(1), 14–103. doi: 10.1016/j.brainresrev.2010.02.002 [DOI] [PMC free article] [PubMed] [Google Scholar]
- Hahn JD, & Swanson LW (2012). Connections of the lateral hypothalamic area juxtadorsomedial region in the male rat. J Comp Neurol, 520(9), 1831–1890. doi: 10.1002/cne.23064 [DOI] [PMC free article] [PubMed] [Google Scholar]
- Hahn JD, & Swanson LW (2015). Connections of the juxtaventromedial region of the lateral hypothalamic area in the male rat. Front Syst Neurosci, 9(66), 66. doi: 10.3389/fnsys.2015.00066 [DOI] [PMC free article] [PubMed] [Google Scholar]
- Hahn JD, Swanson LW, Bowman I, Foster NN, Zingg B, Bienkowski MS, Hintiryan H, & Dong HW (2021). An open access mouse brain flatmap and upgraded rat and human brain flatmaps based on current reference atlases. J Comp Neurol, 529(3), 576–594. doi: 10.1002/cne.24966 [DOI] [PMC free article] [PubMed] [Google Scholar]
- Hashikawa K, Hashikawa Y, Falkner A, & Lin D (2016). The neural circuits of mating and fighting in male mice. Curr Opin Neurobiol, 38, 27–37. doi: 10.1016/j.conb.2016.01.006 [DOI] [PMC free article] [PubMed] [Google Scholar]
- Hashikawa Y, Hashikawa K, Falkner AL, & Lin D (2017). Ventromedial Hypothalamus and the Generation of Aggression. Front Syst Neurosci, 11, 94. doi: 10.3389/fnsys.2017.00094 [DOI] [PMC free article] [PubMed] [Google Scholar]
- Herkenham M, & Nauta WJ (1977). Afferent connections of the habenular nuclei in the rat. A horseradish peroxidase study, with a note on the fiber-of-passage problem. J Comp Neurol, 173(1), 123–146. [DOI] [PubMed] [Google Scholar]
- Hintiryan H, Bowman I, Johnson DL, Korobkova L, Zhu M, Khanjani N, Gou L, Gao L, Yamashita S, Bienkowski MS, Garcia L, Foster NN, Benavidez NL, Song MY, Lo D, Cotter KR, Becerra M, Aquino S, Cao C, Cabeen RP, Stanis J, Fayzullina M, Ustrell SA, Boesen T, Tugangui AJ, Zhang ZG, Peng B, Fanselow MS, Golshani P, Hahn JD, Wickersham IR, Ascoli GA, Zhang LI, & Dong HW (2021). Connectivity characterization of the mouse basolateral amygdalar complex. Nat Commun, 12(1), 2859. doi: 10.1038/s41467-021-22915-5 [DOI] [PMC free article] [PubMed] [Google Scholar]
- Hintiryan H, Foster NN, Bowman I, Bay M, Song MY, Gou L, Yamashita S, Bienkowski MS, Zingg B, Zhu M, Yang XW, Shih JC, Toga AW, & Dong HW (2016). The mouse cortico-striatal projectome. Nat Neurosci, 19(8), 1100–1114. doi: 10.1038/nn.4332 [DOI] [PMC free article] [PubMed] [Google Scholar]
- Hintiryan H, Gou L, Zingg B, Yamashita S, Lyden HM, Song MY, Grewal AK, Zhang X, Toga AW, & Dong HW (2012). Comprehensive connectivity of the mouse main olfactory bulb: analysis and online digital atlas. Front Neuroanat, 6, 30. doi: 10.3389/fnana.2012.00030 [DOI] [PMC free article] [PubMed] [Google Scholar]
- Hsu TM, Hahn JD, Konanur VR, Noble EE, Suarez AN, Thai J, Nakamoto EM, & Kanoski SE (2015). Hippocampus ghrelin signaling mediates appetite through lateral hypothalamic orexin pathways. Elife, 4. doi: 10.7554/eLife.11190 [DOI] [PMC free article] [PubMed] [Google Scholar]
- Hu H, Cui Y, & Yang Y (2020). Circuits and functions of the lateral habenula in health and in disease. Nat Rev Neurosci, 21(5), 277–295. doi: 10.1038/s41583-020-0292-4 [DOI] [PubMed] [Google Scholar]
- Kiss J, Patel AJ, Baimbridge KG, & Freund TF (1990a). Topographical Localization of Neurons Containing Parvalbumin and Choline-Acetyltransferase in the Medial Septum Diagonal Band Region of the Rat. Neuroscience, 36(1), 61–72. doi:Doi 10.1016/0306-4522(90)90351-4 [DOI] [PubMed] [Google Scholar]
- Kiss J, Patel AJ, & Freund TF (1990b). Distribution of Septohippocampal Neurons Containing Parvalbumin or Choline-Acetyltransferase in the Rat-Brain. Journal of Comparative Neurology, 298(3), 362–372. doi:DOI 10.1002/cne.902980308 [DOI] [PubMed] [Google Scholar]
- Lin D, Boyle MP, Dollar P, Lee H, Lein ES, Perona P, & Anderson DJ (2011). Functional identification of an aggression locus in the mouse hypothalamus. Nature, 470(7333), 221–226. doi: 10.1038/nature09736 [DOI] [PMC free article] [PubMed] [Google Scholar]
- Luskin MB, & Price JL (1983). The topographic organization of associational fibers of the olfactory system in the rat, including centrifugal fibers to the olfactory bulb. J Comp Neurol, 216(3), 264–291. doi: 10.1002/cne.902160305 [DOI] [PubMed] [Google Scholar]
- Mitchell AS, & Chakraborty S (2013). What does the mediodorsal thalamus do? Front Syst Neurosci, 7, 37. doi: 10.3389/fnsys.2013.00037 [DOI] [PMC free article] [PubMed] [Google Scholar]
- Moffitt JR, Bambah-Mukku D, Eichhorn SW, Vaughn E, Shekhar K, Perez JD, Rubinstein ND, Hao J, Regev A, Dulac C, & Zhuang X (2018). Molecular, spatial, and functional single-cell profiling of the hypothalamic preoptic region. Science, 362(6416). doi: 10.1126/science.aau5324 [DOI] [PMC free article] [PubMed] [Google Scholar]
- Morales M, & Margolis EB (2017). Ventral tegmental area: cellular heterogeneity, connectivity and behaviour. Nat Rev Neurosci, 18(2), 73–85. doi: 10.1038/nrn.2016.165 [DOI] [PubMed] [Google Scholar]
- Munoz-Castaneda R, Zingg B, Matho KS, Chen X, Wang Q, Foster NN, Li A, Narasimhan A, Hirokawa KE, Huo B, Bannerjee S, Korobkova L, Park CS, Park YG, Bienkowski MS, Chon U, Wheeler DW, Li X, Wang Y, Naeemi M, Xie P, Liu L, Kelly K, An X, Attili SM, Bowman I, Bludova A, Cetin A, Ding L, Drewes R, D’Orazi F, Elowsky C, Fischer S, Galbavy W, Gao L, Gillis J, Groblewski PA, Gou L, Hahn JD, Hatfield JT, Hintiryan H, Huang JJ, Kondo H, Kuang X, Lesnar P, Li X, Li Y, Lin M, Lo D, Mizrachi J, Mok S, Nicovich PR, Palaniswamy R, Palmer J, Qi X, Shen E, Sun YC, Tao HW, Wakemen W, Wang Y, Yao S, Yuan J, Zhan H, Zhu M, Ng L, Zhang LI, Lim BK, Hawrylycz M, Gong H, Gee JC, Kim Y, Chung K, Yang XW, Peng H, Luo Q, Mitra PP, Zador AM, Zeng H, Ascoli GA, Josh Huang Z, Osten P, Harris JA, & Dong HW (2021). Cellular anatomy of the mouse primary motor cortex. Nature, 598(7879), 159–166. doi: 10.1038/s41586-021-03970-w [DOI] [PMC free article] [PubMed] [Google Scholar]
- Muñoz-Castañeda R, Zingg B, Matho KS, Wang Q, Chen X, Foster NN, Narasimhan A, Li A, Hirokawa KE, Huo B, Bannerjee S, Korobkova L, Park CS, Park Y-G, Bienkowski MS, Chon U, Wheeler DW, Li X, Wang Y, Kelly K, An X, Attili SM, Bowman I, Bludova A, Cetin A, Ding L, Drewes R, D’Orazi F, Elowsky C, Fischer S, Galbavy W, Gao L, Gillis J, Groblewski PA, Gou L, Hahn JD, Hatfield JT, Hintiryan H, Huang J, Kondo H, Kuang X, Lesnar P, Li X, Li Y, Lin M, Liu L, Lo D, Mizrachi J, Mok S, Naeemi M, Nicovich PR, Palaniswamy R, Palmer J, Qi X, Shen E, Sun Y-C, Tao H, Wakemen W, Wang Y, Xie P, Yao S, Yuan J, Zhu M, Ng L, Zhang LI, Lim BK, Hawrylycz M, Gong H, Gee JC, Kim Y, Peng H, Chuang K, Yang XW, Luo Q, Mitra PP, Zador AM, Zeng H, Ascoli GA, Huang ZJ, Osten P, Harris JA, & Dong H-W (2020). Cellular Anatomy of the Mouse Primary Motor Cortex. bioRxiv, 2020.2010.2002.323154. doi: 10.1101/2020.10.02.323154 [DOI] [PMC free article] [PubMed] [Google Scholar]
- Nauta WJH, & Haymaker W (1969). Hypothalamic Nuclei and Fiber Connections. In Haymaker W, Anderson E, & Nauta WJH (Eds.), The Hypothalamus (pp. 136–209). Illinois: Charles C Thomas. (Reprinted from: Not in File). [Google Scholar]
- Noble EE, Hahn JD, Konanur VR, Hsu TM, Page SJ, Cortella AM, Liu CM, Song MY, Suarez AN, Szujewski CC, Rider D, Clarke JE, Darvas M, Appleyard SM, & Kanoski SE (2018). Control of Feeding Behavior by Cerebral Ventricular Volume Transmission of Melanin-Concentrating Hormone. Cell Metab, 28(1), 55–68 e57. doi: 10.1016/j.cmet.2018.05.001 [DOI] [PMC free article] [PubMed] [Google Scholar]
- Nunez A, & Buno W (2021). The Theta Rhythm of the Hippocampus: From Neuronal and Circuit Mechanisms to Behavior. Front Cell Neurosci, 15, 649262. doi: 10.3389/fncel.2021.649262 [DOI] [PMC free article] [PubMed] [Google Scholar]
- Pardo-Bellver C, Cadiz-Moretti B, Novejarque A, Martinez-Garcia F, & Lanuza E (2012). Differential efferent projections of the anterior, posteroventral, and posterodorsal subdivisions of the medial amygdala in mice. Front Neuroanat, 6, 33. doi: 10.3389/fnana.2012.00033 [DOI] [PMC free article] [PubMed] [Google Scholar]
- Rangel MJ Jr., Baldo MV, Canteras NS, & Hahn JD (2016). Evidence of a Role for the Lateral Hypothalamic Area Juxtadorsomedial Region (LHAjd) in Defensive Behaviors Associated with Social Defeat. Front Syst Neurosci, 10, 92. doi: 10.3389/fnsys.2016.00092 [DOI] [PMC free article] [PubMed] [Google Scholar]
- Risold PY, & Swanson LW (1997). Connections of the rat lateral septal complex. Brain Res.Brain Res.Rev, 24(2–3), 115–195. [DOI] [PubMed] [Google Scholar]
- Risold PY, Thompson RH, & Swanson LW (1997). The structural organization of connections between hypothalamus and cerebral cortex. Brain Res.Brain Res.Rev, 24(2–3), 197–254. [DOI] [PubMed] [Google Scholar]
- Roland JJ, Stewart AL, Janke KL, Gielow MR, Kostek JA, Savage LM, Servatius RJ, & Pang KC (2014). Medial septum-diagonal band of Broca (MSDB) GABAergic regulation of hippocampal acetylcholine efflux is dependent on cognitive demands. J Neurosci, 34(2), 506–514. doi: 10.1523/JNEUROSCI.2352-13.2014 [DOI] [PMC free article] [PubMed] [Google Scholar]
- Smith CM, Ryan PJ, Hosken IT, Ma S, & Gundlach AL (2011). Relaxin-3 systems in the brain--the first 10 years. J.Chem.Neuroanat, 42(4), 262–275. doi:S0891–0618(11)00050–0 [pii]; 10.1016/j.jchemneu.2011.05.013 [doi] [DOI] [PubMed] [Google Scholar]
- Swanson LW (1976). An autoradiographic study of the efferent connections of the preoptic region in the rat. J.Comp Neurol, 167(2), 227–256. [DOI] [PubMed] [Google Scholar]
- Swanson LW (2000). Cerebral hemisphere regulation of motivated behavior. Brain Res, 886(1–2), 113–164. doi: 10.1016/s0006-8993(00)02905-x [DOI] [PubMed] [Google Scholar]
- Swanson LW (2018). Brain maps 4.0-Structure of the rat brain: An open access atlas with global nervous system nomenclature ontology and flatmaps. J Comp Neurol, 526(6), 935–943. doi: 10.1002/cne.24381 [DOI] [PMC free article] [PubMed] [Google Scholar]
- Swanson LW, & Cowan WM (1979). The connections of the septal region in the rat. J.Comp Neurol, 186, 621–656. [DOI] [PubMed] [Google Scholar]
- Swanson LW, Hahn JD, & Sporns O (2020). Structure-function subsystem models of female and male forebrain networks integrating cognition, affect, behavior, and bodily functions. Proc Natl Acad Sci U S A, 117(49), 31470–31481. doi: 10.1073/pnas.2017733117 [DOI] [PMC free article] [PubMed] [Google Scholar]
- Thompson RH, & Swanson LW (2003). Structural characterization of a hypothalamic visceromotor pattern generator network. Brain Res.Brain Res.Rev, 41(2–3), 153–202. [DOI] [PubMed] [Google Scholar]
- Thompson RH, & Swanson LW (2010). Hypothesis-driven structural connectivity analysis supports network over hierarchical model of brain architecture. Proc.Natl.Acad.Sci.U.S.A, 107(34), 15235–15239. doi:1009112107 [pii]; 10.1073/pnas.1009112107 [doi] [DOI] [PMC free article] [PubMed] [Google Scholar]
- Tsanov M, Chah E, Reilly R, & O’Mara SM (2014). Respiratory cycle entrainment of septal neurons mediates the fast coupling of sniffing rate and hippocampal theta rhythm. Eur J Neurosci, 39(6), 957–974. doi: 10.1111/ejn.12449 [DOI] [PMC free article] [PubMed] [Google Scholar]
- Tsanov M, Chah E, Vann SD, Reilly RB, Erichsen JT, Aggleton JP, & O’Mara SM (2011). Theta-modulated head direction cells in the rat anterior thalamus. J Neurosci, 31(26), 9489–9502. doi: 10.1523/JNEUROSCI.0353-11.2011 [DOI] [PMC free article] [PubMed] [Google Scholar]
- Uschakov A, Gong H, McGinty D, & Szymusiak R (2007). Efferent projections from the median preoptic nucleus to sleep- and arousal-regulatory nuclei in the rat brain. Neuroscience, 150(1), 104–120. [DOI] [PMC free article] [PubMed] [Google Scholar]
- van Groen T, Kadish I, & Wyss JM (2002). The role of the laterodorsal nucleus of the thalamus in spatial learning and memory in the rat. Behav Brain Res, 136(2), 329–337. doi: 10.1016/s0166-4328(02)00199-7 [DOI] [PubMed] [Google Scholar]
- van Groen T, & Wyss JM (1990). Extrinsic projections from area CA1 of the rat hippocampus: olfactory, cortical, subcortical, and bilateral hippocampal formation projections. J.Comp Neurol, 302(3), 515–528. [DOI] [PubMed] [Google Scholar]
- Vertes RP, & Kocsis B (1997). Brainstem-diencephalo-septohippocampal systems controlling the theta rhythm of the hippocampus. Neuroscience, 81(4), 893–926. [DOI] [PubMed] [Google Scholar]
- Vertes RP, Linley SB, & Hoover WB (2015). Limbic circuitry of the midline thalamus. Neurosci Biobehav Rev, 54, 89–107. doi: 10.1016/j.neubiorev.2015.01.014 [DOI] [PMC free article] [PubMed] [Google Scholar]
- Wang Y, Eddison M, Fleishman G, Weigert M, Xu S, Wang T, Rokicki K, Goina C, Henry FE, Lemire AL, Schmidt U, Yang H, Svoboda K, Myers EW, Saalfeld S, Korff W, Sternson SM, & Tillberg PW (2021). EASI-FISH for thick tissue defines lateral hypothalamus spatio-molecular organization. Cell, 184(26), 6361–6377 e6324. doi: 10.1016/j.cell.2021.11.024 [DOI] [PubMed] [Google Scholar]
- Witter MP, Ostendorf RH, & Groenewegen HJ (1990). Heterogeneity in the Dorsal Subiculum of the Rat. Distinct Neuronal Zones Project to Different Cortical and Subcortical Targets. Eur.J.Neurosci, 2(8), 718–725. [DOI] [PubMed] [Google Scholar]
- Yamaguchi T (2021). Neural circuit mechanisms of sex and fighting in male mice. Neurosci Res. doi: 10.1016/j.neures.2021.06.005 [DOI] [PubMed] [Google Scholar]
- Yamaguchi T, & Lin D (2018). Functions of medial hypothalamic and mesolimbic dopamine circuitries in aggression. Curr Opin Behav Sci, 24, 104–112. doi: 10.1016/j.cobeha.2018.06.011 [DOI] [PMC free article] [PubMed] [Google Scholar]
- Zahm DS, & Root DH (2017). Review of the cytology and connections of the lateral habenula, an avatar of adaptive behaving. Pharmacol Biochem Behav, 162, 3–21. doi: 10.1016/j.pbb.2017.06.004 [DOI] [PMC free article] [PubMed] [Google Scholar]
- Zingg B, Chou XL, Zhang ZG, Mesik L, Liang F, Tao HW, & Zhang LI (2017). AAV-Mediated Anterograde Transsynaptic Tagging: Mapping Corticocollicular Input-Defined Neural Pathways for Defense Behaviors. Neuron, 93(1), 33–47. doi: 10.1016/j.neuron.2016.11.045 [DOI] [PMC free article] [PubMed] [Google Scholar]
- Zingg B, Dong HW, Tao HW, & Zhang LI (2018). Input-output organization of the mouse claustrum. J Comp Neurol, 526(15), 2428–2443. doi: 10.1002/cne.24502 [DOI] [PMC free article] [PubMed] [Google Scholar]
- Zingg B, Hintiryan H, Gou L, Song MY, Bay M, Bienkowski MS, Foster NN, Yamashita S, Bowman I, Toga AW, & Dong HW (2014). Neural networks of the mouse neocortex. Cell, 156(5), 1096–1111. doi: 10.1016/j.cell.2014.02.023 [DOI] [PMC free article] [PubMed] [Google Scholar]
Associated Data
This section collects any data citations, data availability statements, or supplementary materials included in this article.
Supplementary Materials
Supporting Information 1. Data tables and a list of abbreviations for neuroanatomical terms for all figures in Microsoft Excel workbook (Excel) file format. Data worksheets are provided for retrograde and anterograde axonal tracing analysis of representative LPO (181221–04A) and LHAa (181221–04A) experiments; separate worksheets are included for analysis ipsilateral and contralateral to the side of axonal tracer injection sites. A table of workbook contents is provided on the first worksheet.
Supporting Information 2. Summary of LPO (a, b) and LHAa (c, d) macroconnections on a flatmap representation of the mouse brain (adapted from Hahn et al., 2021). The flatmaps are truncated at the spinal cord and do not include the retina. A mini brain flatmap (center inset) shows the spinal cord and is color-coded for the other major brain divisions included in the larger flatmaps [key at bottom]). A 7-point red-pink color scale (key at bottom) represents the connection weight for positive data (present connections); negative data (absent connections) are indicated by dark gray. LPO and LHAa are colored bright green on their respective connection flatmaps. Data are shown in separate layers of the PDF file for highest and average (mean) connection weights (the latter also represented in Figure 6) for each gray matter region across their analyzed atlas levels (shown in Figure 4 and reported in Supporting Information 1). Connection weight values were recorded separately for connections ipsilateral or contralateral to unilateral tracer injections (all performed on the right side of the brain). For output connections (a, c; anterograde tracing data), analysis was performed using the same 7-point scale; for input connections (b, d; retrograde tracing data), initial count data was assigned to 1 of 7 bins, according to the number of counted labeled neurons (see Methods and Table 1 for additional details). The diagrams were created with illustration software (Adobe Illustrator (Ai), version 25), and the Ai file was then saved in Adobe’s portable document format (PDF) with compatibility for version 8.0 and later of Adobe Acrobat or Adobe Reader. The PDF file retains the properties of the original Ai file when it is opened in Ai software.
Supporting Information 3. Distribution of C57BL/6J mouse brain molecular markers (in situ hybridization, ISH) for excitatory (a, e, g, k: Slc17a6 for VGLUT2, exp. #7172496) and inhibitory (b, f, h, l: Slc32a1 for VGAT, exp. #1098) neurons shown in coronal section for a mid rostrocaudal level of the LPO (a-f) and LHAa (g-l). The ISH data are represented in brightfield images (top row: a, b, g, h), and as heatmaps (bottom row: e, f, k, l), with corresponding Nissl staining (middle row: c, d, i, j). Fiducial labeling and approximate divisional borders (dashed lines) are based on the Nissl staining. Data and images retrieved from the open access Allen Brain Atlas data portal (for these and additional details see: https://mouse.brain-map.org/). Additional abbreviations: aco, anterior commissure; AHN, anterior hypothalamic nucleus; fx, fornix; MEA, medial amygdalar nucleus; MPN, medial preoptic nucleus; MPO, medial preoptic area; NDB, nucleus of diagonal band; och, optic chiasm; opt, optic tract; PVH, paraventricular hypothalamic nucleus; RCH, retrochiasmatic area; SCH, suprachiasmatic nucleus. Scale bars are 500 μm.


