Structured Abstract:
Background:
Patients with paradoxical low-flow low-gradient aortic stenosis (pLFLG-AS) have high mortality and high degree of TAVR futility. Computed tomography (CT) enables accurate simultaneous right ventricular (RV) and parenchymal lung disease evaluation which may provide useful objective markers of AS severity, concomitant pulmonary comorbidities, and transcatheter aortic valve replacement (TAVR) improvement. However, the prevalence of RV dysfunction and its association with pulmonary disease in pLFLG-AS is unknown. The study objective was to test the hypothesis that pLFLG-AS patients undergoing TAVR have decreased RV function without significant parenchymal lung disease.
Methods:
Between August 2016 and March 2020, 194 consecutive AS patients completed high-resolution computed tomography (CT) imaging for TAVR evaluation. Subjects were stratified based on echocardiographic criteria as the study group, pLFLG (n=27), and two consecutive control groups: classic severe, normal-flow, high-gradient (n=27) and normal-flow, low-gradient (NFLG) (n=27) AS. Blinded biventricular function and lung parenchymal disease assessments were obtained by high-resolution CT imaging.
Results:
Patient demographics were similar between groups. pLFLG-AS had lower RV ejection fraction (49±10%) compared to both classic severe (58±7%, p<0.001) and NFLG AS (55±65%, p=0.02). There were no significant differences on lung emphysema (p=0.19), air fraction (p=0.58), and pulmonary disease presence (p=0.94) and severity (p=0.67) between groups.
Conclusion:
pLFLG-AS patients have lower RV ejection fraction, than classic severe and normal-flow low-gradient AS patients in the absence of significant parenchymal lung disease on CT imaging. These findings support the direct importance of RV function in the pathophysiology of aortic valve disease.
Keywords: Aortic stenosis, right ventricular function, cardiovascular imaging
Introduction:
Studies assessing the incidence and prognostic significance of right ventricular (RV) dysfunction by echocardiography in severe aortic stenosis (AS) have yielded contradictory results, limiting the clinical role of RV function evaluation in patients with AS1–5. However, volumetric evaluation is a more accurate and reproducible approach to measure RV volume and systolic function6. RV ejection fraction (RVEF) assessed on cardiac magnetic resonance in classic “severe” AS gradually increases and may help preserve left ventricular (LV) stroke volume7. Therefore, RV compensation may be important in AS pathophysiology. Further, volumetric assessment of RV dysfunction was proven prognostic in AS undergoing aortic valve replacement8. As a result, the volumetric assessments of RV size and systolic function may serve as a useful objective marker of AS severity and aid evaluation of pathophysiological compensation and clinical outcome.
Individuals with paradoxical low-flow, low-gradient AS (pLFLG-AS) have higher mortality compared to other forms of severe AS with preserved left ventricular ejection fraction (LVEF) and similar mortality compared to severe AS with reduced LVEF9–11. In addition, compared to other AS patients, pLFLG AS patients have higher incidence of comorbidities, including pulmonary hypertension and severe parenchymal lung disease12. pLFLG AS patients have higher rates of futile transcatheter aortic valve replacement (TAVR) treatment which may be due to RV dysfunction and lung disease13. However, the prevalence of volumetric RV dysfunction and whether it is associated with pulmonary disease is unknown in pLFLG-AS.
In pLFLG-AS, a lack of RV compensation may lead to an inability to maintain adequate stroke volume (SV) and gradient across the valve obstruction. This combination may partially explain the paradoxical phenotype characterized by low flow and low gradient with preserved LVEF. Therefore, we sought to test the hypothesis that RV function in pLFLG AS is reduced without significant differences in parenchymal pulmonary disease compared to other severe AS with preserved LVEF patients consisting of “classic” severe normal-flow, high-gradient (NFHG) AS and “discordant” normal-flow, low-gradient (NFLG) AS. We do so by evaluating CT-derived cardiac volumetric and pulmonary imaging in patients undergoing assessment for transcatheter aortic valve replacement (TAVR).
Methods:
A total of 194 consecutive patients with AS undergoing assessment for TAVR between August 2016 and March 2020 were reviewed with IRB-approved waiver of consent. The study selected patients with preserved LVEF and severe AS; therefore, patients were excluded if aortic valve area > 1.0 cm2 on echocardiography. Further, given the availability of volumetric imaging, patients were excluded if CT-derived LVEF was reduced (<45%) or if CT quality was inadequate for volumetric analysis. All patients included in the study underwent cardiac and chest CT imaging as part of the TAVR clinical evaluation14. Details are shown in Figure 1.
Figure 1: Flow diagram of study cohorts.
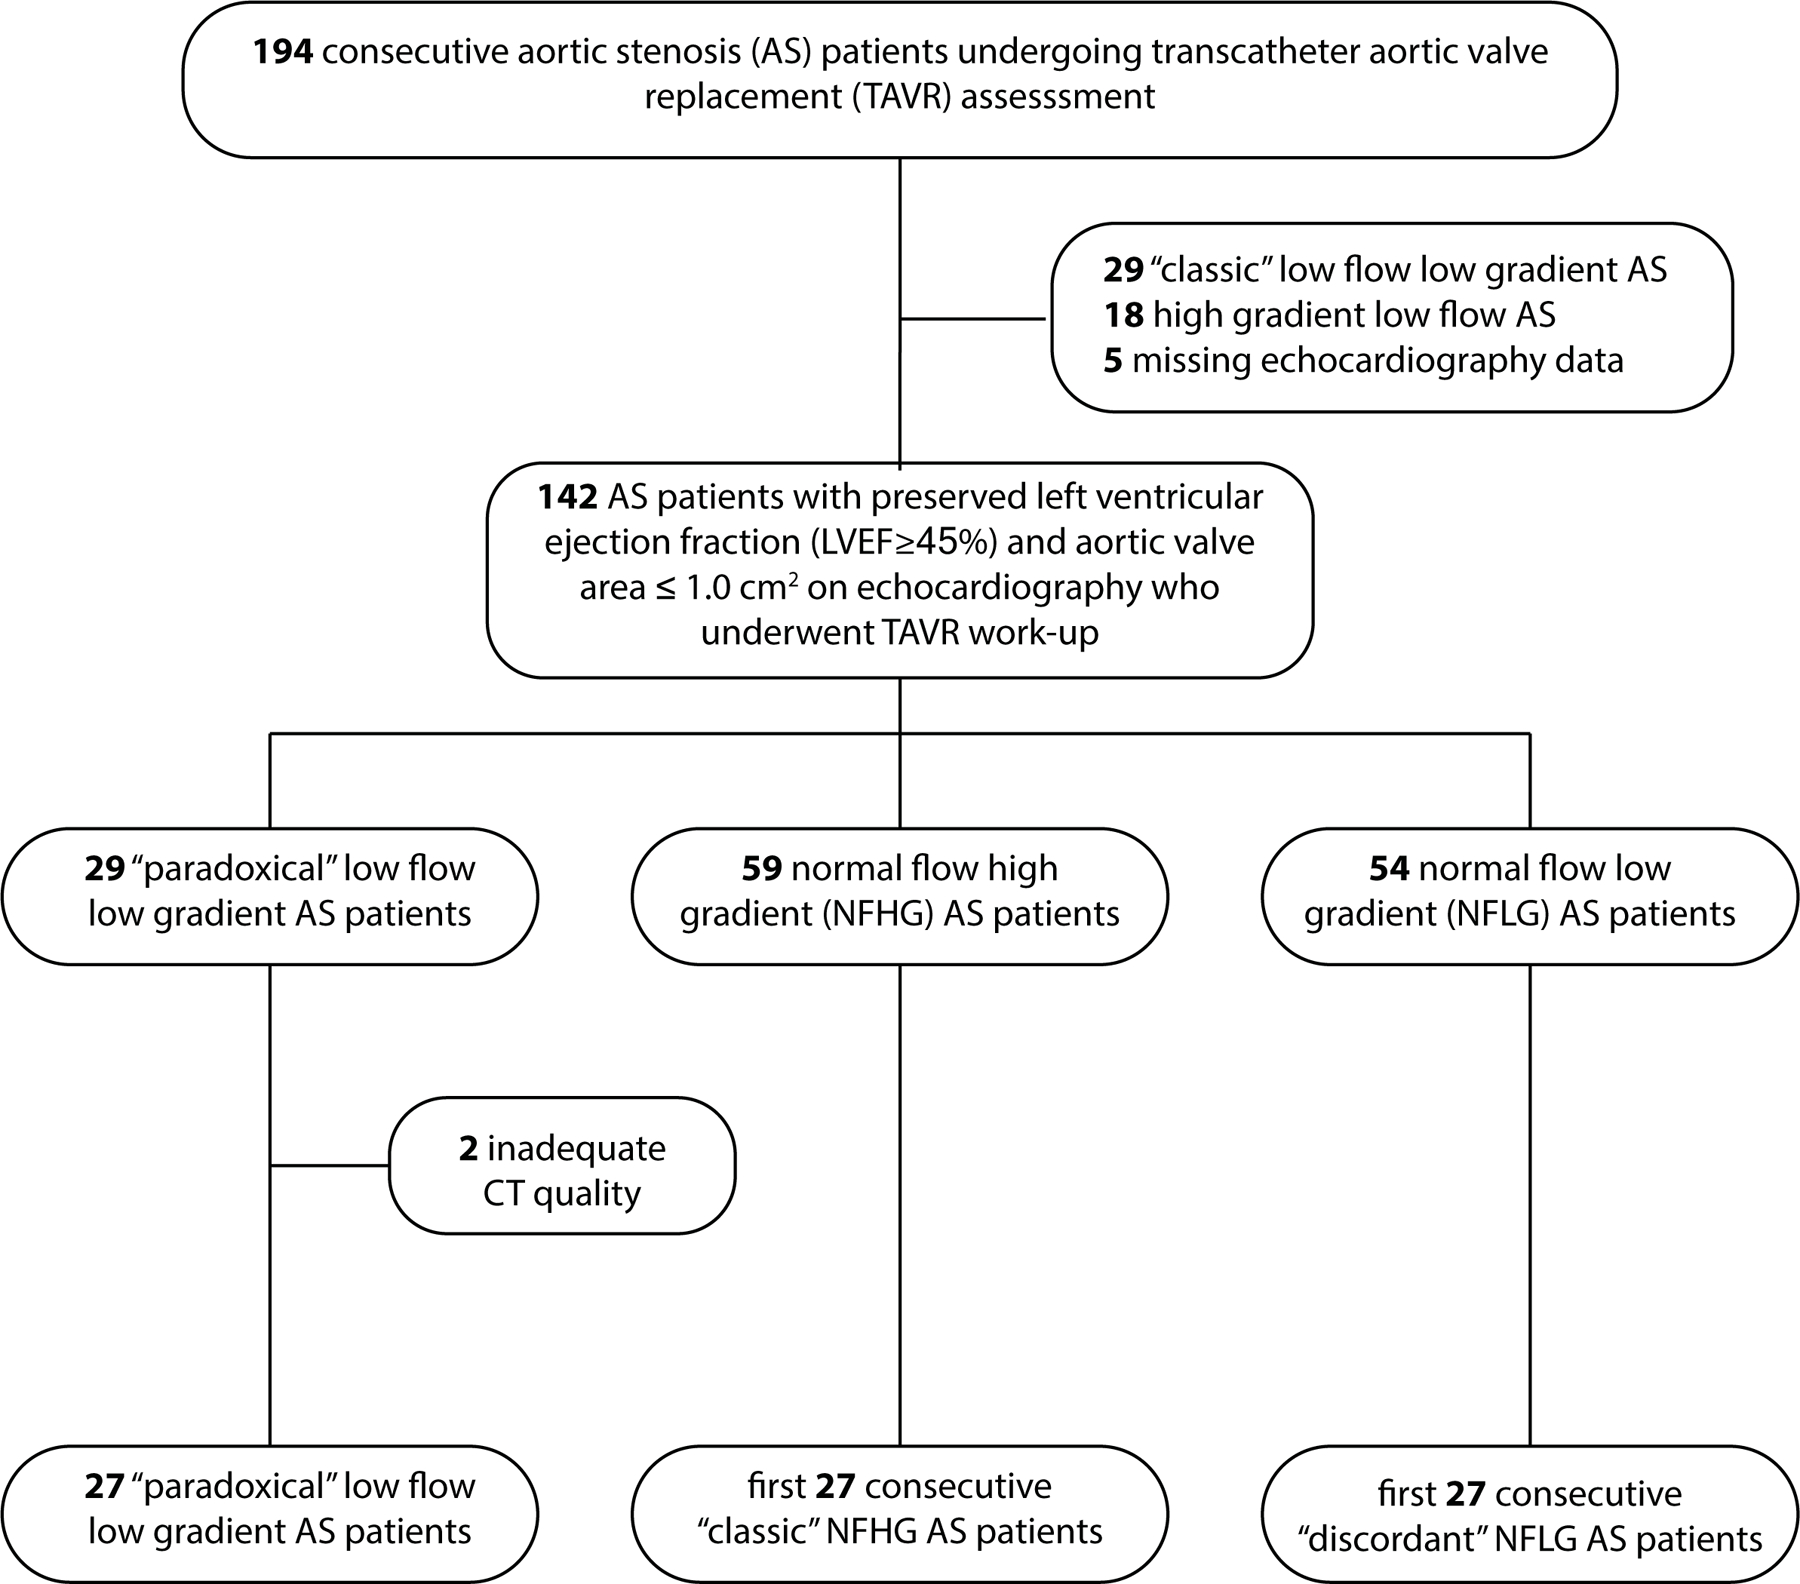
Consecutive patients undergoing TAVR evaluation were evaluated for enrollment based on clinical echocardiography findings. After identification of the “paradoxical” low flow low gradient cohort, two cohorts of the first 27 consecutive “classic” NFHG and “discordant” LGNF” cases were selected for comparison.
A total of 27 pLFLG AS subjects with preserved LVEF with cardiac and chest CT imaging available for analysis were identified. The presence of pLFLG was defined according to echocardiographic criteria15: aortic valve area (AVA) <1 cm2, mean gradient <40 mmHg, LVEF ≥50%, and SVi ≤35 mL/m2. Two control groups were identified: normal-flow, high-gradient (NFHG) with normal LVEF (“classic” severe AS; AVA <1 cm2, mean gradient >40 mmHg, LVEF ≥50%)15 and “discordant” normal-flow, low-gradient (NFLG) with preserved LVEF (AVA <1 cm2, mean gradient <40 mmHg, LVEF ≥50%, and SVi >35 mL/m2)15.
Patients underwent prospective, blinded assessment of LV and RV function via cardiac CT performed by a cardiologist expert certified in multi-modality imaging, review of chest CT radiological findings by two pulmonologists with adjudication by a third pulmonologist, and quantitative lung assessment for emphysema scoring.
All patients were imaged on wide-detector CT scanners with 16 cms of axial coverage. 74 patients were imaged on a Revolution scanner (GE Healthcare, Chicago IL) and 7 were imaged on a Aquilion One (Canon Medical, Tustin, CA). Cardiac assessment was performed on contrast-enhanced, ECG-gated axial images obtained for aortic valve evaluation while lung assessment was performed on contrast-enhanced helical acquisitions used to assess vascular access.
As described above, all patients had CT imaging that included both end-diastolic and end-systolic phases of the cardiac cycle as part of assessment for TAVR. A cardiovascular imaging certified expert (author M.R.) utilized CMR42 (Circle Inc, Calgary, Canada) to generate short-axis stacks of images at end-diastolic and end-systolic upon which contours of the RV and LV endocardial and epicardial boundaries were drawn. This enabled biventricular end-diastolic and end-systolic volumetry, measurement of stroke volume and ejection fraction, and assessment of RV and LV mass. An example of the short-axis reformatting and drawn contours is shown in Figure 2. Video 1 and Video 2 illustrate examples of patients with normal and decreased RV function.
Figure 2: Example of biventricular function analysis via cine CT.
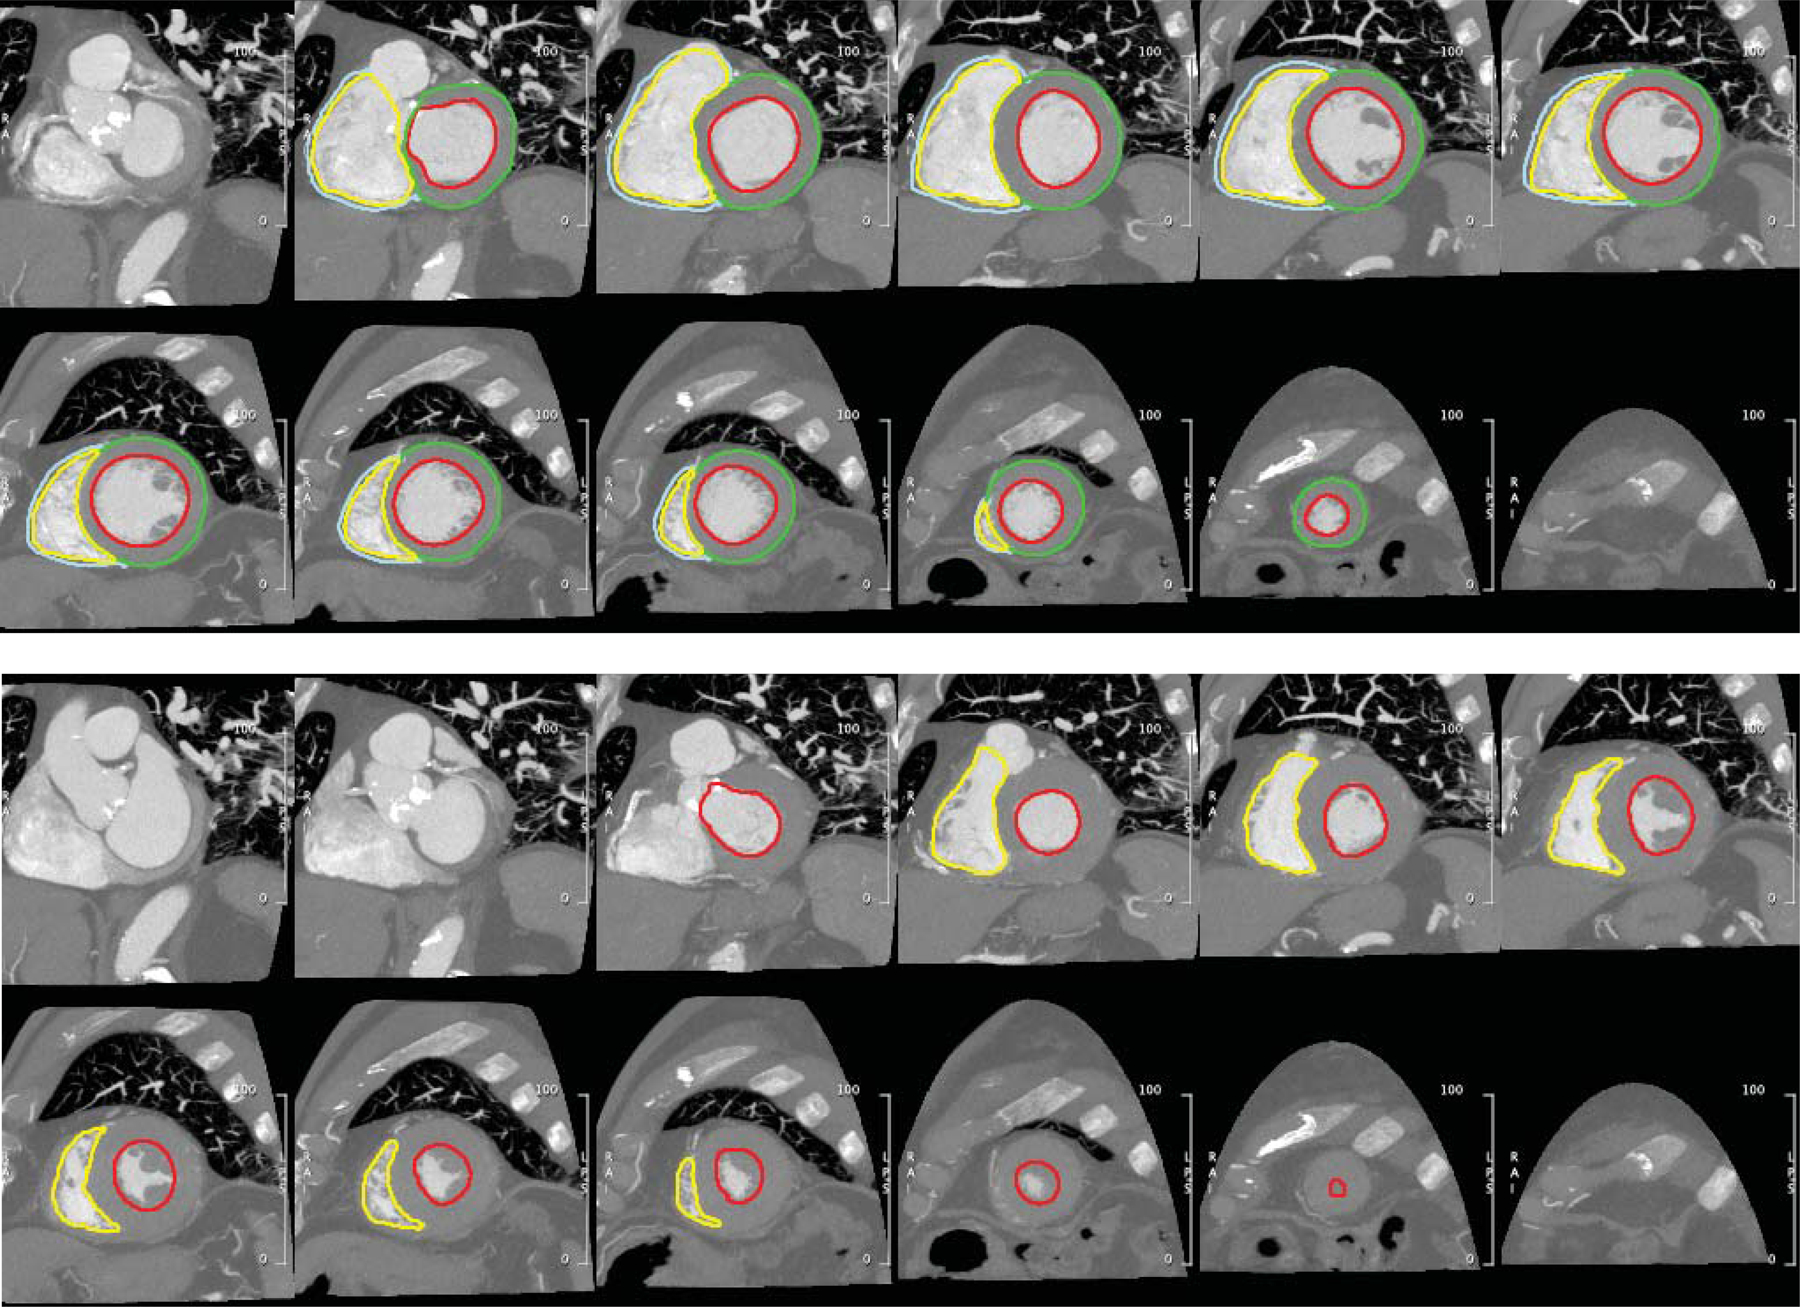
Endocardial LV (red) and RV (yellow) contours were annotated on short-axis reconstructions of the end-diastolic (top) and end-systolic (bottom) phases for volumetric evaluation of chamber size and function. Epicardial contours of the LV (green) and RV (cyan) in the end-diastolic phase enabled assessment of myocardial mass.
Video 1:
Normal RV function in a patient with high gradient aortic stenosis on CT. Short-axis reformat of volumetric ECG-gated cineCT enables biventricular assessment and illustrates normal RV function despite high gradient aortic stenosis.
Video 2:
RV dysfunction in a patient with paradoxical low-flow low-gradient aortic stenosis. Short-axis reformat of volumetric ECG-gated cineCT enables biventricular assessment and illustrates RV dysfunction in pLFLG.
Assessment of lung disease was obtained via use of the open-source Pulmonary Toolkit (https://github.com/tomdoel/pulmonarytoolkit) which is used to perform automated lung segmentation16 and quantifies metrics of hyperinflation and COPD17 which agree with histology18. In addition, radiological reports of the CT studies, blinded to AS group, were reviewed by two pulmonologists (with adjudication by a third pulmonologist) for tabulation of the presence of parenchymal, airway, vascular, or mixed pulmonary disease as well as grading of severity (mild, moderate, or severe).
Parameters were tested for normality via the Shapiro-Wilks test. Normal continuous variables are reported as mean ± standard deviation while non-normal variables are reported as median with first and third quartiles (Q1 and Q3, respectively). Categorical variables are reported as number (percentage). Differences between groups were evaluated via ANOVA, Kruskal-Wallis, or chi-squared testing as appropriate using Matlab (Mathworks, Natick, MA). Study data are available upon reasonable request. The patients or public were not involved in the design, conduct, reporting, or dissemination plans of our research.
Results:
Table 1 indicates the baseline demographic and echocardiographic characteristics of the three groups. No significant differences exist in patient demographics. Differences in echocardiography characteristics were concordant with the pathophysiology of the different AS groups. Namely, patients with “classic” severe AS had higher mean aortic gradient, LV ejection fraction, and LV stroke volume index than the two control groups. In addition, “discordant” AS patients had a higher LV stroke volume index (42 ± 6 mL/m2) than “paradoxical” LFLG (30 ± 6 mL/m2, p<0.001). No patient had >moderate mitral or aortic valve regurgitation. 1 patient (3.7%) in the “discordant” NFLG cohort and 2 (7.4%) in the “paradoxical” pLFLG cohort had >moderate regurgitation of the tricuspid valve. PASP in “paradoxical” LFLG (mean: 39, IQR 31 – 48 mmHg) trended (p=0.25) towards being higher than “classic” NFHG AS (mean: 33, IQR 26 – 43 mmHg) and “discordant” NFLG AS (mean: 33, IQR 22 – 42 mmHg).
Table 1: Patient characteristics.
Normal continuous variables are reported as mean ± standard deviation while non-normal variables are reported as median with first and third quartiles (Q1 and Q3, respectively). Categorical variables are reported as number (percentage).
| “Classic ” NFHG | “Discordant” NFLG | “Paradoxical” pLFLG | ||
|---|---|---|---|---|
| (n=27) | (n=27) | (n=27) | p-value | |
| Clinical Characteristics | ||||
| Age, years | 80 ± 9 | 81 ± 9 | 82 ± 14 | 0.73 |
| Gender, male | 15 (56%) | 13 (48%) | 16 (59%) | 0.71 |
| BSA, m2 | 1.9 (1.7 to 2) | 1.7 (1.6 to 1.9) | 1.9 (1.6 to 2) | 0.15 |
| BMI, kg/m2 | 26 ± 5 | 26 ± 5 | 28 ± 11 | 0.65 |
| Echocardiographic Characteristics | ||||
| Aortic Valve area, cm2 | 0.87 (0.72 to 0.91) | 0.8 (0.71 to 0.92) | 0.74 (0.65 to 0.86) | 0.13 |
| Aortic Mean Gradient, mmHg | 45 (41 to 55) †,‡ | 34 (28 to 37)* | 31 (23 to 35)* | <0.01 |
| LV Stroke Volume Index, mL/m2 | 50 ± 11†,‡ | 42 ± 6*,‡ | 30 ± 6*,† | <0.01 |
| LV Ejection Fraction, % | 69 ± 8† | 64 ± 9* | 64 ± 8 | 0.03 |
| Mitral Regurgitation, % >Moderate | 0 (0%) | 0 (0%) | 0 (0%) | 1.0 |
| Tricuspid Regurgitation, % >Moderate | 0 (0.0%) | 1 (3.7%) | 2 (7.4%) | 0.35 |
| Aortic Regurgitation, % >Moderate | 0 (0%) | 0 (0%) | 0 (0%) | 1.0 |
| PASP, mmHg | 33 (26 to 43) | 33 (22 to 42) | 39 (31 to 48) | 0.25 |
NFHG: normal-flow high-gradient aortic stenosis, NFLG: normal-flow low-gradient aortic stenosis, pLFLG: paradoxical low-flow low-gradient aortic stenosis
p<0.05 compared NFHG AS
p<0.05 compared to NFLG AS
p<0.05 compared to pLFLG AS
As shown in Table 2 and Figure 3, RVEF on cardiac CT was significantly (p<0.001) reduced in pLFLG AS (49 ± 10%) relative to both “classical” severe NFHG AS (58 ± 7%, p < 0.001) and “discordant” NFLG AS (55 ± 6%, p =0.02). This finding appears driven primarily by a trend towards decreased RV stroke volume (“classic”: 83 ± 20 mL, “discordant”: 84 ± 23 mL, “paradoxical”: 72 ± 20 mL, p=0.07).
Table 2: Cardiac and Lung Assessment on CT.
Normal continuous variables are reported as mean ± standard deviation while non-normal variables are reported as median with first and third quartiles (Q1 and Q3, respectively). Categorical variables are reported as number (percentage).
| “Classic” NFHG | “Discordant” NFLG | “Paradoxical” pLFLG | ||
|---|---|---|---|---|
| (n=27) | (n=27) | (n=27) | p-value | |
| LV Assessment | ||||
| LV End-Diastolic Volume, mL | 164 (133 to 180) | 147 (129 to 187) | 144 (111 to 182) | 0.57 |
| LV End-Systolic Volume, mL | 58 (46 to 74) | 60 (49 to 86) | 56 (44 to 80) | 0.53 |
| LV Stroke Volume, mL | 96 ± 19 | 92 ± 21 | 86 ± 23 | 0.17 |
| LV Ejection Fraction, % | 61 ± 6 | 58 ± 6 | 58 ± 6 | 0.05 |
| LV total mass, g | 159 ± 48 | 151 ± 45 | 134 ± 42 | 0.12 |
| LV Septum Max, mm | 14 ± 3 | 13 ± 3 | 13 ± 2 | 0.15 |
| RV Assessment | ||||
| RV End-Diastolic Volume, mL | 146 ± 38 | 155 ± 52 | 152 ± 49 | 0.77 |
| RV End-Systolic Volume, mL | 63 ± 24 | 72 ± 32 | 81 ± 41 | 0.14 |
| RV Stroke Volume, mL | 83 ± 20 | 84 ± 23 | 72 ± 20 | 0.07 |
| RV Ejection Fraction, % | 58 ± 7‡ | 55 ± 6‡ | 49 ± 10*,† | <0.01 |
| RV total mass, g | 30 ± 7 | 33 ± 9 | 33 ± 12 | 0.43 |
| Lung Assessment | ||||
| Air Fraction (%) | 75 ± 7 | 73 ± 8 | 74 ± 6 | 0.58 |
| Emphysema (%) | 0 (0 to 1) | 0 (0 to 0) | 0 (0 to 0) | 0.19 |
NFHG: normal-flow high-gradient aortic stenosis, NFLG: normal-flow low-gradient aortic stenosis, pLFLG: paradoxical low-flow low-gradient aortic stenosis
p<0.05 compared NFHG AS
p<0.05 compared to NFLG AS
p<0.05 compared to pLFLG AS
Figure 3: Evaluation of Right Ventricular Function on CT.
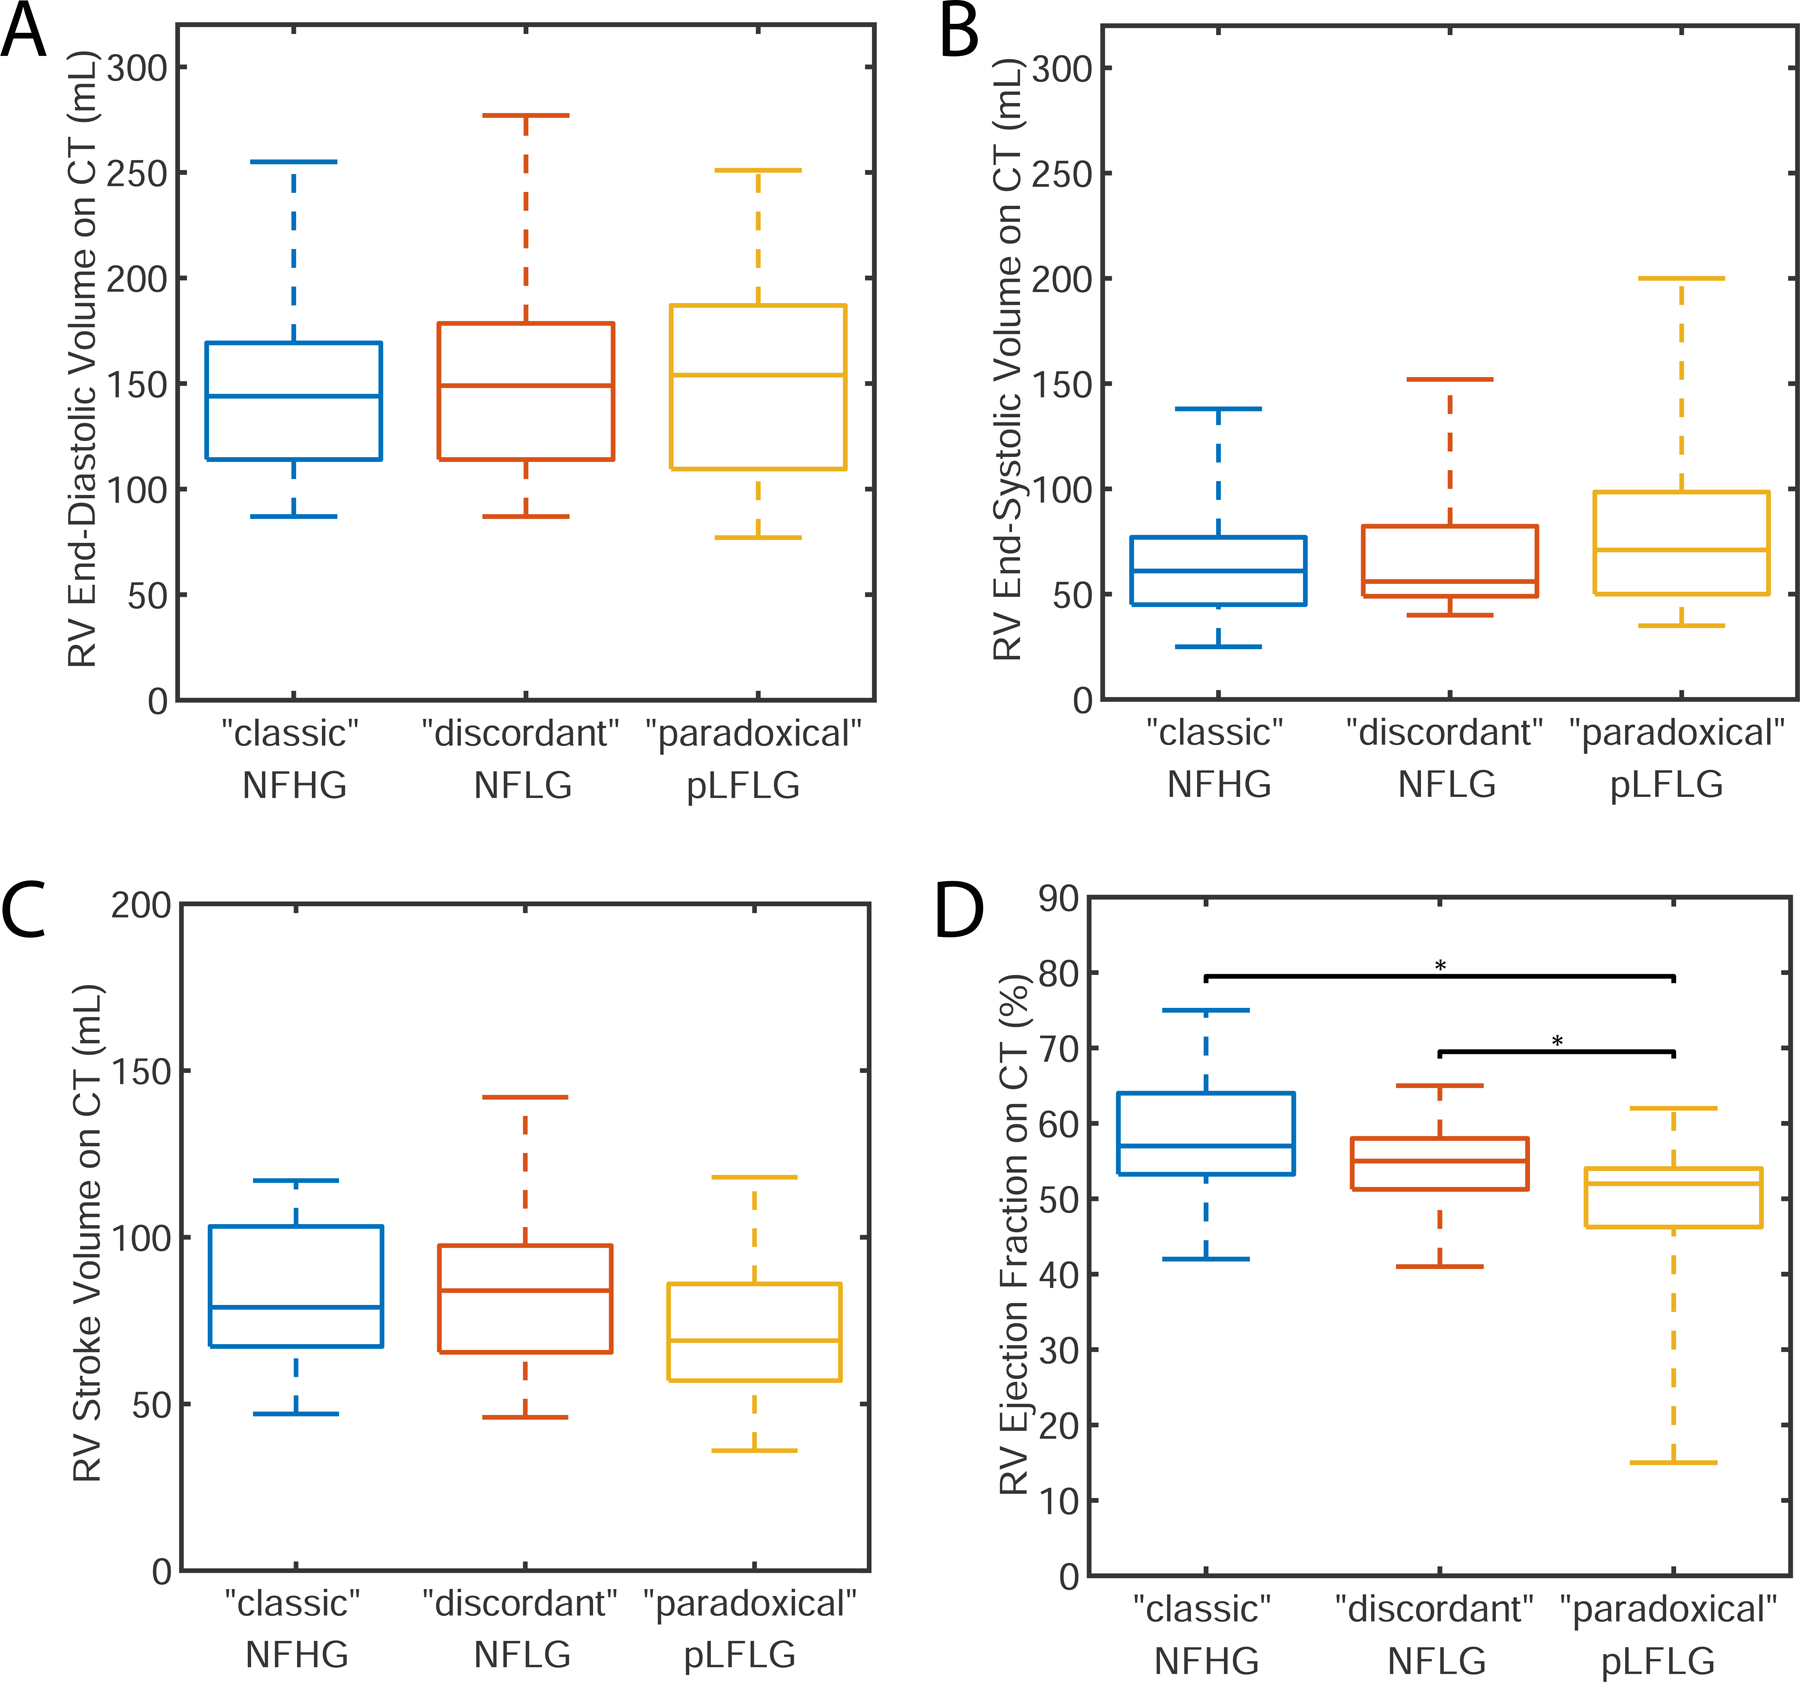
Differences did not exist in end-diastolic (panel A), end-systolic (panel B), or stroke volume (panel C). pLFLG AS patients had significantly lower RV ejection fraction (panel D) when compared to “classic” NFHG and “discordant” NFLG AS subjects. pLFLG AS: paradoxical low-flow low-gradient aortic stenosis, NFHG AS: normal-flow high-gradient aortic stenosis, NFLG AS: normal-flow low-gradient aortic stenosis
As observed in echocardiographic findings, CT-derived LVEF was different between the three groups (“classic”: 61 ± 6%, “discordant”: 58 ± 6%, “paradoxical”: 58 ± 6%, p=0.05, Figure 4) but post hoc testing did not identify significant differences between pairs (p > 0.07).
Figure 4: Evaluation of Left Ventricular Function on CT.
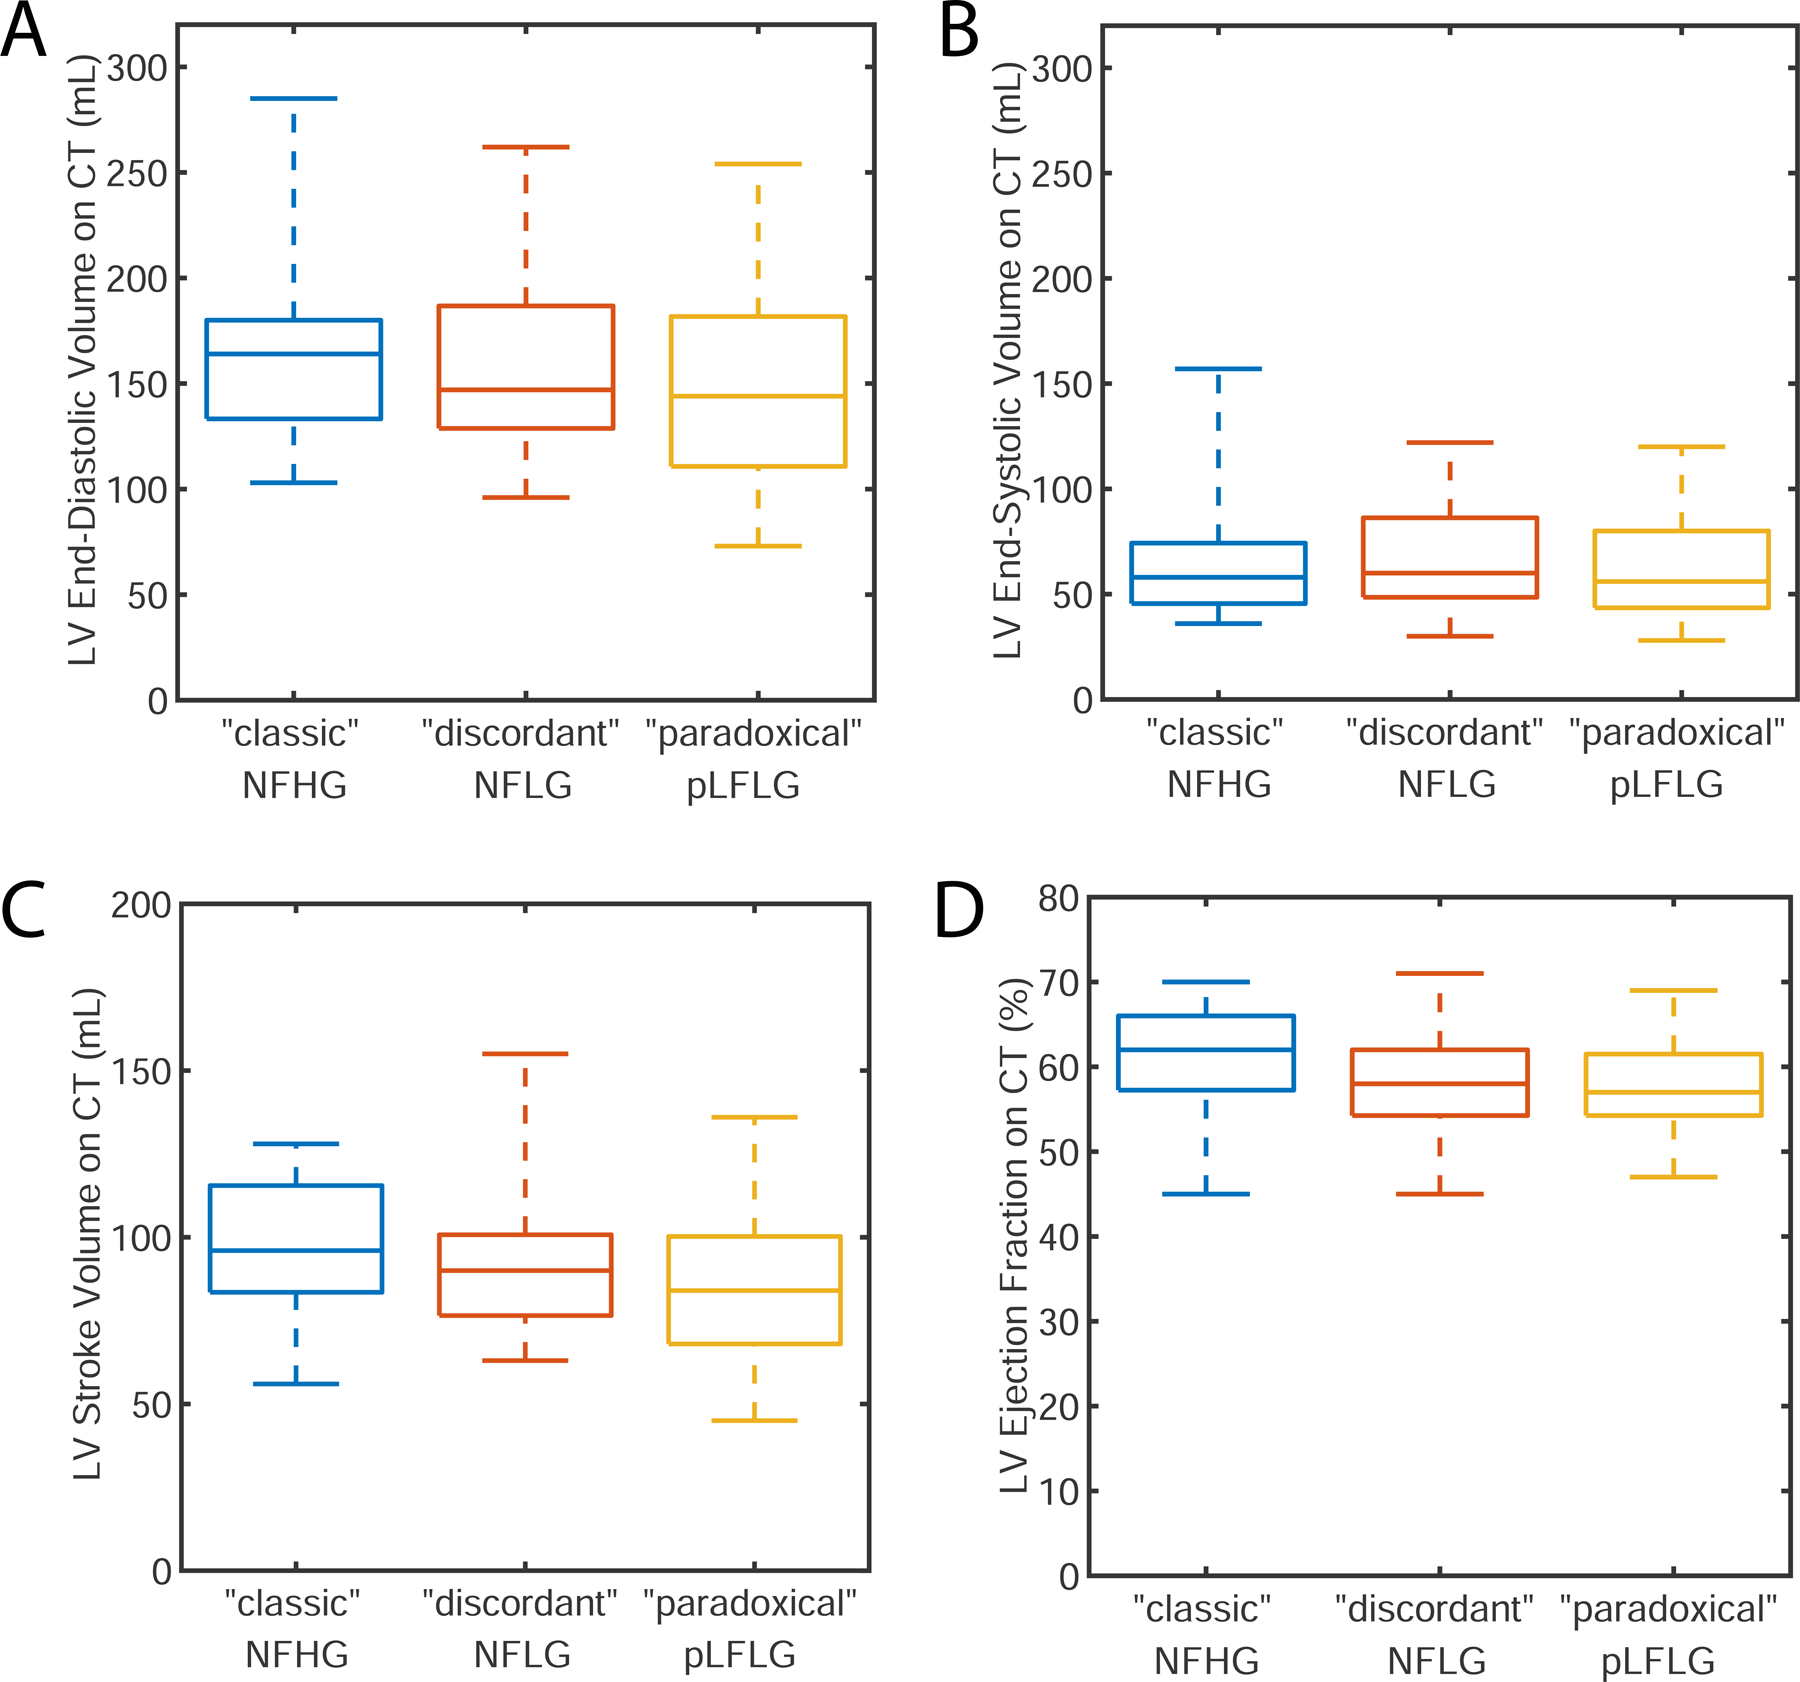
Differences did not exist in end-diastolic (panel A), end-systolic (panel B), or stroke volume (panel C) between different study groups. While there was a significant difference in LV ejection fraction (panel D), subsequent pairwise differences were not significant. pLFLG: paradoxical low-flow low-gradient aortic stenosis, NFHG: normal-flow high-gradient aortic stenosis, NFLG: normal-flow low-gradient aortic stenosis
Quantitative assessment of lung air fraction and emphysema percentage were not significantly different (p = 0.58 and p = 0.19, respectively) amongst the study cohorts (Table 2, Figure 5). Further, the presence of pulmonary disease (p = 0.94) and severity based on expert grading (p = 0.67) was not different between study groups.
Figure 5: CT Assessment of Lung Disease.
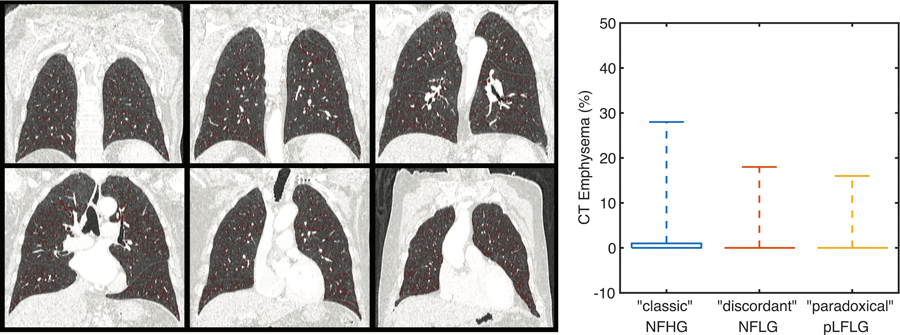
The percentage of lung identified as emphysematous on CT was low for all subjects without significant difference between groups. The boxplot shows the median (0 for all groups) and extends upwards to the 75th percentile. Whiskers extent to the maximum reported value. pLFLG: paradoxical low-flow low-gradient aortic stenosis, NFHG: normal-flow high-gradient aortic stenosis, NFLG: normal-flow low-gradient aortic stenosis
Discussion:
In patients with pLFLG-AS who have lower SV and preserved LVEF, we observed decreased RV systolic function relative to patients with other forms of AS with preserved LVEF. Importantly, RV changes were observed in the absence of any significant parenchymal lung disease.
This observation suggests that the right ventricle may be involved in the paradoxical AS phenotype. Previously, RV function has been shown to be elevated early in AS7. Therefore, decreased RV function or lack of RV compensation in pLFLG may represent a later stage of disease which leads to LV underfilling and inability to maintain left-sided SV and flow across the valve obstruction, resulting in a lower measured gradient. Therefore, RV dysfunction may explain clinical decompensation and negative prognostic features of pLFLG-AS. However confirmatory studies are needed to prove this hypothesis and carefully evaluate PH.
RV dysfunction is common in severe AS, involving up to 25% of AS patients2 and may even be more frequently in pLFLG-AS12. Patients with pLFLG-AS have a worse prognosis compared to patients with normal flow high gradient AS 9. They also manifest higher degree of TAVR futility 13. Worse prognosis and TAVR futility may both be directly associated with RV dysfunction or may result from concomitant pulmonary comorbidities.
High-resolution CT imaging is currently recommended for TAVR pre-assessment in patients with AS19,20 and to confirm pLFLG21 . In addition, CT can provide quantitative RV volumetric and function assessment22,23 as well as quantitative measures of lung parenchyma findings24–26. Since RV dysfunction may be caused by either left-sided cardiac disease or by underlying pulmonary comorbidities, we utilized CT-based pulmonary disease assessment to identify the association with lung findings and exclude the presence and severity of parenchymal abnormalities such as emphysema or fibrosis.
In this cohort, we did not find any differences in pulmonary comorbidities between the three AS subgroups analyzed. We did not have spirometry available in all our participants as these assessments are not routinely obtained. However, spirometry results would be confounded by elderly age and heart failure in this particular AS cohort27,28. Nonetheless, we excluded clinically significant pulmonary parenchymal disease by both quantitative emphysema assessment and radiologic analysis. Lastly, RV impairment could also be due to pulmonary hypertension (PH) driven by left-sided dysfunction. However, we did not observe differences in RV pulmonary pressures on echocardiography amongst our groups15,29.
Our findings motivate a prospective study to confirm our results and assess the impact of CT-based RV and pulmonary evaluation on TAVR futility and outcome in pLFLG. If confirmed in larger studies, pLFLG-AS may require early intervention to avoid RV dysfunction which seems driven by the AS disease rather than lung comorbidities.
This study was limited in the measurements available for evaluation due to its retrospective nature. As mentioned above, assessment of lung disease with spirometry was not available and would be limited in this population. In addition, while measurement of total lung capacity and diffusing capacity of the lung for carbon monoxide would help to further characterize lung function, we expect CT evaluation to have detected interstitial lung disease that would cause hemodynamic impairment. Further, RV systolic pressure was performed using echocardiography surrogates as right heart catheterization is not routinely performed in this cohort. Doppler echocardiography is routinely performed clinically and was therefore utilized to exclude detectable (significant) PH30. However, non-invasive estimation is known to be limited31,32. Therefore, PH may be unrecognized or underestimated. Further studies involving invasive assessment of pulmonary pressures will be required to accurately assess RV performance in AS and PH. Lastly, our limited sample size precluded multivariate evaluation to assess whether RV dysfunction is independently associated with pLFLG-AS.
Non-invasive CT-based evaluation could be readily applied clinically as TAVR patients undergo preprocedural CT imaging14. We evaluated biventricular function using volumetric measures which are highly accurate when obtained via CT. However, to further investigate the mechanism of RV-LV interaction (for example, ventricular interdependence or Bernheim type effect) septal wall motion abnormalities could be assessed using regional approaches33,34.
Conclusion:
Patients with pLFLG-AS have lower RVEF than “classic” severe and “discordant” normal-flow low-gradient AS patients in the absence of significant parenchymal lung disease. These findings support the major and direct importance of the right ventricle in the pathophysiology of AS.
Funding/Disclosure:
FC has received research funding from the NIH (HL143113), Bayer Healthcare, and GE Healthcare unrelated to this work. Dr. Malhotra is funded by NIH. He reports income related to medical education from Livanova, Equillium and Corvus which is unrelated to this work. ResMed provided a philanthropic donation to UCSD.
Abbreviations:
- AS
Aortic Stenosis
- LV
Left Ventricle
- RV
Right Ventricle
- SV
Stroke Volume
- CT
Computed Tomography
- EF
Ejection Fraction
- AVA
Aortic valve area
- pLFLG AS
paradoxical low-flow low-gradient aortic stenosis
- NFHG AS
normal-flow high-gradient aortic stenosis
- NFLG AS
normal-flow low-gradient aortic stenosis
References:
- 1.Galli E, Guirette Y, Feneon D, et al. Prevalence and prognostic value of right ventricular dysfunction in severe aortic stenosis. European Heart Journal - Cardiovascular Imaging 2015;16(5):531–538. doi:10/ghnbq2 [DOI] [PubMed] [Google Scholar]
- 2.Koifman E, Didier R, Patel N, et al. Impact of right ventricular function on outcome of severe aortic stenosis patients undergoing transcatheter aortic valve replacement. American Heart Journal 2017;184:141–147. doi:10/f9xfmk [DOI] [PubMed] [Google Scholar]
- 3.Griese DP, Kerber S, Barth S, Diegeler A, Babin-Ebell J, Reents W. Impact of right and left ventricular systolic dysfunction on perioperative outcome and long-term survival after transcatheter aortic valve replacement. J Interven Cardiol 2017;30(3):217–225. doi:10/ghnbq3 [DOI] [PubMed] [Google Scholar]
- 4.Asami M, Stortecky S, Praz F, et al. Prognostic Value of Right Ventricular Dysfunction on Clinical Outcomes After Transcatheter Aortic Valve Replacement. JACC: Cardiovascular Imaging 2019;12(4):577–587. doi:10/ghnbq4 [DOI] [PubMed] [Google Scholar]
- 5.Lindman BR, Maniar HS, Jaber WA, et al. Effect of Tricuspid Regurgitation and the Right Heart on Survival After Transcatheter Aortic Valve Replacement: Insights From the Placement of Aortic Transcatheter Valves II Inoperable Cohort. Circ Cardiovasc Interv 2015;8(4). doi:10/ghnbq5 [DOI] [PMC free article] [PubMed] [Google Scholar]
- 6.Grothues F, Moon JC, Bellenger NG, Smith GS, Klein HU, Pennell DJ. Interstudy reproducibility of right ventricular volumes, function, and mass with cardiovascular magnetic resonance. Am Heart J 2004;147(2):218–223. doi:10/bfphpr [DOI] [PubMed] [Google Scholar]
- 7.Rigolli M, Sivalokanathan S, Bull S, et al. A Hyperdynamic RV Is an Early Marker of Clinical Decompensation and Cardiac Recovery in Aortic Stenosis With Normal LV Ejection Fraction. JACC: Cardiovascular Imaging 2019;12(1):214–216. doi:10/ghkn6w [DOI] [PubMed] [Google Scholar]
- 8.Rigolli M, Musa TA, Treibel TA, et al. Right ventricular dysfunction detected by cardiovascular magnetic resonance is associated with late mortality in severe aortic stenosis. European Heart Journal - Cardiovascular Imaging 2019;20(Supplement_2):jez124. doi:10/ghkn6z [Google Scholar]
- 9.Hachicha Z, Dumesnil JG, Bogaty P, Pibarot P. Paradoxical low-flow, low-gradient severe aortic stenosis despite preserved ejection fraction is associated with higher afterload and reduced survival. Circulation 2007;115(22):2856–2864. doi:10/fgrqp7 [DOI] [PubMed] [Google Scholar]
- 10.Le Ven F, Freeman M, Webb J, et al. Impact of low flow on the outcome of high-risk patients undergoing transcatheter aortic valve replacement. Journal of the American College of Cardiology 2013;62(9):782–788. doi:10/f2f3xj [DOI] [PubMed] [Google Scholar]
- 11.Mangner N, Stachel G, Woitek F, et al. Predictors of mortality and symptomatic outcome of patients with low‐flow severe aortic stenosis undergoing transcatheter aortic valve replacement. Journal of the American Heart Association 2018;7(8):e007977. doi:10/ghr5tt [DOI] [PMC free article] [PubMed] [Google Scholar]
- 12.Cavalcante JL, Rijal S, Althouse AD, et al. Right Ventricular Function and Prognosis in Patients with Low-Flow, Low-Gradient Severe Aortic Stenosis. Journal of the American Society of Echocardiography 2016;29(4):325–333. doi:10/f8gx69 [DOI] [PubMed] [Google Scholar]
- 13.Puri R, Iung B, Cohen DJ, Rodés-Cabau J. TAVI or No TAVI: identifying patients unlikely to benefit from transcatheter aortic valve implantation. Eur Heart J 2016;37(28):2217–2225. doi:10/f8vx6c [DOI] [PubMed] [Google Scholar]
- 14.Francone M, Budde RPJ, Bremerich J, et al. CT and MR imaging prior to transcatheter aortic valve implantation: standardisation of scanning protocols, measurements and reporting-a consensus document by the European Society of Cardiovascular Radiology (ESCR). Eur Radiol 2020;30(5):2627–2650. doi:10/gg8psx [DOI] [PMC free article] [PubMed] [Google Scholar]
- 15.Baumgartner H, Falk V, Bax JJ, et al. 2017 ESC/EACTS Guidelines for the management of valvular heart disease. European Heart Journal 2017;38(36):2739–2791. doi:10/gcpth4 [DOI] [PubMed] [Google Scholar]
- 16.Doel T, Matin TN, Gleeson FV, Gavaghan DJ, Grau V. Pulmonary lobe segmentation from CT images using fissureness, airways, vessels and multilevel B-splines In: 2012 9th IEEE International Symposium on Biomedical Imaging (ISBI). IEEE; 2012:1491–1494. doi:10/ghkqzd [Google Scholar]
- 17.Burrowes K, Doel T, Brightling C. Computational modeling of the obstructive lung diseases asthma and COPD. J Transl Med 2014;12(Suppl 2):S5. doi:10/f6r753 [DOI] [PMC free article] [PubMed] [Google Scholar]
- 18.Madani A, Van Muylem A, de Maertelaer V, Zanen J, Gevenois PA. Pulmonary Emphysema: Size Distribution of Emphysematous Spaces on Multidetector CT Images—Comparison with Macroscopic and Microscopic Morphometry. Radiology 2008;248(3):1036–1041. doi: 10.1148/radiol.2483071434 [DOI] [PubMed] [Google Scholar]
- 19.Gurvitch R, Webb JG, Yuan R, et al. Aortic Annulus Diameter Determination by Multidetector Computed Tomography. JACC: Cardiovascular Interventions 2011;4(11):1235–1245. doi:10/cwspjw [DOI] [PubMed] [Google Scholar]
- 20.Delgado V, Ng ACT, van de Veire NR, et al. Transcatheter aortic valve implantation: role of multi-detector row computed tomography to evaluate prosthesis positioning and deployment in relation to valve function. European Heart Journal 2010;31(9):1114–1123. doi:10/dt8b82 [DOI] [PubMed] [Google Scholar]
- 21.Otto CM, Nishimura RA, Bonow RO, et al. 2020 ACC/AHA Guideline for the Management of Patients With Valvular Heart Disease. Journal of the American College of Cardiology Published online December 2020:S0735109720377962. doi:10/ghrshp [Google Scholar]
- 22.Busch S, Johnson TRC, Wintersperger BJ, et al. Quantitative assessment of left ventricular function with dual-source CT in comparison to cardiac magnetic resonance imaging: initial findings. Eur Radiol 2008;18(3):570–575. doi:10/c7nd5r [DOI] [PubMed] [Google Scholar]
- 23.Sharma A, Einstein AJ, Vallakati A, Arbab-Zadeh A, Mukherjee D, Lichstein E. Meta-analysis of global left ventricular function comparing multidetector computed tomography with cardiac magnetic resonance imaging. Am J Cardiol 2014;113(4):731–738. doi:10/f3hq4q [DOI] [PubMed] [Google Scholar]
- 24.Müller NL, Coxson H. Chronic obstructive pulmonary disease. 4: imaging the lungs in patients with chronic obstructive pulmonary disease. Thorax 2002;57(11):982–985. doi:10/fb3vmg [DOI] [PMC free article] [PubMed] [Google Scholar]
- 25.Smith BM, Austin JHM, Newell JD, et al. Pulmonary emphysema subtypes on computed tomography: the MESA COPD study. Am J Med 2014;127(1):94.e7–23. doi:10/f2wz6k [DOI] [PMC free article] [PubMed] [Google Scholar]
- 26.Coxson HO, Dirksen A, Edwards LD, et al. The presence and progression of emphysema in COPD as determined by CT scanning and biomarker expression: a prospective analysis from the ECLIPSE study. Lancet Respir Med 2013;1(2):129–136. doi:10/f3hxf7 [DOI] [PubMed] [Google Scholar]
- 27.Güder G, Rutten FH, Brenner S, et al. The impact of heart failure on the classification of COPD severity. J Card Fail 2012;18(8):637–644. doi:10/ghrsh6 [DOI] [PubMed] [Google Scholar]
- 28.Magee MJ, Herbert MA, Roper KL, et al. Pulmonary function tests overestimate chronic pulmonary disease in patients with severe aortic stenosis. Ann Thorac Surg 2013;96(4):1329–1335. doi:10/f5ctr9 [DOI] [PubMed] [Google Scholar]
- 29.Rudski LG, Lai WW, Afilalo J, et al. Guidelines for the echocardiographic assessment of the right heart in adults: a report from the American Society of Echocardiography endorsed by the European Association of Echocardiography, a registered branch of the European Society of Cardiology, and the Canadian Society of Echocardiography. J Am Soc Echocardiogr 2010;23(7):685–713; quiz 786–788. doi:10/c7kcfb [DOI] [PubMed] [Google Scholar]
- 30.Lang RM, Badano LP, Mor-Avi V, et al. Recommendations for Cardiac Chamber Quantification by Echocardiography in Adults: An Update from the American Society of Echocardiography and the European Association of Cardiovascular Imaging. Journal of the American Society of Echocardiography 2015;28(1):1–39.e14. doi: 10.1016/j.echo.2014.10.003 [DOI] [PubMed] [Google Scholar]
- 31.Rich JD, Shah SJ, Swamy RS, Kamp A, Rich S. Inaccuracy of Doppler Echocardiographic Estimates of Pulmonary Artery Pressures in Patients With Pulmonary Hypertension. Chest 2011;139(5):988–993. doi: 10.1378/chest.10-1269 [DOI] [PubMed] [Google Scholar]
- 32.Fisher MR, Forfia PR, Chamera E, et al. Accuracy of Doppler Echocardiography in the Hemodynamic Assessment of Pulmonary Hypertension. Am J Respir Crit Care Med 2009;179(7):615–621. doi: 10.1164/rccm.200811-1691OC [DOI] [PMC free article] [PubMed] [Google Scholar]
- 33.Contijoch FJ, Groves DW, Chen Z, Chen MY, McVeigh ER. A novel method for evaluating regional RV function in the adult congenital heart with low-dose CT and SQUEEZ processing. International Journal of Cardiology 2017;249:461–466. doi: 10.1016/j.ijcard.2017.08.040 [DOI] [PMC free article] [PubMed] [Google Scholar]
- 34.McVeigh ER, Pourmorteza A, Guttman M, et al. Regional myocardial strain measurements from 4DCT in patients with normal LV function. Journal of Cardiovascular Computed Tomography 2018;12(5):372–378. doi: 10.1016/j.jcct.2018.05.002 [DOI] [PMC free article] [PubMed] [Google Scholar]


