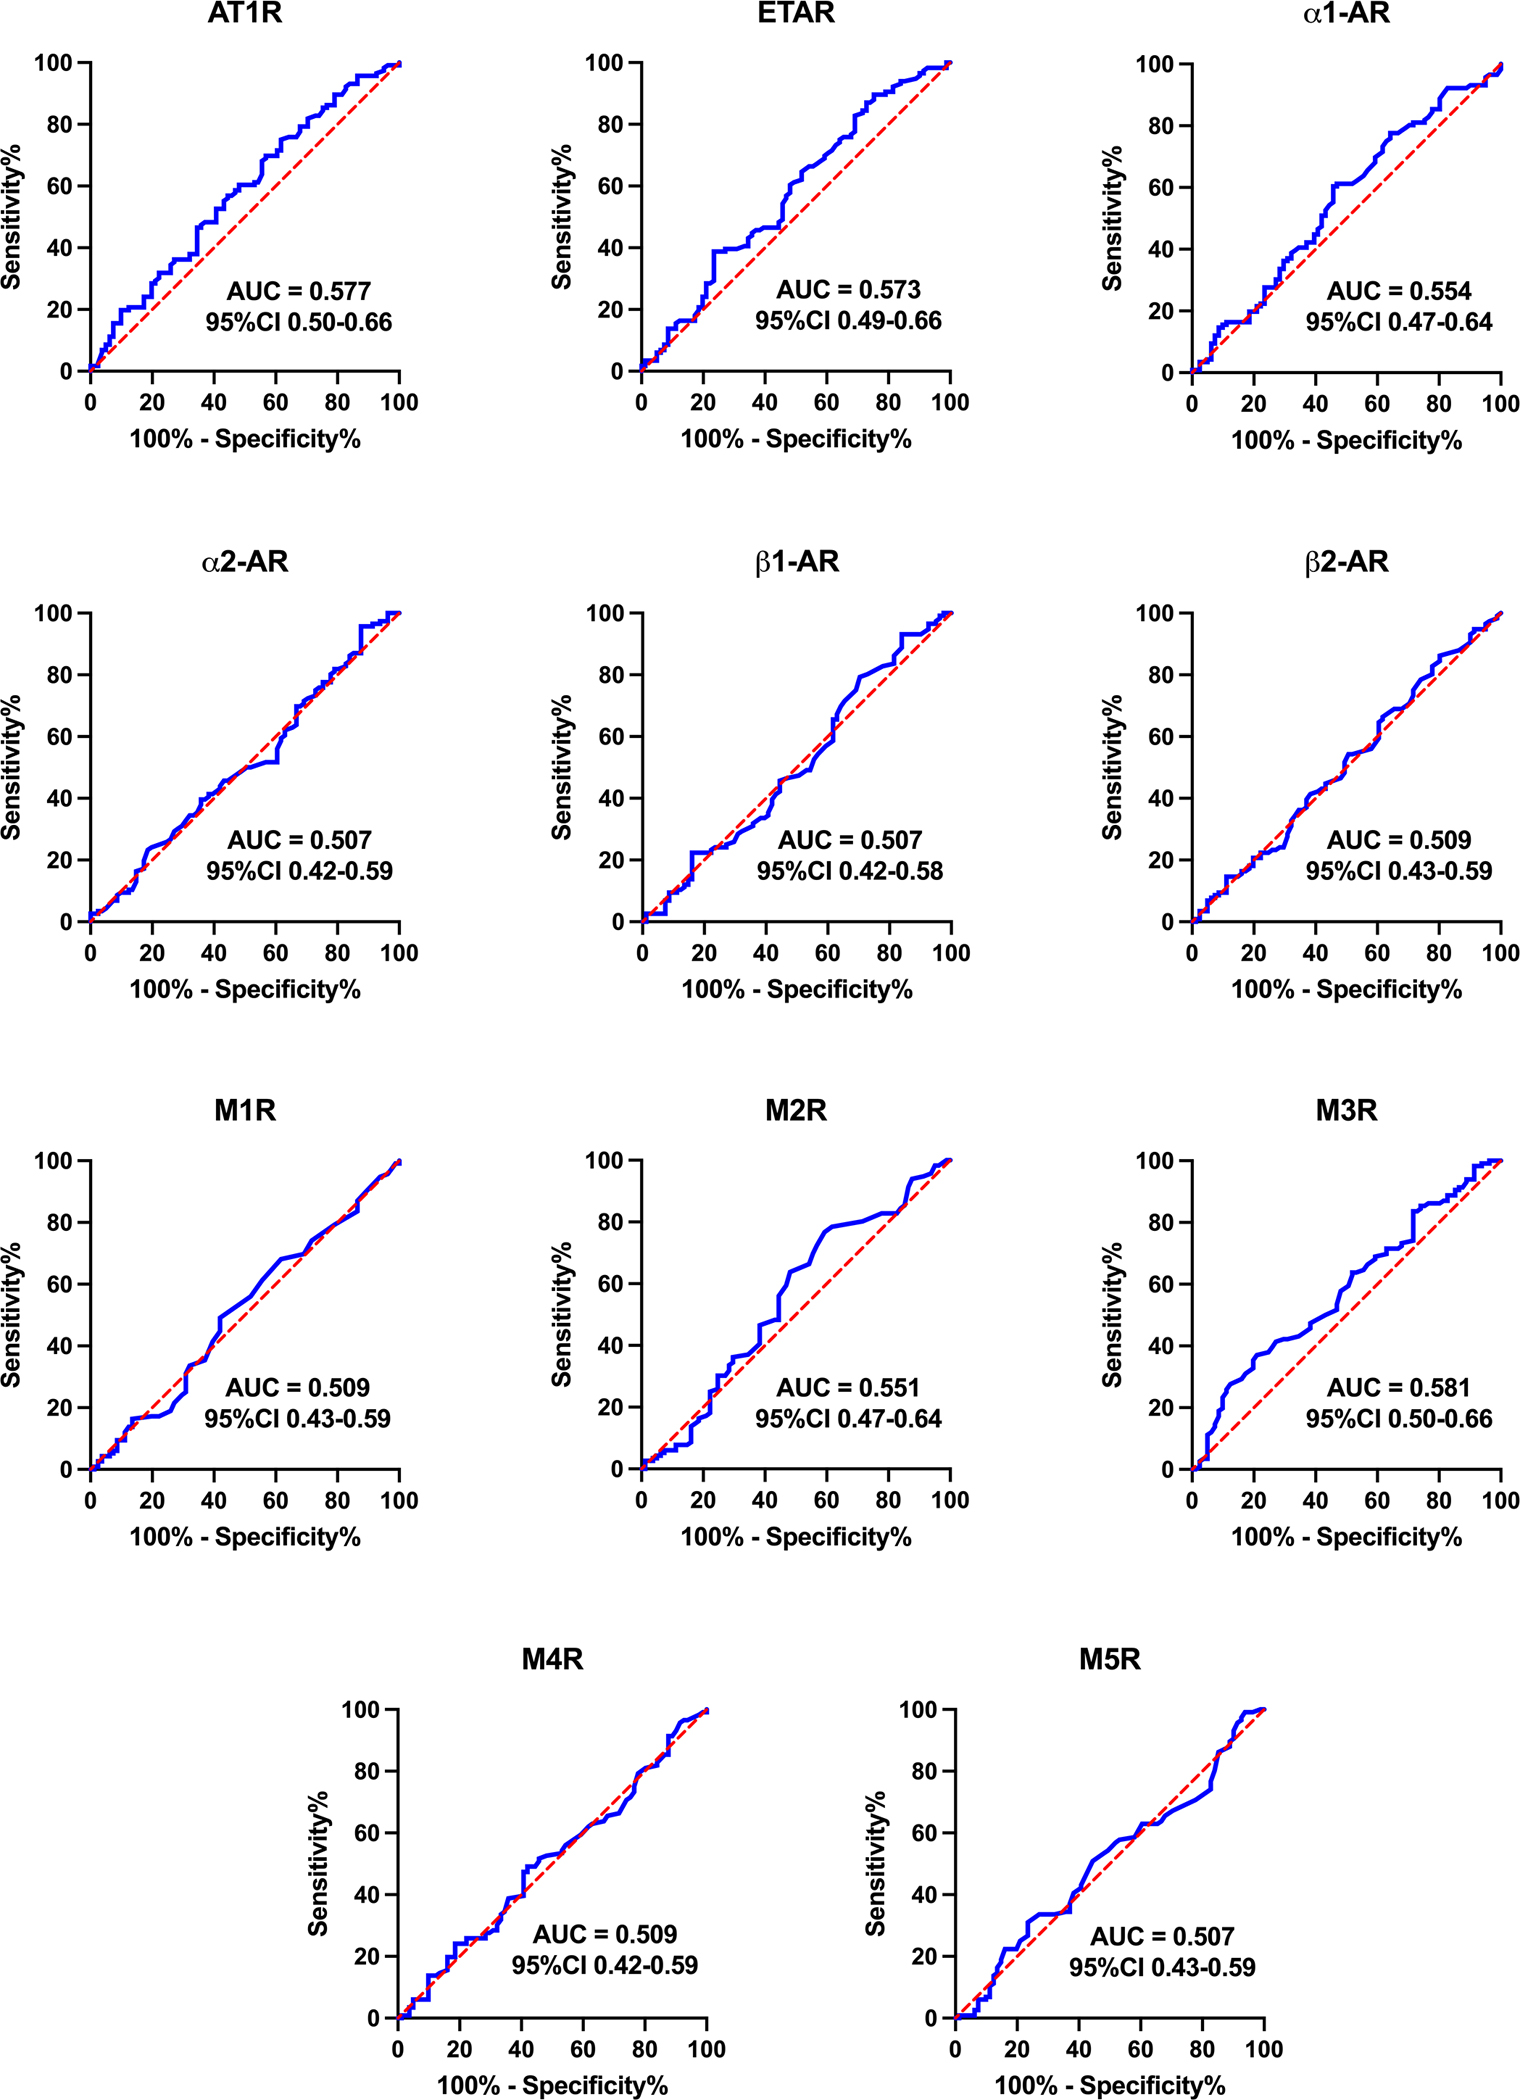
Figure 2. Receiver operating characteristic (ROC) curves for autoantibodies to 11 cardiovascular GPCRs, split by group (POTS patients versus healthy controls).

Data are presented as area under the curve (AUC) and 95% confidence interval (CI). A greater AUC indicates greater ability for the concentration of that autoantibody to discriminate whether a person has POTS. If 0.5 is contained within the 95% CI, then there is no significant difference between POTS patients and healthy controls. Abbreviations as in Figure 1.
