

Abstract
Neuroblastomas have neuroendocrine features and often show similar gene expression patterns to small cell lung cancer including high expression of delta-like ligand 3 (DLL3). Here we determine the efficacy of rovalpituzumab tesirine (Rova-T), an antibody drug conjugated (ADC) with a pyrrolobenzodiazepine (PBD) dimer toxin targeting DLL3, in preclinical models of human neuroblastoma.
We evaluated DLL3 expression in RNA sequencing data sets and performed immunohistochemistry (IHC) on neuroblastoma patient derived xenograft (PDX), human neuroblastoma primary tumor and normal childhood tissue microarrays (TMAs). We then evaluated the activity of Rova-T against 11 neuroblastoma PDX models using varying doses and schedules and compared anti-tumor activity to expression levels.
DLL3 mRNA was differentially overexpressed in neuroblastoma at comparable levels to small cell lung cancer, as well as Wilms and rhabdoid tumors. DLL3 protein was robustly expressed across the neuroblastoma PDX array, but membranous staining was variable. The human neuroblastoma array, however, showed staining in only 44% of cases, whereas no significant staining was observed in the normal childhood tissue array. Rova-T showed a clear dose response effect across the 11 models tested, with a single dose inducing a complete or partial response in 3/11 and stable disease in another 3/11 models. No overt signs of toxicity were observed, and there was no treatment-related mortality. Strong membranous staining was necessary, but not sufficient, for anti-tumor activity.
Rova-T has activity in a subset of neuroblastoma preclinical models, but heterogeneous expression in these models and the near absence of expression seen in human tumors suggests that any DLL3-targeting clinical trial should be only performed with a robust companion diagnostic to evaluate DLL3 expression for patient selection.
INTRODUCTION
Neuroblastoma arises from neural crest cells of the developing sympathetic nervous system and accounts for 12% of all childhood cancer mortality (1). This disease remains a significant challenge largely due to its underlying biological heterogeneity, and outcomes for patients with the high-risk form of the disease remain poor despite intensive upfront chemo-radio-immuno-therapy, with over 50% of patients ultimately dying and survivors burdened with significant treatment-related morbidities (2). Neuroblastoma is the only pediatric solid tumor with an FDA-approved immunotherapy, and three separate monoclonal antibodies that target GD2 are commercially available. While a randomized Phase 3 study showed a 10% improvement in relapse-free survival, the therapy is toxic, and relapses occur on or after therapy (3, 4). New immunotherapeutic strategies are clearly needed.
Neuroblastomas have neuroendocrine features and often show similar expression patterns to small cell lung cancer (SCLC) as well as other neuroendocrine cancers. Rovalpituzumab tesirine (Rova-T) is an ADC targeting delta-like protein 3 (DLL3), a Notch ligand that inhibits Notch signaling (5). DLL3 is highly expressed in small cell lung cancer (SCLC) and large cell neuroendocrine carcinoma (LCNEC) models and minimally expressed in normal tissues (6). Rova-T is an ADC comprised of a humanized anti-DLL3 monoclonal antibody conjugated to a DNA-damaging pyrrolobenzodiazepine (PBD) dimer toxin that has been shown to induce sustained tumor regression across neural-crest derived malignancies including SCLC and LCNEC PDX models (5). Noting in our RNA sequencing data that the median DLL3 expression level in neuroblastomas was higher than in SCLC, here we sought to develop DLL3 as an immunotherapeutic target for high-risk neuroblastoma.
MATERIALS AND METHODS
Tumor and normal tissue expression profiling
RNA sequencing data from high-risk neuroblastoma (n=126), osteosarcoma (n=88), rhabdoid tumor (n=68) and Wilms tumor (n=136) patients were retrieved from the Therapeutically Applicable Research to Generate Effective Treatments project (TARGET). RNA sequencing data for 79 small cell lung cancer patients were retrieved from the GSE60052 dataset in the NCBI GEO database. Lung adenocarcinoma (n=230), lung squamous cell carcinoma (n=501), and mesothelioma (n=87) RNA sequencing datasets were retrieved from The Cancer Genome Atlas (TCGA). Normal tissue RNA sequencing data were obtained by the Genotype-Tissue Expression Project (GTEx). All RNA-sequencing datasets were aligned using STAR and gene level expression was quantified with RSEM normalization using hg37 as reference genome and Gencode v23 gene annotation. RNA sequencing for the PDX models was performed and analyzed as previously described (7). FPKM data were available from 21 out of 35 neuroblastoma PDX models and were correlated with IHC quantification as described below.
Tissue Microarray Construction
All TMAs were constructed using standard methods (8, 9). Each tumor sample was punched in duplicate using 0.6mm cores with a Galileo CK3500 Tissue Microarrayer (Integrated System Engineering S.R.L.). For the neuroblastoma PDX array, PDX bearing mice were euthanized when the tumor reached ~1 cm3 in volume, the tumor was harvested and immediately placed into a 50ml conical tube with enough 10 % Neutral Buffered Formalin (NBF, Thermo Scientific) to cover the entire tumor (minimum 10:1 formalin to tissue ratio). The tissue was fixed in 10% NBF for 24–48h depending on the size of tumor. Fixed tumor tissue was processed in the Excelsior ES tissue processor from Thermo Scientific using the standard overnight protocol. Formalin-fixed, paraffin-embedded tissue blocks were sectioned, and hematoxylin and eosin (H&E) staining was performed to obtain a template guide slide to match the face of each tissue block. H&E slides were reviewed to validate the sample quality and preservation. PDX samples were excluded if they showed greater than 20% necrosis or inadequate tissue preservation. Slides were annotated to create a template for punching, then used as guides for core selection as previously described (10). The neuroblastoma PDX TMA was constructed of 35 distinct PDX tumor models that were collected in duplicate for a total of 70 tumor samples. Two 0.6mm cores were punched per each tumor, resulting in a total of 140 tissue sample cores along with nine control tissues (placenta, human brain cortex, human brain cerebellum, human tonsil, human adrenal cortex, human adrenal medulla, murine brain cortex, murine brain cerebellum, and murine adrenals). Human Placenta was used as an orientation marker on the array to mark the starting point (upper left-hand corner), and a row down the middle to aid in manual reading of the array.
For the human neuroblastoma tumor and normal pediatric tissue arrays, all samples were collected and de-identified at Children’s Hospital of Philadelphia from 2005–2016 under Institutional Review Board approval. The normal childhood tissue microarray represents tissues from patients ranging in age between 0–253 months (Fig. S1). The human neuroblastoma array included 64 tumors from patients between the ages of 0 months to 12 years of age. Eight of these samples were from cases with matched primary and metastatic tumors.
Immunohistochemistry and microarray scoring methodology
Immunohistochemistry with rabbit anti-DLL3 SP347 (Ventana, 790–7016) and anti-CD56 (Cell Marque, 156-R-95) antibodies was performed on formalin fixed paraffin embedded TMA slides. Staining was performed on a Bond Max automated staining system (Leica Biosystems). The Bond Refine polymer staining kit (Leica Biosystems) was used. The standard IHC protocol F was used apart from the mouse polymer step, which was excluded. For CD56 staining, the primary antibody incubation time was extended to one hour. DLL3 antibody was pre-diluted and antigen retrieval was performed with E1 (Leica Biosystems) retrieval solution for 20min. CD56 was used at a 1:200 dilution with E2 (Leica Biosystems, AR9640) retrieval solution for 20 minutes. Slides were rinsed, dehydrated through a series of ascending concentrations of ethanol and xylene, and then covered with coverslips. Stained slides were then digitally scanned at 20x magnification on an Aperio CS-O slide scanner (Leica Biosystems). TMA arrays were scored for the most prominent intensity (0–3 with 1 representing equivocal, 2 weak, and 3 strong positive staining) as well as for percentage of staining. Both the overall staining (any pattern) and membranous specific staining patterns were recorded. A modified H score was calculated as intensity multiplied by percentage of positively stained cells. All scores for each of the two tumors per PDX model were averaged for the final score.
Mouse studies
All xenograft studies were conducted in compliance with protocols approved by the Institutional Animal Care and Use Committee (IACUC) approved by The Children’s Hospital of Philadelphia. Felix-PDX, COG-N-452x, COG-N-519x, COG-N-415x, NB-FLY-623m, KWK-6062x, COG-N-421x and COG-N-424x PDXs, and SH-SY5Y and SK-N-AS cell line xenografts (CDXs) were implanted subcutaneously into the right flanks of female CB17 SCID mice (CB17/Icr-Prkdcscid/IcrIcoCrl, Charles River Laboratories, strain code 236). When tumors reached 200–300 mm3, the animals were randomized into groups of 2–10 mice per arm. Felix-PDX, COG-N-452x, COG-N-519x, or COG-N-415x tumor-bearing mice n=8–10 were enrolled in randomized controlled preclinical trials and dosed via intraperitoneal injection (i.p.) with one single dose according to the following treatments (vehicle, Rova-T at 0.1 mg/kg, 0.3 mg/kg and 0.6 mg/kg, or IgG1-ADC at 0.6 mg/kg). In a separate study, the COG-N-415x model was treated with 1 or 3 weekly injections of 1 mg/kg of Rova-T, IgG1-ADC, or vehicle. NB-FLY-623m, KWK-6062x, COG-N-421x, COG-N-424x, SH-SY5Y and SK-N-AS tumor-bearing mice were part of n=2 animal trials and dosed i.p. with one single dose of vehicle or Rova-T at 0.1 and/or 0.6 mg/kg. Tumor volume was estimated using the spheroid formula = (π/6) × (a+b/2)3, where “a” and “b” are two diameters measured with an electronic caliper. Total body weight and tumor volume were recorded two to three times weekly. Events were defined as quadrupling of a mouse’s tumor volume from day zero.
Statistical Methods
The exact time-to-event is estimated by interpolating between the measurements directly preceding and following the event, assuming log-linear growth. Differences in event-free survival (EFS) between experimental groups (e.g., treated vs controls) are tested using the Peto and Peto modification of the Gehan-Wilcoxon test (α = 0.05, two-sided alternative) and plotted as Kaplan-Meier event-free-survival (EFS) curves.
The objective response categories are progressive disease (PD, which is subdivided among treated mice into PD without and with growth delay, PD1 and PD2 respectively), stable disease (SD), partial response (PR), complete response (CR; no measurable tumor mass for 1 recording), and maintained complete response (MCR; no measurable tumor mass for at least 3 consecutive weekly recordings) as previously described (39). Response rate is defined as the percentage of mice with PR or better. Mice experiencing a possible treatment-related death (i.e., drug toxicity), mice with failed engraftment, and mice which unexpectedly die for reasons unrelated to treatment are excluded from statistical analyses of time-to-event, minimum tumor volume, and objective response. For experiments of groups of n = 2 mice per group, we did not perform any statistical tests of group differences but have reported all other summary statistics.
All studies performed had written informed consent from the patients when relevant, studies were conducted in accordance with recognized ethical guidelines (including the Declaration of Helsinki, CIOMS, Belmont Report, U.S. Common Rule), and the studies were approved by an institutional review board.
Data Availability Statement
Data were generated by the authors and included in the article.
RESULTS
DLL3 mRNA is expressed in neuroblastoma and other pediatric solid tumors
We used harmonized RNA-sequencing data to compare DLL3 gene expression of high-risk neuroblastoma primary tumors (n = 126) to other pediatric and adult tumors (n=1189) as well as 7859 GTEx samples across 31 unique normal tissues. In comparison with normal tissues, except for brain, pituitary gland, and testes, DLL3 showed significantly higher expression in neuroblastoma and some other pediatric solid tumors, such as malignant rhabdoid tumor and Wilms tumor (Fig. 1). Notably, the median DLL3 expression level in neuroblastomas was higher than in SCLC (n=79), albeit with a broader range of expression.
Figure 1. DLL3 is expressed in neuroblastoma and other pediatric solid tumors.
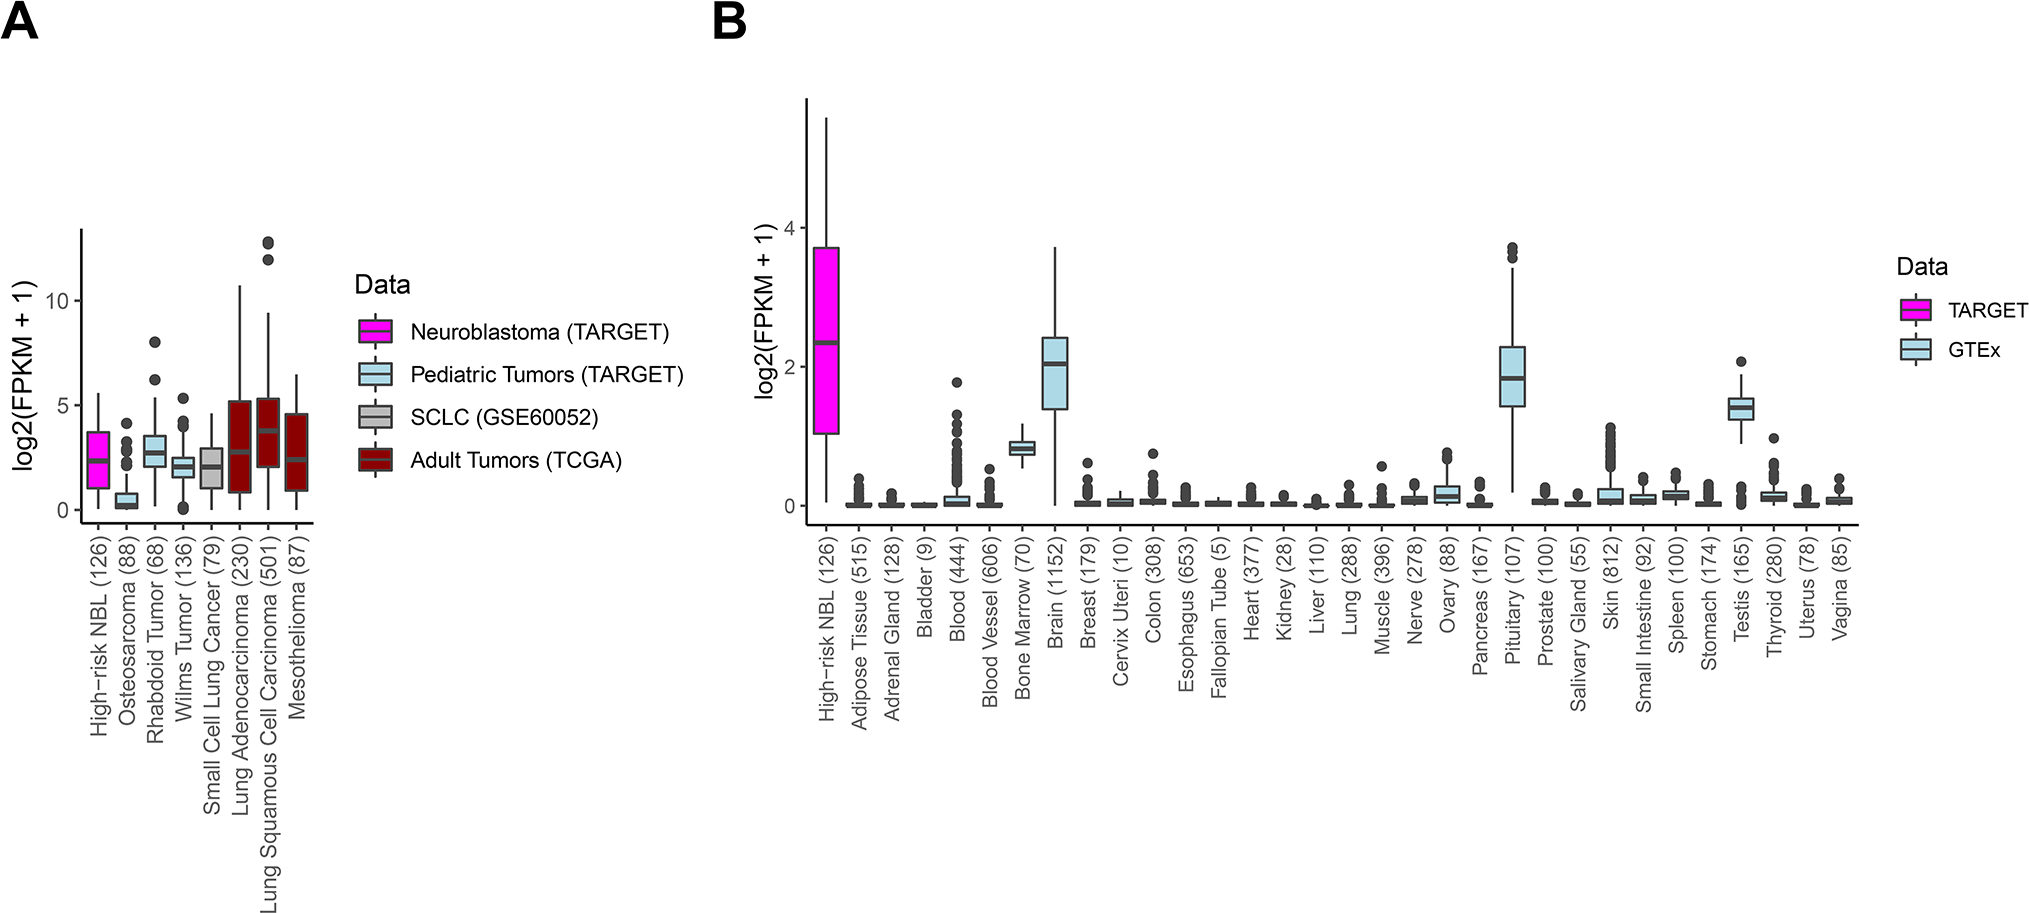
Boxplots displaying DLL3 expression (log2 FPKM) in (A) high-risk neuroblastoma (n=126), SCLC patients (n=79), and other pediatric solid tumors (n=292). (B) DLL3 expression in solid tumors were compared to normal tissue expression data extracted from the GTEx consortium (n= 7859 samples, across 31 unique tissues). The number of samples of each tissue is within the parentheses on the X-axis.
DLL3 protein expression
We next optimized an immunohistochemical assay using a commercially available anti-DLL3 monoclonal Ab (Ventana, SP347 clone) to evaluate DLL3 expression in a panel of neuroblastoma PDX models (Fig. 2A–C). This array contains 140 cores from 35 models with two tumors from each model and two cores from each tumor. The majority of the cores showed completely undifferentiated neuroblastic histology, with 49/140 cores (35%) showing some neuropil (generally minimal), and two of these cores (from the same tumor) showed rare ganglion cell differentiation.
Figure 2. DLL3 is widely expressed in neuroblastoma PDX models.
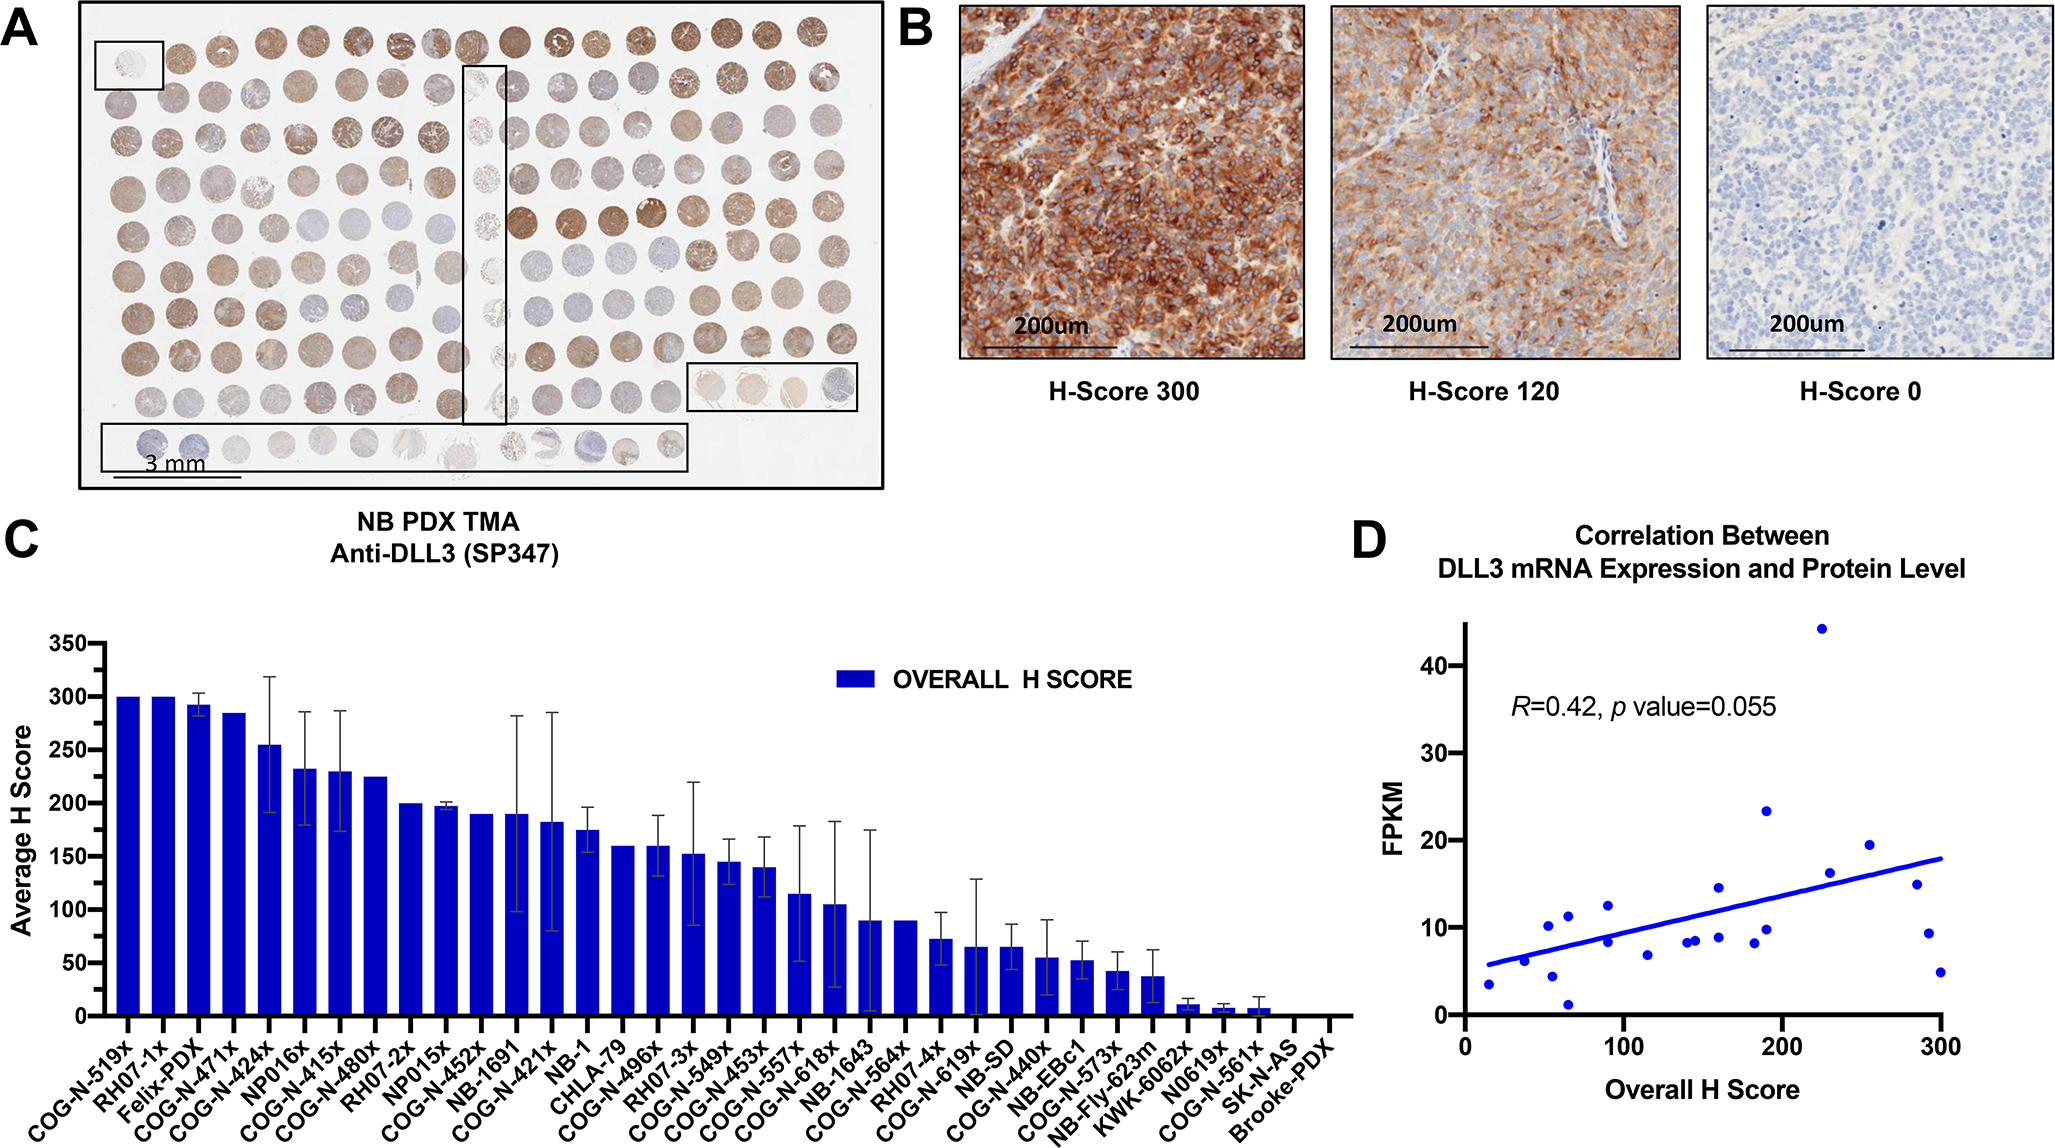
(A) DLL3 staining of neuroblastoma PDX microarray (TMA) consisting of 35 different neuroblastoma PDX models with duplicate tumor samples and two separate cores per each tumor sample (scale bar = 3mm). (B) Representative images of low, medium and high expressing PDX tumors and their overall H score values (scale bar = 200um). (C) Bar plot of neuroblastoma PDX Overall Average IHC H scores (highest to lowest). The neuroblastoma PDX TMA was scored for intensity from 0 to 3 (weak-strong) and percentage of staining. A modified score was calculated as intensity multiplied by percentage of positively stained cells. All cores for each of the two tumors per PDX model were averaged for the final score. Data shown as mean +/− SEM (n=2). (D) Correlation plot between DLL3 mRNA expression and protein overall H score.
There was a wide range of DLL3 staining across the 35 models ranging from intense membranous staining to no staining at all (Fig 2C). In some tumors there was clear membranous staining, often with cytoplasmic staining as well, others showed cytoplasmic staining only, and in others there was paranuclear accumulation of the signal (Fig. S1). Mixtures of patterns were also identified. In most cases with membranous staining or paranuclear staining, a subset of cells (sometimes only a small minority) showed clear membranous (Fig. S1A), or paranuclear accentuation (Fig. S1C), while a larger number of cells had diffuse (usually weaker) cytoplasmic staining (Fig. S1B), resulting in a lower membranous specific score. Some degree of 2+ or 3+ (i.e., greater than equivocal) staining was seen in 116/140 cores (83%) or 30/35 (86%) of PDX models. Staining was overall concordant between the two cores, with occasionally one degree of difference in intensity between cores. RNA sequencing data from 21 of the 35 PDX models included on neuroblastoma PDX TMA showed weak correlation with the overall staining IHC H scores (Fig. 2D, Fig 3).
Figure 3. DLL3 shows both membranous and non-membranous expression in PDX models.
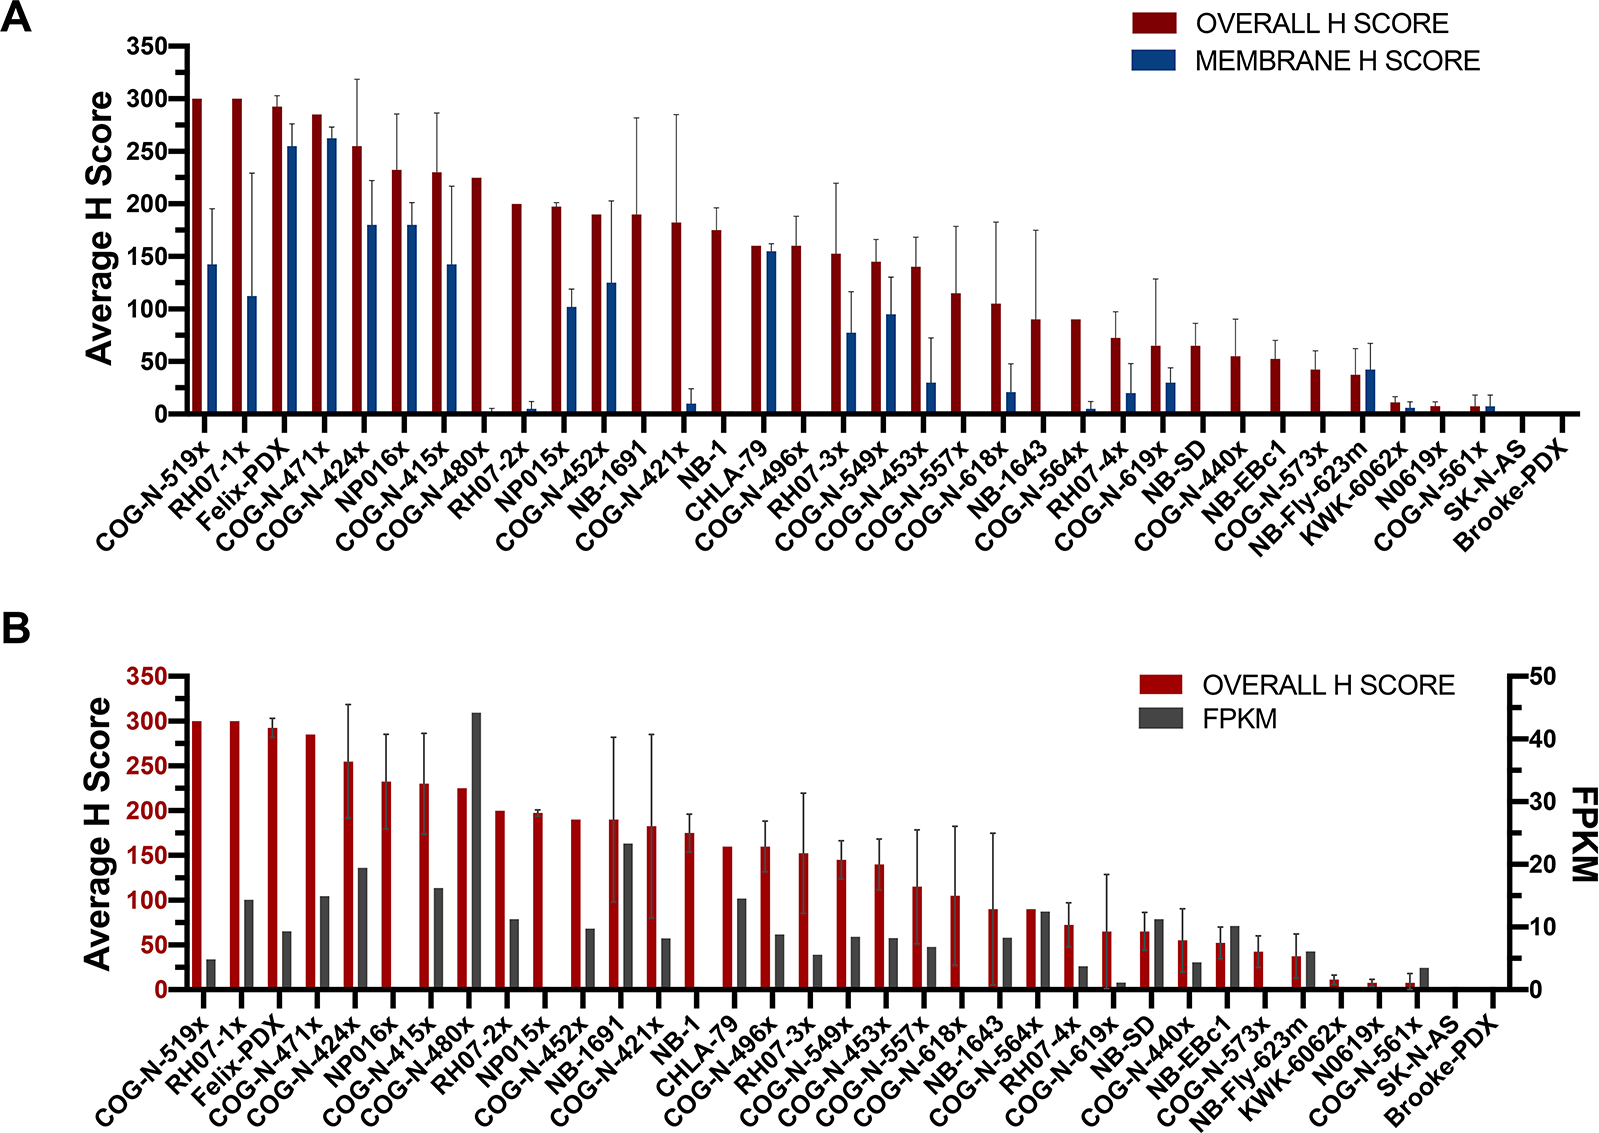
(A) In comparison to the overall H-score, the membrane-specific H-score in any single tumor is generally lower, reflecting the variably prominent subset of cells showing discrete membranous localization. (B) Correlation between DLL3 mRNA expression and overall H-score in each PDX model.
A human neuroblastoma tumor array with 33 specimens from initial diagnosis, 25 from post-chemotherapy local resections, and five from relapsed/ progressive disease (and one from unknown timing) was also stained. A total of 125 cores were evaluable for DLL3 staining from 64 unique cases (Fig. S2). In general, there was much weaker DLL3 staining on this array compared to the PDX array and the robustly expressed cell surface protein NCAM1 (CD56), Fig. S3. Fifty cores (40%) from 28 cases (44%) contained at least some cells with staining, but with a very wide range from 1%–100% of cells (Fig. S2–3). Only two cases showed an H-score > 100.
The normal human childhood TMA (Fig. S4) showed no clear membranous DLL3 staining in any normal tissue (Fig. S2). There was weak cytoplasmic staining of placental syncytiotrophoblasts as well as the epithelium in the appendix, ileocecum, fallopian tube, bladder, and gallbladder with supranuclear granular accentuation in the gallbladder. Weak cytoplasmic staining was also seen in a subset of bone marrow mononuclear cells, and in a subset of adrenal cortical cells with a somewhat granular pattern. Moderate granular cytoplasmic staining was present in a subset of neurons and in a subset of gastric glandular epithelial cells. Strong paranuclear cytoplasmic staining was present in a subset of thyroid follicular cells.
Rova-T exhibits anti-tumor activity in PDX models of neuroblastoma
We first tested the efficacy of Rova-T in four neuroblastoma PDX models using a conventional design of 8–10 mice per arm. In the PDX array, all four of these models had robust DLL3 expression in the majority of tumor cells including some degree of clearly membranous staining (Fig. S5). There was a clear dose-response effect, and all models showed some or significant evidence of anti-tumor activity at a single 0.6 mg/kg dose (i.e., one injection) of Rova-T (Table 1, Fig. 4, S6). Doses of 0.3 mg/kg and 0.6 mg/kg induced statistically significant increases in event-free survival (EFS), except for the COG-N-415x dosed at 0.3 mg/kg (Table 1, Fig. 4). We next compared a single 1 mg/kg dose to 1 mg/kg weekly × 3 in mice bearing the COG-N-415x PDX, showing a maintained complete response for 7 weeks with the weekly ×3 treatment schedule, with slow resumption of tumor growth thereafter (Fig. 5, Table 1).
TABLE 1:
Summary of statistical analysis of in vivo studies.
| Models | Rova-T Dose | N | Na | KM Med (Days) | EFS T-C (Days) | EFS T/C | p-Value | minRTV Mean±SD (cm3) | Median Response | FPKM | Modified H Score |
|---|---|---|---|---|---|---|---|---|---|---|---|
| COG-N-452x | 0.6 mg/kg | 9 | 9 | >42.0 | >32.8 | >4.55 | p < 0.001 | 0.087±0.121 | CR | 9.8 | 190.0 |
| 0.3 mg/kg | 9 | 9 | 37.8 | 28.5 | 4.09 | p < 0.001 | 1.014±0.626 | PD2 | |||
| Felix-PDX | 0.6 mg/kg | 10 | 10 | >41 | >33.5 | >5.45 | p < 0.001 | 0.145±0.121 | PR | 9.3 | 292.5 |
| COG-N-519x | 0.6 mg/kg | 10 | 10 | 33.4 | 25.9 | 4.46 | p < 0.001 | 0.696±0.833 | SD | 4.9 | 300.0 |
| 0.3 mg/kg | 10 | 10 | 15.8 | 8.3 | 2.11 | p < 0.001 | 2.003±0.697 | PD2 | |||
| COG-N-415x | 0.6 mg/kg | 10 | 10 | 20.6 | 12.3 | 2.49 | p = 0.001 | 0.973±0.840 | PD2 | 16.2 | 230.0 |
| 0.3 mg/kg | 10 | 10 | 9.5 | 1.2 | 1.15 | p = 0.370 | 1.619±0.756 | PD1 | |||
| COG-N-415x | 1 mg/kg | 8 | 8 | 42.3 | 37.2 | 8.19 | p = 0.015 | 1.027±1.685 | PR | 16.2 | 230.0 |
| 1 mg/kg (x3) | 8 | 8 | 61.5 | 56.3 | 11.89 | p < 0.001 | 0.159±0.430 | CR | |||
| COG-N-424x | 0.6 mg/kg | 2 | 2 | 22.7 | 18.7 | 5.64 | p = 0.102 | 0.747±0.837 | SD | 19.5 | 255.0 |
| SH-SY5Y | 0.6 mg/kg | 2 | 2 | >36 | >31.5 | >8.08 | p = 0.157 | 0.363±0.514 | SD | N/A | N/A |
| COG-N-421x | 0.6 mg/kg | 2 | 2 | >20 | >13.3 | >2.97 | p = 0.102 | 0.468±0.094 | SD | 8.2 | 182.5 |
| 0.1 mg/kg | 2 | 2 | 8 | 1.3 | 1.19 | p = 1.000 | 2.825±0.676 | PD1 | |||
| KWK-6062x | 0.6 mg/kg | 2 | 2 | 38.4 | 15.1 | 1.65 | p = 0.102 | 0.581±0.138 | PD2 | N/A | 11.3 |
| 0.1 mg/kg | 2 | 2 | 25.5 | 2.2 | 1.09 | p = 0.102 | 0.850±0.224 | PD1 | |||
| SK-N-AS | 0.6 mg/kg | 2 | 2 | 11.6 | −2.1 | 0.85 | p = 1.000 | 0.943±0.781 | PD2 | N/A | 0.0 |
| 0.1 mg/kg | 2 | 2 | 14.3 | 0.6 | 1.04 | p = 1.000 | 1.298±0.609 | PD1 | |||
| NB-FLY-623m | 0.6 mg/kg | 2 | 2 | >28 | >13 | >1.87 | p = 0.102 | 0.804±0.286 | PD1 | 6.1 | 37.5 |
| 0.1 mg/kg | 2 | 2 | 18.2 | 3.2 | 1.21 | p = 0.450 | 1.225±0.420 | PD1 |
N = total number of mice entering experiment; Na = number of mice in analysis; KM Med = Kaplan-Meier estimate of median time-to-event (days); EFS T – C = difference in median time-to-event (days) between T and C groups; EFS T/ C = ratio of median time-to-event (days) between T and C groups; Median response = median response evaluation.; PD = progressive disease, <50% tumor regression throughout study and >25% tumor growth at end of study; PD1 = when PD (Progressive Disease) and the mouse’s time to event ≤ 200% the KM median time-to-event in control group; PD2 = when PD but, additionally, time-to-event is > 200% of the Kaplan-Meier (KM) median time-to-event in control group; PR = partial response, ≥50% tumor regression at any point during study but measurable tumor throughout study period; CR = complete response, disappearance of measurable tumor mass during study period.
Figure 4. Rova-T induces anti-tumor activity in DLL3-expressing neuroblastoma PDX models.
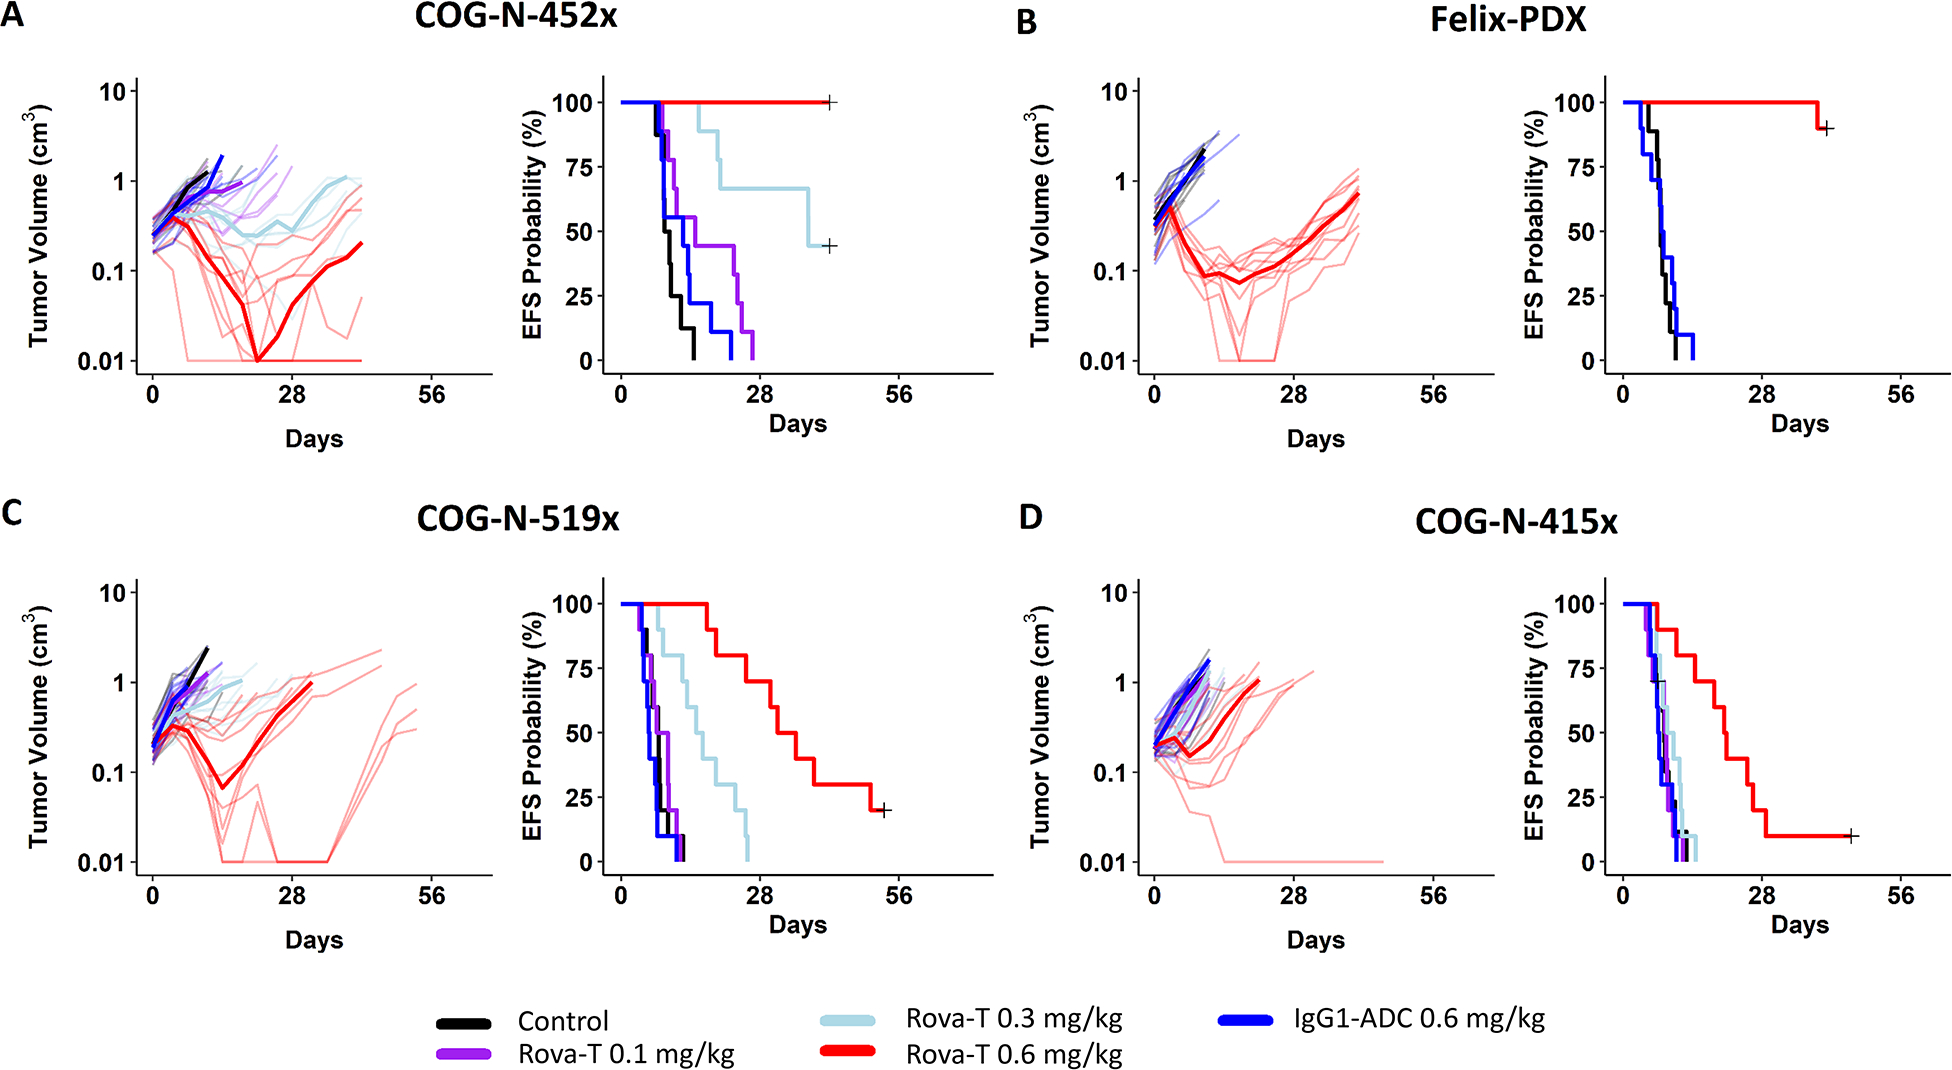
The in vivo efficacy of Rova-T was evaluated in female CB17 SCID mice bearing (A) COG-N-452x and (B) Felix PDX and (C) COG-N-519x and (D) COG-N-415x. Upon enrollment, mice (n=8–10 per group) were intraperitoneally injected with 5% glucose water (vehicle control), IgG1-ADC at 0.6 mg/kg or Rova-T at 0.1 mg/kg, 0.3 mg/kg or 0.6 mg/kg. Differences in event-free survival (EFS) between experimental groups (e.g., treated vs controls) are tested using the Peto and Peto modification of the Gehan-Wilcoxon test (α = 0.05, two-sided alternative) and plotted as Kaplan-Meier event-free-survival (EFS) curves.
Figure 5. Rova-T increments of dose and schedule induced more sustained anti-tumor activity in the COG-N-415x neuroblastoma model.
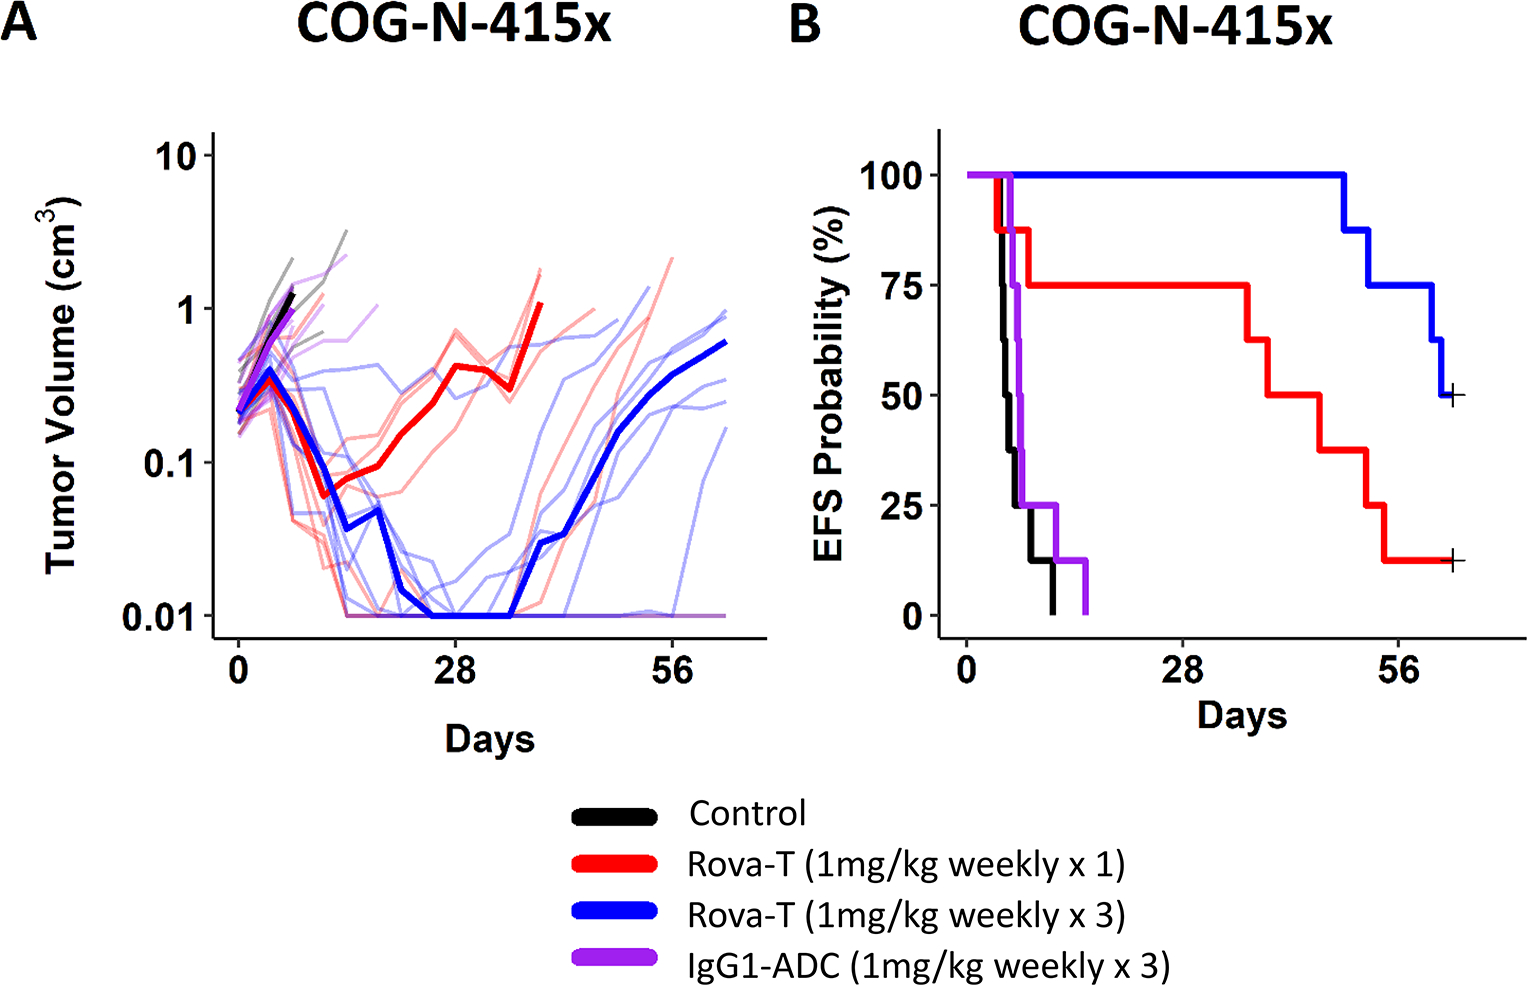
Mice bearing the COG-N-415x model received one or three injections of Rova-T or IgG1-ADC (1mg/kg) every 7 days. (A) Tumor volume. (B) Event-free survival (EFS) probabilities.
Next, we sought to further understand biomarkers of anti-tumor activity by studying six additional PDX and CDX models with varying levels of DLL3 expression using an n=2 design (10), with one single dose of vehicle or Rova-T at 0.1 or 0.6 mg/kg. No objective responses were observed and there was stable disease in 3 models at 0.6 mg/kg (Table 1). There were no overt signs of toxicity and no treatment-related mortality (Fig. S7).
DISCUSSION
Improved clinical outcomes for patients with high-risk pediatric cancers, especially those with solid tumors, have been hampered by aggressive and non-specific multimodal therapy such as empiric high-dose chemotherapy. There is an urgent need to identify new drug targets that can be harnessed for the development of more rationale therapies. The Notch pathway is a highly conserved cell-cell signaling pathway involved in a variety of cellular processes and controls fate decisions in developing organs (11–13). Here, we show that the Notch ligand DLL3 is robustly expressed in most high-risk neuroblastoma preclinical models, but much less so in the patient tumor samples. We hypothesize that the predominant adrenergic cell type of neuroblastomas must maintain suppression of Notch signaling, and that PDXs are enriched for adrenergic cell type and thus DLL3 overexpression (14–16). The low protein expression noted in our human tumor array must be viewed in the context that many of the samples were derived from definitive surgery after chemotherapy, and thus enriched for a more mesenchymal cell type (17). Thus, any DLL3-targeting clinical trial should strongly consider real time assessment of DLL3 protein expression at study entry and explore a minimum expression level required for anti-tumor efficacy.
Preclinical studies support the development of novel therapies that target DLL3 in SCLC and possibly other neuro-endocrine tumors, and have demonstrated that targeting of DLL3 using an ADC approach inhibits tumor growth (5, 18–20). The efficacy seen with Rova-T against a panel of neuroblastoma PDXs suggests that DLL3 is a potential candidate therapeutic target in this disease. Rova-T was evaluated in a pivotal Phase 2 study in patients with DLL3-expressing SCLC (defined by IHC). There was no difference in overall survival (OS) between patients high or low DLL3 expression, and results demonstrated modest clinical activity with associated toxicities (21). All patients received 0.3 mg/kg Rova-T intravenously infused over 30 minutes once every 6 weeks for two cycles as the initial treatment. Ultimately, a Phase 3 placebo-controlled trial evaluating Rova-T as a first-line maintenance treatment therapy for advanced SCLC demonstrated no survival benefit and Research and Development of this drug was hence discontinued. A recent trial combining Rova-T with nivolumab plus or minus ipilimumab in patients with relapsed/refractory SCLC showed an objective response rate of 30% but unfortunately the combination was not well tolerated(22). Despite the cessation of trials with Rova-T as an ADC approach using a PBD dimer to target DLL3, this remains a conceivable target in neuroblastoma and other neuroendocrine tumors due to its relatively restricted normal expression and moderate expression in preclinical PDX models. However, in light of the marginal expression on the cell surface of human neuroblastoma tumors, this target should be contemplated with caution for immunotherapeutic approaches that exploit not only antigen specificity but also and receptor density.
DLL3-targeted Bispecific T-cell Engager (BiTE) molecules and Chimeric Antigen Receptors (CAR) T cells are in development to promote the tumor-suppressive functions of DLL3 and to avoid oncogenicity. These include Amgen’s 757 Anti-DLL3 × CD3 BiTE® antibody (23) and AMG 119 CAR, as well as Boehringer Ingelheim’s bispecific DLL3/CD3 IgG-like T-cell engaging antibody (24). Additionally, we should not rule out the possibility of other DLL3-ADC approaches using different payloads. Clinical trials suggest that a better understanding of the mechanistic basis of ADC activity as well as exploration and modification of dose and schedule of DLL3-targeted ADC are necessary to reduce toxicity and improve efficacy. Along these lines, recent studies indicate that in addition to intracellular release of the cytotoxic payload, ADCs can concomitantly suppress infiltrating lymphocytes that overall limits their efficacy (25).
Collectively, these data provide a foundation for vigilance about future consideration of clinical development of DLL3-targeted immunotherapeutic agents for neuroblastoma and other potentially other DLL3-expressing neuroendocrine tumors. Any neuroblastoma clinical trial must consider the heterogeneity and plasticity of DLL3 expression on Notch pathway activity in this disease.
Supplementary Material
SIGNIFICANCE STATEMENT.
GD2-directed antibody therapy is standard-of-care for high-risk neuroblastoma; therapy is toxic, and relapses often occur. DLL3, an inhibitory Notch ligand, is overexpressed in several neuronal cancers. A DLL3-targeting ADC showed objective activity only in neuroblastoma models with high DLL3 expression. These data provide vigilance about clinical development of DLL3 immunotherapies for neuroblastoma.
ACKNOWLEDGEMENTS
NCI U01 CA199287 (J.M.M.), NCI R35 CA220500 (J.M.M.), U01199221 (R.G.G.), NCI F31 CA239424 (N.M.K), the Giulio D’Angio Endowed Chair (J.M.M.) and the Patricia Brophy Endowed Chair (Y.P.M.).
Footnotes
Disclosure of Potential Conflicts of Interest
None.
REFERENCES
- 1.Bosse KR, Maris JM. Advances in the translational genomics of neuroblastoma: From improving risk stratification and revealing novel biology to identifying actionable genomic alterations. Cancer. 2016;122(1):20–33. [DOI] [PMC free article] [PubMed] [Google Scholar]
- 2.Maris JM. Recent advances in neuroblastoma. N Engl J Med. 2010;362(23):2202–11. [DOI] [PMC free article] [PubMed] [Google Scholar]
- 3.Yu AL, Gilman AL, Ozkaynak MF, London WB, Kreissman SG, Chen HX, et al. Anti-GD2 antibody with GM-CSF, interleukin-2, and isotretinoin for neuroblastoma. The New England journal of medicine. 2010;363(14):1324–34. [DOI] [PMC free article] [PubMed] [Google Scholar]
- 4.Yu AL, Gilman AL, Ozkaynak MF, Naranjo A, Diccianni MB, Gan J, et al. Long-Term Follow-up of a Phase III Study of ch14.18 (Dinutuximab) + Cytokine Immunotherapy in Children with High-Risk Neuroblastoma: COG Study ANBL0032. Clin Cancer Res. 2021;27(8):2179–89. [DOI] [PMC free article] [PubMed] [Google Scholar]
- 5.Saunders LR, Bankovich AJ, Anderson WC, Aujay MA, Bheddah S, Black K, et al. A DLL3-targeted antibody-drug conjugate eradicates high-grade pulmonary neuroendocrine tumor-initiating cells in vivo. Sci Transl Med. 2015;7(302):302ra136. [DOI] [PMC free article] [PubMed] [Google Scholar]
- 6.Gazdar AF, Bunn PA, Minna JD. Small-cell lung cancer: what we know, what we need to know and the path forward. Nat Rev Cancer. 2017;17(12):725–37. [DOI] [PubMed] [Google Scholar]
- 7.Rokita JL, Rathi KS, Cardenas MF, Upton KA, Jayaseelan J, Cross KL, et al. Genomic Profiling of Childhood Tumor Patient-Derived Xenograft Models to Enable Rational Clinical Trial Design. Cell Rep. 2019;29(6):1675–89.e9. [DOI] [PMC free article] [PubMed] [Google Scholar]
- 8.Kononen J, Bubendorf L, Kallioniemi A, Barlund M, Schraml P, Leighton S, et al. Tissue microarrays for high-throughput molecular profiling of tumor specimens. Nat Med. 1998;4(7):844–7. [DOI] [PubMed] [Google Scholar]
- 9.Pilla D, Bosisio FM, Marotta R, Faggi S, Forlani P, Falavigna M, et al. Tissue microarray design and construction for scientific, industrial and diagnostic use. J Pathol Inform. 2012;3:42. [DOI] [PMC free article] [PubMed] [Google Scholar]
- 10.Kendsersky NM, Lindsay J, Kolb EA, Smith MA, Teicher BA, Erickson SW, et al. The B7-H3-Targeting Antibody-Drug Conjugate m276-SL-PBD Is Potently Effective Against Pediatric Cancer Preclinical Solid Tumor Models. Clin Cancer Res. 2021. [DOI] [PMC free article] [PubMed] [Google Scholar]
- 11.Sikandar SS, Pate KT, Anderson S, Dizon D, Edwards RA, Waterman ML, et al. NOTCH signaling is required for formation and self-renewal of tumor-initiating cells and for repression of secretory cell differentiation in colon cancer. Cancer research. 2010;70(4):1469–78. [DOI] [PMC free article] [PubMed] [Google Scholar]
- 12.Takebe N, Nguyen D, Yang SX. Targeting notch signaling pathway in cancer: clinical development advances and challenges. Pharmacology & therapeutics. 2014;141(2):140–9. [DOI] [PMC free article] [PubMed] [Google Scholar]
- 13.Schwanbeck R The role of epigenetic mechanisms in Notch signaling during development. Journal of cellular physiology. 2015;230(5):969–81. [DOI] [PubMed] [Google Scholar]
- 14.Boeva V, Louis-Brennetot C, Peltier A, Durand S, Pierre-Eugene C, Raynal V, et al. Heterogeneity of neuroblastoma cell identity defined by transcriptional circuitries. Nat Genet. 2017;49(9):1408–13. [DOI] [PubMed] [Google Scholar]
- 15.van Groningen T, Akogul N, Westerhout EM, Chan A, Hasselt NE, Zwijnenburg DA, et al. A NOTCH feed-forward loop drives reprogramming from adrenergic to mesenchymal state in neuroblastoma. Nat Commun. 2019;10(1):1530. [DOI] [PMC free article] [PubMed] [Google Scholar]
- 16.van Groningen T, Koster J, Valentijn LJ, Zwijnenburg DA, Akogul N, Hasselt NE, et al. Neuroblastoma is composed of two super-enhancer-associated differentiation states. Nat Genet. 2017;49(8):1261–6. [DOI] [PubMed] [Google Scholar]
- 17.Dong R, Yang R, Zhan Y, Lai HD, Ye CJ, Yao XY, et al. Single-Cell Characterization of Malignant Phenotypes and Developmental Trajectories of Adrenal Neuroblastoma. Cancer Cell. 2020;38(5):716–33 e6. [DOI] [PubMed] [Google Scholar]
- 18.Lashari BH, Vallatharasu Y, Kolandra L, Hamid M, Uprety D. Rovalpituzumab Tesirine: A Novel DLL3-Targeting Antibody-Drug Conjugate. Drugs R D. 2018;18(4):255–8. [DOI] [PMC free article] [PubMed] [Google Scholar]
- 19.Rossi A Rovalpituzumab tesirine and DLL3: a new challenge for small-cell lung cancer. Lancet Oncol. 2017;18(1):3–5. [DOI] [PubMed] [Google Scholar]
- 20.Rudin CM, Pietanza MC, Bauer TM, Ready N, Morgensztern D, Glisson BS, et al. Rovalpituzumab tesirine, a DLL3-targeted antibody-drug conjugate, in recurrent small-cell lung cancer: a first-in-human, first-in-class, open-label, phase 1 study. Lancet Oncol. 2017;18(1):42–51. [DOI] [PMC free article] [PubMed] [Google Scholar]
- 21.Morgensztern D, Besse B, Greillier L, Santana-Davila R, Ready N, Hann CL, et al. Efficacy and Safety of Rovalpituzumab Tesirine in Third-Line and Beyond Patients with DLL3-Expressing, Relapsed/Refractory Small-Cell Lung Cancer: Results From the Phase II TRINITY Study. Clin Cancer Res. 2019;25(23):6958–66. [DOI] [PMC free article] [PubMed] [Google Scholar]
- 22.Malhotra J, Nikolinakos P, Leal T, Lehman J, Morgensztern D, Patel JD, et al. A Phase 1–2 Study of Rovalpituzumab Tesirine in Combination With Nivolumab Plus or Minus Ipilimumab in Patients With Previously Treated Extensive-Stage SCLC. J Thorac Oncol. 2021. [DOI] [PubMed] [Google Scholar]
- 23.Giffin MJ, Cooke K, Lobenhofer EK, Estrada J, Zhan J, Deegen P, et al. AMG 757, a Half-Life Extended, DLL3-Targeted Bispecific T-Cell Engager, Shows High Potency and Sensitivity in Preclinical Models of Small-Cell Lung Cancer. Clin Cancer Res. 2020. [DOI] [PubMed] [Google Scholar]
- 24.Hipp S, Voynov V, Drobits-Handl B, Giragossian C, Trapani F, Nixon AE, et al. A Bispecific DLL3/CD3 IgG-Like T-Cell Engaging Antibody Induces Antitumor Responses in Small Cell Lung Cancer. Clin Cancer Res. 2020;26(19):5258–68. [DOI] [PubMed] [Google Scholar]
- 25.Saito M, Saito K, Shiraishi K, Maeda D, Suzuki H, Minamiya Y, et al. Identification of candidate responders for anti-PD-L1/PD-1 immunotherapy, Rova-T therapy, or EZH2 inhibitory therapy in small-cell lung cancer. Mol Clin Oncol. 2018;8(2):310–4. [DOI] [PMC free article] [PubMed] [Google Scholar]
Associated Data
This section collects any data citations, data availability statements, or supplementary materials included in this article.
Supplementary Materials
Data Availability Statement
Data were generated by the authors and included in the article.