

Abstract
Importance:
Hereditary hemochromatosis (HH) is an autosomal recessive genetic disorder that leads to iron overload. Conflicting results of previous research has led some to believe the brain is spared from the toxic effects of iron in HH.
Objective:
To test the association of the strongest genetic risk variant for HH on i) brain wide measures sensitive to iron deposition and ii) the rates of movement disorders, in a substantially larger sample than previous studies of its kind.
Design:
Cross-sectional retrospective study of participants from the UK Biobank. Genotype, health record and neuroimaging data was collected from January 2006 to May 2021. Data analysis was conducted from January 2021 to April 2022.
Setting:
The UK Biobank cohort is a population-based sample.
Participants:
Neuroimaging analysis consisted of 836 individuals and analysis of neurological disorders consisted of 488,288 individuals of largely northern European ancestry. Disorders tested included movement disorders [ICD10: G20-G26], abnormalities of gait and mobility [ICD10: R26], and other disorders of the nervous system [ICD10: G90–99]. 206 individuals were excluded from analysis due to withdrawal of consent.
Exposure:
Homozygosity for p.C282Y, the largest known genetic risk factor for HH.
Measures:
T2-weighted and T2* signal intensity from brain MRI scans, measures sensitive to iron deposition and clinical diagnosis of neurological disorders.
Results:
The total cohort consisted of 488,288 individuals (223,569 males) aged 49–87 years, 2,889 of whom were p.C282Y homozygotes. The neuroimaging analysis, which consisted of 165 p.C282Y homozygotes (66 male) and 671 matched controls (272 male), showed that p.C282Y homozygosity was associated with decreased T2-weighted and T2* signal intensity in subcortical motor structures (basal ganglia, thalamus, red nucleus, and cerebellum; Cohen’s d > 1) consistent with substantial iron deposition. Across the whole UK Biobank (2,889 p.C282Y homozygotes, 485,399 controls), we found a significantly increased prevalence for movement disorders in male homozygotes (OR (95% CI) = 1.80 (1.28–2.55), p=0.001), but not females (OR (95% CI) = 1.09 (0.70–1.73), p=0.69). Among the 31 p.C282Y homozygote males with a movement disorder only 10 had a concurrent HH diagnosis.
Conclusion and Relevance:
These findings indicate increased iron deposition in subcortical motor circuits in p.C282Y homozygotes and confirm an increased risk of movement disorders in homozygous males. Early treatment in HH effectively prevents the negative consequences of iron-overload in the liver and heart. Our work suggests that screening for p.C282Y homozygosity in high-risk individuals also has the potential to reduce brain iron accumulation and to reduce the risk of movement disorders among males who are homozygous for this mutation.
Introduction
Hereditary hemochromatosis (HH) is a disorder that leads to iron overload in the body. HH type 1 is predominantly related to an HFE gene mutation, with 95% of cases being homozygote for p.C282Y (p.Cyst282Tyr) mutation1. The excess iron absorbed by the body leads to an accumulation of iron in organs, particularly in the liver, resulting in increased risk for liver disease and diabetes2. With a homozygosity rate of approximately 0.6% in northern European populations, HH has been deemed the most prevalent genetic disorder in Europe3–5. The penetrance of HH and other associated diseases in p.C282Y homozygote individuals appears to be larger for males than females5, leading researchers to believe that expelling excess iron through menstruation and pregnancy lowers disease burden and penetrance in females. The primary treatment for HH is phlebotomy which appears to reduce adverse clinical outcomes3 if started early. As a result, some researchers have advocated for re-evaluating screening and early case ascertainment2.
Although the impact of HH and p.C282Y homozygosity on the liver and heart is largely accepted2,3, its effect on the central nervous system is still disputed. While some studies have reported a higher risk for Alzheimer’s and Parkinson’s disease in p.C282Y homozygote individuals6,7, other studies have reported no risk8,9 or a protective effect10. Modest sample sizes and pooled analysis across sexes may explain these conflicting results. Case studies of HH individuals experiencing neurological deficits have suggested neuroimaging abnormalities in the basal ganglia, substantia nigra, and cerebellum11,12,13, all regions known to have a substantial role in controlling movement14. However, these previous studies included only individuals diagnosed with HH, and therefore do not describe neurological deficits and abnormalities of p.C282Y homozygote individuals independent of HH diagnosis. This is important as the penetrance of p.C282Y homozygosity for an HH diagnosis is incomplete, with estimates ranging from 1 to 28%5,15. A recent analysis of brain MRI data from 206 p.C282Y homozygote individuals taken from the UK Biobank16 examined T2* signal in a limited set of predefined anatomical regions of interest (ROIs), and found evidence of increased iron deposition in subcortical structures and cerebellum for p.C282Y homozygote individuals.
Since many of the brain regions affected by p.C282Y homozygosity are known to play a role in motor circuits/control17 and given case reports of movement deficits in HH individuals6,7,11,12, we investigated the relationship between p.C282Y homozygosity and movement disorders in 488,288 individuals from the UK Biobank, leveraging novel imaging methods that permit greater granularity of associations across the brain. Specifically, we investigated: i) the impact of p.C282Y homozygosity on whole brain voxel-wise measures of iron deposition; ii) the association of p.C282Y homozygosity with movement disorders, testing for overlap with HH diagnosis.
Methods
UK Biobank Sample
Genotypes, MRI scans, demographic and clinical data were obtained from the UK Biobank under accession number 27412, excluding 206 participants who withdrew their consent. All participants provided electronic signed informed consent and the study was approved by the UK Biobank Ethics and Governance Council. This resulted in a total sample of 488,288 individuals (223,569 males) with a mean age of 69.0 years (standard deviation 8.1 years). We used UK Biobank v3 imputed genotype data, quality control is described elsewhere18. From this sample, 2,889 individuals (1,293 male) were identified as homozygote for p.C282Y (A/A at rs1800562). As previous research does not indicate intermediate disease burden for p.C282Y heterozygotes2, we coded control individuals as homozygote for no risk allele (G/G at rs1800562) or heterozygote (A/G at rs1800562), i.e., with a recessive model of inheritance. This resulted in 485,399 controls (222,276 male). The recruitment period for participants was from 2006 to 2010. Genotype, health record and neuroimaging data was collected from January 2006 to May 2021. Data analysis was conducted from January 2021 to April 2022. This study follows the Strengthening the Reporting of Observational Studies in Epidemiology (STROBE) reporting guideline for cross-sectional studies19.
Neuroimaging Analysis
Image acquisition
T1 weighted and diffusion weighted scans were collected from three scanning sites throughout the United Kingdom, all on identically configured Siemens Skyra 3T scanners, with 32-channel receiver head coils. For diffusion scans, multiple scans with no diffusion gradient were collected (b=0 s/mm2) to fit diffusion models. The average of these b=0 scans was used as voxel-wise measures of T2-weighted intensities. Diffusion-weighted scans were collected using a SE-EPI sequence at 2mm isotropic resolution. T1 scans were collected using a 3D MPRAGE sequence at 1mm isotropic resolution. Voxel-wise T2* values were estimated as part of the susceptibility-weighted imaging protocol at a voxel resolution of 0.8×0.8×3mm and with two echoes (TE=9.42,20ms). To reduce noise, T2* images were spatially filtered (3×3x1median filtering followed by limited dilation to fill missing data holes). Further details of image acquisition and processing can be found here20.
Image Preprocessing
Scans were corrected for nonlinear transformations provided by MRI scanner manufacturers21,22, and T2-weighted, and T2* images were registered to T1 weighted images using mutual information23. Intensity inhomogeneity correction was performed by applying smoothly varying, estimated B1-bias field24. Images were rigidly registered and resampled into alignment with a pre-existing, in-house, averaged, reference brain with 1.0 mm isotropic resolution24. See supplementary methods for further description of atlas registration and regions of interest.
Covariate Matched Controls
From the full 2,889 p.C282Y homozygotes, only 165 had qualified imaging. As we did not want to have a large imbalance between the number of controls and p.C282Y homozygotes, we selected covariate matched controls at a ratio of 4:1 (controls:cases) as this ratio provides maximal power to discover associations25, see supplementary materials for details. This resulted in 154 p.C282Y homozygotes (64 male) and 595 controls (248 male) for T2-weighted scans and 165 (66 male) p.C282Y homozygotes and 671 (272 male) controls for T2*/R2* from susceptibility-weighted scans.
Statistical analysis
Uncorrected mean T2* values were taken for each voxel, after which the reciprocal of each voxel (1/T2*) was calculated to compute mean R2* values across the brain for 671 matched controls. This gave more spatially smooth estimates when compared to computing R2* values and then taking the mean. R2* has been shown to be linearly proportional to iron concentration26. We used a previously published estimate linking R2* values on 3T MRI scanners to iron concentration from biopsied liver tissue to relate our R2* values to estimated levels of iron27,28. This previous work estimated Iron Concentration [μg/g dry] = C × R2*[Hz]/3.2, where C = 2000/36 to convert from μmol of iron to μg.
General linear models (GLMs) were applied univariately to test the association between p.C282Y homozygosity and a) T2-weighted and b) T2*. Each voxel-wise T2-weighted/T2* intensity was pre-residualized for age, sex, scanner, and top ten principal components of genetic ancestry. We then calculated Cohen’s d effect sizes as the residualized voxel-wise differences between p.C282Y homozygotes and controls divided by the pooled estimate of the standard deviation. We additionally ran a model to test the association between p.C282Y homozygosity and R2* intensities. For this, we pre-residualized T2* intensities for the covariates listed above and clipped outlier subjects on a per voxel basis to the nearest non-outlier value if they were more than three median absolute deviations from the median. Next, we computed the reciprocal of each voxel to obtain a residualized and outlier clipped R2* measure. This R2* value was then associated with p.C282Y homozygosity to obtain beta estimates and p values. We related R2* beta estimates to iron concentration as described above. Supplementary materials contain details sex-stratified and p.C282Y heterozygosity imaging analysis.
Neurological Disease Burden Analysis
Given our neuroimaging findings of substantially lower T2-weighted and T2* intensities – indicative of iron deposition – for p.C282Y homozygotes in motor circuits of the brain, we wanted to test if p.C282Y homozygosity imparted any risk for i) movement disorders, ii) gait disorders, and iii) a broad category of neurological disorders. As imaging was not an inclusion criterion for this portion of the analysis, we included the entire sample listed above. We did not perform any covariate-matching of controls. We fit sex-agnostic logistic models in the full sample and sex stratified logistic models in 223,569 males (1,293 p.C282Y homozygote) and 264,719 females (p.C282Y 1,596 homozygote), separately, to predict diagnosis from p.C282Y homozygosity status controlling for age and top ten principal components of genetic ancestry (sex-agnostic models also had a fixed effect of sex). We fit three models sex-agnostic (full sample) and for each sex to test the domains described above, predicting: movement disorders [ICD10: G20-G26], abnormalities of gait and mobility [ICD10: R26], and other disorders of the nervous system [ICD10: G90–99]. We fit an additional three models, two for the most prevalent movement disorders (Parkinson’s disease [ICD10: G20] and essential tremor [ICD10: G25]), as well as a super-category of significantly associated diagnoses combining a diagnosis of either a) movement disorders or b) other disorders of the nervous system into a single outcome. Supplementary analysis tested these models using p.C282Y heterozygosity status.
Results
Neuroimaging
Iron accumulation reduces both T2 and T2* relaxation times in MRI, with T2* thought to be more specific to iron29 and its relaxation rate R2* (1/T2*) shown to be linearly proportional to iron concentration26. Conversely, T2 relaxation times are additionally sensitive to other effects such as edema and gliosis30 in addition to iron accumulation. Firstly, we visualize the mean R2* values across the brain in controls and relate this to estimates of iron concentration28 to gain a baseline understanding of iron distribution across the brain. Next, we assess the impact of p.C282Y homozygosity on both T2-weighted and T2* voxel-wise intensities.
Baseline R2* Distribution
Figure 1 shows mean values of R2* for control individuals (671 individuals). We see the pallidum, sub-thalamic nucleus and red nucleus display higher mean R2* values – consistent with higher iron deposition in these regions. With R2* being proportional to iron concentration26, we also indicate estimated iron concentration values. This distribution is consistent both with previous neuroimaging studies of R2*31 as well as direct estimates of iron concentration from postmortem brain samples32.
Figure 1.
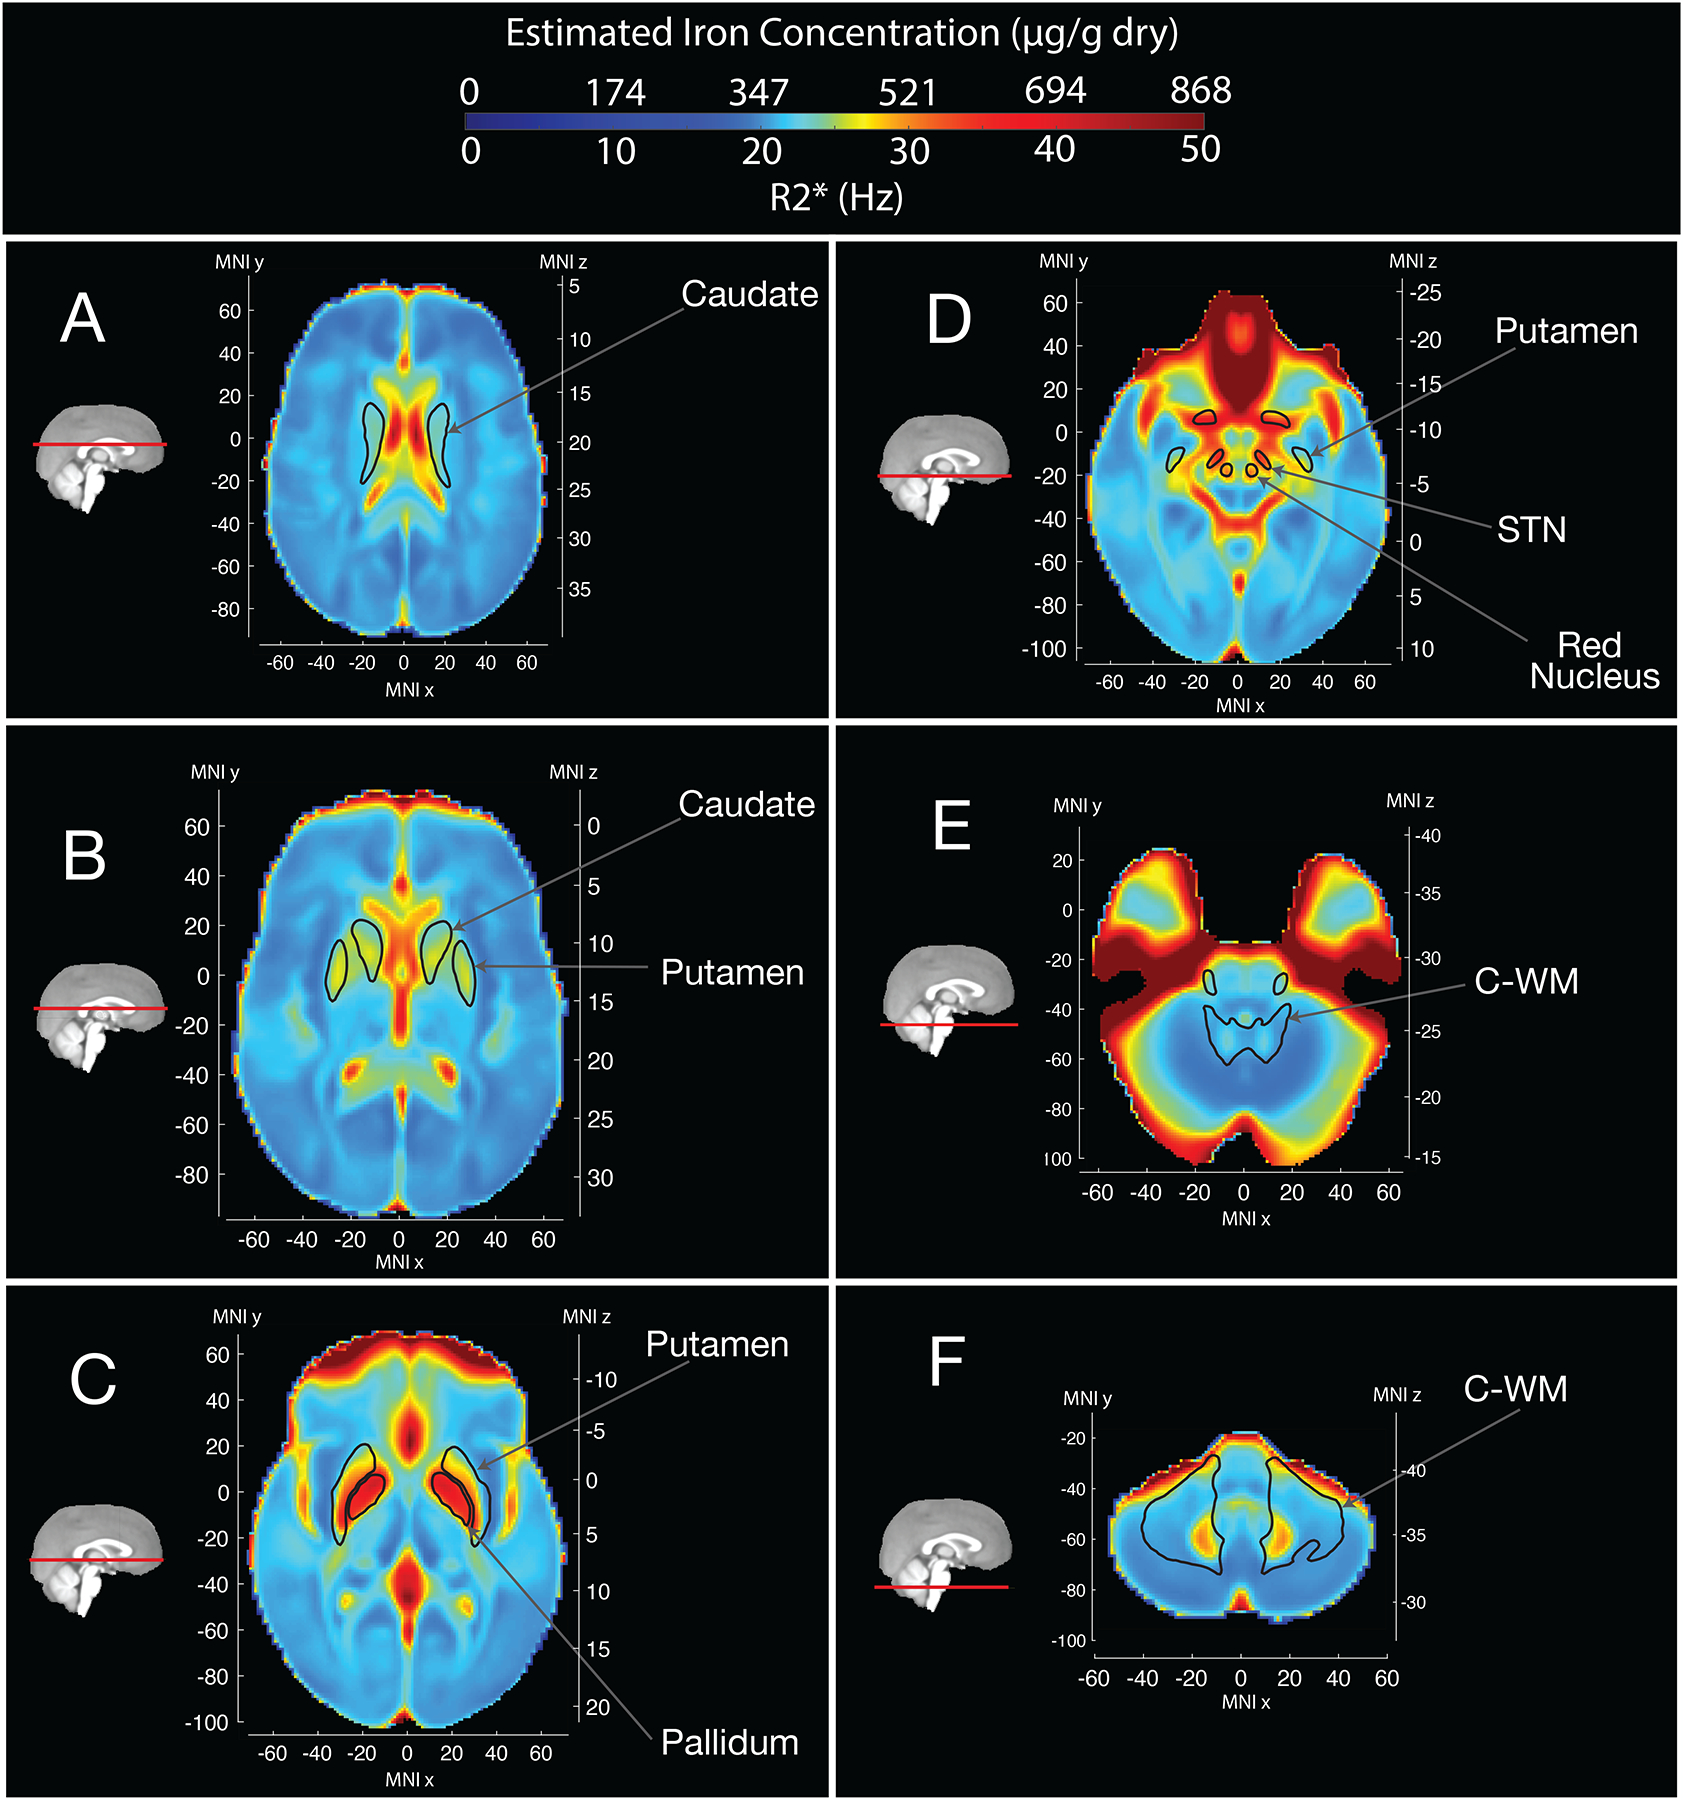
Mean R2* values and Estimated Iron Concentration across the brain for control individuals.
Higher mean R2* values are observed in the pallidum, sub-thalamic nucleus (STN) nigra and red nucleus. As R2* is directly proportional to iron concentration, we estimated iron concentration from R2* values (see methods). Saturated signal in anterior regions is due to loss of T2* signal related to the proximity of sphenoid sinuses and nasal cavity47.
Neuroimaging Associations
We performed a voxel-wise analysis of T2-weighted and T2* intensities (lower intensities consistent with higher iron deposition33) using p.C282Y homozygosity status as our predictor of interest – see Table 1 for sample sizes. We found that voxel-wise associations were largely overlapping for T2-weighted and T2* images – Figure 2, eFigures 1 & 2. Overall, we observed larger effect sizes for T2-weighted scans vs. T2* values (eFigure 2) – with on average effects being 30% reduced for T2* associations. p.C282Y homozygosity was associated with lower T2-weighted intensities in bilateral caudate nucleus, putamen, thalamus (specifically the ventral-anterior, ventral-lateral dorsal, ventral-lateral ventral, and pulvinar nuclei (regions defined from34)), red nucleus, sub-thalamic nucleus, and both white and grey matter of the cerebellum (Figure 2). Additionally, we observed higher T2-weighted intensities in the white matter of the superior cerebellar peduncle, which comprises the primary output pathway from the cerebellum to the thalamus and red nucleus, possibly indicating gliosis in this region35,36. T2* images showed a similar overall distribution of associations except for the red nucleus, sub-thalamic nucleus, and cerebellar white matter where significant associations were only seen in T2-weighted analysis (compare panels D and E of Figure 2 with respective panels in eFigure 1) – possibly indicating processes not related to iron accumulation or saturation of the T2* signal in these regions. eFigure 3 displays mean differences in R2* (1/T2*) between p.C282Y homozygotes and controls and relates this to estimated differences in iron concentration. This figure displays peak differences in estimated iron concentration in the pulvinar nucleus and dentate nucleus of the cerebellum. Despite the pallidum’s high iron content (Figure 1), we did not find T2-weighted or T2* associations for p.C282Y homozygosity in this region. Sex-stratified analysis of T2-weighed scans revealed similar associations in males and females, but with p.C282Y homozygote females having on average approximately 28% smaller effect sizes than males (eFigures 4–5). Supplementary analysis showed that p.C282Y heterozygosity was associated with a very similar regional pattern of T2-weighted intensity albeit with substantially smaller effect sizes (eFigure 6–7). Using R2* imaging we estimated that p.C282Y heterozygosity was associated with an average iron concentration increase of 4.93μg/g dry compared to 30.00 μg/g dry for p.C282Y homozygotes in affected brain regions – see supplementary materials. eFigure 8 displays the differential age trajectories of mean T2-weighted intensities for p.C282Y genotype groups, indicating that all genotype groups show evidence consistent with iron accumulation over age but that the progression appears to be faster in later years for p.C282Y homozygotes.
Table 1.
Sample size for each analysis.
| Neuroimaging | Neurological Disease Analysis | ||
|---|---|---|---|
| T2-weighted | T2*/R2* | ||
| Sample Size | 749 (312 male) | 836 (338 male) | 488,288 (223,569 male) |
| p.C282Y Homozygotes | 154 (64 male) | 165 (66 male) | 2,889 (1,293 male) |
Figure 2.
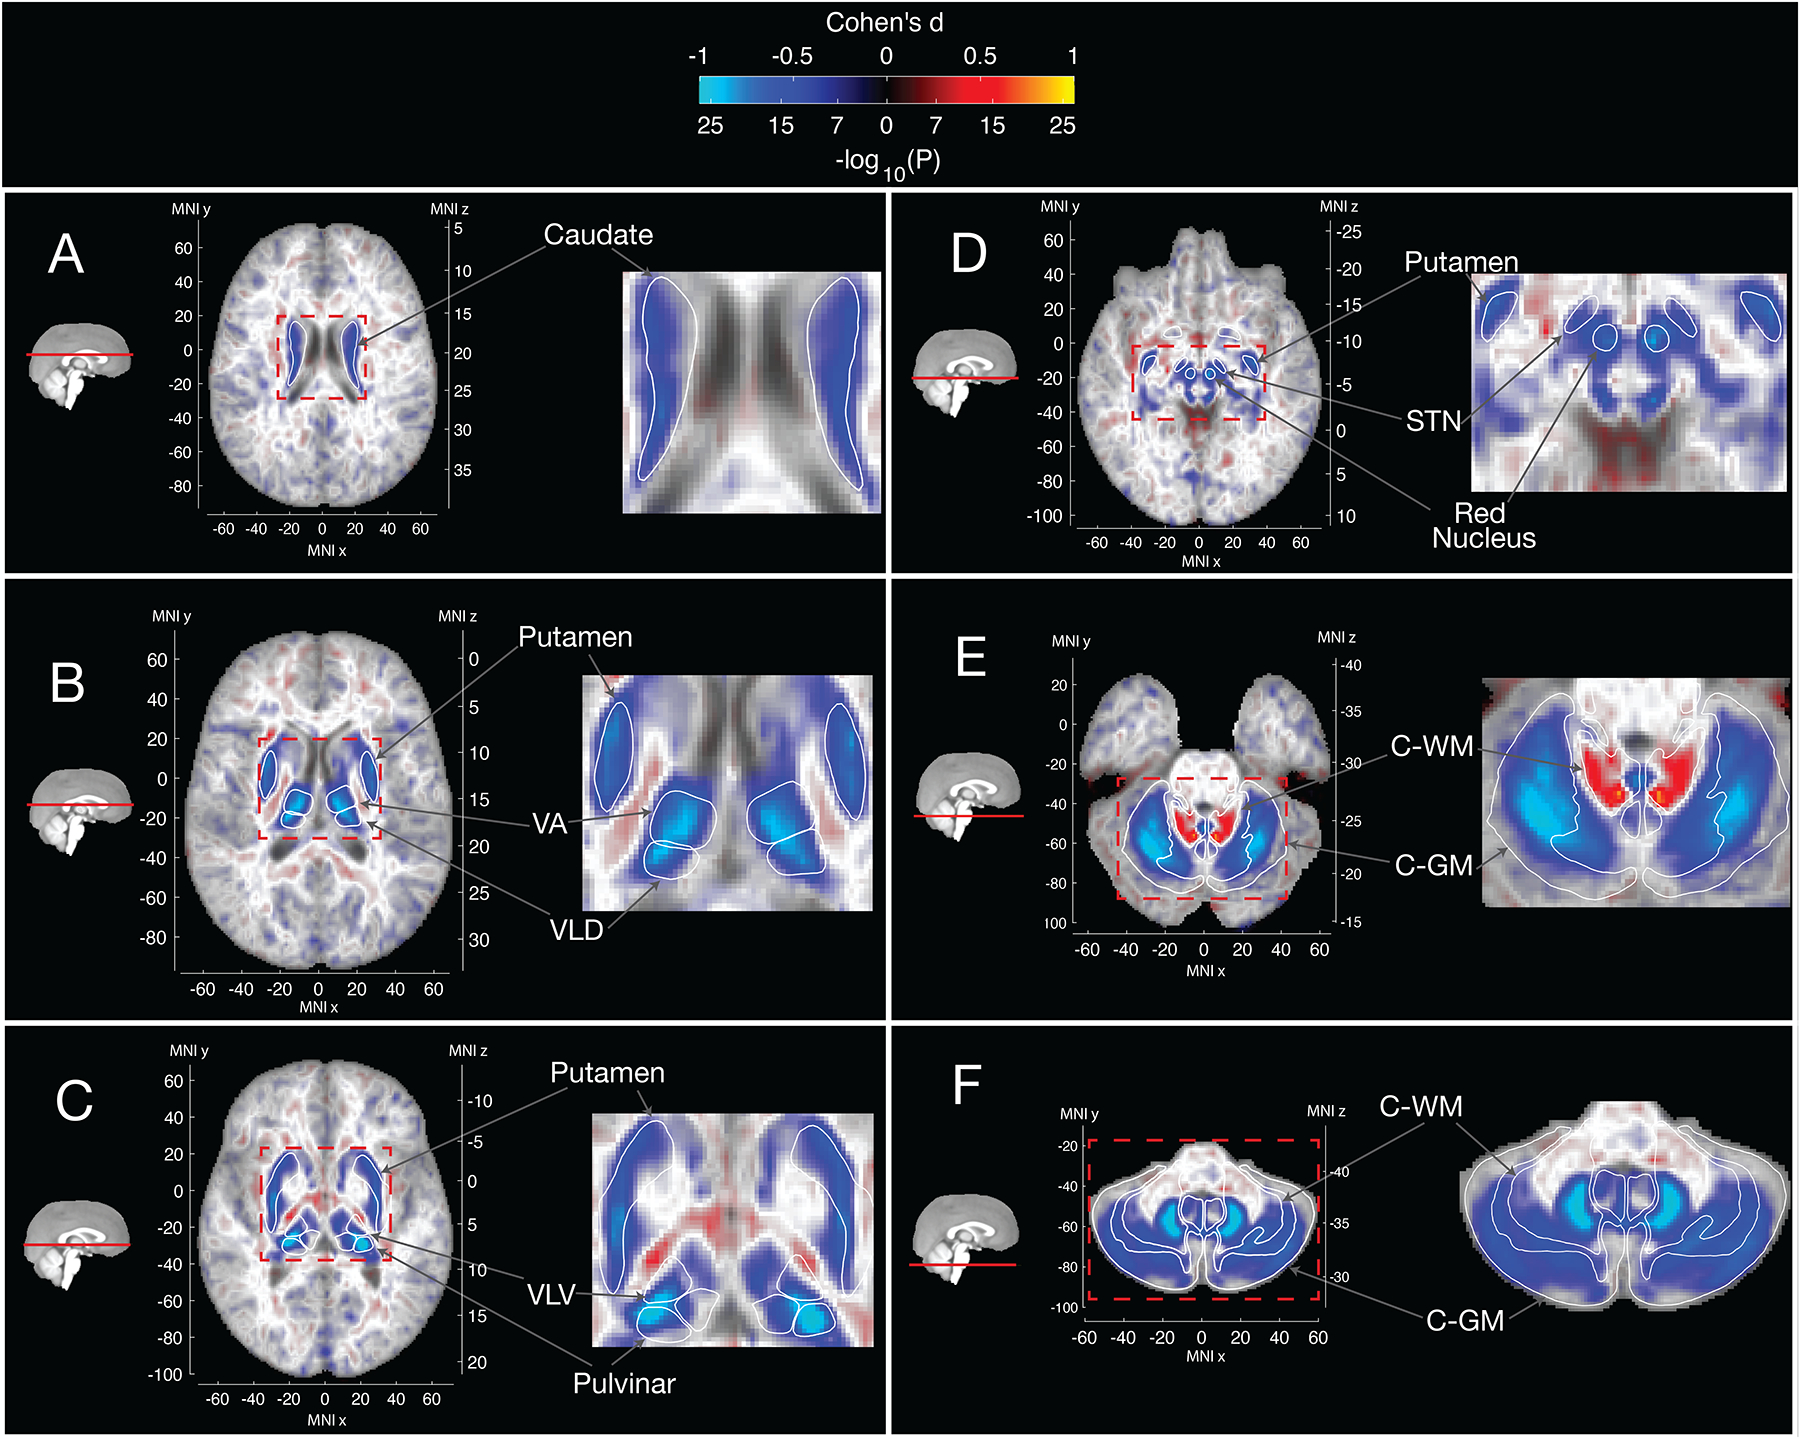
Voxelwise associations of T2-weighted intensities with p.C282Y Homozygosity Status
Blue regions represent lower T2-weighted intensities for p.C282Y homozygotes. Lower T2-weighted intensities are observed for p.C282Y homozygotes in the A. caudate nucleus, B. putamen, ventral anterior and ventral-lateral dorsal nuclei of the thalamus, C. ventral-lateral ventral and pulvinar nuclei of the thalamus, D. red nucleus, sub-thalamic nucleus, E. and F. the cerebellum particularly the dentate nucleus. Higher T2-weighted intensities are observed in E. in the superior cerebellar peduncle (primary output pathway connecting the cerebellum to the thalamus and red nucleus). Large effect voxels |Cohen’s d|>0.5 are shown with full opacity, smaller effect voxels are shown with linearly variable transparency such that voxels around Cohen’s d=0 are almost completely transparent against the template.
Neurological Disease Burden Analysis
The brain regions identified in our neuroimaging analysis are all implicated as important nodes in brain circuits responsible for motor control17,37. We, therefore, aimed to determine if p.C282Y homozygote individuals were specifically enriched for movement disorders and other disorders of the nervous system. Table 1 displays the sample size for this analysis. In sex-agnostic models we found that p.C282Y homozygotes had a higher chance of developing either movement disorders or other disorders o the nervous system (OR (95% CI) = 1.29 (1.07–1.56), p=0.008), this appeared to be driven more by risk for movement disorders (OR (95% CI) = 1.46 (1.11–1.92), p=0.007) than by other disorders of the nervous system (OR (95% CI) = 1.19 (0.93–1.52), p=0.17). As males appear to have a greater penetrance for HH and other associated diseases2, we performed a sex-stratified analysis. We found that p.C282Y homozygote males had a higher chance of being diagnosed with either a movement disorder or other disorders of the nervous system (OR (95% CI) = 1.57 (1.22–2.01), p=0.0004). This association appeared to be driven more by movement disorder diagnoses (OR (95% CI) = 1.80 (1.28–2.55), p=0.001) than by diagnosis of other disorders of the nervous system (OR (95% CI) = 1.39 (1.00–1.93), p=0.049). The International Classifications for Diseases (ICD) chapter of movement disorders includes Parkinson’s disease and essential tremor, which were both associated with p.C282Y homozygosity in males (Parkinson’s disease: OR (95% CI) = 1.83 (1.19–2.80), p=0.006 and essential tremor: OR (95% CI) = 2.02 (1.14–3.58), p=0.02). p.C282Y homozygote males did not have a higher chance of being diagnosed with gait or mobility disorders (OR (95% CI) = 0.90 (0.61–1.31), p=0.57). No significant associations were found for p.C282Y homozygote females for any diagnosis tested – see Figure 3 panel A and eTable 3. p.C282Y heterozygosity was not associated with any diagnosis tested (eFigure 9 and eTables 4–5). In supplementary results we found that within p.C282Y homozygotes regional T2-weighted intensity was not associated clinical diagnosis (see eFigure 10) although this should be interpreted with caution given the very small number of samples available to perform this test.
Figure 3.
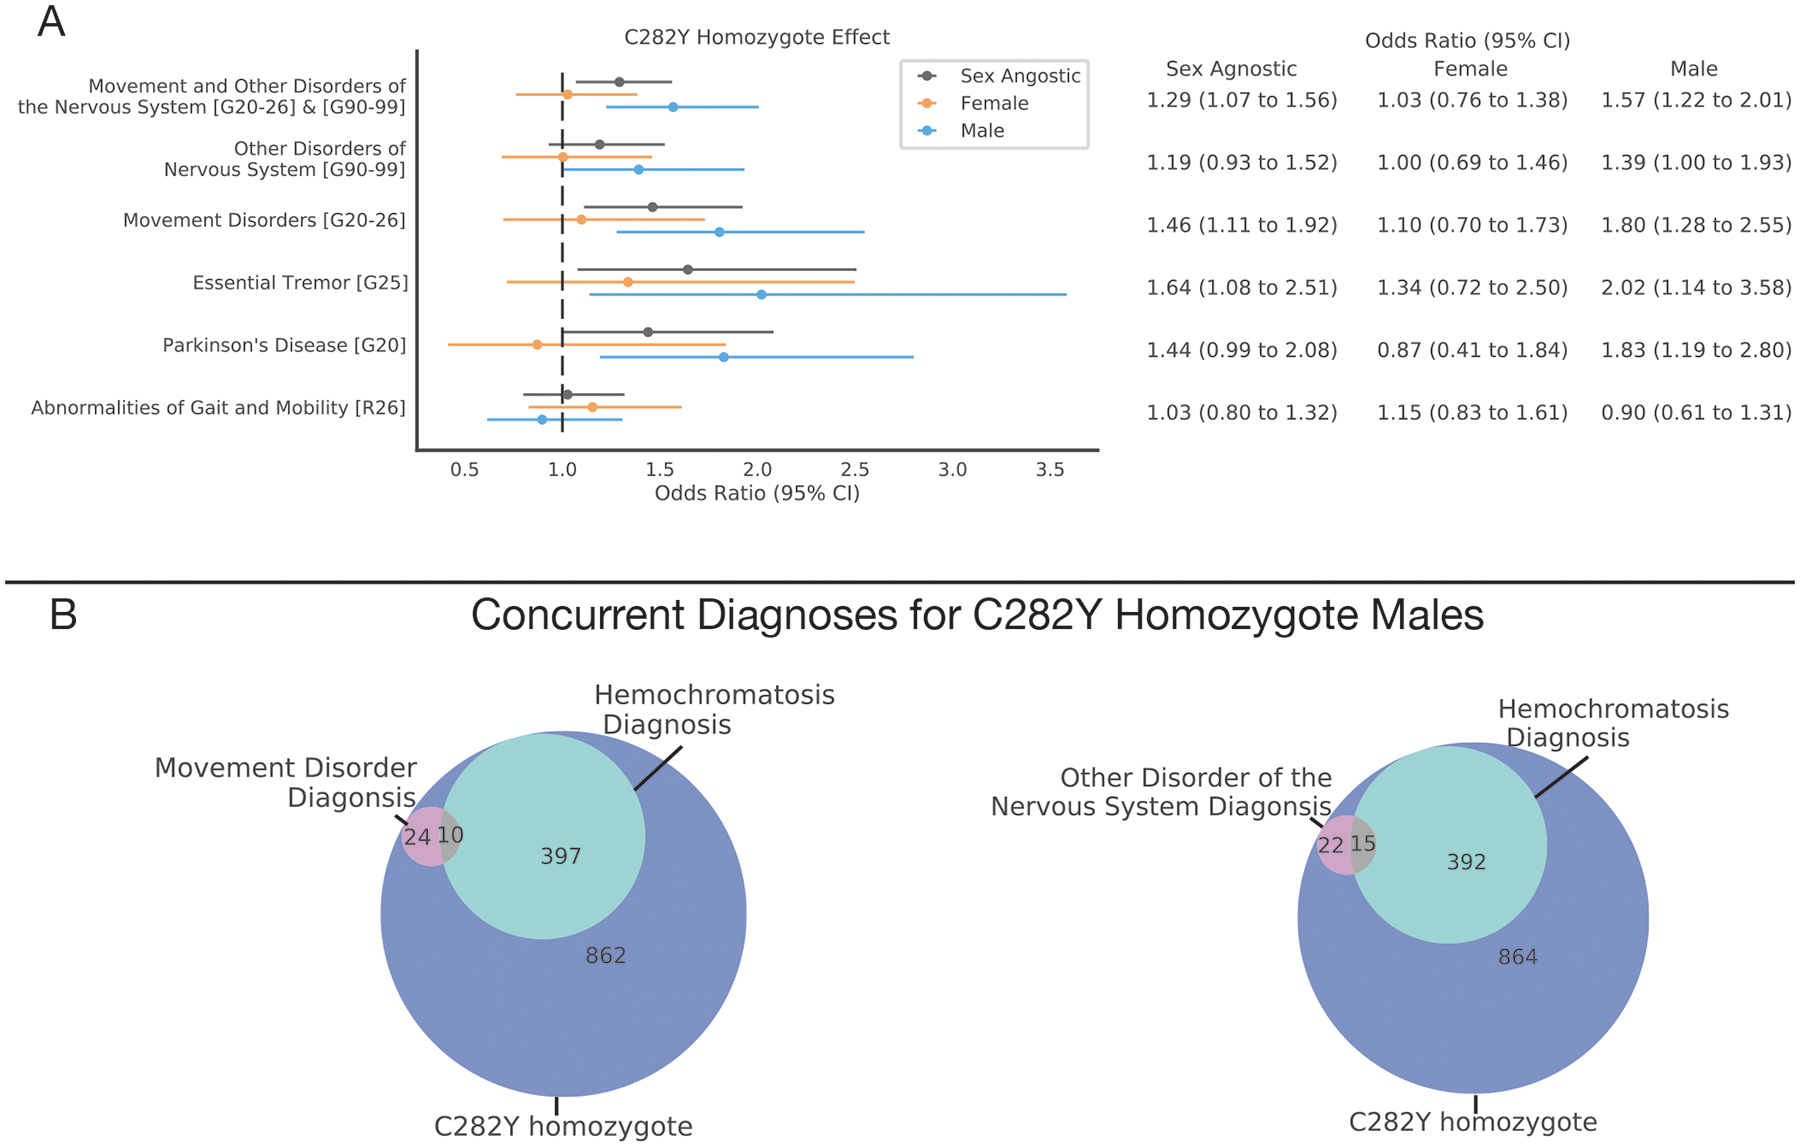
Neurological Disease Burden Analysis for p.C282Y Homozygotes
A. Sex agnostic and sex-stratified effect of C282Y homozygosity for neurological disorders (y-axis), values in square brackets indicate ICD10 codes or ranges of ICD10 codes for categories of diagnoses. The dotted vertical line indicates an odds ratio of 1 i.e., null effect. B. Venn diagrams indicating diagnosis overlap for C282Y homozygote males of hemochromatosis and i) movement disorders or ii) other disorders of the nervous system.
The convergence of our neuroimaging and genetic associations on movement-related circuits of the brain and movement disorders suggests that p.C282Y homozygosity may lead to brain pathology even in sub-clinical HH cases. We, therefore, looked at the overlap between individuals with neurological diagnoses and a clinical diagnosis of hemochromatosis for p.C282Y homozygote males. We found that for p.C282Y homozygote males with a movement disorder diagnosis (31 individuals), the majority (21 individuals) did not have a concurrent HH diagnosis. We found a similar pattern for other nervous system disorders where 15 out of 37 men had a concurrent hemochromatosis diagnosis – see Figure 3 panel B.
Discussion
We found the most prominent genetic risk factor for HH, p.C282Y homozygosity, was associated with substantially lower T2-weighted and T2* intensities in brain regions related to motor control - consistent with increased iron deposition in these regions. Furthermore, p.C282Y homozygosity in males (but not females) was associated with increased risk for movement-related disorders and other nervous system disorders. These results are consistent with previous case reports of movement disorders in HH individuals11,12 and a higher disease burden for p.C282Y homozygote males vs. females2,3. Moreover, we found that most p.C282Y homozygote males diagnosed with either i) a movement disorder or ii) another disorder of the nervous system did not have a concurrent hemochromatosis diagnosis. This is important given the difference in treatment for HH and movement disorders3,38.
These imaging-clinical associations in p.C282Y homozygote males are consistent with a class of disorders termed ‘Neurodegeneration with Brain Iron Accumulation’ (NBIA), in which rare genetic mutations lead to iron deposition in the basal ganglia39. This iron deposition is believed to lead to oxidative damage of these brain regions impairing their function and resulting in movement deficits. Hemochromatosis has traditionally not been included as a cause of NBIA. Previous studies of the neurological manifestations of p.C282Y homozygosity6–10 have had conflicting results likely related to small sample sizes, lack of stratification based on sex, and biased subject ascertainment. The current study addresses these issues by conducting disease associations in a sample 500 times larger than the previously listed studies, performing sex-stratified analysis, and selecting individuals on genotype, not disease status. We believe our voxelwise neuroimaging results provide strong support that p.C282Y homozygosity imparts large, selective effects on subcortical structures known to function as key nodes in the brain’s motor circuits and suggest revisiting p.C282Y homozygosity as a form of NBIA, albeit with reduced penetrance.
The globus pallidus is a region that shows prominent iron deposition even in healthy individuals31,32 and large amounts of iron deposition, manifesting as low T2/ T2* intensity, in many NBIA disorders39,40. However, we did not see differences in T2-weighted or T2* intensity in the globus pallidus related to p.C282Y homozygosity in our population (Figure 2 and eFigure 1). This lack of association could be due to a genuine lack of increased iron deposition in the pallidum in p.C282Y homozygotes compared to other NBIA disorders. Alternatively, it may reflect decreased sensitivity to detect associations in this region because control individuals in our sample of predominantly older adults (mean age 69 years) may already exhibit such high levels of palladal iron deposition to introduce a ‘ceiling effect’ in our ability to measure further iron deposition through R2* (Figure 1). Indeed, although the pallidum shows increasing iron deposition with age, by the lower age range of this sample (50 years) R2* values in the globus pallidus appear to plateau41. Other imaging methods/protocols (e.g. multiexponential R2* models42) may be more sensitive at detecting associations in this high iron region. Further research will be needed to understand the cause of this lack-of-effect in the pallidum and whether additional iron accumulation or other pathological processes are occurring in this region of p.C282Y homozygotes.
Our neuroimaging results are consistent with iron accumulation in associated regions of the brain; however, we observed larger associations in T2-weighted vs T2* images. Despite both imaging modalities being inversely related to iron deposition, T2* is thought to be more directly sensitive to iron, whereas T2-weighted signal is also sensitive to other processes such as edema and gliosis30. In some regions, such as the red nuclei and subthalamic nuclei, we observed decreased intensity in p.C282Y homozygotes only on T2-weighted, and not T2*, images. This may reflect the same T2* ‘ceiling’ effect that we hypothesized above to contribute to a lack-of-effect in the pallidum. In contrast, in other regions, such as the white matter of the superior cerebellar peduncle, we observed increased intensity in p.C282Y homozygotes compared to controls, again only on T2-weighted, not T2* images. This increased T2 intensity may reflect gliosis in the context of the microstructural changes in the cerebellar peduncles that have been described in individuals with essential tremor35,36.
Our disease burden analysis revealed that males who are homozygous for p.C282Y have sizable increased risk for a diagnosis of movement disorders in general (OR=1.80), and both Essential Tremor and Parkinson’s Disease in particular (OR=2.02, 1.83, respectively). Furthermore, post mortem samples and in-vivo imaging of individuals diagnosed with Parkinson’s disease show iron deposition in many of the brain regions we identified43. Interestingly, however, the most recent genome-wide association study (GWAS) of Parkinson’s disease in males did not identify the variant at position p.C282Y as a risk factor (p=0.16)44. We hypothesize this is likely due to the GWAS standard additive model of inheritance employed in that study, in which an additional copy of a risk allele imparts a dose-dependent risk. Consistent with findings from previous literature of HH2, here we tested a recessive model of inheritance and observed a relatively sizeable increased risk for Parkinson’s disease with an odds ratio of 1.83, which would be within the 5×10⁻⁶ percentile of effect sizes from the most significant previous GWAS of Parkinson’s disease in males45. Despite the relatively large effect size, this variant will only explain a small number of overall Parkinson’s disease cases and most p.C282Y homozygotes will not develop movement disorders. Further work needs to be done to verify the size and confidence of this association in other ancestry groups and populations, particularly given the non-uniform distribution of p.C282Y across the globe (eFigure 11).
Finally, our sex-stratified T2-weighted neuroimaging analysis revealed that female p.C282Y homozygotes had overlapping associations with males however with reduced effect sizes (28% reduced on average) – indicating a smaller amount of iron deposition in female homozygotes. If a critical amount of iron deposition is required to impart additional risk for movement disorders, this may explain why we observed an increase in movement disorder risk for p.C282Y homozygote males but not females – i.e. because homozygote females have not accumulated enough iron to reach this threshold. As menstruation appears to act to prevent iron overload in HH3, the neuroimaging results in women in our sample, where the average age of women was 64 years old, may reflect the more modest results of post-menopausal accumulation of iron. It has also been suggested that estrogen may play an antioxidant role that could moderate the damaging effects of iron and make women more resilient to its accumulation46.
Together, our results provide convergent evidence that p.C282Y homozygosity is associated with iron deposition in the brain’s motor circuits and increased risk for neurological movement disorders. Specifically, they suggest that p.C282Y homozygosity is a significant risk factor for movement disorders – including Parkinson’s disease and essential tremor – in males, and that most p.C282Y homozygous individuals, including those with comorbid movement disorders, do not have a clinical diagnosis of HH. Given the success of early treatment of HH in preventing the negative health manifestations of the disease outside of the nervous system3, our findings suggest an additional potential benefit to consider in discussions around the public health implications of early genetic screening in populations with a high prevalence of this variant.
Supplementary Material
Key points:
Question:
To what extent does genetic risk for hemochromatosis affect the brain and contribute to risk for neurological disorders?
Finding:
In this observational study that included 836 participants we found that individuals who were at high genetic risk for developing hemochromatosis had MRI scans indicating substantial iron deposition localized to motor circuits of the brain. Further analysis in 488,288 individuals revealed that males, but not females, with high genetic risk for hemochromatosis were at 1.80 fold increase risk for developing a movement disorder, with the majority of these individuals not having a concurrent diagnosis for hemochromatosis.
Meaning:
Genetic risk for hemochromatosis is associated with abnormal iron deposition in motor circuits and increased risk of movement disorders, regardless of formal diagnosis of hemochromatosis. As effective treatment exists for hemochromatosis that reduces iron overload, this treatment may prove beneficial for males at genetic risk for hemochromatosis that present with movement disorders.
Funding:
R.L was supported by Kavli Innovative Research Grant under award number 2019-1624. C.F. was supported by grant R01MH122688 and RF1MH120025 funded by the National Institute for Mental Health (NIMH).
Conflict of Interest:
A.M.D. reports that he was a Founder of and holds equity in CorTechs Labs, Inc., and serves on its Scientific Advisory Board. He is a member of the Scientific Advisory Board of Human Longevity, Inc. He receives funding through research grants from GE Healthcare to UCSD. The terms of these arrangements have been reviewed by and approved by UCSD in accordance with its conflict-of-interest policies. No other authors report a conflict of interest.
Bibliography
- 1.Adams PC. Epidemiology and diagnostic testing for hemochromatosis and iron overload. Int J Lab Hematol. 2015;37(S1):25–30. doi: 10.1111/ijlh.12347 [DOI] [PubMed] [Google Scholar]
- 2.Pilling LC, Tamosauskaite J, Jones G, et al. Common conditions associated with hereditary haemochromatosis genetic variants: Cohort study in UK Biobank. BMJ. 2019;364. doi: 10.1136/bmj.k5222 [DOI] [PMC free article] [PubMed] [Google Scholar]
- 3.Powell LW, Seckington RC, Deugnier Y. Haemochromatosis. Lancet. 2016;388(10045):706–716. doi: 10.1016/S0140-6736(15)01315-X [DOI] [PubMed] [Google Scholar]
- 4.Bomford A Genetics of haemochromatosis. Lancet. 2002;360(9346):1673–1681. doi: 10.1016/S0140-6736(02)11607-2 [DOI] [PubMed] [Google Scholar]
- 5.Allen KJ, Gurrin LC, Constantine CC, et al. Iron-Overload–Related Disease in HFE Hereditary Hemochromatosis. N Engl J Med. 2008;358(3):221–230. doi: 10.1056/nejmoa073286 [DOI] [PubMed] [Google Scholar]
- 6.Dekker MCJ, Giesbergen PC, Njajou OT, et al. Mutations in the hemochromatosis gene (HFE), Parkinson’s disease and parkinsonism. Neurosci Lett. 2003;348(2):117–119. doi: 10.1016/S0304-3940(03)00713-4 [DOI] [PubMed] [Google Scholar]
- 7.Guerreiro RJ, Bras JM, Santana I, et al. Association of HFE common mutations with Parkinson’s disease, Alzheimer’s disease and mild cognitive impairment in a Portuguese cohort. BMC Neurol. 2006;6:1–8. doi: 10.1186/1471-2377-6-24 [DOI] [PMC free article] [PubMed] [Google Scholar]
- 8.Aamodt AH, Stovner LJ, Thorstensen K, Lydersen S, White LR, Aasly JO. Prevalence of haemochromatosis gene mutations in Parkinson’s disease. J Neurol Neurosurg Psychiatry. 2007;78(3):315–317. doi: 10.1136/jnnp.2006.101352 [DOI] [PMC free article] [PubMed] [Google Scholar]
- 9.Akbas N, Hochstrasser H, Deplazes J, et al. Screening for mutations of the HFE gene in Parkinson’s disease patients with hyperechogenicity of the substantia nigra. Neurosci Lett. 2006;407(1):16–19. doi: 10.1016/j.neulet.2006.07.070 [DOI] [PubMed] [Google Scholar]
- 10.Buchanan DD, Silburn PA, Chalk JB, Le Couteur DG, Mellick GD. The Cys282Tyr polymorphism in the HFE gene in Australian Parkinson’s disease patients. Neurosci Lett. 2002;327(2):91–94. doi: 10.1016/S0304-3940(02)00398-1 [DOI] [PubMed] [Google Scholar]
- 11.Kumar N, Rizek P, Sadikovic B, Adams PC, Jog M. Movement disorders associated with hemochromatosis. Can J Neurol Sci. 2016;43(6):801–808. doi: 10.1017/cjn.2016.286 [DOI] [PubMed] [Google Scholar]
- 12.Nielsen JE, Jensen LN, Krabbe K. Hereditary haemochromatosis: A case of iron accumulation in the basal ganglia associated with a parkinsonian syndrome. J Neurol Neurosurg Psychiatry. 1995;59(3):318–321. doi: 10.1136/jnnp.59.3.318 [DOI] [PMC free article] [PubMed] [Google Scholar]
- 13.Berg D, Hoggenmüller U, Hofmann E, et al. The basal ganglia in haemochromatosis. Neuroradiology. 2000;42(1):9–13. doi: 10.1007/s002340050002 [DOI] [PubMed] [Google Scholar]
- 14.Burn D Oxford Textbook of Movement Disorders. Oxford, UK: Oxford University Press; 2013. doi: 10.1093/med/9780199609536.001.0001 [DOI] [Google Scholar]
- 15.Beutler E, Felitti VJ, Koziol JA, Ho NJ, Gelbart T. Penetrance of 845G → A (C282Y) HFE hereditary haemochromatosis mutation in the USA. Lancet. 2002;359(9302):211–218. doi: 10.1016/S0140-6736(02)07447-0 [DOI] [PubMed] [Google Scholar]
- 16.Atkins JL, Pilling LC, Heales CJ, et al. Hemochromatosis mutations, brain iron imaging, and dementia in the UK Biobank cohort. J Alzheimer’s Dis. 2021;79(3):1203–1211. doi: 10.3233/JAD-201080 [DOI] [PMC free article] [PubMed] [Google Scholar]
- 17.Burn D Oxford Textbook of Movement Disorders. Oxford, UK: Oxford University Press; 2013. doi: 10.1093/med/9780199609536.001.0001 [DOI] [Google Scholar]
- 18.Bycroft C, Freeman C, Petkova D, et al. The UK Biobank resource with deep phenotyping and genomic data. Nature. 2018;562(7726):203–209. doi: 10.1038/s41586-018-0579-z [DOI] [PMC free article] [PubMed] [Google Scholar]
- 19.Von Elm E, Altman DG, Egger M, Pocock SJ, Gøtzsche PC, Vandenbroucke JP. The Strengthening the Reporting of Observational Studies in Epidemiology (STROBE) statement: Guidelines for reporting observational studies. Epidemiology. 2007;18(6):800–804. doi: 10.1097/EDE.0b013e3181577654 [DOI] [PubMed] [Google Scholar]
- 20.Alfaro-Almagro F, Jenkinson M, Bangerter NK, et al. Image processing and Quality Control for the first 10,000 brain imaging datasets from UK Biobank. Neuroimage. 2018;166(October 2017):400–424. doi: 10.1016/j.neuroimage.2017.10.034 [DOI] [PMC free article] [PubMed] [Google Scholar]
- 21.Jovicich J, Czanner S, Greve D, et al. Reliability in multi-site structural MRI studies: Effects of gradient non-linearity correction on phantom and human data. Neuroimage. 2006;30(2):436–443. doi: 10.1016/j.neuroimage.2005.09.046 [DOI] [PubMed] [Google Scholar]
- 22.Wald L, Schmitt F, Dale A. Systematic spatial distortion in MRI due to gradient non-linearities. Neuroimage. 2001;13(6):50. doi: 10.1016/s1053-8119(01)91393-x [DOI] [Google Scholar]
- 23.Wells W Multi-modal volume registration by maximization of mutual information. Med Image Anal. 1996;1(1):35–51. doi: 10.1016/s1361-8415(96)80004-1 [DOI] [PubMed] [Google Scholar]
- 24.Hagler DJ, Hatton SN, Cornejo MD, et al. Image processing and analysis methods for the Adolescent Brain Cognitive Development Study. Neuroimage. 2019;202(August). doi: 10.1016/j.neuroimage.2019.116091 [DOI] [PMC free article] [PubMed] [Google Scholar]
- 25.Rothman K, Lash T, VanderWeele T, Haneuse S. Modern Epidemiology. Vol 63. Fourth Edi. Wolters Kluwer; 2021. [Google Scholar]
- 26.Wood JC, Enriquez C, Ghugre N, et al. MRI R2 and R2* mapping accurately estimates hepatic iron concentration in transfusion-dependent thalassemia and sickle cell disease patients. Blood. 2005;106(4):1460–1465. doi: 10.1182/blood-2004-10-3982 [DOI] [PMC free article] [PubMed] [Google Scholar]
- 27.d’Assignies G, Paisant A, Bardou-Jacquet E, et al. Non-invasive measurement of liver iron concentration using 3-Tesla magnetic resonance imaging: validation against biopsy. Eur Radiol. 2018;28(5):2022–2030. doi: 10.1007/s00330-017-5106-3 [DOI] [PubMed] [Google Scholar]
- 28.Henninger B, Alustiza J, Garbowski M, Gandon Y. Practical guide to quantification of hepatic iron with MRI. Eur Radiol. 2020;30(1):383–393. doi: 10.1007/s00330-019-06380-9 [DOI] [PMC free article] [PubMed] [Google Scholar]
- 29.Ordidge RJ, Gorell JM, Deniau JC, Knight RA, Helpern JA. Assessment of relative brain iron concentrations using T2‐weighted and T2*‐weighted MRI at 3 Tesla. Magn Reson Med. 1994;32(3):335–341. doi: 10.1002/mrm.1910320309 [DOI] [PubMed] [Google Scholar]
- 30.Prayson R. Neuropathology.; 2011.
- 31.Péran P, Hagberg G, Luccichenti G, et al. Voxel-based analysis of R2* maps in the healthy human brain. J Magn Reson Imaging. 2007;26(6):1413–1420. doi: 10.1002/jmri.21204 [DOI] [PubMed] [Google Scholar]
- 32.Ramos P, Santos A, Pinto NR, Mendes R, Magalhães T, Almeida A. Iron levels in the human brain: A post-mortem study of anatomical region differences and age-related changes. J Trace Elem Med Biol. 2014;28(1):13–17. doi: 10.1016/j.jtemb.2013.08.001 [DOI] [PubMed] [Google Scholar]
- 33.Gandon Y, Olivié D, Guyader D, et al. Non-invasive assessment of hepatic iron stores by MRI. Lancet. 2004;363(9406):357–362. doi: 10.1016/S0140-6736(04)15436-6 [DOI] [PubMed] [Google Scholar]
- 34.Najdenovska E, Alemán-Gómez Y, Battistella G, et al. In-vivo probabilistic atlas of human thalamic nuclei based on diffusion-weighted magnetic resonance imaging. Sci Data. 2018;5(October):1–11. doi: 10.1038/sdata.2018.270 [DOI] [PMC free article] [PubMed] [Google Scholar]
- 35.McComb RD. Neuropathology: A Volume in the Foundations of Diagnostic Pathology Series. Am J Surg Pathol. 2006;30(7). https://journals.lww.com/ajsp/Fulltext/2006/07000/Neuropathology__A_Volume_in_the_Foundations_of.26.aspx. [Google Scholar]
- 36.Holtbernd F, Shah NJ. Imaging the Pathophysiology of Essential Tremor—A Systematic Review. Front Neurol. 2021;12(June):1–17. doi: 10.3389/fneur.2021.680254 [DOI] [PMC free article] [PubMed] [Google Scholar]
- 37.Takakusaki K Functional Neuroanatomy for Posture and Gait Control. J Mov Disord. 2017;10(1):1–17. doi: 10.14802/jmd.16062 [DOI] [PMC free article] [PubMed] [Google Scholar]
- 38.Poewe W, Seppi K, Tanner CM, et al. Parkinson disease. Nat Rev Dis Prim. 2017;3:1–21. doi: 10.1038/nrdp.2017.13 [DOI] [PubMed] [Google Scholar]
- 39.Hayflick SJ, Kurian MA, Hogarth P. Chapter 19 - Neurodegeneration with brain iron accumulation. In: Geschwind DH, Paulson HL, Klein CBT-H of CN, eds. Neurogenetics, Part I. Vol 147. Elsevier; 2018:293–305. doi: 10.1016/B978-0-444-63233-3.00019-1 [DOI] [PMC free article] [PubMed] [Google Scholar]
- 40.Kruer MC, Boddaert N, Schneider A, et al. Neuroimaging features of neurodegeneration with brain iron accumulation. Am J Neuroradiol. 2012;33(3):407–414. doi: 10.3174/ajnr.A2677 [DOI] [PMC free article] [PubMed] [Google Scholar]
- 41.Aquino D, Bizzi A, Grisoli M, et al. Age-related Iron Deposition in the Basal Ganglia : Quantitative Methods : Results : Conclusion : Neuroradiology. 2009;252(1):165–172. [DOI] [PubMed] [Google Scholar]
- 42.Langkammer C, Krebs N, Goessler W, et al. Quantitative MR imaging of brain iron: A postmortem validation study. Radiology. 2010;257(2):455–462. doi: 10.1148/radiol.10100495 [DOI] [PubMed] [Google Scholar]
- 43.Wang JY, Zhuang QQ, Zhu LB, et al. Meta-analysis of brain iron levels of Parkinson’s disease patients determined by postmortem and MRI measurements. Sci Rep. 2016;6(February):1–13. doi: 10.1038/srep36669 [DOI] [PMC free article] [PubMed] [Google Scholar]
- 44.Blauwendraat C, Iwaki H, Makarious MB, et al. Investigation of Autosomal Genetic Sex Differences in Parkinson’s disease. medRxiv. January 2021:2021.02.09.21250262. doi: 10.1101/2021.02.09.21250262 [DOI] [PMC free article] [PubMed] [Google Scholar]
- 45.Blauwendraat C, Iwaki H, Makarious MB, et al. Investigation of Autosomal Genetic Sex Differences in Parkinson’s disease. medRxiv. January 2021:2021.02.09.21250262. doi: 10.1101/2021.02.09.21250262 [DOI] [PMC free article] [PubMed] [Google Scholar]
- 46.Zárate S, Stevnsner T, Gredilla R. Role of estrogen and other sex hormones in brain aging. Neuroprotection and DNA repair. Front Aging Neurosci. 2017;9(DEC):1–22. doi: 10.3389/fnagi.2017.00430 [DOI] [PMC free article] [PubMed] [Google Scholar]
- 47.Li S, Dardzinski BJ, Collins CM, Yang QX, Smith MB. Three-dimensional mapping of the static magnetic field inside the human head. Magn Reson Med. 1996;36(5):705–714. doi: 10.1002/mrm.1910360509 [DOI] [PubMed] [Google Scholar]
Associated Data
This section collects any data citations, data availability statements, or supplementary materials included in this article.