

Abstract
Importance:
U.S. rural, compared to non-rural, populations have striking disparities in diabetes care. It is unknown if rurality contributes to disparities in diabetes mortality.
Objective:
To examine rates and trends in diabetes mortality based on county urbanization.
Design:
Observational, cross-sectional study.
Setting:
CDC WONDER database, January 1, 1999, to December 31, 2018, for diabetes as a multiple cause and the underlying cause of death. County urbanization was categorized as metro, medium-small, and rural. We used weighted multiple linear regression models and jackknife resampling, with a 3-segment time component. The models included exposures with up to 3-way interactions and were age-standardized to the 2009–2010 population. The analyses were conducted from July 1, 2020, to February 1, 2022.
Participants:
U.S. residents 25 years and older in U.S. counties.
Exposures:
County urbanization (metro, medium-small, rural), sex (male, female), age-group (25–54, 55–74, ≥75 years) and region (Midwest, Northeast, South, East).
Main Outcomes and Measures:
Annual diabetes mortality rate/100,000 people [95% CI].
Results:
From 1999–2018, based on 4,022,238,309 person-years, diabetes was a multiple cause of death for 4,735,849 adults 25 years and older. As a multiple cause, diabetes mortality rates in 2017–2018 vs. 1999–2000 were highest and unchanged in rural counties (157.2[150.7 to 163.7] vs. 154.1[148.2 to 160.1]), but lower in medium-small counties (123.6[119.6 to 127.6] vs. 133.6[128.4 to 138.8];P<.01) and urban counties (92.9[90.5 to 95.3] vs. 109.7[105.2 to 114.1];P<.0001). In 2017–2018 vs. 1999–2000, mortality rates were higher in rural men (+18.2[14.3 to 22.1]) but lower in rural women (−14.0[−17.7 to −10.3])(both, P<.0001). In the 25–54 years age-group, mortality rates in 2017–2018 vs.1999–2000 showed greater increase in rural counties (+9.4[8.6 to 10.2]) compared to medium-small counties (+4.5[4.0 to 5.0]) and metro counties (+0.9[0.4 to 1.4])(all, P<.0001). Of all regions and urbanization levels, the mortality rate in 2017–2018 vs. 1999–2000 was higher only in the rural South (+13.8[7.6 to 20.0];P<.0001).
Conclusions and Relevance:
In this cross-sectional study, 1999–2018, U.S. rural counties had the highest overall diabetes mortality rate. The determinants of persistent rural disparities, in particular, for rural men and for adults in the rural South, require investigation.
INTRODUCTION
Diabetes is a chronic condition requiring lifelong, longitudinal care. In the United States (U.S.), the prevalence of diabetes and access to diabetes care are affected by several factors including rurality.1–3 The prevalence of diabetes is, in part, determined by trends in mortality. However, in rural populations, there is sparse information on trends in diabetes mortality,1 thereby limiting the development of rural interventions to reduce mortality.
From 1980–2017, the age-standardized prevalence of diabetes was flat from 1980–1990, increased from 1990–2009, then plateaued through 2017.4 During this period, the age-standardized incidence rate of diabetes increased from 1990–2007 and decreased through 2017.4 In comparison, the longitudinal trend in diabetes-related mortality rates is incompletely described. Further, national trends in mortality rates, as reported for prevalence and incidence, do not necessarily reflect subnational trends, which may be more meaningful for targeted efforts to monitor, manage, and improve diabetes care.
To address these knowledge gaps, we used U.S. Centers for Disease Control and Prevention Wide-Ranging Online Data for Epidemiologic Research (CDC WONDER) data, 1999–2018, to examine rates and trends in diabetes mortality among adults based on county urbanization, sex, age-group, and region. The objective of the study was to describe subnational trends in diabetes mortality to guide the development of rural interventions to reduce mortality.
METHODS
Ethics Approval
The use of public data was deemed ‘Not Human Subjects Research’ by the Mayo Clinic Institutional Review Board.
Data Source
We extracted CDC WONDER data, 1999–2018, for diabetes as a top 20 contributor to death (‘Multiple Cause of Death’) and leading cause of death (‘Underlying Cause of Death’).5 We restricted the analysis to the 1999–2018 period because there are no county urbanization data prior to 1999, and data for 2018 were the last available at study initiation.5
We grouped mortality by region (Midwest, Northeast, South, East), county urbanization (metro, medium-small, rural), age-group (25–54, 55–74, ≥75 years), and sex (male, female), in two-year groups (e.g., 1999–2000).5 CDC WONDER suppresses numerator counts with fewer than 10 deaths; however, our grouping criteria did not generate suppressed data.
Mortality attributed to diabetes (type 1 and type 2) was based on International Classification of Diseases–10 codes E10-E14. Type 2 diabetes accounts for 90%−95% of diabetes cases, and our findings likely pertain to type 2 diabetes.6,7 We excluded age-groups below 25 years, which have a higher prevalence of type 1, compared to, type 2 diabetes. The study was reported using STROBE guidelines.
County Urbanization
We used a condensed version of the 2013 National Center for Health Statistics criteria: metro (large central metropolitan + large fringe metropolitan), medium-small (medium metropolitan + small metropolitan), and rural (micropolitan + non-core).8,9
Statistical Analysis
We assessed models with different numbers of time segments (2, 3, and 4) and selected a 3-segment linear model with two change points, based on significance of fit improvement (eMethod 1 in the Supplement). To determine the number and location of change points, we fit a main effects model (sex, age-group, region, county urbanization, time), varying the change points from 1999–2000 to 2017–2018. For diabetes as a multiple cause of death, the fits with the lowest mean square error (MSE) were for change points at: 1) 2003–2004 and 2011–2012 and 2) 2003–2004 and 2009–2010. Given the minimal difference in mean square values, we selected 2003–2004 and 2009–2010 as change points because model predictions were age-standardized to the 2009–2010 population. The same change points were used for diabetes as the underlying cause of death. With this basic time structure, we fit models with up to 3-way interactions among the exposures and time variables (eMethod 1 in the Supplement). Assuming Poisson-like variation of death counts in each cell, weighted multiple linear regression was used to model the outcome [log (mortality rate)] that was reported as annual diabetes mortality rate per 100,000 people (ADMR) (eMethod 1 in the Supplement).
Unadjusted and Adjusted Estimates
We modeled deaths by sex, age-group, region, county urbanization, and year to evaluate the joint effects of, and interactions between, the exposures on mortality rates. To summarize temporal trends on the original scale of mortality rates, we derived unadjusted and adjusted estimates of mortality rates for the beginning and ending years, along with the two change points, and age-standardized to the 2009–2010 population. Unadjusted estimates represent the predicted effect of the tabled variable, while allowing non-tabled variables to vary as they did in the original dataset. Adjusted estimates represent the hypothetical effects of the same tabled variables if the non-tabled variables were equally distributed within each level of the tabled variables (eMethod 2 in the Supplement).
To evaluate if variation in mortality time trends with respect to other exposures (i.e., sex, age-group, and region) accounted for the variation in mortality time trends across urbanization levels, we compared the F-statistics for time*urbanization within models with and without inclusion of other time*exposures effects (eMethod 3 in the Supplement).
Standard errors and 95% confidence intervals for ADMR, and comparisons between time points and urbanization levels, were based on a jackknife procedure, by individually leaving out each of the 720 cells from model estimation, followed by aggregation of predicted deaths and age-standardized to the 2009–2010 population. Statistical analysis was conducted using SAS 9.4 (SAS Institute Inc., Cary, NC) with statistical significance at two-tailed P<.05.
RESULTS
The analysis was based on 4,022,238,309 person-years in adults aged ≥25 years and 4,735,849 deaths with diabetes as a multiple cause of death (annual average of 117.7 deaths per 100,000 people). From 1999–2018, the population characteristics varied by county urbanization (eTable 1 in the Supplement). With increasing rurality, there was a lower proportion of women (52.1% in metro, 51.9% in medium-small, and 51.0% in rural counties) and a higher proportion of adults aged ≥55 years (34.9% in metro, 39.0% in medium-small, and 42.9% in rural counties).
In the overall population, for diabetes as a multiple cause of death, the ADMR was highest in rural, compared with medium-small and metro, counties (Figure 1;eTable 2 in the Supplement). The ADMR (95% confidence interval) in rural counties was unchanged (157.2[150.7 to 163.7] in 2017–2018 vs. 154.1 [148.2 to 160.1] in 1999–2000;P=.49) but significantly lower in medium-small counties (123.6[119.6 to 127.6] in 2017–2018 vs. 133.6[128.4 to 138.8] in 1999–2000;P<.01) and metro counties (92.9[90.5 to 95.3] in 2017–2018 vs. 109.7[105.2 to 114.1] in 1999–2000;P<.0001).
Figure 1. Annual diabetes mortality rate (ADMR; per 100,000 people) for diabetes as multiple cause of death (upper panel) and underlying cause of death (lower panel).
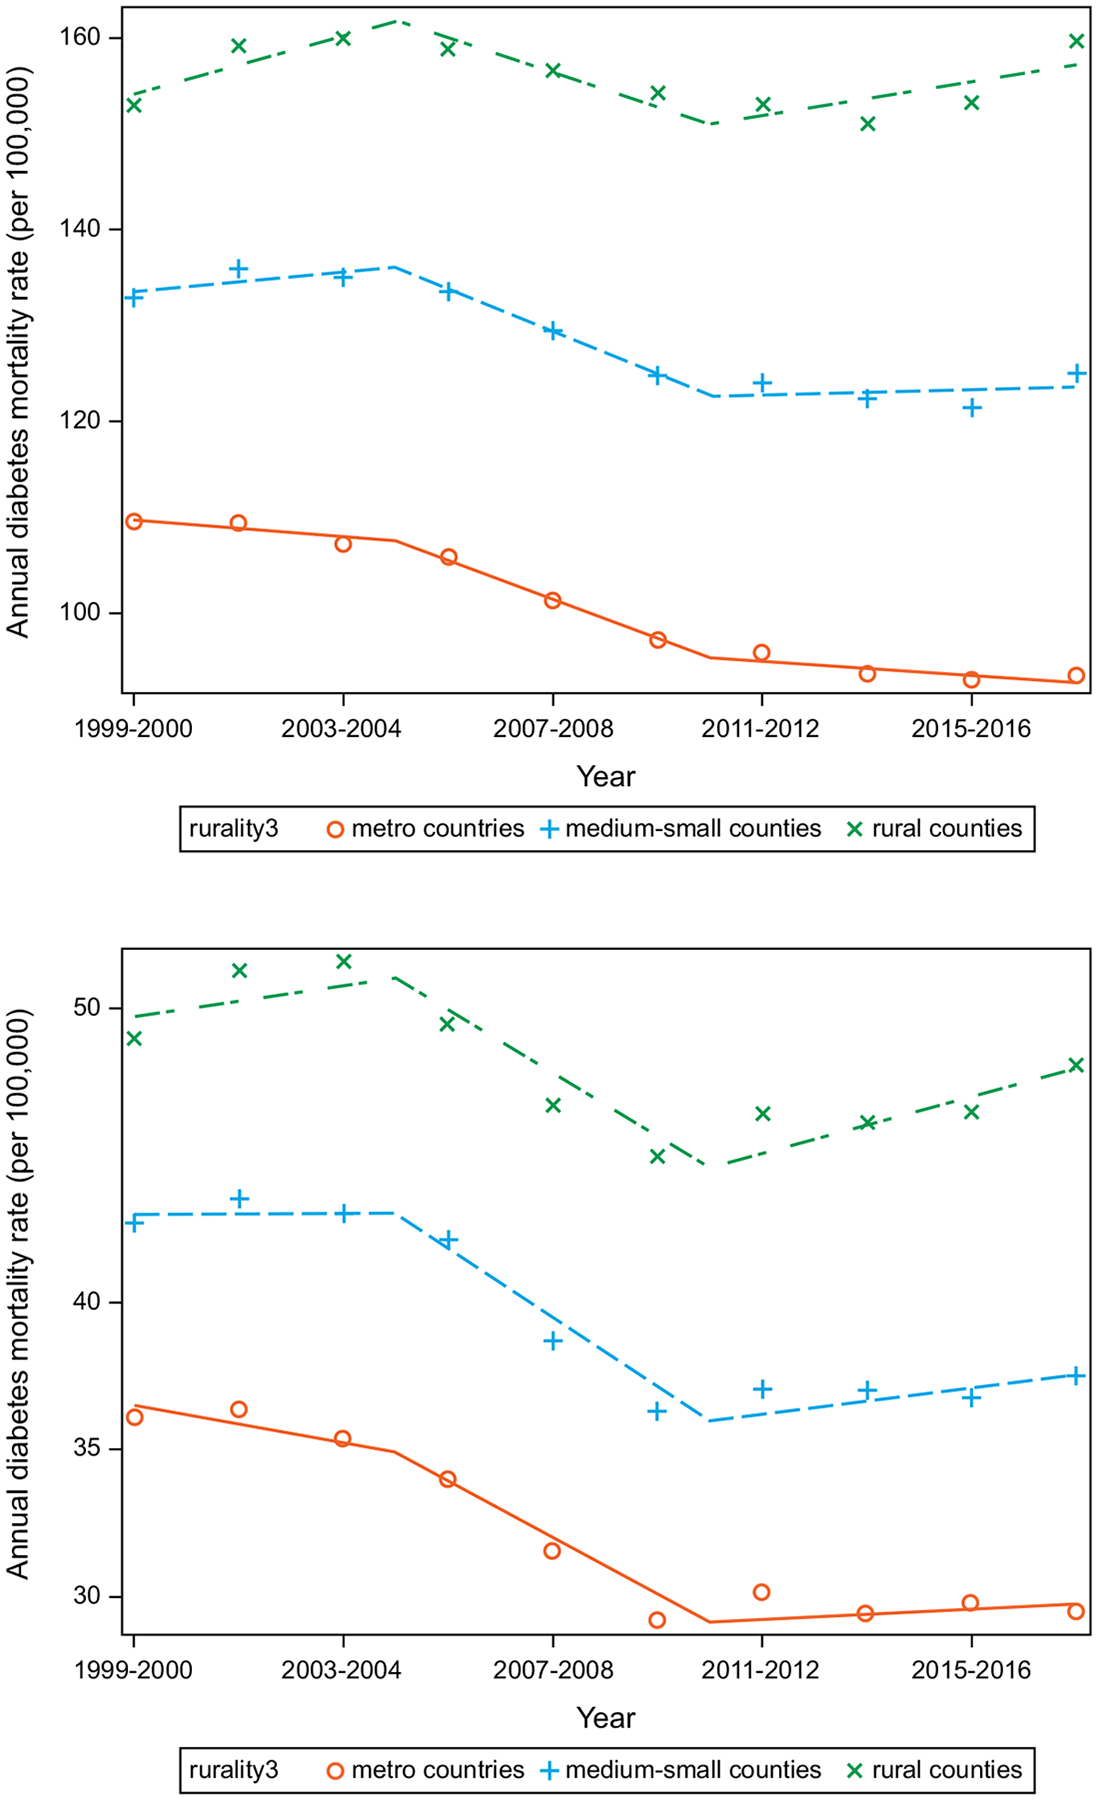
Unadjusted estimates included county urbanization, year, 2-way interaction term (county urbanization, year), and age-standardized to the 2009–2010 population. Change points at 2003–2004 and 2009–2010. Counties classified as metro (large central metropolitan + large fringe metropolitan), medium-small (medium metropolitan + small metropolitan) and rural (micropolitan + non-core).
Sex-specific Diabetes Mortality by County Urbanization
In unadjusted estimates for diabetes as a multiple cause of death, the ADMR was significantly higher for men in rural, compared with medium-small and metro, counties, in all years examined (Table 1;Figure 2; eTable 3 in the Supplement). In 2017–2018 vs. 1999–2000, the ADMR was significantly higher for men in rural counties (+18.2 [14.3 to 22.1];P<.0001) but was unchanged in medium-small counties (0.7 [−1.8 to 3.3]) and significantly lower in metro counties (−10.3[−11.9 to −8.7];P<.0001). In 2017–2018 vs. 2009–2010, the ADMR was significantly higher for men in rural counties (+14.2[10.1 to 18.3];P<.0001) and medium-small counties (+5.8[3.4 to 8.1];P<.0001) but was unchanged in metro counties (0.0[−1.6 to 1.6]).
Table 1:
Estimated annual diabetes mortality rates for diabetes as a multiple cause of death
| Estimated annual diabetes mortality rate (ADMR), per 100,000 people | ||||
|---|---|---|---|---|
| 2017–2018 vs. 1999–2000 | 2017–2018 vs. 2009–2010 | |||
| Unadjusted estimate | Adjusted estimate | Unadjusted estimate | Adjusted estimate | |
| Sex | ||||
| Men | ||||
| Metro | −10.3 (−11.9 to −8.7)d | −12.6 (−14.6 to −10.6)d | 0.0 (−1.6 to 1.6) | −0.5 (−2.5 to 1.4) |
| Medium-Small | 0.7 (−1.8 to 3.3) | −0.9 (−3.5 to 1.6) | +5.8 (3.4 to 8.1)d | +4.7 (2.3 to 7.2)c |
| Rural | +18.2 (14.3 to 22.1)d | +12.9 (9.4 to 16.4)d | +14.2 (10.1 to 18.3)d | +11.2 (7.6 to 14.8)d |
| Women | ||||
| Metro | −26.1 (−27.8 to −24.4)d | −26.7 (−28.4 to −25.1)d | −8.5 (−10.1 to −7.0)d | −8.4 (−9.8 to −6.9)d |
| Medium-Small | −23.3 (−25.4 to −21.1)d | −20.9 (−22.7 to −19.1)d | −7.4 (−9.4 to −5.5)d | −6.2 (−7.8 to −4.6)d |
| Rural | −14.0 (−17.7 to −10.3)d | −12.9 (−15.6 to −10.2)d | −4.3 (−7.9 to −0.7)a | −2.9 (−5.4 to −0.4)a |
| Age-group | ||||
| 25–54 years | ||||
| Metro | +0.9 (0.4 to 1.4)c | +0.9 (0.4 to 1.4)c | 0.1 (−0.2 to 0.4) | 0.1 (−0.2 to 0.4) |
| Medium-Small | +4.5 (4.0 to 5.0)d | +4.2 (3.7 to 4.7)d | +1.7 (1.3 to 2.1)d | +1.6 (1.2 to 2.0)d |
| Rural | +9.4 (8.6 to 10.2)d | +8.4 (7.6 to 9.2)d | +4.1 (3.4 to 4.8)d | +3.6 (2.9 to 4.3)d |
| 55–74 years | ||||
| Metro | −46.4 (−48.9 to −43.8)d | −46.2 (−48.7 to −43.7)d | −1.3 (−3.4 to 0.8) | −0.8 (−3.0 to 1.3) |
| Medium-Small | −27.7 (−31.7 to −23.7)d | −29.0 (−32.9 to −25.1)d | +7.7 (4.9 to 10.6)d | +7.5 (4.8 to 10.3)d |
| Rural | −1.8 (−7.5 to 3.9) | −7.1 (−12.4 to −1.8)b | +19.5 (14.8 to 24.2)d | +18.0 (13.7 to 22.2)d |
| ≥75 years | ||||
| Metro | −73.4 (−85.4 to −61.3)d | −77.4 (−89.9 to −64.8)d | −45.2 (−56.8 to −33.5)d | −45.9 (−57.7 to −34.2)d |
| Medium-Small | −55.6 (−70.3 to −40.9)d | −55.9 (−70.5 to −41.3)d | −40.8 (−53.4 to −28.2)d | −40.9 (−53.3 to −28.4)d |
| Rural | −16.8 (−40.5 to 6.8) | −33.0 (−55.5 to −10.5)b | −31.1 (−51.9 to −10.2)b | −34.4 (−53.1 to −15.6)c |
| Region | ||||
| Northeast | ||||
| Metro | −23.9 (−26.3 to −21.5)d | −23.6 (−25.9 to −21.2)d | −7.4 (−9.9 to −4.8)d | −7.0 (−9.5 to −4.6)d |
| Medium-Small | −37.4 (−40.7 to −34.1)d | −34.0 (−37.0 to −31.0)d | −11.3 (−13.6 to −9.0)d | −9.9 (−11.9 to −7.9)d |
| Rural | −37.5 (−42.3 to −32.7)d | −31.6 (−35.6 to −27.5)d | −12.5 (−16.6 to −8.4)d | −10.3 (−13.8 to −6.8)d |
| Midwest | ||||
| Metro | −27.4 (−29.1 to −25.7)d | −28.7 (−30.5 to −26.9)d | −11.0 (−12.5 to −9.5)d | −11.5 (−13.1 to −10.0)d |
| Medium-Small | −12.2 (−15.2 to −9.3)d | −11.7 (−14.5 to −8.9)d | −3.6 (−6.6 to −0.5)a | −3.2 (−6.1 to −0.3)a |
| Rural | 5.3 (−0.2 to 10.7) | +5.0 (0.5 to 9.4)a | 5.8 (−0.5 to 12.1) | +5.6 (0.5 to 10.8)a |
| South | ||||
| Metro | −16.0 (−18.4 to −13.6)d | −18.1 (−20.8 to −15.4)d | −1.1 (−3.3 to 1.1) | −1.5 (−4.0 to 1.0) |
| Medium-Small | −4.8 (−8.6 to −1.1)b | −4.2 (−7.7 to −0.6)a | 3.3 (−0.3 to 6.9) | 3.3 (−0.1 to 6.6) |
| Rural | +13.8 (7.6 to 20.0)d | +13.3 (7.7 to 18.9)d | +10.2 (3.7 to 16.7)b | +9.4 (3.6 to 15.3)b |
| West | ||||
| Metro | −9.3 (−12.0 to −6.5)d | −10.2 (−13.4 to −7.1)d | −0.8 (−4.1 to 2.5) | −0.9 (−4.7 to 2.8) |
| Medium-Small | −1.5 (−4.3 to 1.4) | −1.3 (−4.3 to 1.6) | 2.0 (−0.7 to 4.6) | 1.8 (−0.8 to 4.5) |
| Rural | −0.5 (−4.0 to 3.1) | 0.0 (−3.3 to 3.3) | +5.5 (1.8 to 9.2)b | +4.6 (1.3 to 8.0)b |
Estimated annual diabetes mortality rates (ADMR [95% confidence interval]; per 100,000 people) for diabetes as a multiple cause of death, from unadjusted and adjusted estimates that included the exposure (sex, age-group, or region), up to 3-way interaction terms (exposure [sex, age-group, or region], county urbanization, year), and age-standardized to the 2009–2010 population (only for sex and region). Estimates reported in eTable 3 (sex), eTable 4 (age-group), and eTable 5 (region) in the Supplement.
Statistical significance at
P<.05;
P<.01;
P<.001;
P<.0001
Figure 2. Estimated annual diabetes mortality rate (ADMR; per 100,000 people) by sex for diabetes as a multiple cause of death.
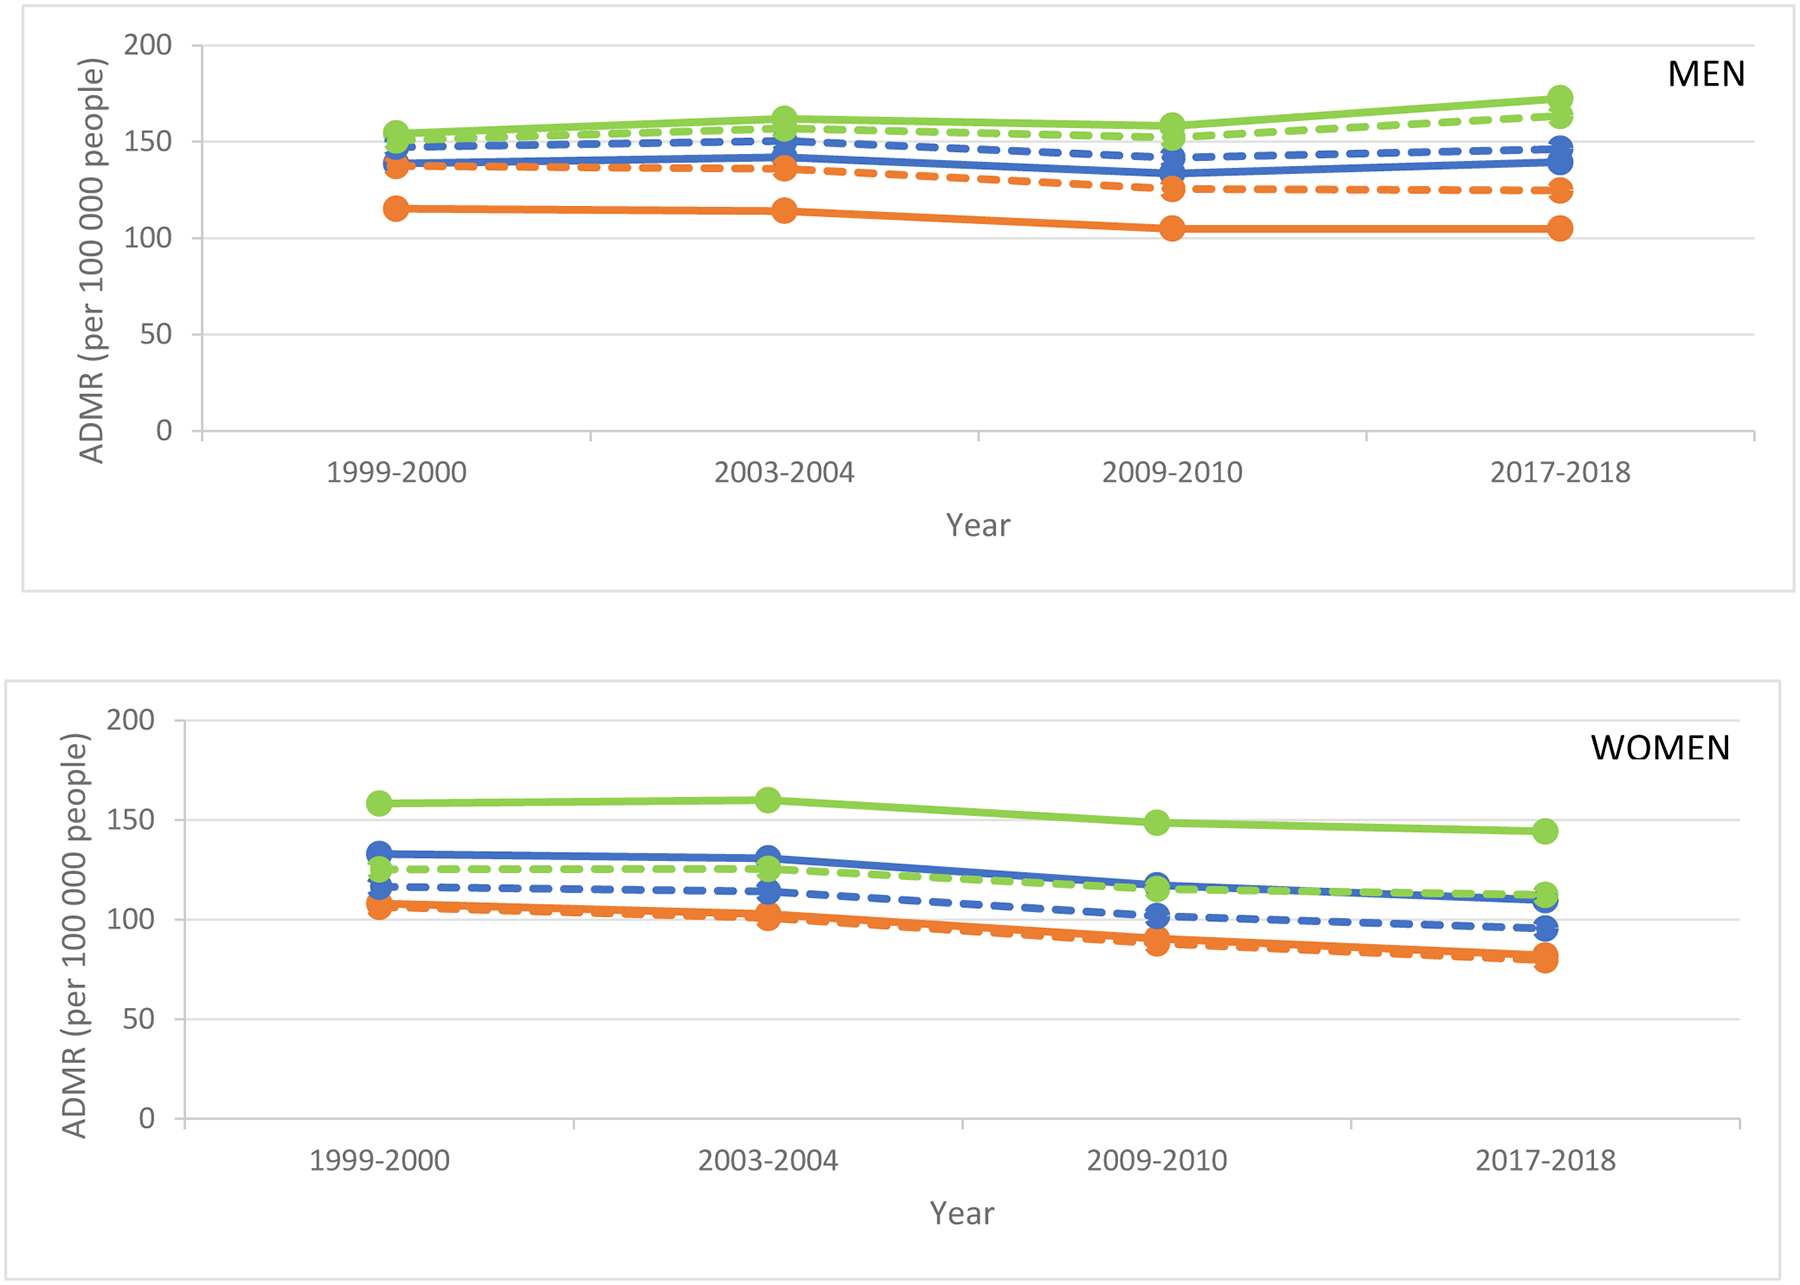
Unadjusted (bold) and adjusted (dotted) estimates included age-group, region, up to 3-way interaction terms (sex, county urbanization, year), and age-standardized to 2009–2010 population for rural (green), medium-small (blue), and metro (orange) counties.
ADMR and change in ADMR by county urbanization are shown in Table 1 and eTable 3 in the Supplement.
Unadjusted estimates represent the effect of the tabled variable, while allowing non-tabled variables to vary, as occurring in the original dataset. Adjusted estimates represent the hypothetical effects of the same tabled variables if the non-tabled variables were equally distributed within each level of the tabled variables (eMethod 2 in the Supplement).
The ADMR was significantly higher for women in rural, compared with medium-small and metro, counties, in all years examined (Table 1;Figure 2;eTable 3 in the Supplement). Overall, in 2017–2018 vs. 1999–2000, the ADMR was significantly lower for women at all urbanization levels albeit with the smallest magnitude of decrease in rural counties (−14.0[−17.7 to −10.3];P<.0001) compared to medium-small counties (−23.3[−25.4 to −21.1];P<.0001) and metro counties (−26.1[−27.8 to −24.4];P<.0001). A similar pattern was observed for mortality rates in 2017–2018 vs. 2009–2010 in rural counties (−4.3[−7.9 to −0.7];P<.05) compared to medium-small counties (−7.4[−9.4 to −5.5];P<.0001) and metro counties (−8.5[−10.1 to −7.0];P<.0001).
Age-group-specific Diabetes Mortality by County Urbanization
In unadjusted estimates for diabetes as a multiple cause of death, the ADMR was significantly higher in older age-groups within all urbanization levels (Table 1;Figure 3;eTable 4 in the Supplement). In 2017–2018 vs. 1999–2000, the ADMR in the 25–54 years age-group was significantly higher within all urbanization levels, with the largest magnitude of increase in rural counties (+9.4[8.6 to 10.2]) compared to medium-small counties (+4.5[4.0 to 5.0]) and metro counties (+0.9[0.4 to 1.4]) (both comparisons, P<.0001). In contrast, in the 55–74 years age-group, the ADMR in 2017–2018 vs. 1999–2000 was unchanged in rural counties (−1.8[−7.5 to 3.9]) but significantly lower in medium-small counties (−27.7[−31.7 to −23.7];P<.0001) and metro counties (−46.4[−48.9 to −43.8];P<.0001). Similar to the 55–74 years age-group, the ADMR in the ≥75 years age-group in 2017–2018 vs. 1999–2000 was unchanged in rural counties (−16.8[−40.5 to 6.8]) but decreased lower in medium-small counties (−55.6[−70.3 to −40.9];P<.0001) and metro counties (−73.4[−85.4 to −61.3];P<.0001).
Figure 3: Estimated annual diabetes mortality rates (ADMR; per 100,000 people) by age-group for diabetes as a multiple cause of death.
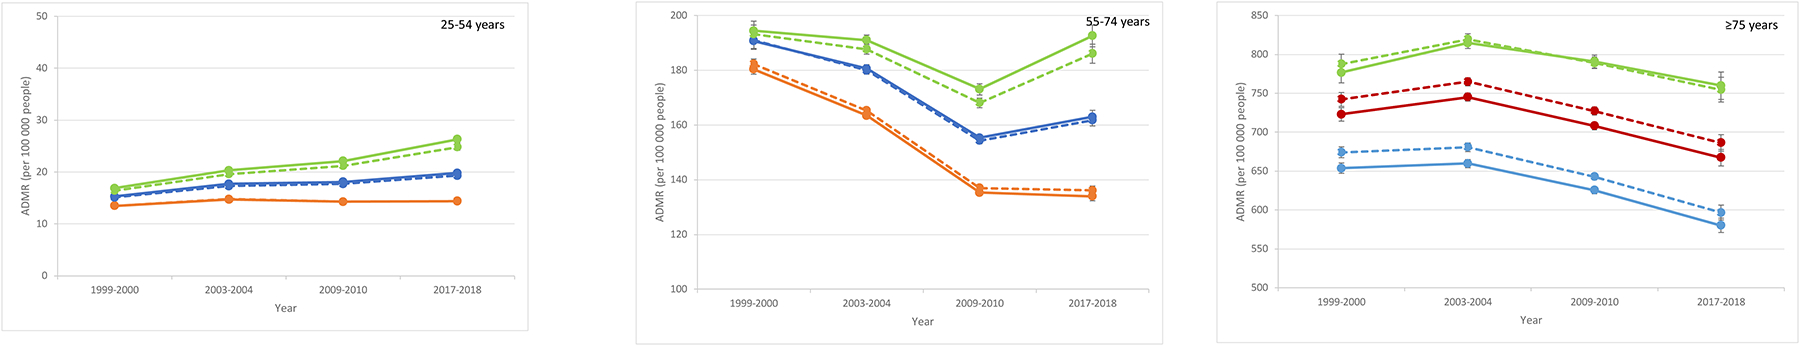
Unadjusted (bold) and adjusted (dotted) estimates included sex, region, and up to 3-way interaction terms (age-group, county urbanization, year) for rural (green), medium-small (blue), and metro (orange) counties. Note the different y-axis scales.
ADMR and change in ADMR by county urbanization are shown in Table 1 and eTable 4 in the Supplement.
Unadjusted estimates represent the effect of the tabled variable, while allowing non-tabled variables to vary, as occurring in the original dataset. Adjusted estimates represent the hypothetical effects of the same tabled variables if the non-tabled variables were equally distributed within each level of the tabled variables (eMethod 2 in the Supplement).
Region-specific Diabetes Mortality by County Urbanization
In unadjusted estimates for diabetes as a multiple cause of death, the ADMR in 2017–2018 vs. 1999–2000 varied by region (Table 1;Figure 4;eTable 5 in the Supplement). In the Northeast, the improvement in mortality rate was significantly higher in rural counties (−37.5[−42.3 to −32.7];P<.0001) compared to metro counties (−23.9[−26.3 to −21.5];P<.0001) but similar to medium-small counties (−37.4[−40.7 to −34.1];P<.0001). In contrast, the ADMR was unchanged in the rural Midwest (5.3[−0.2 to 10.7]) compared to the metro Midwest (−27.4[−29.1 to −25.7];P<.0001), and in the rural West (−0.5[−4.0 to 3.1]) compared to the metro West (−9.3[−12.0 to −6.5];P<.0001). The rural disparity was pronounced in the South: the ADMR in 2017–2018 vs. 1999–2000 was significantly higher in rural counties (+13.8[7.6 to 20.0];P<.0001) but lower in medium-small counties (−4.8[−8.6 to −1.1];P<.01) and metro counties (−16.0[−18.4 to −13.6];P<.0001). Generally similar trends were observed for 2017–2018 vs. 2009–2010.
Figure 4. Estimated annual diabetes mortality rate (per 100,000 people people) by region for diabetes as a multiple cause of death.
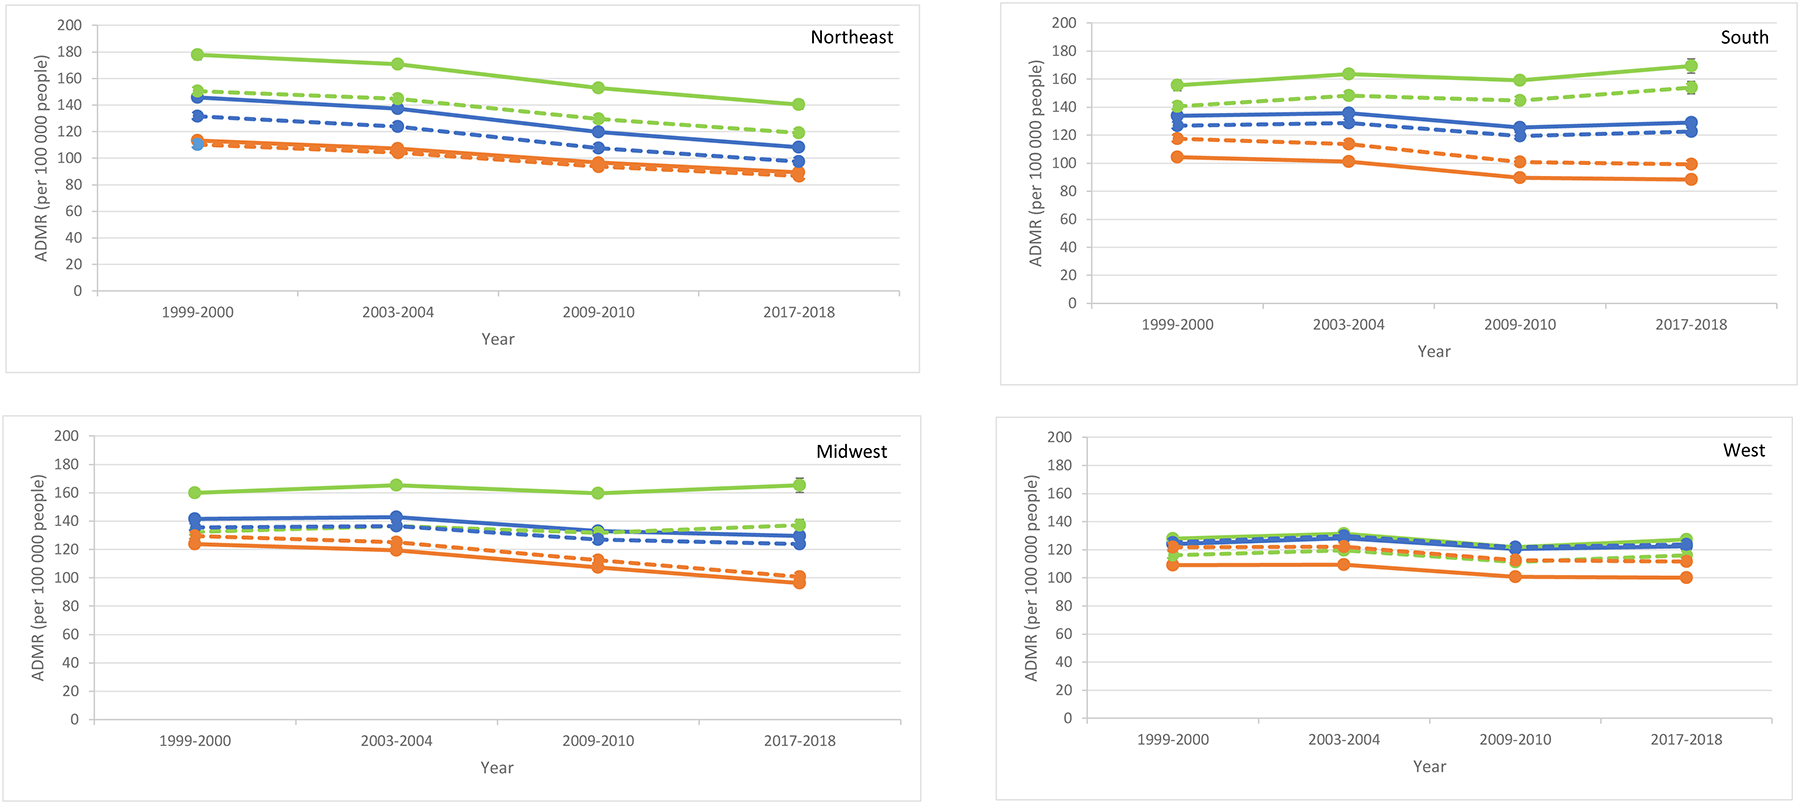
Unadjusted (bold) and adjusted (dotted) estimates included sex, age-group, up to 3-way interaction terms (region, county urbanization, year), and age-standardized to 2009–2010 population for rural (green), medium-small (blue), and metro (orange) counties.
ADMR and change in ADMR by county urbanization are shown in Table 1 and eTable 5 in the Supplement.
Unadjusted estimates represent the effect of the tabled variable, while allowing non-tabled variables to vary, as occurring in the original dataset. Adjusted estimates represent the hypothetical effects of the same tabled variables if the non-tabled variables were equally distributed within each level of the tabled variables (eMethod 2 in the Supplement).
Adjusted Estimates
For sex, age-group, and region, the ADMR levels were less variable across rurality after adjustment (Table 1;Figures 2–4;eTables 3–5 in the Supplement). For instance, in 1999–2000 for men, the ADMR before adjustment was 115.3(114.3–116.3) in metro counties and 154.3(152.2–156.5) in rural counties; after adjustment, it was 137.4(136.2–138.7) in metro counties and 150.6(148.6–152.5) in rural counties suggesting that adjustment for age-group and region partially accounted for the differences in ADMR level across rurality levels. Similarly, in 1999–2000 for women, the ADMR before adjustment was 108.0(106.8–109.2) in metro counties and 158.3(155.7–160.9) in rural counties; and 106.4(105.2–107.7) in metro counties and 125.3(123.4–127.3) in rural counties after adjustment, suggesting that adjustment for age-group and region partially accounted for the differences in level.
In contrast, variation across rurality in the ADMR differences (2017–2018 vs. 1999–2000) was generally similar in unadjusted vs. adjusted estimates. For men, the ADMR in 2017–2018 vs. 1999–2000 in unadjusted estimates was +18.2(14.3 to 22.1) in rural counties and −10.3(−11.9 to −8.7) in metro counties (difference of changes in ADMR=28.5); the ADMR in adjusted estimates was +12.9(9.4 to 16.4) in rural counties and −12.6(−14.6 to −10.6) in metro counties (difference of changes in ADMR=25.5). Similarly, for women, the ADMR difference between metro and rural counties (2017–2018 vs. 1999–2000) was generally similar at +12.1(unadjusted estimate) and +13.8(adjusted estimate).
Temporal Trends in Mortality and Exposures
We examined if the variation in mortality time trends with respect to other exposures (i.e., sex, age-group, and region) accounted for the variation in mortality time trends across county urbanization levels. The F-statistic for the interactions between time and urbanization was 34.0 before, and 31.1 after inclusion of other time*exposure interactions. This indicated that almost all variation in ADMR time trends due to county urbanization was independent of variation in ADMR time trends due to other exposures.
Diabetes as Underlying Cause of Death
Compared to the multiple cause of death analysis, the absolute ADMR for diabetes as the underlying cause of death was lower. Results observed in the multiple cause of death analysis were generally preserved (Figure 1;eTables 6–8 in the Supplement).
DISCUSSION
In this analysis, the ADMR in 2017–2018 vs. 1999–2000 was lower in women in all urbanization levels, albeit with the smallest improvement in mortality in rural counties. In contrast, the ADMR in men was higher in rural counties but unchanged/lower in other counties. In the 25–54 years age-group, the ADMR was higher at all urbanization levels, with the highest mortality rate in rural counties. In contrast, ADMR in the 55–74 years and ≥75 years age-groups was lower in medium-small and metro counties but unchanged in rural counties. When stratified by region, the ADMR in 2017–2018 vs. 1999–2000 was higher in the rural South, unchanged in the rural Midwest and rural West but lower in the rural Northeast. Generally similar results were obtained for the ADMR in 2017–2018 vs. 2009–2010. Taken together, the results describe subnational trends in diabetes mortality, highlight persistent rural disparities, and identify areas for investigation and intervention.
In the U.S., from 1990–2017, the increase in the annual age-adjusted prevalence of diabetes from ~1990 through 2009–2010 for men and women was attributed, in part, to an increase in incidence and decline in mortality.4,10 While the national mortality trend was reassuring, subnational results in the present study show that the decline in mortality was driven by nonrural counties; the ADMR increased in rural men and improved the least in rural women, compared to nonrural counterparts. Previous studies described the sex differences in trends for diabetes prevalence, incidence, and mortality.4,10,11 However, the determinants of sex differences in mortality in rural vs. nonrural counties are unknown and may be linked to differences in diabetes care, adherence to therapy, and incidence of diabetes complications, among other factors.
The U.S. annual prevalence of diabetes for adults 65–79 years increased from 1990 through ~2010 and then plateaued.4 Since 2011, the annual incidence of diabetes has declined by 8.1%(P=.09).4 Along with a decline in incidence, results from the present study showed that ADMR declined in adults ≥75 years and accounted for the plateau in diabetes prevalence. In the present study, the decline in ADMR in adults ≥75 years was nonuniform across urbanization levels, with a small improvement in rural counties. Although the reasons are incompletely understood, a cross-sectional study of U.S. adults ≥65 years with diabetes showed that rural, compared to nonrural, residents had a higher odds of not having a healthcare provider, deferring care due to medical cost, and having an annual household income of <$35,000, placing them at greater risk of not receiving adequate diabetes care.12 The reasons for the increasing ADMR in the 25–54 years group are unclear and may include a higher proportion of uninsured adults, lower family income, and lower wages, among other factors.13
In the present study, the trend in ADMR for diabetes as a multiple cause of death differed by region: in unadjusted estimates in 2017–2018 vs. 1999–2000, the ADMR was higher in the rural South and unchanged/lower in other rural regions. Regional differences in ADMR may be linked to differences in disease burden with a higher age-adjusted prevalence of diabetes in the South14,15, modifiable risk factors (e.g., physical activity)16, environmental pollution17–21, and race/ethnicity, among other factors22. Interventions specific to the rural South have examined the role of education programs and technology to improve diabetes care,23,24 and studies are required to evaluate their generalizability to other regions.
In the present study, the ADMR for diabetes as a multiple cause of death declined in rural and nonrural counties, but rural disparities persisted independent of variation in ADMR time trends due to sex, age-group, and region. These rural disparities may be linked to differences in diabetes comorbidities25, consumption of fruits and vegetables26,27, environmental toxins28, suboptimal diabetes management29–31, healthcare access (e.g., for dilated eye examination)32,33, and change in treatment targets,34 which are major challenges in rural counties. For instance, diabetes is a major cardiovascular risk factor,35–37 and despite overall improvement in cardiovascular mortality in rural and nonrural counties, rural-nonrural disparities persist8. Addressing systemic rural-nonrural differences may improve outcomes for diabetes and other conditions.
Diabetes is a major public health problem, and the higher rural prevalence has prompted evaluation and implementation of rural-specific technology interventions38, community programs39,40, and redesigned primary care models41. These programs focus on improving glycemic control, lipid levels, and blood pressure, and additional studies are required to assess if they reduce the incidence of diabetes complications (e.g., cardiovascular disease) and mortality. The rural-nonrural disparities prompted the American Heart Association and American Stroke Association to release a 2020 ‘Call to Action’ advisory to improve rural health.42
Limitations
The analysis used data from death certificates, which may not always list diabetes as a contributor to mortality. However, we do not have evidence for non-random reporting of diabetes as a contributor to mortality. To mitigate potential non-reporting of diabetes on death certificates, we analyzed diabetes as a multiple cause of death and the underlying cause.43,44 Death certificates include type 1 and type 2 diabetes. However, ~95% of diabetes cases are type 2 diabetes in adults >25 years, and the results are likely representative of type 2 diabetes. We did not stratify by race/ethnicity to avoid suppressed data and erroneous estimates; the association or race/ethnicity and diabetes mortality has been reported44. We focused on condensed urbanization levels and did not have corresponding data (e.g., health insurance) to explain the rurality-mortality association. However, this study has strengths. A previous study showed that diabetes mortality rates were lagging in rural areas.1 In the present study, we used a nonbiased approach to identify change points and evaluate trends. To our knowledge, the present study is the most comprehensive analysis of subnational mortality trends based on sex, age-group, region, and rurality (and interactions) using unadjusted and adjusted estimates for diabetes as a multiple cause and the underlying cause of death. This study showed that sex, age-group, region, and additional factors contribute to rural-nonrural differences in mortality.
CONCLUSIONS
In this analysis of diabetes mortality, 1999–2018, rural counties demonstrated higher mortality rates compared to other urbanization levels. There were subnational disparities based on sex, age-group, and region. For diabetes as a multiple cause of death, trends in mortality rates for rural men, adults 25–54 years, and adults in the rural South and rural Midwest were most concerning. The variation in ADMR trends by county urbanization was independent of variation in ADMR time trends due to sex, age-group, and region, suggesting the contribution of additional factors.
Our results highlight the importance of exploring individual and community factors that determine mortality in rural counties. This knowledge will inform further investigation into the determinants of mortality and targeted interventions to close the rural-nonrural gap and improve rural health, which is a priority of the U.S. Healthy People 2030 agenda.45
Supplementary Material
KEY POINTS.
Question:
In the United States, do disparities exist in diabetes mortality based on county urbanization?
Findings:
In this cross-sectional study, in 2017–2018 vs. 1999–2000, the age-standardized mortality rates per 100,000 people were unchanged in rural counties (157.2 vs. 154.1) but significantly lower in medium-small counties (123.6 vs. 133.6) and metro counties (92.9 vs. 109.7). In 2017–2018 vs. 1999–2000, the mortality rate was significantly higher in rural men (+18.2) but lower in rural women (−14.0).
Meaning:
Overall, United States rural counties exhibited persistently high diabetes mortality rates, with additional disparities based on sex.
ACKNOWLEDGEMENTS
Access to Data and Data Analysis: Dugani had access to the study data and takes responsibility for the integrity of the data.
Concept and design: Dugani, Bailey, Vella
Acquisition, analysis, or interpretation of data: All authors
Drafting of the manuscript: Dugani
Critical revision of the manuscript for important intellectual content: All authors
Statistical analysis: Wood-Wentz, Bailey
Obtained funding: Dugani, Vella
Administrative, technical, or material support: Mielke, Vella
Supervision: Bailey, Vella
Funding/Support:
SBD is supported by the National Institutes of Health/National Institute on Minority Health and Health Disparities (K23 MD016230) and the Robert and Elizabeth Strickland Career Development Award, Mayo Clinic, Rochester, MN, United States.
MMM is supported by the National Institutes of Health and the Department of Defense, and has consulted for Biogen, Brain Protection Company, and LabCorp unrelated to the current study.
AV is the recipient of an investigator-initiated grant from Novo Nordisk and has consulted for vTv Therapeutics, Zeeland Pharmaceuticals, Crinetics and Rezolute, and is supported by the National Institutes of Health/National Institute of Diabetes and Digestive and Kidney Diseases (DK78646, DK116231 and DK126206).
The funders had no role in study design, data analysis and interpretation; in writing of the manuscript; and in the decision to submit the manuscript for publication. The findings and conclusions do not necessarily represent the views of the funders.
Footnotes
The authors reported no conflict of interest.
An abstract on this topic was presented at the 45th National Rural Health Association meeting from May 10–13, 2022, in Albuquerque, New Mexico, United States.
REFERENCES
- 1.Callaghan T, Ferdinand AO, Akinlotan MA, Towne SD, Bolin J. The Changing Landscape of Diabetes Mortality in the United States Across Region and Rurality, 1999–2016. The Journal of Rural Health 2019:1–6. [DOI] [PubMed] [Google Scholar]
- 2.Ferdinand AO, Akinlotan MA, Callaghan T, Towne SD Jr, Bolin J. Diabetes-related hospital mortality in the U.S.: A pooled cross-sectional study of the National Inpatient Sample. Journal of Diabetes and its Complications 2019:350–5. [DOI] [PubMed] [Google Scholar]
- 3.Ferdinand AO, Akinlotan MA, Callaghan TH, Towne SD, Bolin JN. Diabetes-Related Hospital Mortality in Rural America: A Significant Cause for Concern. 2018.
- 4.Benoit SR, Hora I, Albright AL, Gregg EW. New directions in incidence and prevalence of diagnosed diabetes in the USA. BMJ Open Diabetes Research & Care 2019:e000657. [DOI] [PMC free article] [PubMed] [Google Scholar]
- 5.Prevention CfDCa. CDC WONDER. 2019.
- 6.CDC. National Diabetes Statistics Report 2020 2020.
- 7.Geiss LS, Wang J, Cheng YJ, et al. Prevalence and incidence trends for diagnosed diabetes among adults aged 20 to 79 years, United States, 1980–2012. JAMA - Journal of the American Medical Association 2014:1218–26. [DOI] [PubMed] [Google Scholar]
- 8.Bossard M, Latifi Y, Fabbri M, et al. Increasing mortality from premature coronary artery disease in women in the rural united states. Journal of the American Heart Association: American Heart Association Inc; 2020. [DOI] [PMC free article] [PubMed] [Google Scholar]
- 9.Ingram D, Franco S. 2013 NCHS urban–rural classification scheme for counties. National Center for Health Statistics. Vital Health Stat 2(166). 2014. [PubMed] [Google Scholar]
- 10.Gregg EW, Cheng YJ, Srinivasan M, et al. Trends in cause-specific mortality among adults with and without diagnosed diabetes in the USA: an epidemiological analysis of linked national survey and vital statistics data. Lancet 2018;391:2430–40. [DOI] [PubMed] [Google Scholar]
- 11.Gregg EW, Gu Q, Cheng YJ, Narayan KM, Cowie CC. Mortality trends in men and women with diabetes, 1971 to 2000. Ann Intern Med 2007;147:149–55. [DOI] [PubMed] [Google Scholar]
- 12.Lutfiyya MN, McCullough JE, Mitchell L, Dean LS, Lipsky MS. Adequacy of diabetes care for older U.S. rural adults: a cross-sectional population based study using 2009 BRFSS data. BMC Public Health 2011;11:940. [DOI] [PMC free article] [PubMed] [Google Scholar]
- 13.Centers RHRP. Challenges for Improving Health Care Access in Rural America.
- 14.Danaei G, Friedman AB, Oza S, Murray CJ, Ezzati M. Diabetes prevalence and diagnosis in US states: analysis of health surveys. Popul Health Metr 2009;7:16. [DOI] [PMC free article] [PubMed] [Google Scholar]
- 15.Zang E, Lynch SM, West J. Regional differences in the impact of diabetes on population health in the USA. J Epidemiol Community Health 2021;75:56–61. [DOI] [PMC free article] [PubMed] [Google Scholar]
- 16.Barker LE, Kirtland KA, Gregg EW, Geiss LS, Thompson TJ. Geographic distribution of diagnosed diabetes in the U.S.: a diabetes belt. Am J Prev Med 2011;40:434–9. [DOI] [PubMed] [Google Scholar]
- 17.Weaver AM, Bidulescu A, Wellenius GA, et al. Associations between air pollution indicators and prevalent and incident diabetes in an African American cohort, the Jackson Heart Study. Environ Epidemiol 2021;5:e140. [DOI] [PMC free article] [PubMed] [Google Scholar]
- 18.Pearson JF, Bachireddy C, Shyamprasad S, Goldfine AB, Brownstein JS. Association between fine particulate matter and diabetes prevalence in the U.S. Diabetes Care 2010;33:2196–201. [DOI] [PMC free article] [PubMed] [Google Scholar]
- 19.Coogan PF, White LF, Yu J, et al. PM2.5 and Diabetes and Hypertension Incidence in the Black Women’s Health Study. Epidemiology 2016;27:202–10. [DOI] [PMC free article] [PubMed] [Google Scholar]
- 20.Coogan PF, White LF, Jerrett M, et al. Air pollution and incidence of hypertension and diabetes mellitus in black women living in Los Angeles. Circulation 2012;125:767–72. [DOI] [PMC free article] [PubMed] [Google Scholar]
- 21.Chien LC, Alamgir H, Yu HL. Spatial vulnerability of fine particulate matter relative to the prevalence of diabetes in the United States. Sci Total Environ 2015;508:136–44. [DOI] [PubMed] [Google Scholar]
- 22.Towne SD, Bolin J, Ferdinand A, Nicklett EJ, Smith ML, Ory MG. Assessing Diabetes and Factors Associated with Foregoing Medical Care among Persons with Diabetes: Disparities Facing American Indian/Alaska Native, Black, Hispanic, Low Income, and Southern Adults in the U.S. (2011–2015). Int J Environ Res Public Health 2017;14. [DOI] [PMC free article] [PubMed] [Google Scholar]
- 23.Yin Z, Lesser J, Paiva KA, et al. Using Mobile Health Tools to Engage Rural Underserved Individuals in a Diabetes Education Program in South Texas: Feasibility Study. JMIR Mhealth Uhealth 2020;8:e16683. [DOI] [PMC free article] [PubMed] [Google Scholar]
- 24.Smith ML, Zhong L, Lee S, Towne SD Jr., Ory MG. Effectiveness and economic impact of a diabetes education program among adults with type 2 diabetes in South Texas. BMC Public Health 2021;21:1646. [DOI] [PMC free article] [PubMed] [Google Scholar]
- 25.Gurka MJ, Filipp SL, DeBoer MD. Geographical variation in the prevalence of obesity, metabolic syndrome, and diabetes among US adults. Nutr Diabetes 2018;8:14. [DOI] [PMC free article] [PubMed] [Google Scholar]
- 26.Fastring D, Nadorff D, DeShong H. The Influence of Rurality on Fruit and Vegetable Intake and BMI: Findings in Mississippi Are Not Consistent with Those at the National Level. Int J Environ Res Public Health 2021;18. [DOI] [PMC free article] [PubMed] [Google Scholar]
- 27.Lutfiyya MN, Chang LF, Lipsky MS. A cross-sectional study of US rural adults’ consumption of fruits and vegetables: do they consume at least five servings daily? BMC Public Health 2012;12:280. [DOI] [PMC free article] [PubMed] [Google Scholar]
- 28.Hill-Briggs F, Adler NE, Berkowitz SA, et al. Social Determinants of Health and Diabetes: A Scientific Review. Diabetes Care 2020;44:258–79. [DOI] [PMC free article] [PubMed] [Google Scholar]
- 29.Rutledge SA, Masalovich S, Blacher RJ, Saunders MM. Diabetes Self-Management Education Programs in Nonmetropolitan Counties - United States, 2016. MMWR Surveill Summ 2017;66:1–6. [DOI] [PMC free article] [PubMed] [Google Scholar]
- 30.Luo H, Bell RA, Winterbauer NL, et al. Trends and Rural-Urban Differences in Participation in Diabetes Self-management Education Among Adults in North Carolina: 2012–2017. J Public Health Manag Pract 2020. [DOI] [PubMed] [Google Scholar]
- 31.Mercado CI, McKeever Bullard K, Gregg EW, Ali MK, Saydah SH, Imperatore G. Differences in U.S. Rural-Urban Trends in Diabetes ABCS, 1999–2018. Diabetes Care 2021;44:1766–73. [DOI] [PMC free article] [PubMed] [Google Scholar]
- 32.Hale NL, Bennett KJ, Probst JC. Diabetes care and outcomes: disparities across rural America. J Community Health 2010;35:365–74. [DOI] [PubMed] [Google Scholar]
- 33.Ariel-Donges AH, Gordon EL, Dixon BN, et al. Rural/urban disparities in access to the National Diabetes Prevention Program. Transl Behav Med 2020;10:1554–8. [DOI] [PMC free article] [PubMed] [Google Scholar]
- 34.Gerstein HC, Miller ME, Byington RP, et al. Effects of intensive glucose lowering in type 2 diabetes. N Engl J Med 2008;358:2545–59. [DOI] [PMC free article] [PubMed] [Google Scholar]
- 35.Dugani SB, Fabbri M, Chamberlain AM, et al. Premature Myocardial Infarction: A Community Study. Mayo Clin Proc Innov Qual Outcomes 2021;5:413–22. [DOI] [PMC free article] [PubMed] [Google Scholar]
- 36.Dugani SB, Moorthy MV, Li C, et al. Association of Lipid, Inflammatory, and Metabolic Biomarkers With Age at Onset for Incident Coronary Heart Disease in Women. JAMA Cardiol 2021;6:437–47. [DOI] [PMC free article] [PubMed] [Google Scholar]
- 37.Dugani SB, Hydoub YM, Ayala AP, et al. Risk Factors for Premature Myocardial Infarction: A Systematic Review and Meta-analysis of 77 Studies. Mayo Clin Proc Innov Qual Outcomes 2021;5:783–94. [DOI] [PMC free article] [PubMed] [Google Scholar]
- 38.Egede LE, Dismuke CE, Walker RJ, Williams JS, Eiler C. Cost-Effectiveness of Technology-Assisted Case Management in Low-Income, Rural Adults with Type 2 Diabetes. Health Equity 2021;5:503–11. [DOI] [PMC free article] [PubMed] [Google Scholar]
- 39.Rafie C, Hosig K, Wenzel SG, Borowski S, Jiles KA, Schlenker E. Implementation and outcomes of the Balanced Living with Diabetes program conducted by Cooperative Extension in rural communities in Virginia. Rural Remote Health 2021;21:6620. [DOI] [PubMed] [Google Scholar]
- 40.Higa C, Davidson EJ, Loos JR. Integrating family and friend support, information technology, and diabetes education in community-centric diabetes self-management. J Am Med Inform Assoc 2021;28:261–75. [DOI] [PMC free article] [PubMed] [Google Scholar]
- 41.Bray P, Cummings DM, Morrissey S, et al. Improved outcomes in diabetes care for rural African Americans. Ann Fam Med 2013;11:145–50. [DOI] [PMC free article] [PubMed] [Google Scholar]
- 42.Harrington RA, Califf RM, Balamurugan A, et al. Call to Action: Rural Health: A Presidential Advisory From the American Heart Association and American Stroke Association. Circulation 2020;141:e615–e44. [DOI] [PubMed] [Google Scholar]
- 43.Lin YP, Lu TH. Trends in death rate from diabetes according to multiple-cause-of-death differed from that according to underlying-cause-of-death in Taiwan but not in the United States, 1987–2007. J Clin Epidemiol 2012;65:572–6. [DOI] [PubMed] [Google Scholar]
- 44.Rodriguez F, Blum MR, Falasinnu T, et al. Diabetes-attributable mortality in the United States from 2003 to 2016 using a multiple-cause-of-death approach. Diabetes Res Clin Pract 2019;148:169–78. [DOI] [PubMed] [Google Scholar]
- 45.Healthy People 2030. 2021. (Accessed October 26, 2021, 2021, at https://health.gov/healthypeople.)
Associated Data
This section collects any data citations, data availability statements, or supplementary materials included in this article.