

Abstract
Pancreatic ductal adenocarcinoma (PDAC) is a highly aggressive disease with poor 5-year survival rates, necessitating identification of novel therapeutic targets. Elucidating the biology of the tumor immune microenvironment (TiME) can provide vital insights into mechanisms of tumor progression. In this study, we developed a quantitative image processing platform to analyze sequential multiplexed immunohistochemistry data from archival PDAC tissue resection specimens. A 27-plex marker panel was employed to simultaneously phenotype cell populations and their functional states, followed by a computational workflow to interrogate the immune contextures of the TiME in search of potential biomarkers. The PDAC TiME reflected a low-immunogenic ecosystem with both high intratumoral and intertumoral heterogeneity. Spatial analysis revealed that the relative distance between IL-10+ myelomonocytes, PD-1+ CD4+ T cells, and Granzyme B+ CD8+ T cells correlated significantly with survival, from which a spatial proximity signature termed imRS was derived that correlated with PDAC patient survival. Furthermore, spatial enrichment of CD8+ T cells in lymphoid aggregates was also linked to improved survival. Altogether, these findings indicate that the PDAC TiME, generally considered immuno-dormant or immunosuppressive, is a spatially-nuanced ecosystem orchestrated by ordered immune hierarchies. This new understanding of spatial complexity may guide novel treatment strategies for PDAC.
Keywords: Tumor-immune microenvironment, Pancreatic ductal adenocarcinoma, Prognostic biomarkers, spatial architecture, Immuno-oncology
INTRODUCTION
Pancreatic cancer is projected to be the second leading cause of cancer-related death worldwide by 2030 (1). Pancreatic ductal adenocarcinoma (PDAC) is the most prevalent type of pancreatic cancer accounting for over 90 percent of all pancreatic malignancies diagnosed (2). PDAC is highly aggressive and demonstrates a strikingly poor 5-year survival rate of approximately 10% in the United States (3). Surgical resection is generally considered the only curative treatment for localized PDAC, when clinically a viable option (4). However, more than 80% of tumors are non-resectable at the time of diagnosis, and most patients who benefit from surgery may eventually recur (5,6). As a result, developing novel treatment strategies for PDAC is an urgent yet unmet medical need.
In recent decades, advancements in immunotherapy have led to some modest improvements in PDAC treatment. Currently, there are several clinical trials evaluating anti-cancer efficacy of immune checkpoint inhibitors and cancer vaccines (7–9). For instance, Jaffee and colleagues evaluated neoadjuvant GVAX with or without low-dose cyclophosphamide in patients with resectable PDAC and reported evidence of pro-inflammatory immunologic changes within PDAC tumors in response to GVAX (10). Bockorny and colleagues evaluated the synergistic effects of a CXC chemokine receptor 4 antagonist (BL-8040) in combination with PD-1 inhibition (pembrolizumab) and chemotherapy in PDAC, and reported that dual blockade improved clinical outcomes (11). Despite significant survival benefits associated with aforementioned treatments, the overall response rates were modest. Therefore, identifying novel therapy targets and predictive biomarkers will guide new clinical strategies for PDAC treatment. In general, searching for novel biomarkers relies on the notion that an activated tumor immune microenvironment (TiME) favors positive response to immunotherapy. The PDAC TiME has traditionally been considered T cell-suppressive, thus presenting considerable barriers to establishing effective biomarkers for patient stratifications (12,13). As a result, a more nuanced understanding of the biology of TiME is warranted for rational disease control.
Recent developments in high-dimensional multiplexed imaging technologies allow for simultaneous phenotyping of multiple cell populations with their spatial domains preserved, thus facilitating a better understanding of TiMEs. For instance, previous studies have reported the prognostic significances of spatial landscapes for a series of immune populations featuring B cells, T cells, myelomonocytes, and cancer-associated fibroblasts in PDAC TiMEs (14–18). Although these studies shed light on features of distinct immune populations, how they cooperatively impact anti-tumor immunity remains unknown. Indeed, anti-tumor immunity requires structured, spatially-coordinated interplay between components of the TiME. Schürch and colleagues reported that coupling of distinct cellular neighborhoods alters anti-tumor behaviors in colorectal cancer (19); similarly, Jackson and colleagues described higher-order interactions between immune phenotypes, namely spatial communities, to be correlated with clinical outcomes for patients with triple-negative breast cancer (20).
To this end, we deployed a multiplexed immunohistochemistry-based computational pathology framework and applied it to tumor resections from archival single-institution patient cohorts with PDAC consisting of a treatment-naïve group and a presurgically-treated group. This framework is a significant expansion of our previous studies (21–23), while also building on studies from other groups (19,24). The imaging system herein utilized a comprehensive lymphoid and myeloid marker antibody panel to profile leukocyte populations in histopathologically-defined regions within PDAC TiMEs. An image processing pipeline was then implemented to capture the multi-scale immune architectures. Altogether, such workflows enable assessment of complex TiME biology and relationship to clinical outcomes, with potential applications to informing effective patient stratification and rationally-designed clinical trials.
MATERIALS AND METHODS
Data Acquisition with multiplex immunohistochemistry
Multiplexed immunohistochemical staining was performed as previously described (25). mIHC-stained mages utilized in the current study included specimens from cohort 1 of the treatment-naïve group and presurgically-treated group, stained previously with the functional panel (Table S1). A subset of biomarkers from this panel were used to evaluate higher order cell types with greater expected abundance. In the present study, the treatment-naïve group was used for biomarker discovery, denoted as discovery cohort; presurgically-treated group was used for validation, denoted as validation cohort. Patient characteristics for both cohorts were summarized in Table S2–3. Images were acquired using an Aperio AT2 scanner (Leica Biosystems) at 20x magnification. Human PDAC specimens were obtained in accordance with the Declaration of Helsinki and were acquired with written informed consent by Institutional Review Boards at Johns Hopkins University and Oregon Health and Science University.
Image processing and analysis
Regions were selected and annotated in Aperio ImageScope (Leica Biosystems, RRID: SCR_014311) and saved as an XML. Selected regions of each stain from each tissue were extracted and registered to the final hematoxylin stain in MATLAB version R2018b (The MathWorks, Inc., Natick, MA, RRID: SCR_001622) using detectSURFFeatures to identify the strongest matching key points from each of the RGB channels and selecting the channel with the highest matching key points. ROI areas for each patient are summarized in Table S4. A geometric transformation for each mIHC stain to the corresponding hematoxylin was estimated based on similarity of matched key points with outliers excluded using the M-estimator Sample Consensus algorithm (MSAC). The transformation was applied to each RGB channel and merged to create the composite registered RGB image region. Color deconvolution was performed in FIJI (RRID: SCR_002285) by converting the RGB image to CMYK and using the Y channel to extract AEC chromogenic signal. Nuclei segmentation was watershed based and performed in FIJI by first using color deconvolution [H AEC] to separate hematoxylin signal, followed by smoothing, background subtraction and Otsu thresholding. Cell Profiler was used to quantify mean intensity of each segmented cell, along with area and centroid location (Fig. 1A). The resulting feature matrix was used in FCS Express 7 Image Cytometry RUO (De Novo Software Glendale, CA) where each tissue region was manually gated for single cell classification and visually validated with live rendering of the segmentation mask on top of the signal extracted image (Fig. 1B and Fig. S1). Phenotyping results as well as the registered pseudo-colored multi-channel images were visualized in Fig. 1C.
Figure 1.
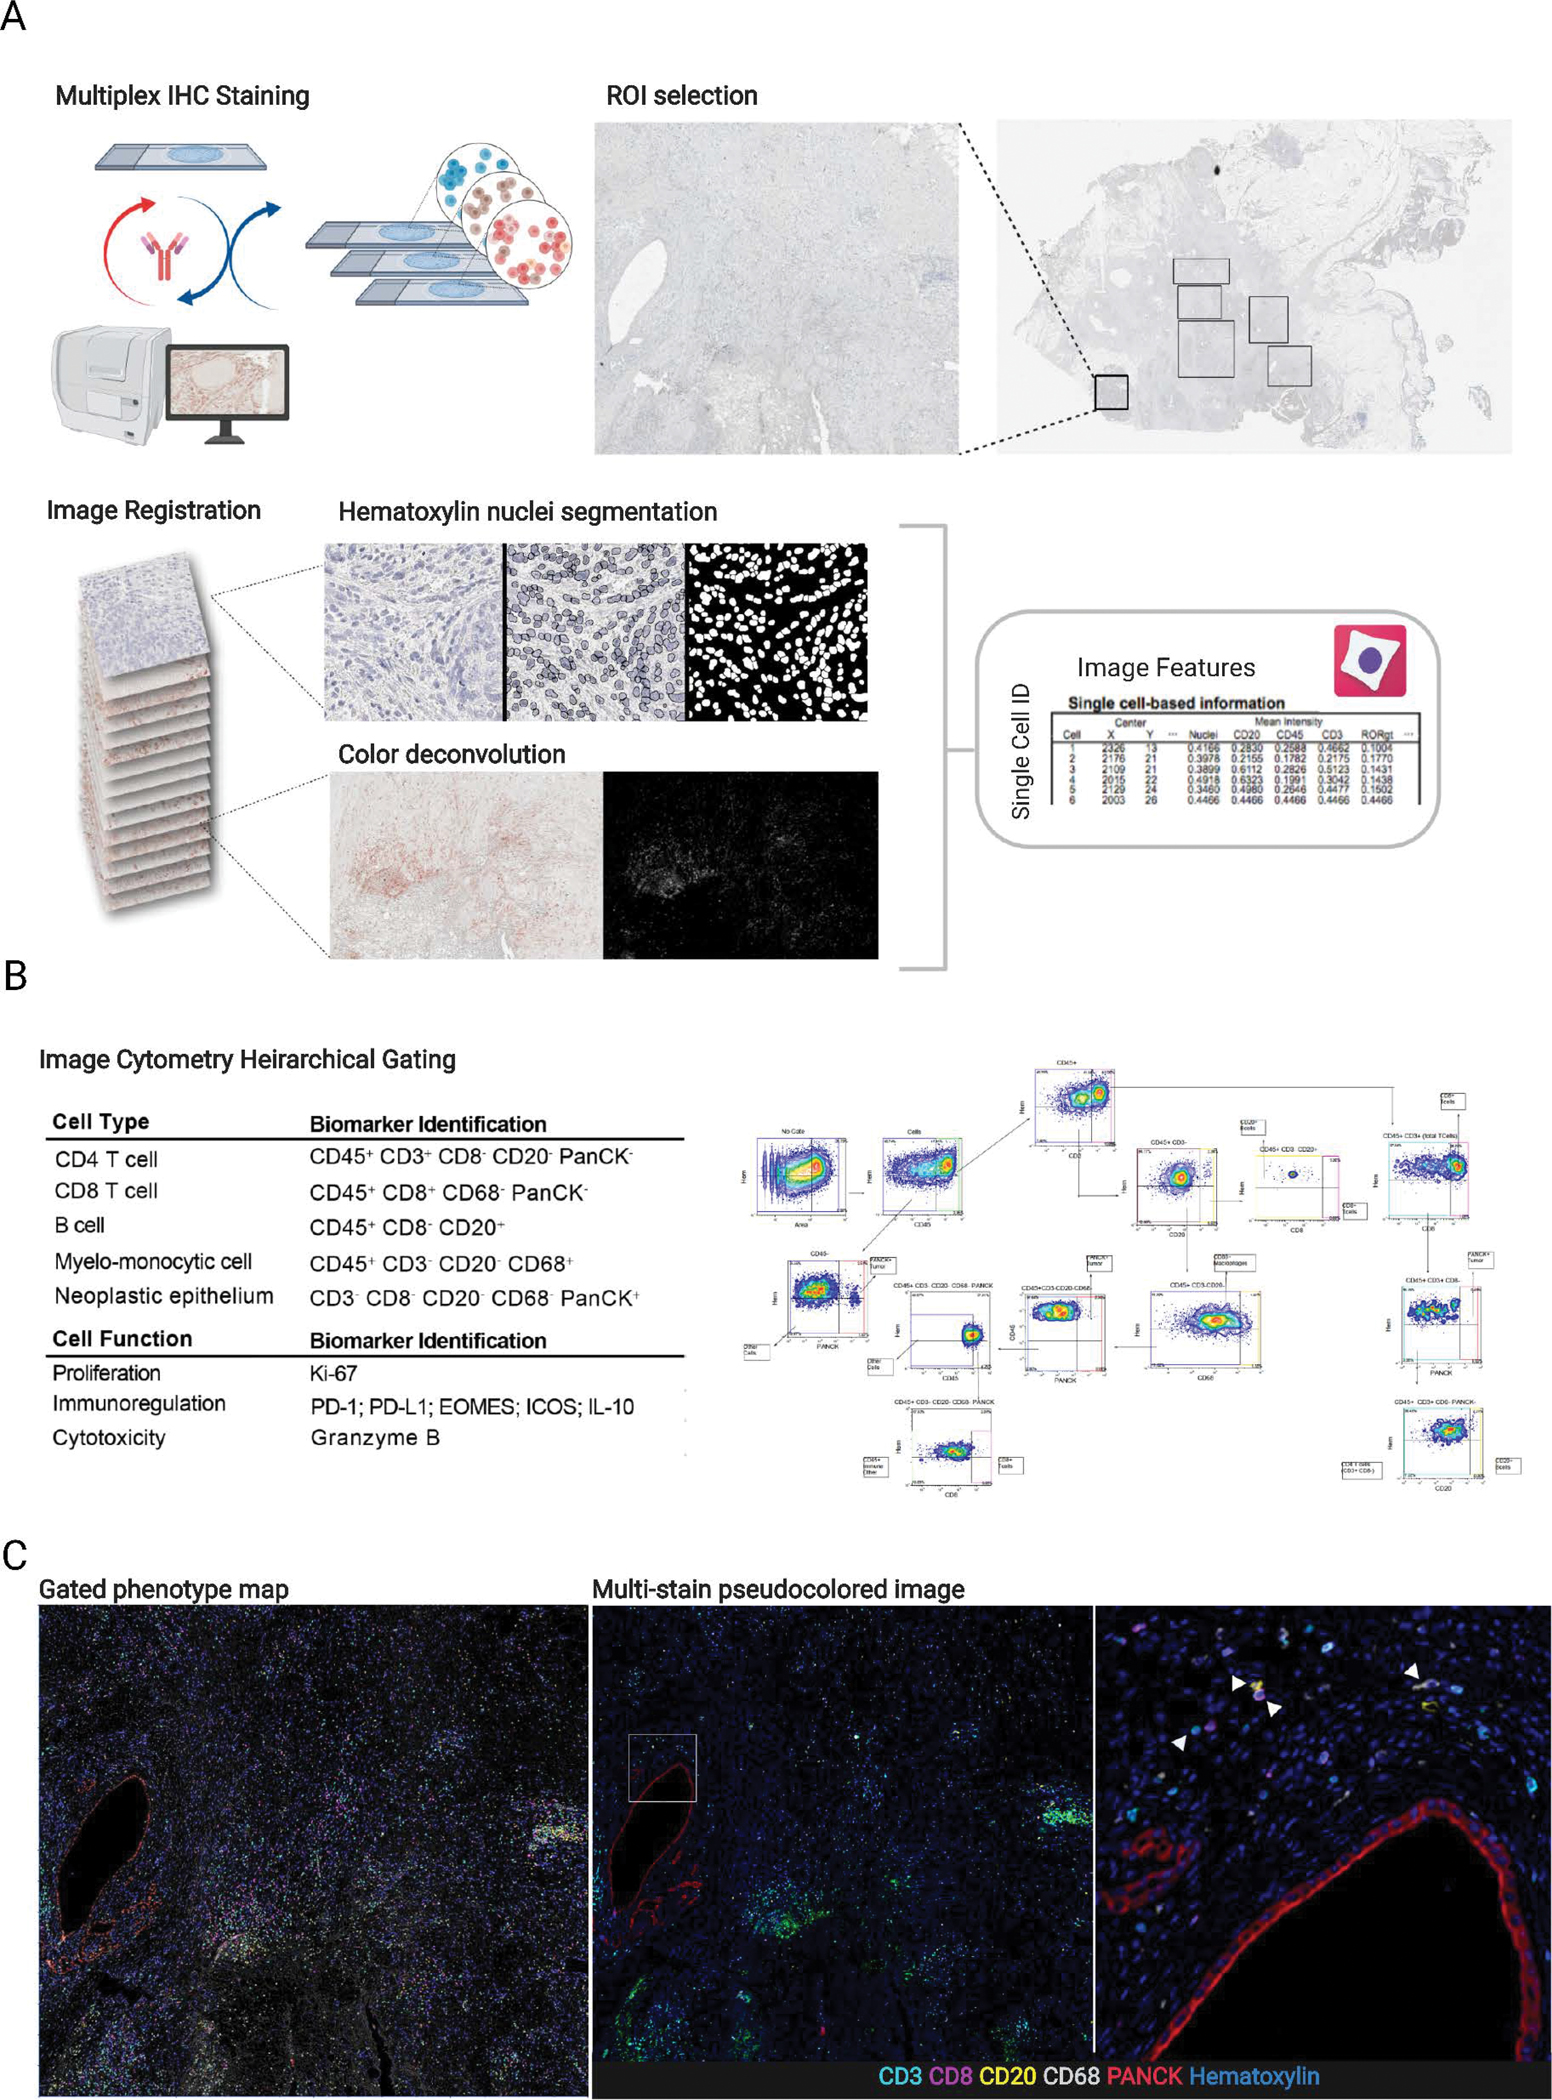
A, Overview of multiplex IHC staining and analysis pipeline including ROI selection from a PDAC resection, image registration, nuclei segmentation, color deconvolution and single cell measurements. B, table describing biomarkers used for identifying cell types and functional states (left) alongside a visual of the gating strategy (right). The full gating strategy and description can be found in Supplementary Figure 1. C, Gated phenotype map shows cells classified from manual gating (left); same region shown as a pseudo-fluorescent image (middle). White box indicates area of the right panel image; zoomed in region from middle panel image showing cells with biomarkers used for identification. White arrows (left to right) point to a CD3 T cell, CD20 B cell, CD8 T cell, and CD68 myelomonocytic cell.
Characterization of spatial heterogeneity
A previously introduced spatial form of Shannon’s entropy (ESP) was implemented to quantify the spatial heterogeneity (22). ESP is formally defined as:
where denotes the average Euclidean distance between all cell centroids of type i; represents the average distance between all cells of set i and cells of all other types; pi is the percentage of type i within the core.
Evaluation of spatial correlations
To evaluate the spatial correlation between each pair of immune cell phenotypes, we utilized the spatial G(r) function (Gcross) to model the clustering pattern. Gcross computed the likelihood of seeing at least one cell of phenotype j around a cell of phenotype i, denoted as Gcross(i-j) within a series of radii. Here, we chose the maximum evaluable radius as 50 μm, to ensure clustering patterns were fully captured. Gcross values were estimated at every 0.05 μm to maximize continuity, then stratified into four bins based on the evaluated radius: (1) 10 – 20 μm; (2) 20 – 30 μm; (3) 30 – 40 μm; and (4) 40 – 50 μm. The bin selection was based upon previous studies that evaluated direct cell-cell interactions and enables a plausible profiling of clustering (26–28). G(r) was computed using ‘Gcross’ function from R package ‘spatstat’ (29).
Enrichment score
ROIs with at least 10 CD4+ T cells and 10 myelomonocytes were subjected to analysis. The enrichment score was computed for both CD4+ T cells and myelomonocytes on a per-ROI basis. For example, for myelomonocytes, the procedure is as follows: For each evaluable ROI, we computed the distance from all myelomonocyte centroids to CD4+ T cell centroids. Next, myelomonocytes located within 50 μm of at least one CD4+ T cell were identified and defined as neighbors of those CD4+ T cells. Then, for every protein x ∈ X = {PD-L1, PD-1, IL-10, GZMB, Ki67, EOMES, ICOS}, the following procedures were conducted: (i) the ratio of neighbors positive for x was computed, denoted as R0; (2) repeatedly randomize the location of myelomonocytes. For the ith randomization, the ratio was also computed and denoted as Ri, where i ∈ {1, 2, 3, …., n}; (3) Enrichment score was formally defined as the proportion of R0 greater than Ri. The protocol was also implemented in reverse with CD4+ T cells as neighbors of myelomonocytes. Here, distances were computed using ‘dist2’ function from R package ‘flexclust’; randomization was implemented using ‘runifpoint’ function from R package ‘spatstat’.
IL-10+ myelomonocyte RiskScore (imRS)
ROIs with at least one IL-10+ myelomonocyte, at least one PD-1+ CD4+ T cell, and at least one GZMB+ CD8+ T cell were subjected to analysis. For every IL-10+ myelomonocyte, the distances to its nearest PD-1+ CD4+ T cell and GZMB+ CD8+ T cell were computed and denoted as d1 and d2 respectively. The IL-10+ myelomonocyte RiskScore is formally defined as:
RiskScore, also termed as imRS in this study, reflects the balance of IL-10+ myelomonocyte between high immunosuppressive risk and low immunosuppressive risk. Close proximity to PD-1+ CD4+ T cells will result in d1 decreasing and d2 increasing, therefore resulting in low imRS.
CD8+ T cell – B cell network morphometrics
ROIs with at least 100 total CD8+ T cells and 100 total B cells were subjected to analysis. For each evaluable ROI, cell dataset were truncated to include CD8+ T cells and B cells only. A HDBSCAN algorithm was first applied to identify clusters. For each cluster, Voronoi tessellation was then generated. Here, each cell was treated as a node. For each pair of Voronoi polygons that share at least one border, the associated nodes were connected to formulate a link. The set of nodes and links formed the cluster network. To facilitate the computation of cluster morphometrics, the α-shape and convex hull of each cluster was also derived. In this study, four morphometrics were gauged:
Cluster area: measures the area of convex hull.
Circularity: measures the roundness of the object. Here, circularity is defined as:
where Aconc is the area of the α-shape, Pconc is the perimeter of the concave hull.
Eccentricity: measures the degree of the object deviation from being circular. Here, we computed the fitting ellipse by first computing the covariance matrix from the cluster point clouds. Assuming the point clouds follow Chi-squared distribution Q~x2 (k), the eigenvectors can be calculated from the covariance matrix yielding the orientations. Thus, the major and minor axis length can be computed as:
respectively, where λ1 and λ2 are eigenvalues of the covariance matrix. According to the definition, the ellipse represents the contour that covers 95% of point clouds. Thus, the eccentricity is computed as:
Convexity: measures the curvature of the object. Here, convexity is defined as:
where Aconv is the area of convex hull.
HDBSCAN algorithm was implemented using ‘hdbscan’ function from R package ‘dbscan’; neighboring Voronoi polygons were identified using ‘voronoi_adjacentcy’ function from R package caramellar; α-shape was computed using the ‘ashape’ function from R package ‘alphahull’; concave hull was computed using the ‘chull’ function from R package ‘grDevice’; covariance matrices from the cluster point clouds were computed using ‘cov.wt’ function from R package ‘stats’; eigenvectors were computed using ‘eigen’ function from base R package; Chi-square distribution at 95% confidence interval was computed using ‘qchisq’ function from R package ‘stats’.
Statistical analysis
Two-sided Wilcoxon rank-sum test was performed for pairwise comparisons using ‘wilcox.test’ function from R package ‘stats’. FDR-adjustment for p values were performed for multiple comparisons using ‘p.adjust’ from R package ‘stats’ and adjusted p < 0.05 was considered significant; Pearson correlation coefficients were computed to assess the linear correlation between two sets of data using ‘cor’ function from R package ‘stats’; Chi-square test was performed to assess the correlation between categorical variables using ‘chisq.test’ function from R package ‘stats’; heatmaps and hierarchical clustering were generated using ‘Heatmap’ function from R package ‘ComplexHeatmap’ (RRID: SCR_017270).
Data availability
The data supporting the findings of this study (single-cell and patient data) are available online at Zenodo (RRID: SCR_004129, https://zenodo.org/record/6416102#.Yky33jfMIrY). Raw images are available from corresponding author upon reasonable requests.
Code availability
The codes for computational methods are made publicly available at GitHub: https://github.com/popellab/PDAC-mIHC-processing-pipeline. And an online-executable capsule is made available at CodeOcean and the link is provided in the GitHub repository.
RESULTS
Patient stratifications
Acknowledging the fact that PDAC is highly aggressive and has poor prognosis, we stratified treatment-naïve patients into two groups reflecting long-term survivors, i.e. above median, and short-term survivors, i.e. below median (based on overall survival days; threshold = 619 days), for downstream evaluations. A merit of such approach is that survival differences can be maximized therefore the subtle spatial heterogeneity can be scaled to facilitate the prognostic marker discovery. Identifying differences first and then correlating to survival may weaken the significance due to misclassification of certain patients. While different splitting strategies have been employed by previous studies for biomarker discovery (25,30,31), there is no consensus on the optimal split approach. In this study, 50% was selected as the cut-off point produced two groups of comparable size, also reducing the risk of overfitting for the downstream analysis. The resulting long-term group consisted of 22 patients with a median overall survival (OS) = 832 days, whereas the short-term group consisted of 23 patients with a median OS = 313 days (Fig. 2A).Using 50% as the cut-off point produced two groups of comparable size, reducing the risk of sample limitations in downstream analysis. In addition, this stratification also exhibits statistical significance between survival groups at the same level (log-rank test p < 0.001), as opposed to alternative stratification strategies (Fig. S2).
Figure 2.
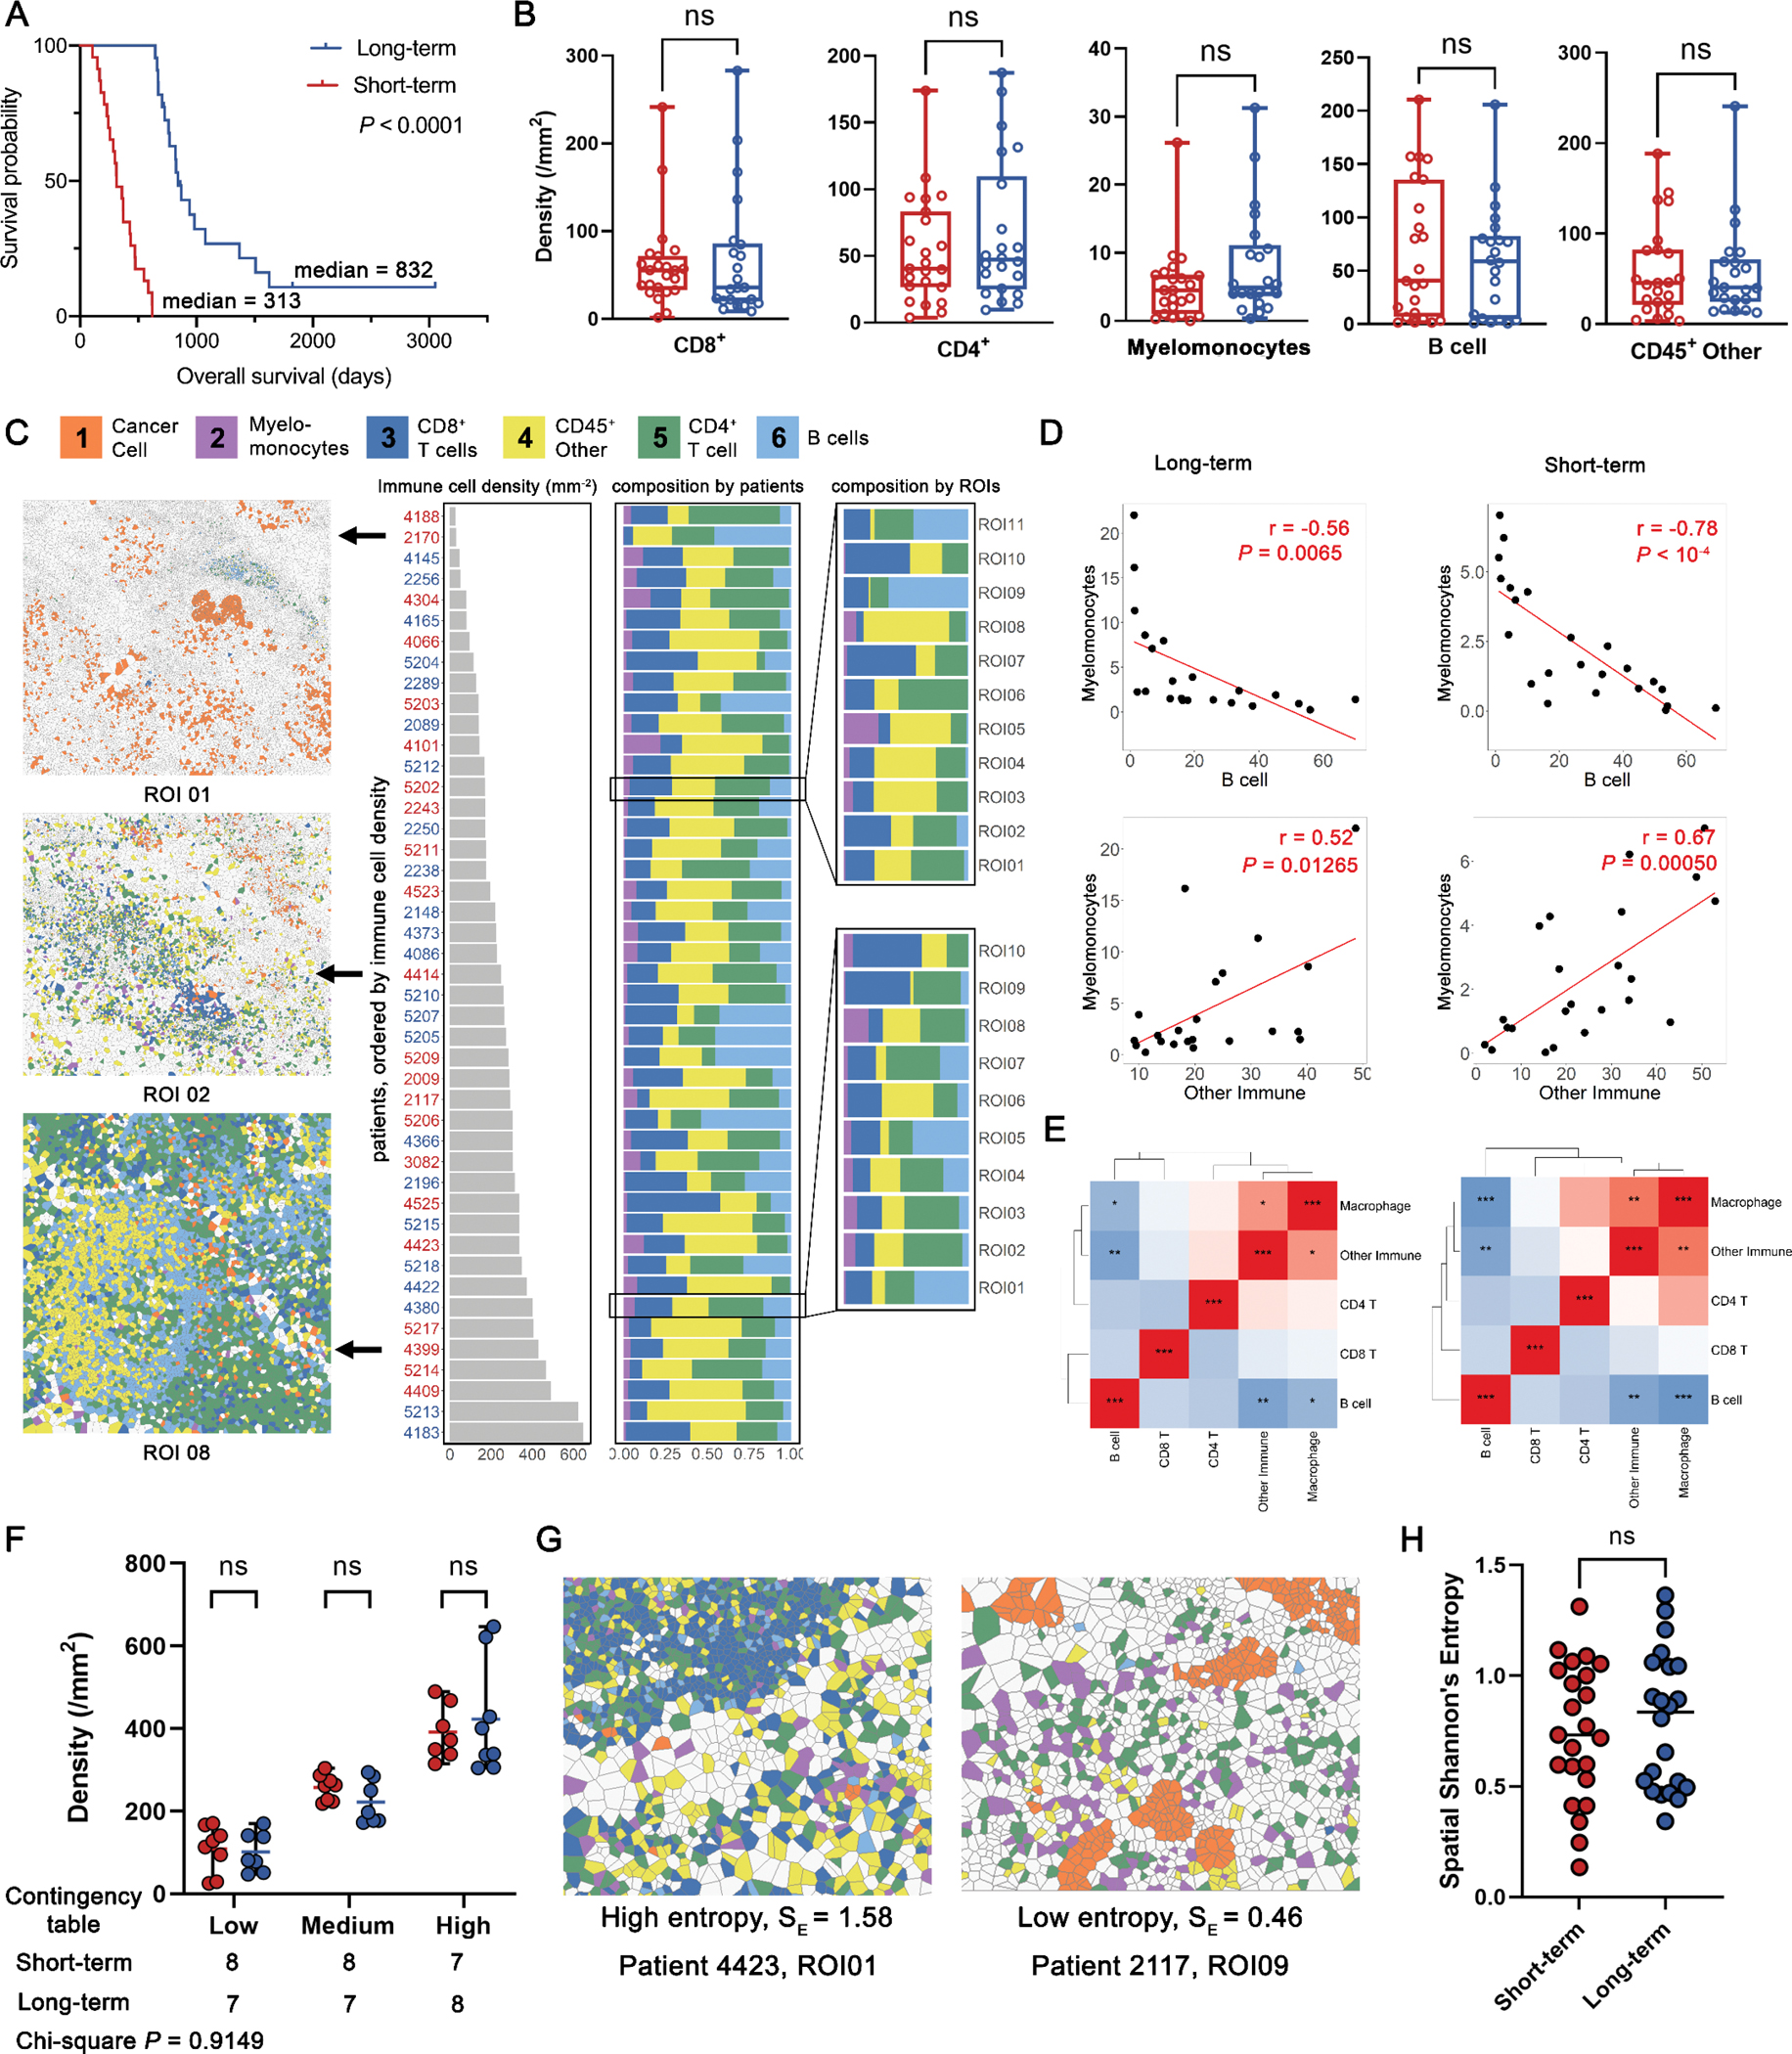
Characterization of the PDAC immune ecosystem. A, A discovery cohort was split into short-term and long-term groups by overall survival using 50% as the cut-off threshold (long-rank test). B, Density of each immune phenotype was compared between long-term and short-term groups; CD45+ other: CD45+ population other than identified immune phenotypes (B cell, myelomonocyte, CD4+ T, and CD8+ T); ns, not significant (Wilcoxon rank-sum test). C, Immune cell densities of all patients were sorted in ascending order and the associated compositions at both patient and ROI level were visualized. D, Correlation analysis identified strong negative correlations between B cell and myelomonocyte density, and positive correlation between myelomonocyte and other immune phenotypes (Pearson coefficient). E, Correlation heatmaps for all immune phenotype pairs showed similar patterns between short- and long-term groups (Pearson coefficient). F, Immune-infiltration levels were quantified into low-, medium-, and high categories and compared within each category; ns, not significant (Wilcoxon rank-sum test); the distribution among all categories was also compared between short- and long-term groups (Chi-square test). G, Exemplary ROI with high and low Spatial Shannon’s entropy. H, Spatial Shannon’s entropy was computed for each ROI and then averaged to the patient level for comparison between short- and long-term groups; ns, not significant (Wilcoxon rank-sum test).
Quantitative image analysis reveals poor immunogenicity in PDAC tumor-immune microenvironment TiME
We applied automated image analysis to profile the immune populations for all patients. Specifically, we quantified the cell densities per region of interest (ROI) for every immune cell phenotype and averaged to the patient-level. Region properties associated with each ROI are summarized in Table S4. Average densities of each cell type were compared between survival groups, but there were no significant differences found (Wilcoxon rank-sum test p > 0.05, Fig. 2B). Nonetheless, all immune cell phenotype densities showed moderate to large variability, thus we further sought to analyze if such variations were driven by different patterns reflecting immune subset compositions. We first sorted leukocyte densities for each patient from low to high, and then calculated the percentage of each leukocyte subset at the per-patient and per-ROI level. We then correlated overall immune cell densities with each immune cell phenotype. Previous studies reported that the compositions of immune subsets was highly correlated with overall immune cell abundances in triple-negative breast cancer (32). Specifically, CD4+ T cells were enriched whereas myelomonocytes were sparse in patients with high-leukocyte infiltration. We observed the same significance for CD4+ T cells but not myelomonocytes in this study for both short- and long-term groups (Fig. S2A–F). However, correlations were identified between immune cell populations densities (Fig. 2C); for instance, myelomonocyte densities were positively correlated with other CD45+ density, but were negatively correlated with B cell densities (Fig. 2D) in both short- and long-term groups. In fact, the density correlation heatmaps revealed that the two groups shared similar correlation profiles. That is, whichever cell correlation pair that was significant in the short-term group, was also significant in the long-term group, with the only difference reflected in significance level (Fig. 2E). Next, we stratified all patients into tertiles reflecting low-, medium-, and high-leukocyte infiltration. We then decomposed each tertile based on the patient’s survival group. Results demonstrated no correlation between immune infiltration levels and survival, as short- and long-term survivors were evenly distributed across all categories (Chi-square p = 0.9149, Fig. 2F). The immune infiltration profiles were further gauged by evaluating compositional heterogeneity. Here, a spatial form of Shannon’s entropy (Esp) was implemented. Briefly, the metric attributes the sources of spatial entropy to the distance between cells and the diversity of cell species and their abundance, that is, close proximity between cells of different types and enrichment of unique cell phenotypes both lead to the increase of Esp (Fig. 2G, Methods and Materials). Previously we reported that high Esp, i.e., high spatial immune heterogeneity, is associated with response to immune-therapy in the context of hepatocellular carcinoma(33). The results here however show no significant difference between short-term and long-term groups (Fig. 2H). Univariate analysis on the aforementioned first-order features included immune population densities and Shannon entropy (Fig. S3A). We first aggregated features from core-level to patient-level by taking the mean. Univariate Cox regression analysis revealed that none of the features significantly associated with survival (p > 0.05) with four features conferred hazard ratios = 1, suggesting these features provide zero risk reduction. Similarly, none of the features was prognostic in multivariate Cox regression analysis (Fig. S3B). It is noteworthy that Shannon entropy yields a relatively higher HR (mean = 4.21); however, the 95% confidence interval extended over a wider range, suggesting less clinical interest.
Together, these findings may potentially indicate that characterization of TiME at low-resolution is not able to make distinctions among patients and it requires higher-order, more complex characterizations to establish potential biomarkers in separating short- versus long-term survivors, though validations on additional cohort is required to eliminate overfitting issues due to small sample size.
Spatial correlation analysis of PDAC delineates orchestrated architecture of immune cell phenotypes
To further model the spatial organization of the immune landscape in PDAC, we applied spatial G(r)-cross function (Gcross) to evaluate cell-cell colocalizations. At this point, CD45+ other cells were not included because their phenotype and functional states were not determined. Gcross was applied to each pair of immune cell phenotypes with both directions (Fig. 3A, Methods and Materials). For instance, Gcross (CD4+– myelomonocyte) evaluates the likelihood of observing CD4+ T cells colocalized with at least one myelomonocyte within a series of radii. High Gcross (CD4+– myelomonocyte) values indicate clustering of myelomonocytes around CD4+ T cells, reflected by steep climbing curves along with the radius gradient (Fig. 3B). Since Gcross is not a symmetrical metric, cell type pairs were evaluated in both directions, where CD4+ T cells or myelomonocytes, were evaluated as the focal cell type. Gcross values were computed with a radius gradient and then binned into four categories for every 10 μm (Methods and Materials) and compared between survival groups within each category. Comparisons identified three pairs that were significant in each category spanning all distances (FDR-adjusted Wilcoxon rank-sum test p < 0.05, Fig. 3C, Table S5). Here, we focused on two-way clustering involving CD4+ T cells and myelomonocytes, indicating a spatial mutual signaling axis, and one-way clustering from B cells to CD8+ T cells, highlighting lymphoid aggregate-like structures. Indeed, the prognostic significance of both patterns has been reported in broader contexts (34–36). Specifically, Gcross values were significantly higher in long-term survivors for both directions between CD4+ T cells and myelomonocytes, while only Gcross (B cell – CD8+ T) was significantly higher in short-term survivors. These results indicate that CD4+ T cells and myelomonocytes exhibited a higher level of mutual colocalization in long-term survivors, while short-term survivors tended to reflect increased density of CD8+ T cells in areas containing B cells (Fig. 3D).
Figure 3.
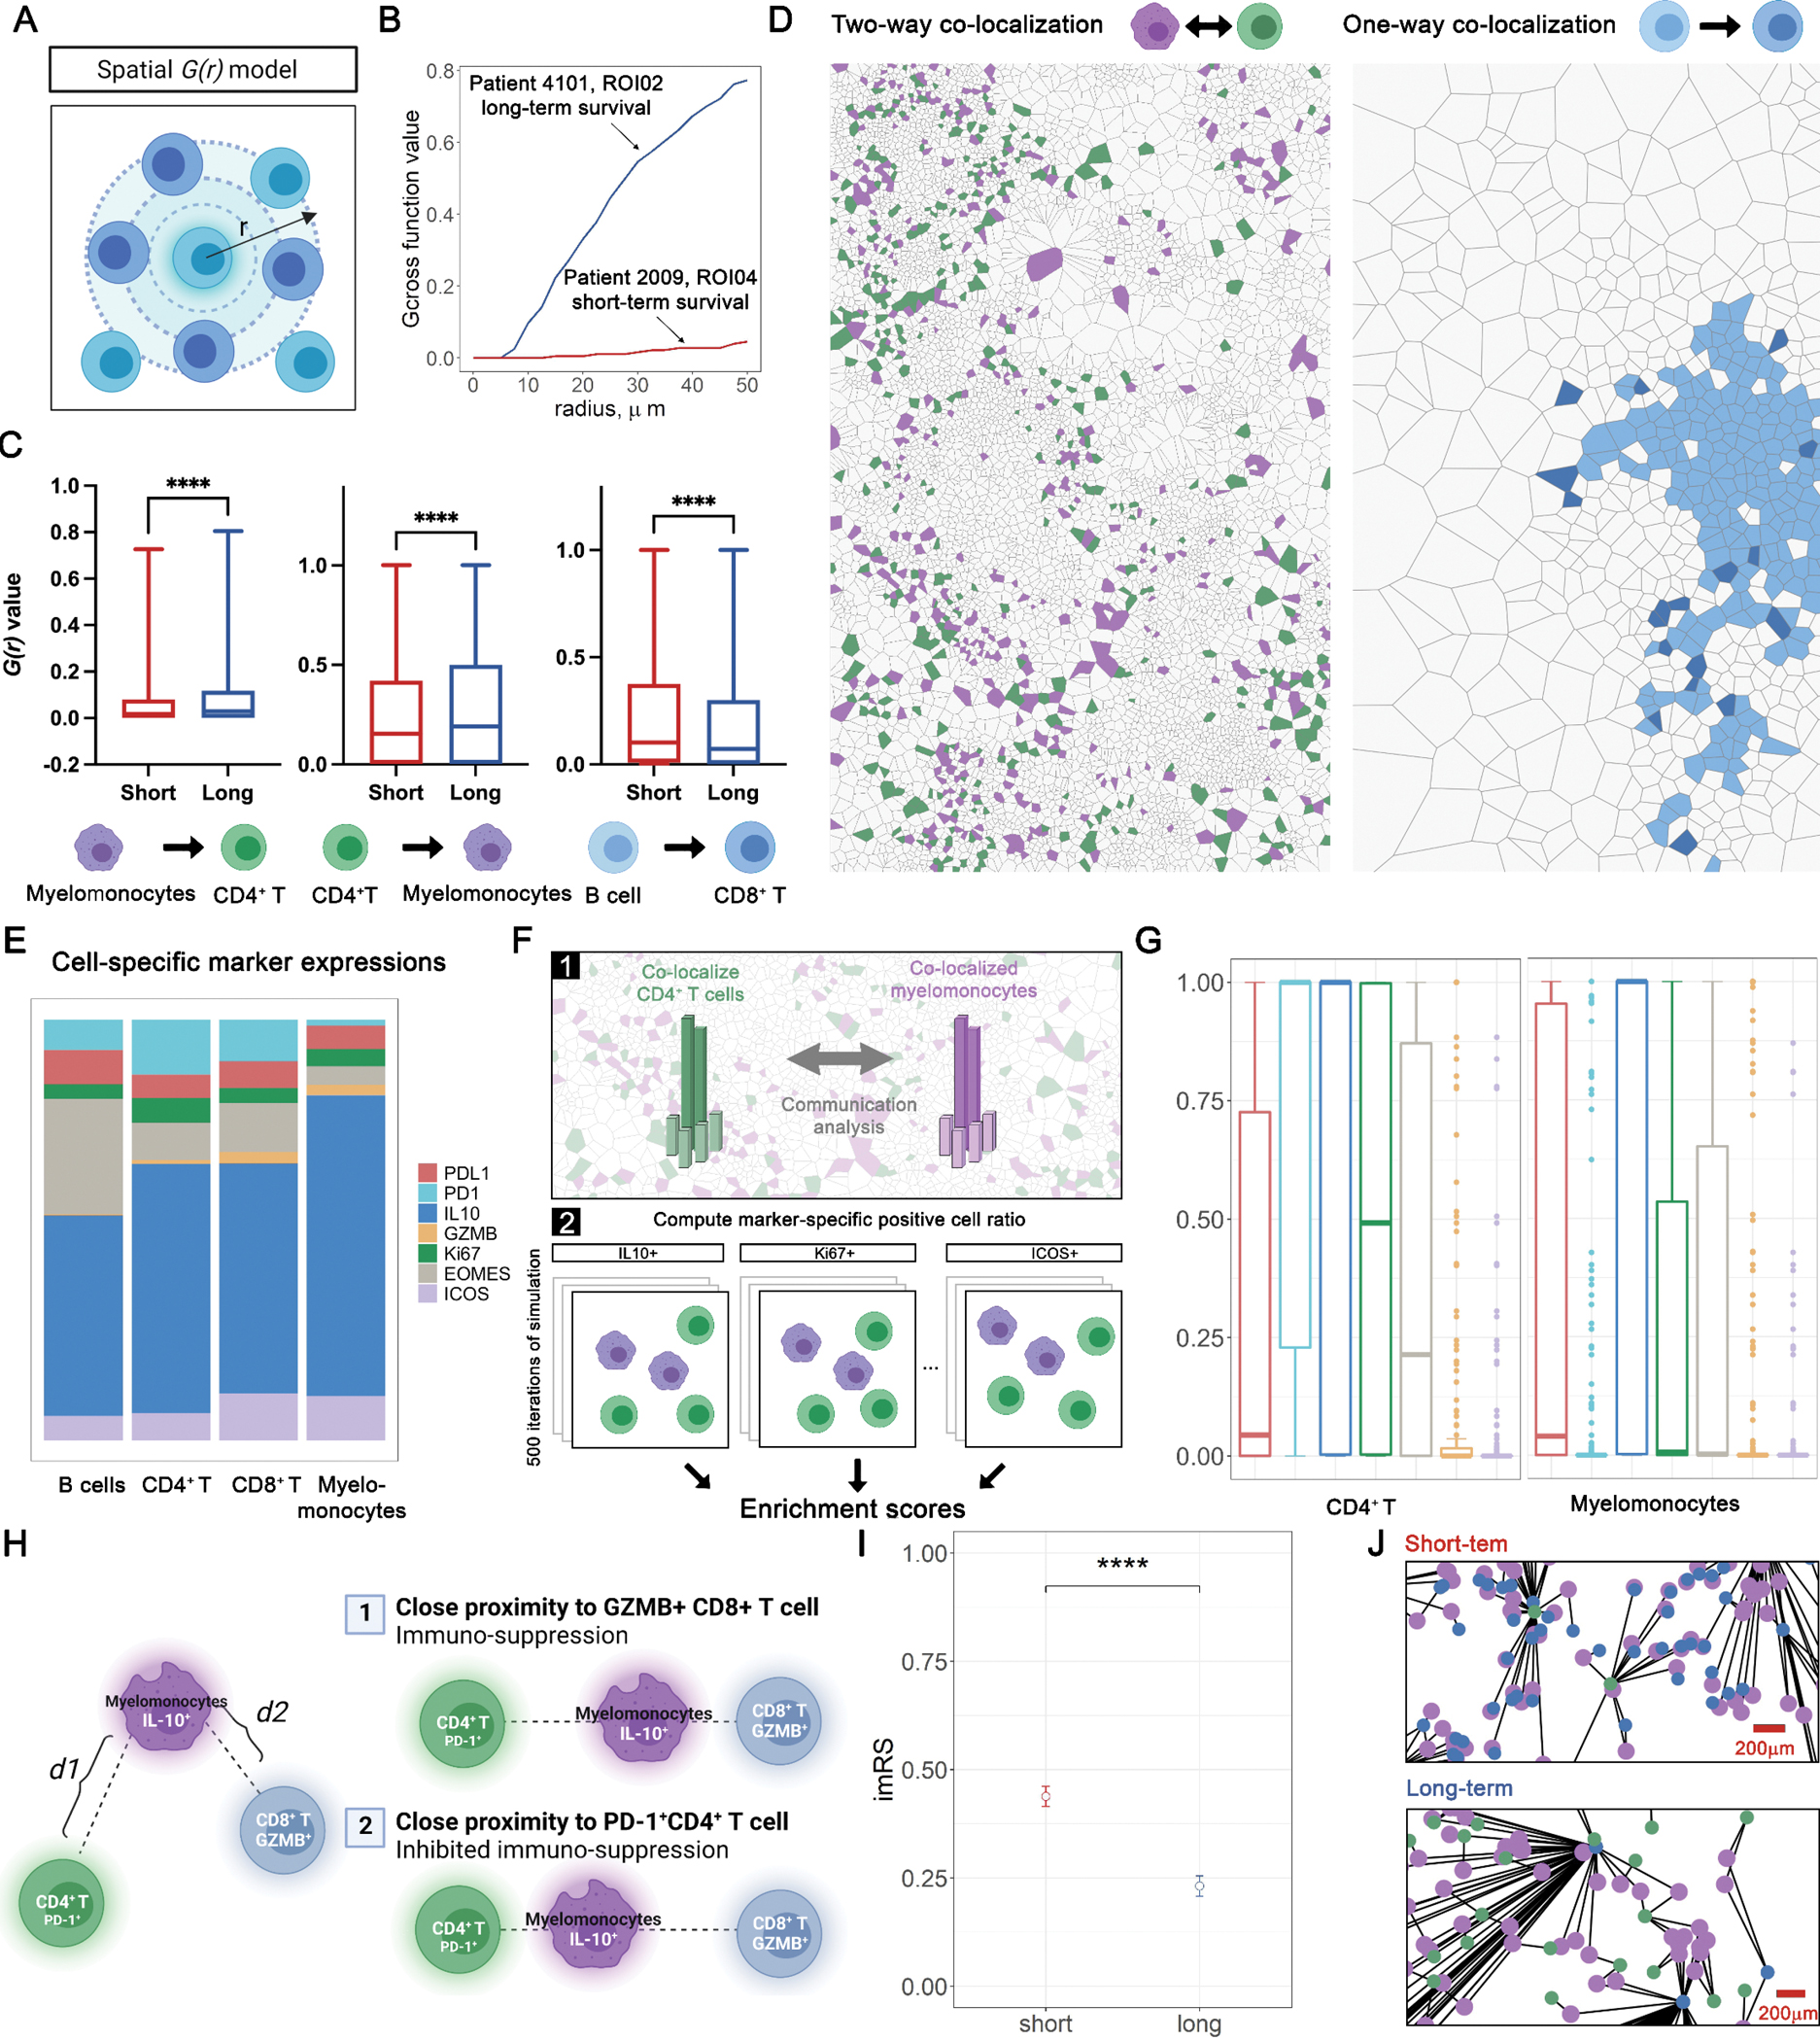
Spatial correlation analysis identifies topological features associated with prognosis. A, schematic of spatial G(r) function (Gcross). B, Exemplary Gcross curves computed for ROIs associated with short-term (red) and long-term (blue) groups. C, Comparisons of Gcross values between short- and long-term groups at four distance intervals identifies three spatial clustering pairs; ***, P < 0.001 (Wilcoxon rank-sum test); D, Aforementioned spatial clustering pairs were summarized into a two-way clustering involving myelomonocytes and CD4+ T cells, and a one-way clustering involving B cells to CD8+ T cells. E, Functional marker expressions across immune phenotypes. F, Schematic of computation of enrichment score. G, Enrichment score computed for each functional marker on both myelomonocytes and CD4+ T cells. H, Schematic of imRS, derived from the relative distances from IL-10+ myelomonocytes (mean of five nearest neighbors, if any) to PD-1+ CD4+ T cells and Granzyme B (GZMB)+ CD8+ T cells (mean of five nearest neighbors, if any). I, imRS was computed at per-cell basis and compared between short- and long-term groups; ***, P < 0.001 (Wilcoxon rank-sum test). J, Exemplar topological graph of IL-10+ myelomonocytes, PD-1+ CD4+ T cells, and GZMB+ CD8+ T cells in short- and long-term groups.
Spatial proximity signature of CD4+ T cell, CD8+ T cell, and myelomonocyte subpopulations associated with PDAC survival
To further decipher the underlying biology of the association between survival and mutual clustering of CD4+ T cells and myelomonocytes, we studied each pair of the relevant cell types and presence of key mediators they express (e.g., PD-L1, PD-1, IL-10, Granzyme B, Ki67, EOMES, ICOS) to evaluate their influence on the clustering. We first quantified the composition for each immune cell phenotype within the cohort and revealed similar patterns across cell types: a majority of myelomonocytes, B cells, CD4+ and CD8+ T cells, were IL-10 positive, with Granzyme B (GZMB) positivity in a minority of these subsets (Fig. 3E). Based on this, we investigated the enrichment score to account for such potential bias caused by the skewness of positive-protein distribution. For each ROI, we repeatedly randomized the geo-locations of cell of type X positive for protein α and recorded the ratio of positive cells within 50 μm of all cells of type Y (neighbors). The enrichment score SEn of the ROI is formally defined as the ratio of the times that the randomization ratio is smaller than the ratio derived from the real point pattern (Fig. 3F, Methods and Materials). The benefit of this approach lies in the fact that the proportion of cells positive for each protein within the ROI is kept consistent throughout the randomization, resulting in the global proportion bias becoming a recurrent constant factor. Under such conditions, high SEn indicates that more neighbors are observed than at random. Given that the global proportion always has the same weight, such close proximity is likely driven by an underlying biological process rather than bias or coincidence. We computed SEn for all ROIs and found that PD-1 positivity had the highest mean for CD4+ T cells (median SEn = 1, mean SEn = 0.65) whereas IL-10 had the highest mean for myelomonocytes (median SEn = 1, mean SEn = 0.70) compared to other markers; the conclusion held under different simulation rounds (Table S6), indicated that PD-1+ CD4+ T cells and IL-10+ myelomonocytes were key contributing factors to the clustering (Fig. 3G).
Previously, Phillips and colleagues developed SpatialScore and reported relationships between spatial proximity of immune subpopulations and response to immuno-therapy in cutaneous T cell lymphoma (37). Of note, the concept of SpatialScore is to characterize the balance between CD4+ T cell effector and immunosuppressive activity. Here, we propose a modification to represent the relative distance of PD-1+ CD4+ T cell to IL-10+ myelomonocyte and GZMB+ CD8+ T cell. To recapitulate this proxy, we included GZMB+CD8+ T cells given that IL-10+ myelomonocyte have been reported to inhibit CD8+ T cell cytotoxicity by direct and indirect mechanisms (immunosuppressive activity) (38,39). In this study, the prediction is that closer proximity between CD4+ T cells and myelomonocytes will correlate with better survival (inhibited immunosuppressive activity). In practice, we first identified the mean distance of each IL-10+ myelomonocyte (evaluable interaction pairs n = 13,451) to its k-nearest PD-1+ CD4+ T cell and k-nearest GZMB+ CD8+ T cell for each ROI (evaluable n = 141), then computed the relative distance ratio to generate the IL-10+ myelomonocyte RiskScore (imRS) (Fig. 3H, Methods and Materials). Here, we set the threshold k = 5 (or equals to the total number of candidates if not abundant) to reduce the sensitivity to outlier or misclassified cells. Quantitative results revealed that the imRS was significantly higher in short-term survivors (mean imRS = 0.44) than long-term survivors (mean imRS = 0.23). It is also noteworthy that the distribution of imRS from long- and short-term groups indicated a distinct IL-10+ myelomonocyte behavior, as they were clearly separated by the 0.5 threshold (Fig. 3I). Visualizations further corroborated such finding: we linked IL-10+ myelomonocyte to their nearest PD-1+ CD4+ T cell and GZMB+ CD8+ T cell on a per-cell basis and visualized the proximity of IL-10+ myelomonocyte adjacent to PD-1+ CD4+ T cells, while remaining distal to GZMB+ CD8+ T cells in long-term survivors (Fig. 3J). Given that the sample size is relatively modest, we sought to test whether such signal was biased that originated from a single ROI or patient. Therefore, we further performed exclusion analysis on the imRS data. We iteratively excluded data from a patient (evaluable N = 31). For each iteration, imRS between short- and long-term survivors were compared using Wilcoxon rank-sum test and p-values were recorded. Results showed that the statistical significances retained over all iterations under both conditions, therefore confirmed the robustness of imRS (Table S7). Collectively, we demonstrated that the spatial proximity signature of IL-10+ myelomonocyteto PD-1+ CD4+ T cell and GZMB+ CD8+ T cell correlates with patient survival in PDAC.
Compositions of B cell and CD8+ T cell clustering associated with PDAC survival
Next, we sought to further interrogate the second significant pattern identified previously, i.e., one-way colocalization between CD8+ T cells and B cells. Visual inspections indicated that the clustering patterns resembled lymphoid aggregates (LAs) (Fig. 4A). Here, we quantified the CD8+ T – B cell aggregates by applying the HDBSCAN algorithm to identify aggregates (n=125). For all cells within each identified aggregate, a network was constructed by first generating the Voronoi tessellation and then connecting all neighboring cells (Methods and Materials). For each network, we measured the following metrics: convex hull area, CD8+ T cell density, B cell density, circularity, eccentricity, and convexity. While results revealed that cluster morphometrics did not associate with survival (Wilcox rank-sum test p > 0.05), CD8+ T cell density per aggregate was significantly higher in long-term survivors (Fig. 4B). In addition, we aggregated the density from per-LA basis to patient-level and fitted a univariate Cox regression model. Results revealed that the density feature significantly contributed to the risk reduction (Wald test p = 0.03) with hazard ratio (HR) = 0.997 (95% CI, 0.9938 – 0.9997). Correlation analysis using Spearman’s method demonstrated same pattern that the density positively correlated with overall survival (ρ = 0.3658, p = 0.35, Fig. S3C).
Figure 4.
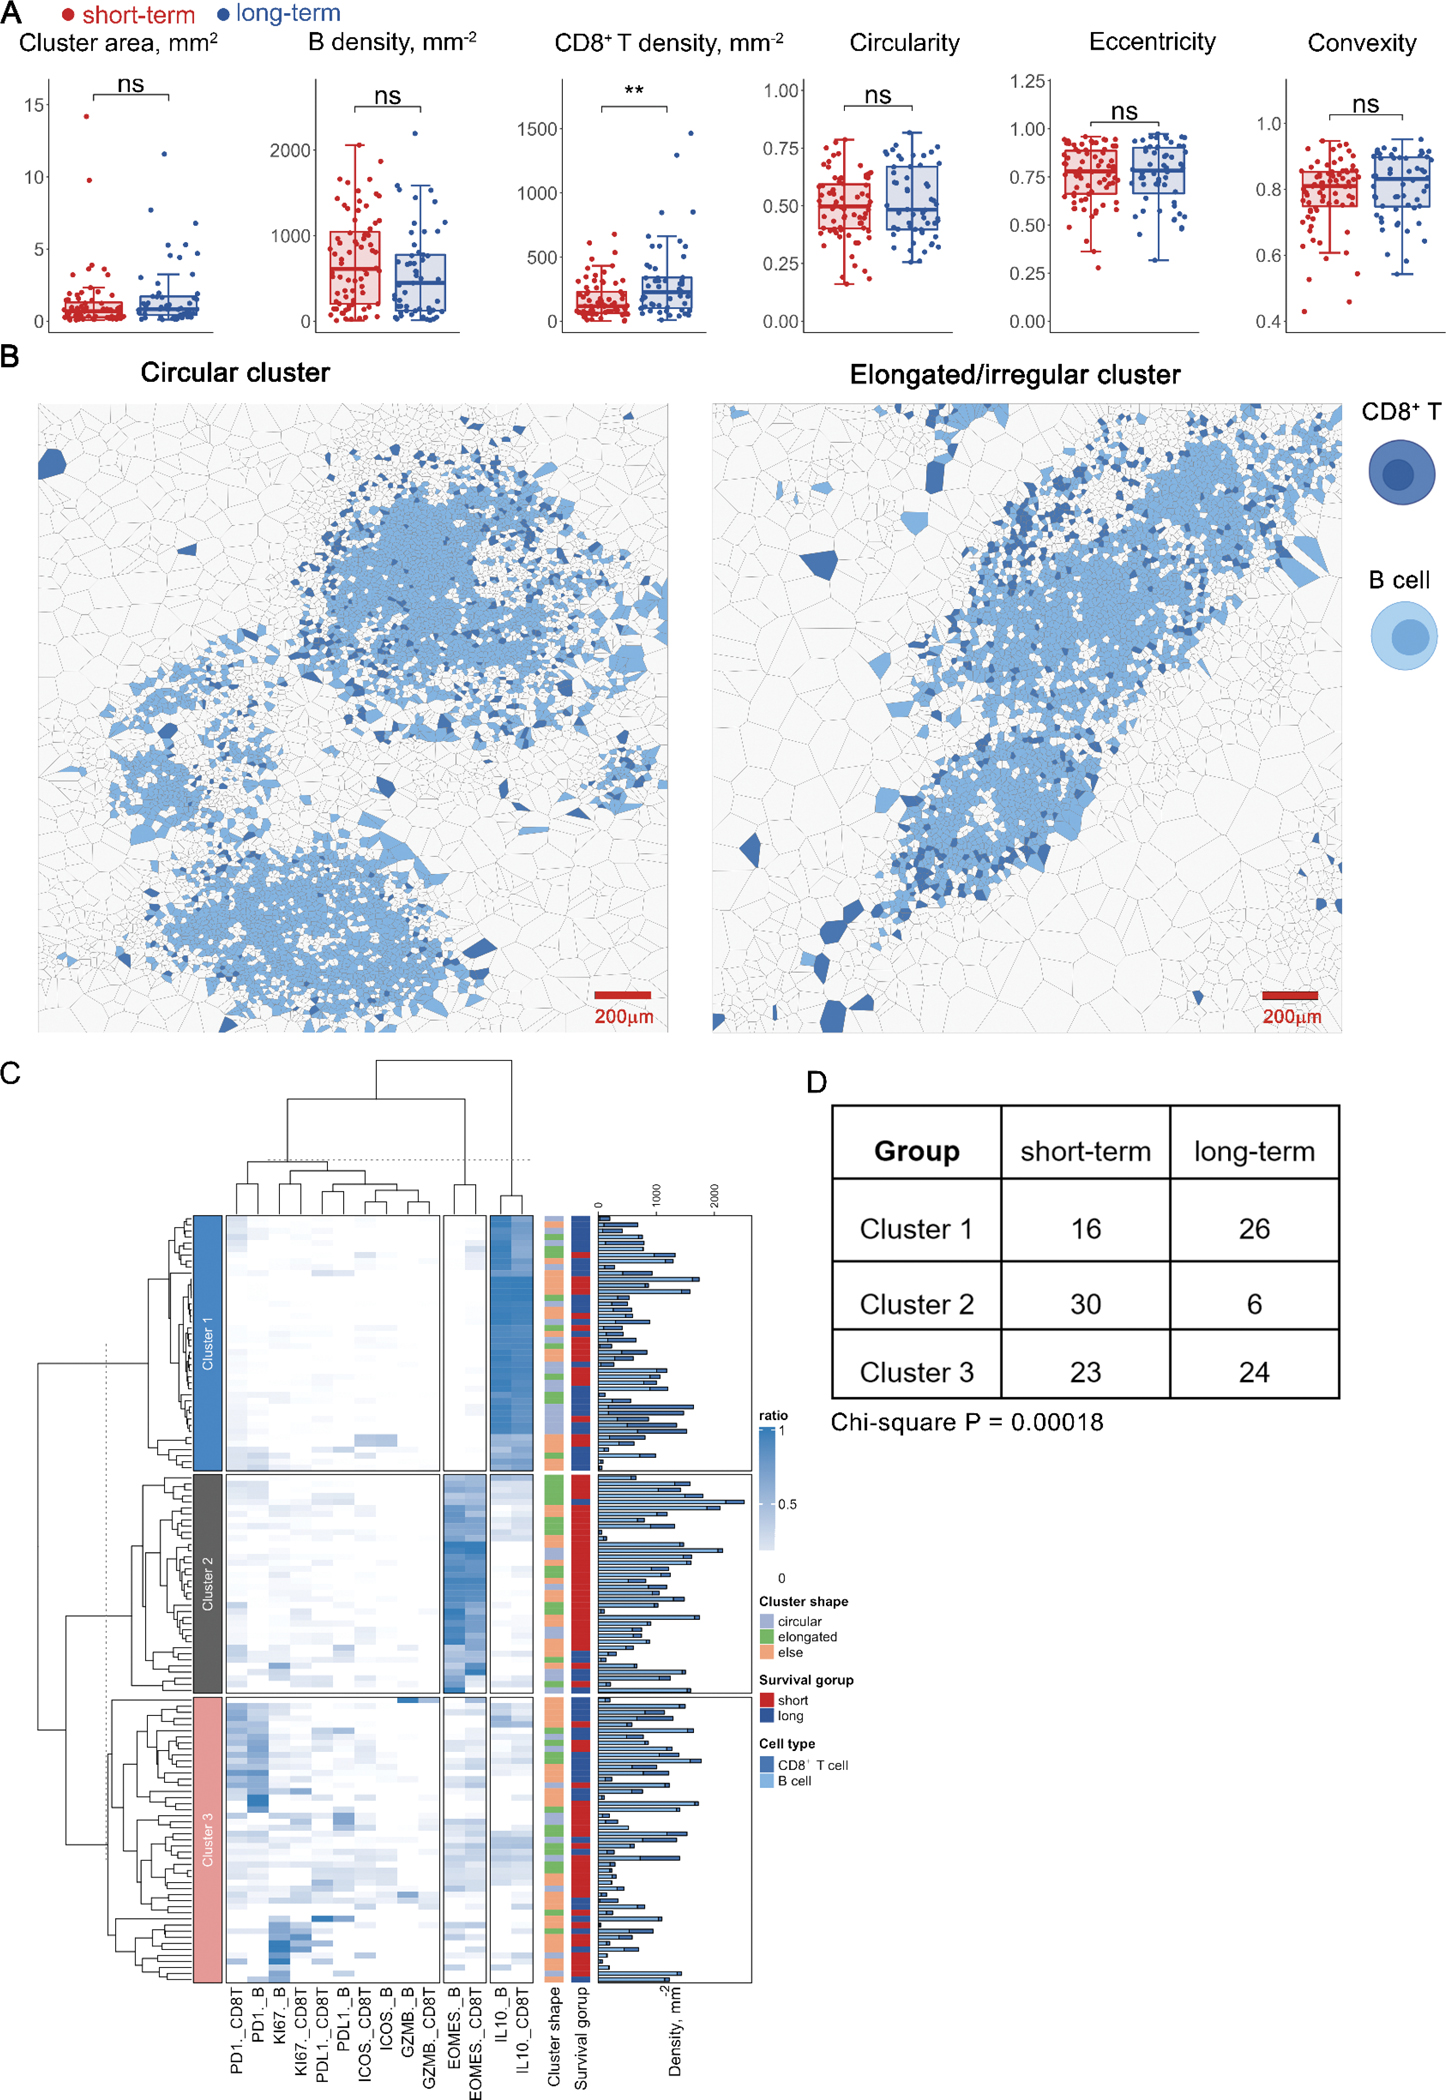
Spatial correlation analysis revealed prognostic significance of lymphoid aggregates (LAs). A, First-order properties (cell densities) and morphometrics were computed and compared between short- and long-term groups; **, P < 0.005, ns, not significant (Wilcoxon rank-sum test). B, Exemplar circular (criteria: eccentricity < 0.8 and convexity > 0.8 and circularity > 0.5) and elongated (criteria: eccentricity > 0.8 or convexity < 0.3 or circularity < 0.3) LA. C, Hierarchically-clustered heatmap of marker expression compositions in LAs, e.g. PD1._CD8T represents PD-1+ CD8+ T cells. Bar plot shows the B cell and CD8+ T cell densities for each LA, respectively. D, Comparison of cluster distribution in different survival groups (Chi-square test).
To further characterize the CD8+ T cell – B cell aggregates, we computed the percentage of CD8+ T cells and B cells that are positive for each functional marker and then applied hierarchical clustering to group networks with similar compositions (Fig. 4C). Results indicated that the clustering algorithm identified three major clusters: in cluster 1, all networks were dominated by IL-10+ B cells and CD8+ T cells; in cluster 2, an accumulation of EOMES positive cells was identified and the majority of aggregations associated with short-term survivor samples (30/36) from 11 patients; in cluster 3, diversified dominancy was observed. Of note, the distribution of clusters indicated a significant association to survival (Chi-square test p = 0.00018, Fig. 4D)
Validation of the spatial tumor-immune microenvironment architectures with a presurgically-treated PDAC cohort
In this study, we selected an independent cohort (evaluable N=12) that had received pre-surgically treatment to validate our previous findings. The cohort composed of 6 patients treated with (chemo)radiation and chemotherapy (class 1), 5 patients treated with chemotherapy only (class 2), and 1 patient treated with radiation or chemotherapy only (class 3), prior to resection surgery (Table S3). We first characterized the differences in survival and TiME compositions between classes. Class 3 was removed from this analysis since it only contains 1 patient. Importantly, we observed trend toward better prognosis in class 2 patients (mean OS days = 809.4) compared to class 1 (mean OS days = 531.8) but such survival advantage is not significant (log-rank test p = 0.07, Fig. S4A). TiME composition analysis revealed no significant differences in immune populations (Wilcoxon rank-sum test p > 0.05). However, it is noteworthy that class 2 patients tended to have global higher numbers of CD4+ T cells and CD8+ T cells, suggesting that chemotherapy may be more effective in activating the anti-tumor immunity (Fig. S4B).
Among 12 patients, 3 had marked response / minimal residual disease (grade 1), 3 had moderate response (grade 2), and 3 had poor or no response (grade 3). In this study, we define patients with grade 1 and 2 as responders (Rs) and patients with grade 3 as non-responders (NRs).While we recognize that this presurgically-treated validation cohort does not represent the discovery cohort in terms of clinical scenario, due to limitations in data availability, the neoadjuvant cohort provided the best option for further investigation. Importantly, we demonstrated that the presurgical treatment-naïve long-term and presurgically-treated validation groups both had significantly longer overall survival than the treatment-naïve short-term group, with no statistical difference in overall survival between the treatment-naïve long-term and presurgically-treated groups (Fig. 5A). Therefore, we sought to determine if the presurgically-treated cohort also resembled the long-term survival group in terms of the spatial features described above. We first computed the imRS for all IL-10+ myelomonocytes (evaluable interaction pairs n = 102) using the same ROI selection criteria and protocol (evaluable ROI n = 16). Results revealed that the mean imRS in the validation cohort was significantly lower than both short-term (Wilcoxon rank-sum test p < 0.001) and long-term survivors (Wilcoxon rank-sum test p < 0.05), validating our hypothesis that the imRS is indeed associated with improved overall survival (Fig. 5B). Again, visualization recapitulated the same proximity pattern observed in long-term survivors (Fig. 5C). However, it is noteworthy that presurgically-treated group that bear significantly higher imRS seems to not benefit from further improved survival (log-rank test p = 0.11), likely due to other changes in TiME altered by the therapy and warrants further analysis to confirm.
Figure 5.
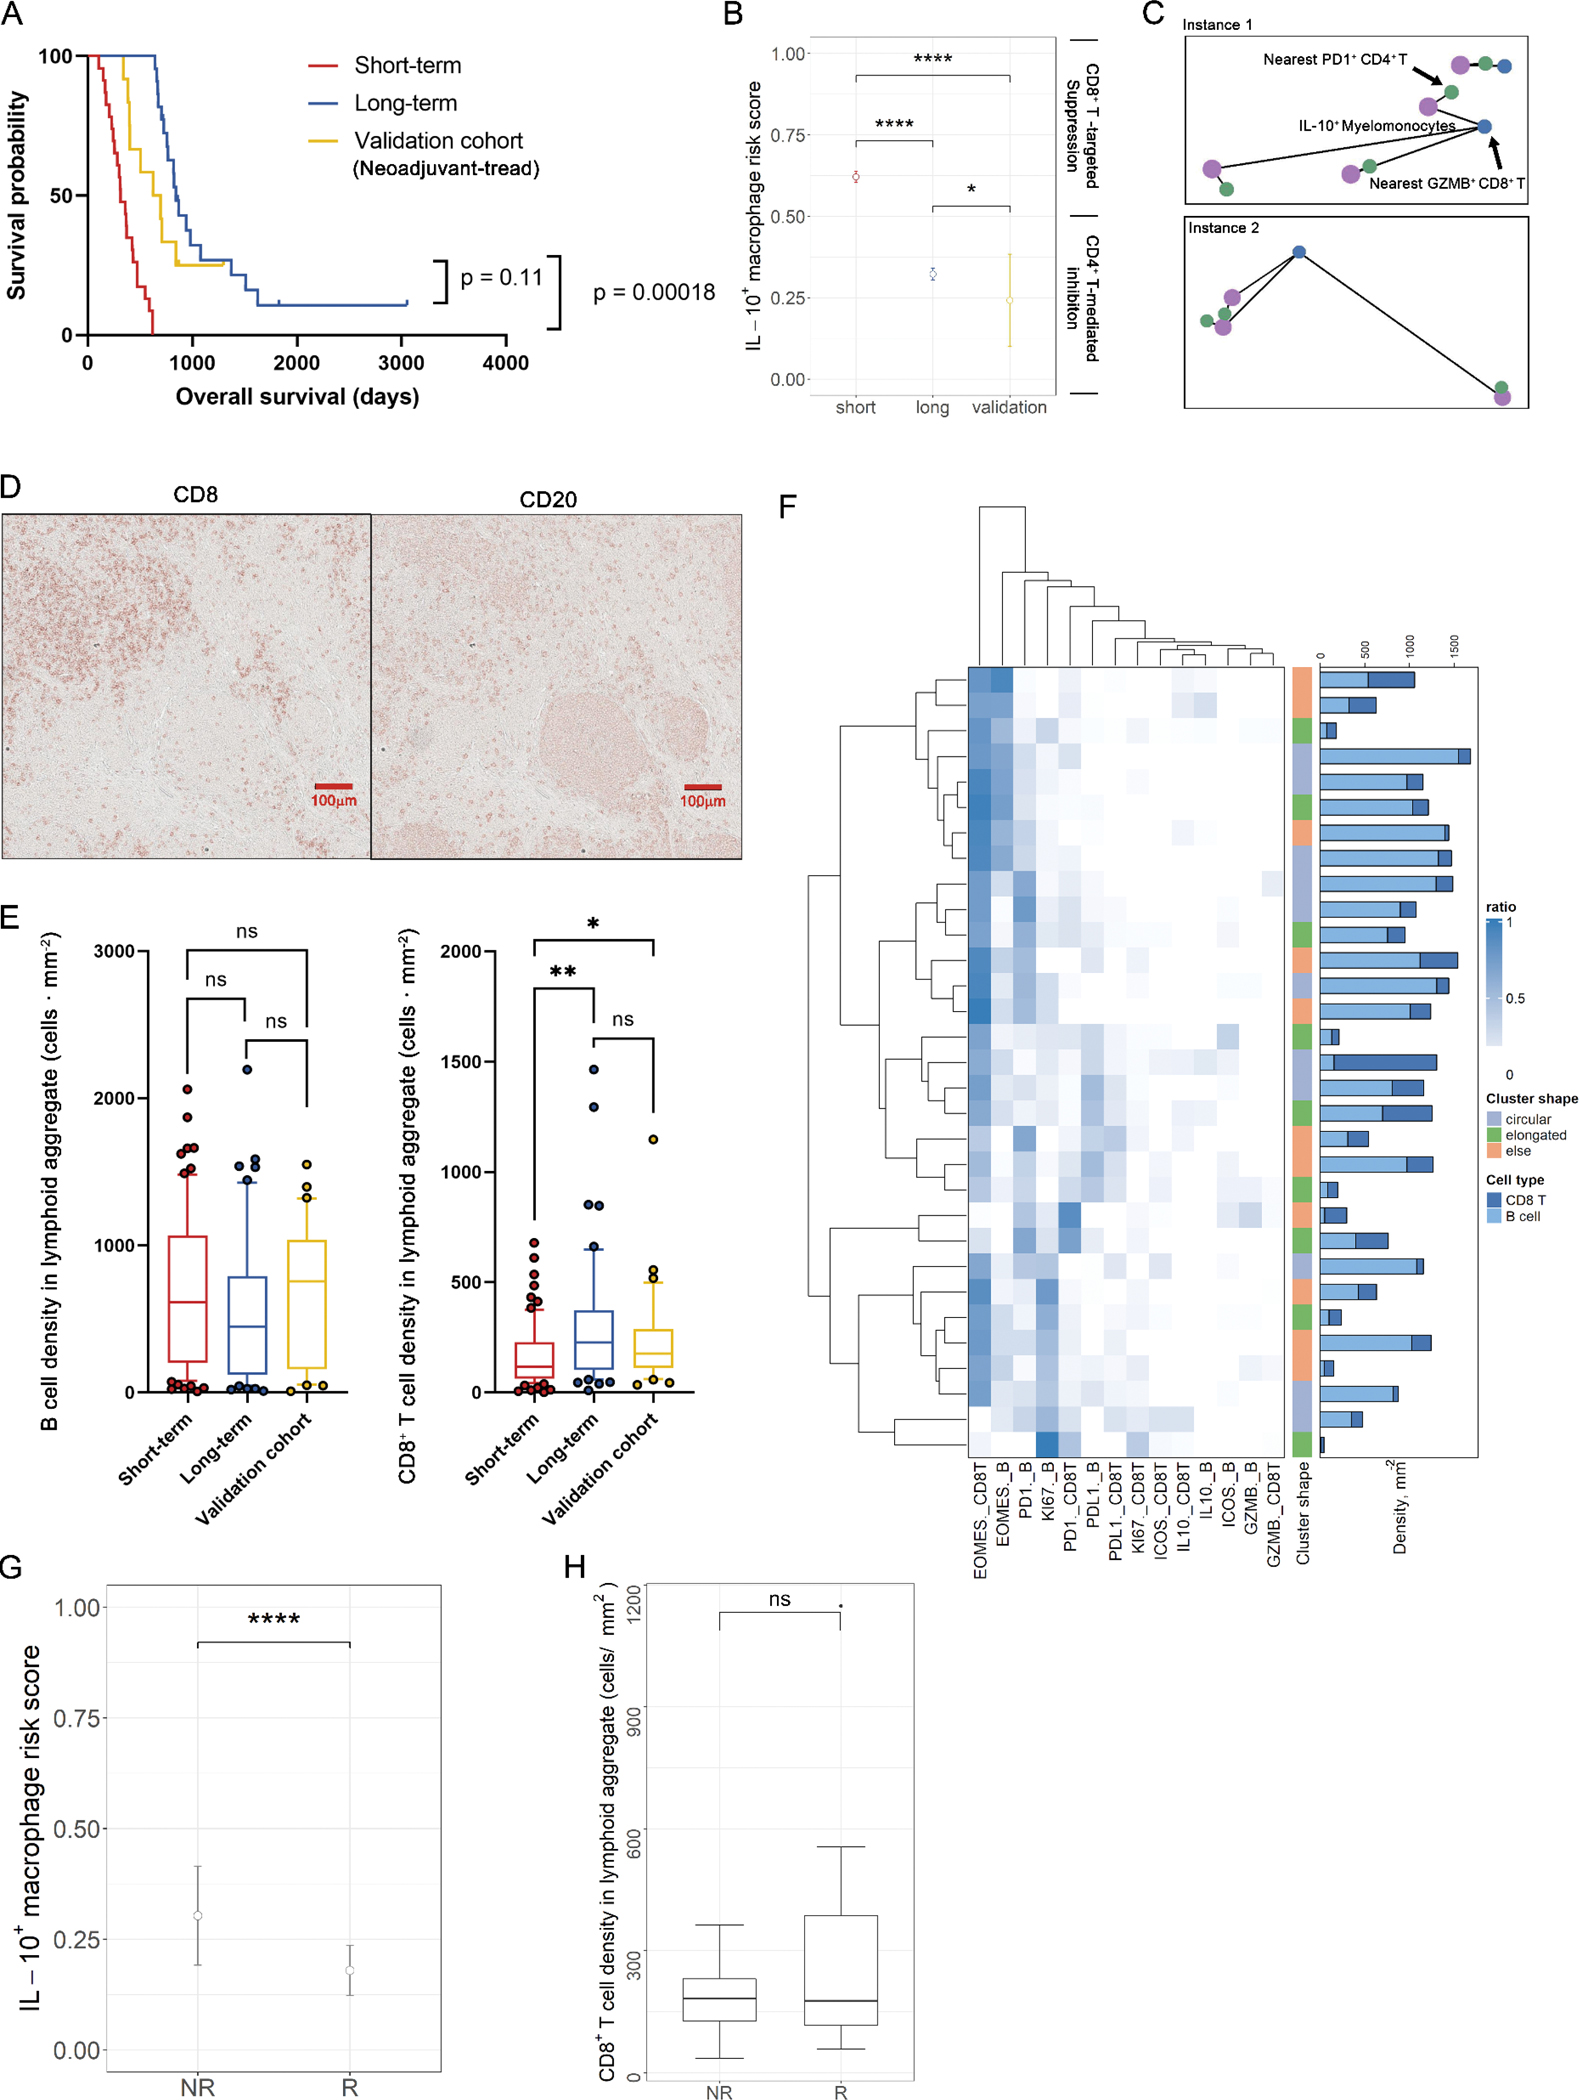
Validation of potential spatial biomarkers with an independent cohort (presurgically-treated). A, Validation of imRS by comparing of overall survival between short-term group, long-term group, and the validation cohort (log-rank test). B, Comparisons of imRS between the short-term group, long-term group, and validation cohort. ****, P < 0.0001; **, P < 0.01; *, P < 0.05 (Wilcoxon rank-sum test). C, Exemplar topological graph of IL-10+ myelomonocytes, PD-1+ CD4+ T cells, and GZMB+ CD8+ T cells in the validation cohort. D, immunodetection of CD8 and CD20 featuring lymphoid aggregates (LAs) of B cells and CD8+ T cells. E, Validation of immune cell density by comparing B cell and CD8+ T cell densities between short-term and long-term groups, and the validation cohort; ns, not significant (Wilcoxon rank-sum test). F, Hierarchically-clustered heatmap of marker expression compositions in LAs. Bar plot show the B cell and CD8+ T cell densities for each LA, respectively. G, imRS was computed at per-cell basis and compared between responder and non-responder groups; ****, P < 0.0001 (Wilcoxon rank-sum test). H, Comparison of CD8+ T cell density in LAs between responder and non-responder groups; ns, not significant.
Next, we identified CD8+ T cell – B cell aggregates (n=31) from the validation cohort and compositions were quantified (Fig. 5D). Similar to the discovery cohort, results revealed no significant difference in terms of B cell density per cluster, however, CD8+ T cell density was significantly elevated in the validation cohort compared to short term survivors (Fig. 5E). Of note, hierarchical clustering demonstrated that the majority of aggregates in the validation cohort were EOMES-dominant, which was contrary to the findings from the discovery cohort (Fig. 5F).
In addition, we explored the prognostic values of imRS and CD8+ T cell density in lymphoid aggregates (LAs) in predicting presurgical treatment efficacy. We observed that imRS in responders group (mean = 0.179) is significantly lower compared to non-responders (mean = 0.303, Wilcoxon rank-sum test p = 4.098e−7, Fig. 5G), However, we did not observe the same significance of CD8+ T cell density in responders (Wilcoxon rank-sum test p = 0.4945, Fig. 5H). This is likely related to the limited sample size since LAs were identified in only 6 out of 12 patients. Specifically, 15 LAs were detected in 3 Rs and 16 in 3 NRs, hence limiting the statistical power of the comparison. It is worth noting, the mean CD8+ T cell density in Rs is 297.4 cells ⋅ mm−2, which is much higher compared to the density in NRs of 176.4 cells ⋅ mm−2. Univariate Cox regression model indicated that responder group with higher density trended toward lower risk (hazard ratio = 0.981, CI = 0.94 – 1.02, Wald test p > 0.05). Correlation analysis revealed the same trend that CD8+ T cell density positively correlated with overall survival compared to the discovery cohort (ρ = 0.6, p = 0.35, Fig. S5).
Collectively, the validations indicated that the stratification power of imRS was in agreement with both the presurgically-treated cohort and long-term survival group, hence suggesting prognostic values. However, the lymphoid aggregates-associated features were not recapitulated in the validation cohort and responders to presurgical treatment, demonstrating that these patterns shall be interpreted with caution and further validations on extended dataset is required.
Collectively, these results indicated that pre-treatment differences in immune architectures within TiME likely possess prognostic values in patient with pancreatic adenocarcinoma. We observe that PD-1+ CD-4+ T cells appear to present adjacent to IL-10+ myelomonocytes in long-term survivors but adjacent to GZMB+ CD8+ T cells in short-term survivors. Though the signaling insights remains unknown, we proposed two hypothesis models that likely reflect the underlying biology (Fig. 6). Previous research provides evidence of the immunosuppressive role of IL-10 by down-regulating the cytotoxicity of CD8+ T cells (39). Meanwhile, activated CD4+ T cells, signatured by expression of PD-1, are able to secrete IFN-γ that can inhibit the production of IL-10 (40–42). Taken together, we hypothesized that in the long-term survivors, the immunosuppression of IL-10+ myelomonocytes is impeded by the IFN-γ production on activated CD4+ T cells; whereas in short-term survivors, IL-10+ myelomonocytes may inhibit the cytotoxic CD8+ T cell to promote tumor progression. We also reported that the CD8+ T cell densities in lymphocytes aggregates are significantly elevated in long-term survivors. Therefore, distinct functional states of immune populations, coupled with their spatial topology, can likely to predict the survival of patients with PDAC.
Figure 6.
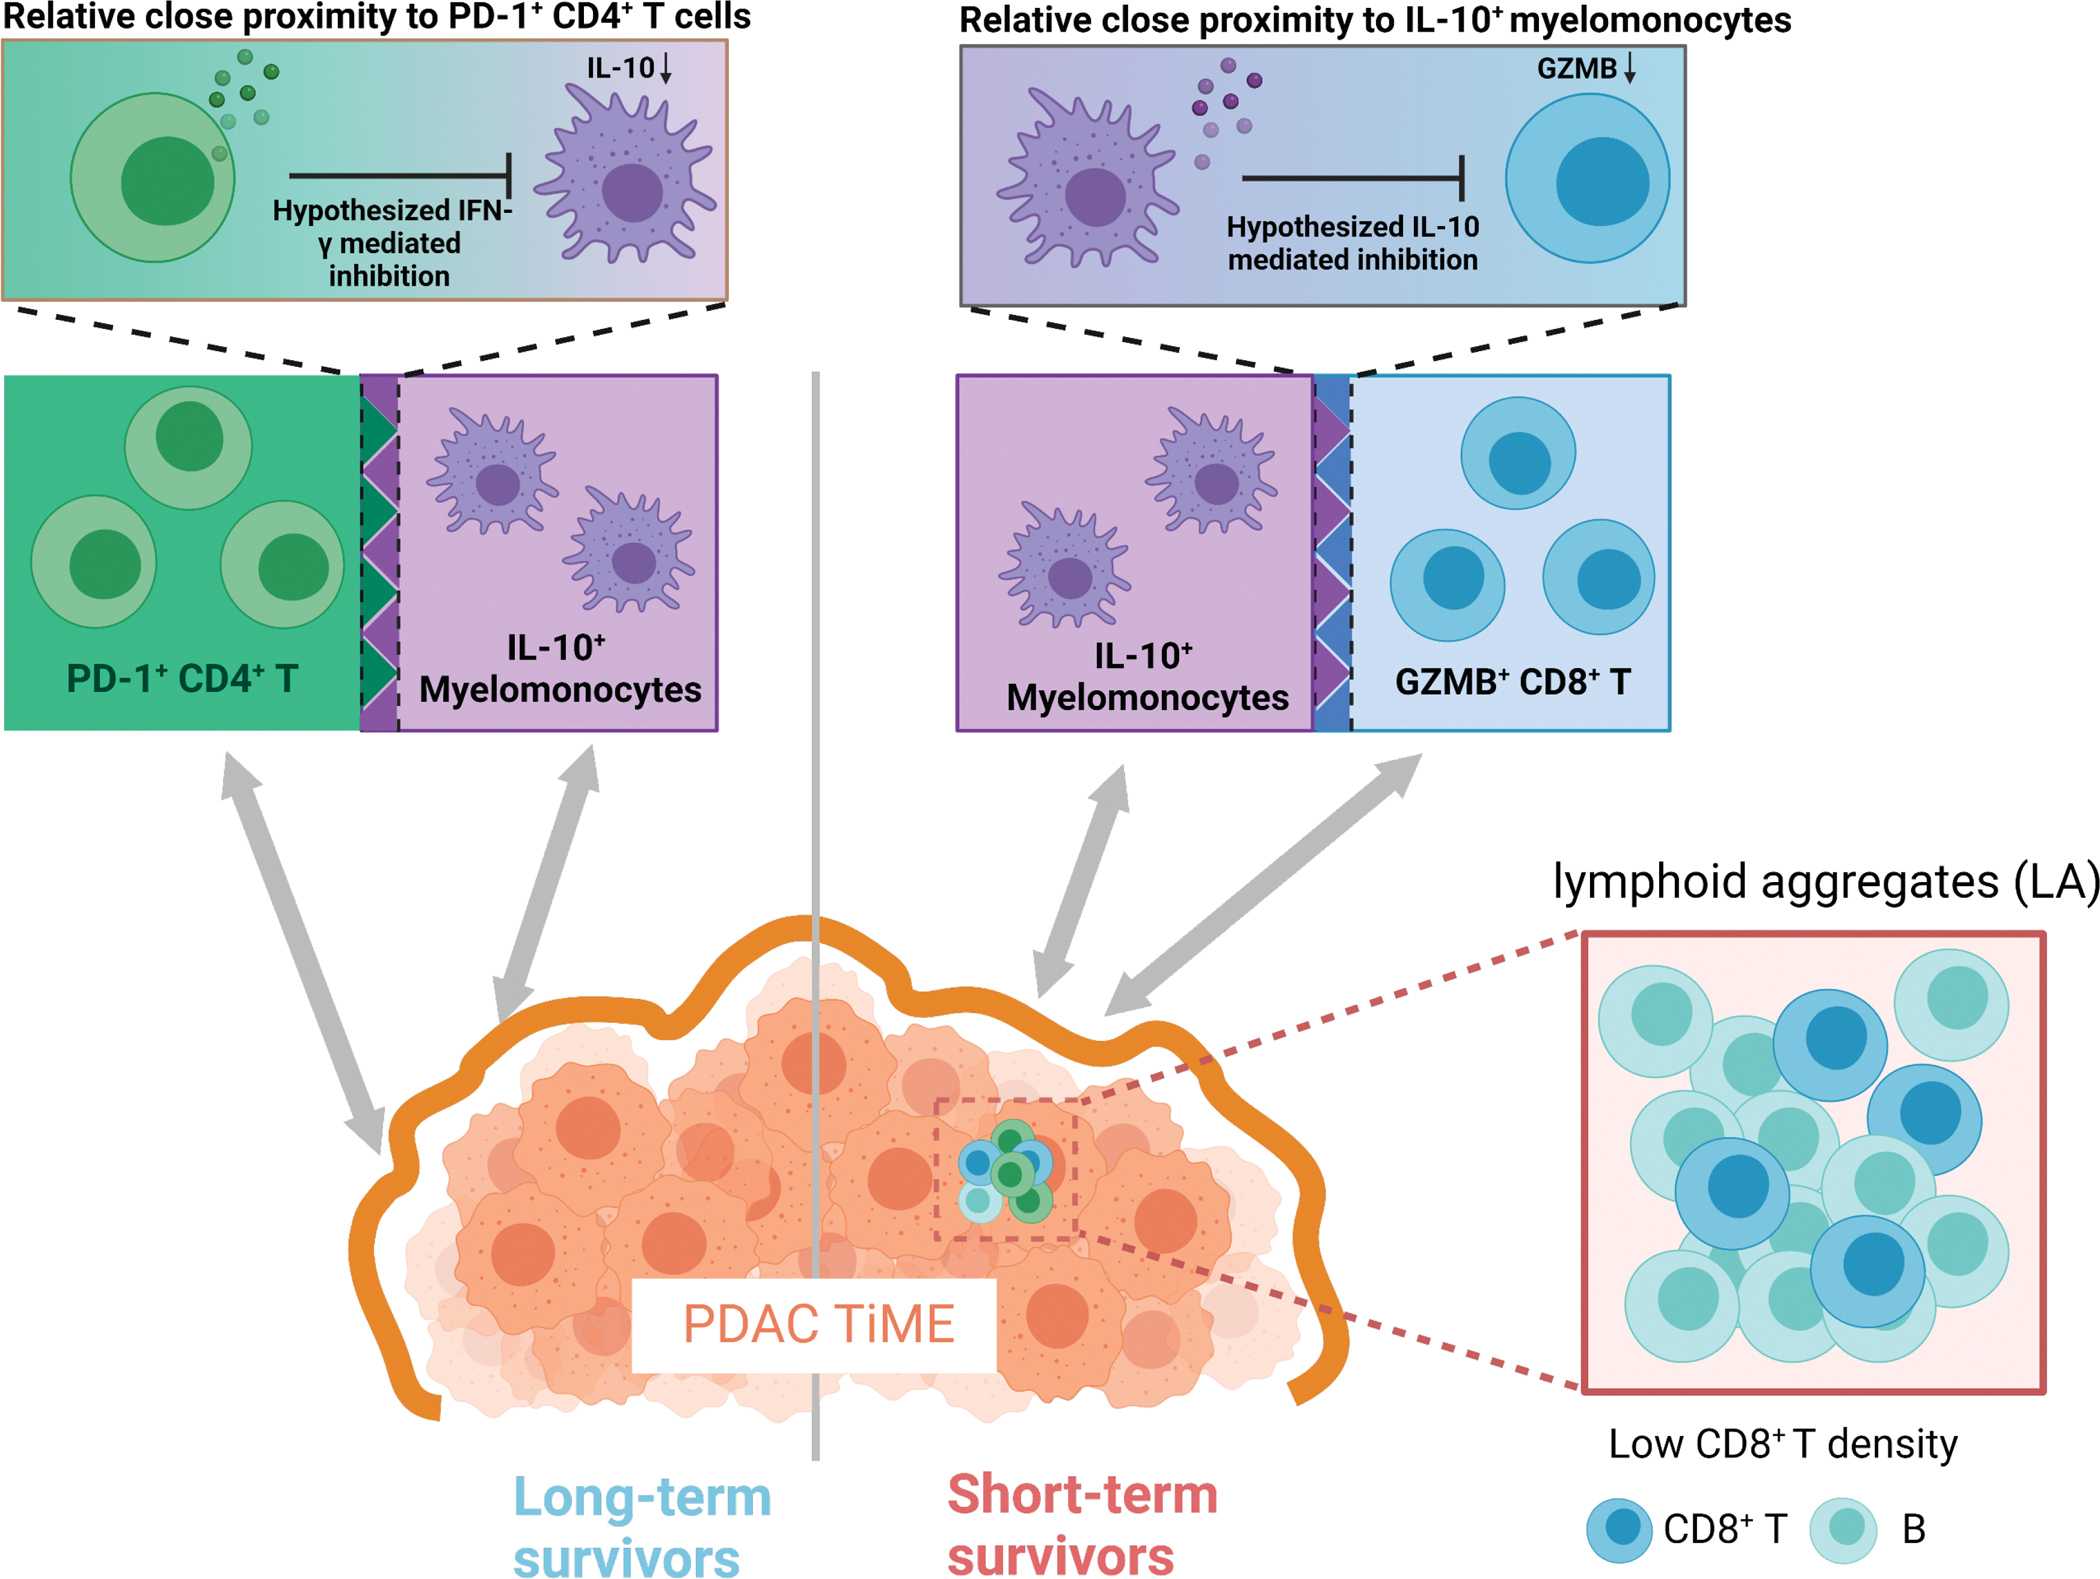
Proposed TiME landscape modeling the differences between long-term survival and short-term survival PDAC patients with regard to immune population activities. In long-term survivors, the immunosuppression activity of IL-10+ myelomonocytes were hypothesized to be inhibited by their adjacent PD-1+CD-4+ T cells through IFN-γ production; in short-term survivors, IL-10+-myelomonocytes were hypothesized to suppress their adjacent GZMB+ CD8+ T cells by direct inhibition on cytotoxicity; in addition, low density of CD8+ T, rather than B cells, in lymphoid aggregates was also observed in short-term survivors.
DISCUSSION
In this study, we investigated features of immune contexture and the spatial landscape of archival PDAC specimens from 45 treatment-naïve PDAC surgical resections, using an mIHC pipeline followed by quantitative spatial characterizations using a computational image processing workflow. The imaging approach and computational pipeline enable simultaneous profiling of multiple leukocyte populations and quantitative assessment of their spatial architectures to identify potential prognostic biomarkers.
Using sequential mIHC on 45 archival pathological FFPE samples with a panel of 27 antibodies enabled identification of cell lineages and their functional states from at least three ROIs per patient and ensuring tumor-immune heterogeneity was captured. The image processing workflow was then applied to extract a single-cell database of 4,026,079 cells featuring CD4+ T cells, CD8+ T cells, CD20+ B cells, myelomonocytes, and neoplastic tumor cells. Their functional states were also determined, reflecting expression of PD-L1, PD-1, IL-10, GZMB, Ki67, EOMES, and ICOS. The methodology described in this study represents a multi-scale analysis of the tumor TiME ecosystem spanning from single-cell level properties to spatial clustering patterns. In addition to the PDAC specimens evaluated herein, elements of this platform have been used for biomarker discovery in the context of triple-negative breast cancer, muscle-invasive bladder cancer, and hepatocellular carcinoma, and revealed efficacy in predicting response to cancer treatment, thus providing a general digital pathology framework for deciphering complex spatial biology (22,23,33). Given that FFPE specimens are ubiquitously available in laboratories that conduct diagnostic clinical tasks, the merit of the methodology also lies in the minimal materials required for analysis, enabling broad applicability using archival tissue samples. Considering the current advancements in single cell multiplex proteomics, the framework can also be easily adapted to high-dimensional imaging systems for detailed immune phenotyping that further accelerates biomarker studies with increased profiling bandwidth.
The major goal of this study was to discern subtle biological differences between patients with poor and improved survival for the establishment of prognostic biomarkers. Although PDAC is an aggressive cancer with poor survival, we split the patients into long-term and short-term groups with near equivalent sizes (43). It is important to note that long-term survivors are significant only at statistical level and do not necessarily possess clinical meaning since the median overall survival is 832 days. This limitation in searching for predictive biomarkers could apply to PDAC generally. Nevertheless, we reasoned that the distinction in overall survival between long- and short-term survivors was driven by underlying biological behaviors, considering the strong statistical difference.
Here, we focused on the immune populations within the PDAC TiME. To start, we quantified the first-order properties of each immune phenotype. Specifically, we observed that short-term and long-term survivors tended to have similar compositions of immune populations. Although the immune infiltration levels varied across tissue regions, highly immune-infiltrated regions existed in TiME from both long-term and short-term groups. By computing spatial Shannon’s entropy, we observed that the TiME from both groups were equally heterogeneous. Taken together, these results support the notion that the high inter- and intra-tumoral heterogeneity is a hallmark of PDAC independently of survival status (44). Previous studies reported that immune components within TiME were highly coordinated to orchestrate antitumor immunity, thus we further sought to study the TiME as an ecosystem (25). Using spatial G(r) function, we identified two pairs of immune phenotypes that exhibited spatial clustering and associated with survival: CD4+ T cell – myelomonocyte and CD8+ T cell – B cell. CD4+ T cell and myelomonocyte pairs were a two-way clustering, that is, cells accumulated around cells of different phenotypes. To interrogate the clustering pattern, we developed enrichment scores and discovered that IL-10-expressing myelomonocytes and PD-1-expressing CD4+ T cells were key determinants of the spatial dependence. In addition, we proposed an IL-10+ myelomonocyte RiskScore (imRS) and found that long-term survivors associated with decreased distance between IL-10+ myelomonocytes and PD-1+ CD4+ T cells; whereas decreased distance between IL-10+ myelomonocytes and GZMB+ CD8+ T cells instead associated with short-term survivors. imRS revealed the balance of IL-10+ myelomonocytes between high and low risk of immunosuppression for patient prognosis. Previous research provides evidence of the immunosuppressive role of IL-10 by directly and indirectly impacting cytotoxicity of CD8+ T cells (39). Moreover, activated CD4+ T cells, indicated by expression of PD-1, can secrete IFN-γ and thereby inhibit neighboring production of IL-10 (40–42). Taken together, we hypothesized that in the long-term survivors, immunosuppression of IL-10+ myelomonocytes is impeded by the IFN-γ production from activated CD4+ T cells; whereas in short-term survivors, IL-10+ myelomonocytes in turn inhibit the cytotoxic properties of CD8+ T cells and thereby foster tumor progression. It is worth mentioning that some studies report contradictory findings: Wang and colleagues found that instead of being immunosuppressive, IL-10 could enhance antitumor immunity by hampering suppressive CD4+ T cells, thus indicating an opposite signaling axis as compared to the aforementioned hypothesis (45). Therefore, this finding should be interpreted with caution, as we were not able to also evaluate FOXP3 expression to differentiate suppressive T-regulatory CD4+ T cells from T-helper cells. Second, we examined the one-way clustering pattern of CD8+ T cell – B cell, also termed as lymphoid aggregates (LA) in this study. We found that the high CD8+ T cell density in LA was associated with long-term survival. Similarly, Gunderson and colleagues reported a distinct type of T and B cell aggregates, namely early-stage tertiary lymphoid structure (ES-TLS), featuring high CD8+ T cell infiltration that associated with improved survival in PDAC (46).
There are important limitations in our study. First, the discovery dataset (treatment-naïve) is relatively small. However, it is noteworthy that we sampled multiple regions from each patient, sampling on average 89,469 cells per patient. The approach also preserved the intra-tumoral heterogeneity, thus entailing a generalized platform less sensitive to sampling bias. In addition, the biology of IL-10 in PDAC is still poorly understood and limits us to corroborating the connection of PD-1+ CD4+ T cell – IL-10+ myelomonocyte – GZMB+ CD8+ T cell signaling axis to overall patient survival. Although we did validate our findings with an independent cohort, the clinical parameters of the validation cohort were not identical to the discovery cohort, thus the hypothesis requires further validation on larger external datasets.
In conclusion, we developed a multi-scale quantitative assay combining sequential IHC imaging and spatial analysis to study the TiME in patients with PDAC in search of potential prognostic biomarkers. While the platform still requires intensive validation on external cohort, it might complement current standard pathology staging and serve as a research tool for quantitative immuno-oncology domain. The proposed platform also reveals a broad applicability and represents a novel application in the field of translational medicine, as well as prospects in initialization and parameterization of computational models (47–53).
Supplementary Material
Significance:
Quantitative image analysis of pancreatic ductal adenocarcinoma specimens reveals intertumoral and intratumoral heterogeneity of immune populations and identifies spatial immune architectures that are significantly associated with disease prognosis.
Acknowledgement:
This research was supported by National Institutes of Health grants U01CA212007 and R01CA138264 to A.S. Popel. L.M. Coussens acknowledges funding from the National Institutes of Health (1U01CA224012, U2CCA233280), the Knight Cancer Institute, and the OHSU-Brenden-Colson Center for Pancreatic Care. Part of the schematic figures were produced from BioRender (https://biorender.com).
Footnotes
Competing interests: L.M. Coussens reports consulting services for Cell Signaling Technologies, AbbVie, the Susan G Komen Foundation, and Shasqi, received reagent and/or research support from Cell Signaling Technologies, Syndax Pharmaceuticals, ZelBio Inc., Hibercell Inc., and Acerta Pharma, and has participated in advisory boards for Pharmacyclics, Syndax, Carisma, Verseau, CytomX, Kineta, Hibercell, Cell Signaling Technologies, Alkermes, Zymeworks, Genenta Sciences, Pio Therapeutics Pty Ltd., PDX Pharmaceuticals, the AstraZeneca Partner of Choice Network, the Lustgarten Foundation, and the NIH/NCI-Frederick National Laboratory Advisory Committee. A.S. Popel is a consultant to AsclepiX Therapeutics and CytomX Therapeutics; he receives research grants from AstraZeneca, Boehringer Ingelheim, and CytomX Therapeutics. The terms of these arrangements are being managed by the Johns Hopkins University in accordance with its conflict-of-interest policies. All other declare no potential conflicts of interest.
References:
- 1.Rahib L, Smith BD, Aizenberg R, Rosenzweig AB, Fleshman JM, Matrisian LM. Projecting cancer incidence and deaths to 2030: the unexpected burden of thyroid, liver, and pancreas cancers in the United States. Cancer research. AACR; 2014;74:2913–21. [DOI] [PubMed] [Google Scholar]
- 2.Kleeff J, Korc M, Apte M, La Vecchia C, Johnson CD, Biankin AV, et al. Pancreatic cancer. Nature reviews Disease primers. Nature Publishing Group; 2016;2:1–22. [DOI] [PubMed] [Google Scholar]
- 3.Mizrahi JD, Surana R, Valle JW, Shroff RT. Pancreatic cancer. The Lancet. Elsevier; 2020;395:2008–20. [DOI] [PubMed] [Google Scholar]
- 4.Wolfgang CL, Herman JM, Laheru DA, Klein AP, Erdek MA, Fishman EK, et al. Recent progress in pancreatic cancer. CA: a cancer journal for clinicians. Wiley Online Library; 2013;63:318–48. [DOI] [PMC free article] [PubMed] [Google Scholar]
- 5.Neoptolemos JP. Adjuvant treatment of pancreatic cancer. European journal of cancer (Oxford, England: 1990). 2011;47:S378–80. [DOI] [PubMed] [Google Scholar]
- 6.Jain T, Dudeja V. The war against pancreatic cancer in 2020—Advances on all fronts. Nature Reviews Gastroenterology & Hepatology. Nature Publishing Group; 2021;18:99–100. [DOI] [PubMed] [Google Scholar]
- 7.Ostios-Garcia L, Villamayor J, Garcia-Lorenzo E, Vinal D, Feliu J. Understanding the immune response and the current landscape of immunotherapy in pancreatic cancer. World journal of gastroenterology. Baishideng Publishing Group Inc; 2021;27:6775. [DOI] [PMC free article] [PubMed] [Google Scholar]
- 8.Wu AA, Jaffee E, Lee V. Current status of immunotherapies for treating pancreatic cancer. Current oncology reports. Springer; 2019;21:1–11. [DOI] [PubMed] [Google Scholar]
- 9.Hosein AN, Dougan SK, Aguirre AJ, Maitra A. Translational advances in pancreatic ductal adenocarcinoma therapy. Nature cancer. Nature Publishing Group; 2022;3:272–86. [DOI] [PubMed] [Google Scholar]
- 10.Lutz ER, Wu AA, Bigelow E, Sharma R, Mo G, Soares K, et al. Immunotherapy converts nonimmunogenic pancreatic tumors into immunogenic foci of immune regulation. Cancer immunology research. AACR; 2014;2:616–31. [DOI] [PMC free article] [PubMed] [Google Scholar]
- 11.Bockorny B, Semenisty V, Macarulla T, Borazanci E, Wolpin BM, Stemmer SM, et al. BL-8040, a CXCR4 antagonist, in combination with pembrolizumab and chemotherapy for pancreatic cancer: The COMBAT trial. Nature medicine. Nature Publishing Group; 2020;26:878–85. [DOI] [PubMed] [Google Scholar]
- 12.Karamitopoulou E Tumour microenvironment of pancreatic cancer: immune landscape is dictated by molecular and histopathological features. British journal of cancer. Nature Publishing Group; 2019;121:5–14. [DOI] [PMC free article] [PubMed] [Google Scholar]
- 13.Siret C, Collignon A, Silvy F, Robert S, Cheyrol T, André P, et al. Deciphering the crosstalk between myeloid-derived suppressor cells and regulatory T cells in pancreatic ductal adenocarcinoma. Frontiers in Immunology. Frontiers; 2020;10:3070. [DOI] [PMC free article] [PubMed] [Google Scholar]
- 14.Castino GF, Cortese N, Capretti G, Serio S, Di Caro G, Mineri R, et al. Spatial distribution of B cells predicts prognosis in human pancreatic adenocarcinoma. Oncoimmunology. Taylor & Francis; 2016;5:e1085147. [DOI] [PMC free article] [PubMed] [Google Scholar]
- 15.Carstens JL, De Sampaio PC, Yang D, Barua S, Wang H, Rao A, et al. Spatial computation of intratumoral T cells correlates with survival of patients with pancreatic cancer. Nature communications. Nature Publishing Group; 2017;8:1–13. [DOI] [PMC free article] [PubMed] [Google Scholar]
- 16.Wang Y, Liang Y, Xu H, Zhang X, Mao T, Cui J, et al. Single-cell analysis of pancreatic ductal adenocarcinoma identifies a novel fibroblast subtype associated with poor prognosis but better immunotherapy response. Cell discovery. Nature Publishing Group; 2021;7:1–17. [DOI] [PMC free article] [PubMed] [Google Scholar]
- 17.Väyrynen SA, Zhang J, Yuan C, Väyrynen JP, Costa AD, Williams H, et al. Composition, spatial characteristics, and prognostic significance of myeloid cell infiltration in pancreatic cancer. Clinical Cancer Research. AACR; 2021;27:1069–81. [DOI] [PMC free article] [PubMed] [Google Scholar]
- 18.Pereira BA, Vennin C, Papanicolaou M, Chambers CR, Herrmann D, Morton JP, et al. CAF subpopulations: a new reservoir of stromal targets in pancreatic cancer. Trends in cancer. Elsevier; 2019;5:724–41. [DOI] [PubMed] [Google Scholar]
- 19.Schürch CM, Bhate SS, Barlow GL, Phillips DJ, Noti L, Zlobec I, et al. Coordinated cellular neighborhoods orchestrate antitumoral immunity at the colorectal cancer invasive front. Cell. Elsevier; 2020;182:1341–1359. e19. [DOI] [PMC free article] [PubMed] [Google Scholar]
- 20.Jackson HW, Fischer JR, Zanotelli VR, Ali HR, Mechera R, Soysal SD, et al. The single-cell pathology landscape of breast cancer. Nature. Nature Publishing Group; 2020;578:615–20. [DOI] [PubMed] [Google Scholar]
- 21.Gong C, Anders RA, Zhu Q, Taube JM, Green B, Cheng W, et al. Quantitative characterization of CD8+ T cell clustering and spatial heterogeneity in solid tumors. Frontiers in oncology. Frontiers; 2019;8:649. [DOI] [PMC free article] [PubMed] [Google Scholar]
- 22.Mi H, Gong C, Sulam J, Fertig EJ, Szalay AS, Jaffee EM, et al. Digital pathology analysis quantifies spatial heterogeneity of CD3, CD4, CD8, CD20, and FOXP3 immune markers in triple-negative breast cancer. Frontiers in physiology. Frontiers Media SA; 2020;11. [DOI] [PMC free article] [PubMed] [Google Scholar]
- 23.Mi H, Bivalacqua TJ, Kates M, Seiler R, Black PC, Popel AS, et al. Predictive models of response to neoadjuvant chemotherapy in muscle-invasive bladder cancer using nuclear morphology and tissue architecture. Cell Reports Medicine. Elsevier; 2021;2:100382. [DOI] [PMC free article] [PubMed] [Google Scholar]
- 24.Keren L, Bosse M, Marquez D, Angoshtari R, Jain S, Varma S, et al. A structured tumor-immune microenvironment in triple negative breast cancer revealed by multiplexed ion beam imaging. Cell. Elsevier; 2018;174:1373–1387. e19. [DOI] [PMC free article] [PubMed] [Google Scholar]
- 25.Liudahl SM, Betts CB, Sivagnanam S, Morales-Oyarvide V, Da Silva A, Yuan C, et al. Leukocyte heterogeneity in pancreatic ductal adenocarcinoma: phenotypic and spatial features associated with clinical outcome. Cancer discovery. AACR; 2021;11:2014–31. [DOI] [PMC free article] [PubMed] [Google Scholar]
- 26.Giraldo NA, Nguyen P, Engle EL, Kaunitz GJ, Cottrell TR, Berry S, et al. Multidimensional, quantitative assessment of PD-1/PD-L1 expression in patients with Merkel cell carcinoma and association with response to pembrolizumab. Journal for immunotherapy of cancer. Springer; 2018;6:1–11. [DOI] [PMC free article] [PubMed] [Google Scholar]
- 27.Berry S, Giraldo NA, Green BF, Cottrell TR, Stein JE, Engle EL, et al. Analysis of multispectral imaging with the AstroPath platform informs efficacy of PD-1 blockade. Science. American Association for the Advancement of Science; 2021;372. [DOI] [PMC free article] [PubMed] [Google Scholar]
- 28.Failmezger H, Muralidhar S, Rullan A, de Andrea CE, Sahai E, Yuan Y. Topological Tumor Graphs: a graph-based spatial model to infer stromal recruitment for immunosuppression in melanoma histology. Cancer research. AACR; 2020;80:1199–209. [DOI] [PMC free article] [PubMed] [Google Scholar]
- 29.Baddeley A, Turner R. Spatstat: an R package for analyzing spatial point patterns. Journal of statistical software. 2005;12:1–42. [Google Scholar]
- 30.Verlato G, Marrelli D, Accordini S, Bencivenga M, Di Leo A, Marchet A, et al. Short-term and long-term risk factors in gastric cancer. World J Gastroenterol. 2015;21:6434–43. [DOI] [PMC free article] [PubMed] [Google Scholar]
- 31.Wang Y, Wang YG, Hu C, Li M, Fan Y, Otter N, et al. Cell graph neural networks enable the precise prediction of patient survival in gastric cancer. npj Precis Onc. Nature Publishing Group; 2022;6:1–12. [DOI] [PMC free article] [PubMed] [Google Scholar]
- 32.Keren L, Bosse M, Marquez D, Angoshtari R, Jain S, Varma S, et al. A structured tumor-immune microenvironment in triple negative breast cancer revealed by multiplexed ion beam imaging. Cell. Elsevier; 2018;174:1373–1387. e19. [DOI] [PMC free article] [PubMed] [Google Scholar]
- 33.Mi H, Ho WJ, Yarchoan M, Popel AS. Multi-Scale Spatial Analysis of the Tumor Microenvironment Reveals Features of Cabozantinib and Nivolumab Efficacy in Hepatocellular Carcinoma. Front Immunol. 2022;13:892250. [DOI] [PMC free article] [PubMed] [Google Scholar]
- 34.Biswas SK, Mantovani A. Macrophage plasticity and interaction with lymphocyte subsets: cancer as a paradigm. Nature immunology. Nature Publishing Group; 2010;11:889–96. [DOI] [PubMed] [Google Scholar]
- 35.Rodriguez AB, Engelhard VH. Insights into tumor-associated tertiary lymphoid structures: novel targets for antitumor immunity and cancer immunotherapy: Tertiary lymphoid structures in cancer. Cancer immunology research. NIH Public Access; 2020;8:1338. [DOI] [PMC free article] [PubMed] [Google Scholar]
- 36.Binnewies M, Roberts EW, Kersten K, Chan V, Fearon DF, Merad M, et al. Understanding the tumor immune microenvironment (TIME) for effective therapy. Nature medicine. Nature Publishing Group; 2018;24:541–50. [DOI] [PMC free article] [PubMed] [Google Scholar]
- 37.Phillips D, Matusiak M, Gutierrez BR, Bhate SS, Barlow GL, Jiang S, et al. Immune cell topography predicts response to PD-1 blockade in cutaneous T cell lymphoma. Nature communications. Nature Publishing Group; 2021;12:1–18. [DOI] [PMC free article] [PubMed] [Google Scholar]
- 38.Smith LK, Boukhaled GM, Condotta SA, Mazouz S, Guthmiller JJ, Vijay R, et al. Interleukin-10 directly inhibits CD8+ T cell function by enhancing N-glycan branching to decrease antigen sensitivity. Immunity. Elsevier; 2018;48:299–312. [DOI] [PMC free article] [PubMed] [Google Scholar]
- 39.Biswas PS, Pedicord V, Ploss A, Menet E, Leiner I, Pamer EG. Pathogen-specific CD8 T cell responses are directly inhibited by IL-10. The Journal of Immunology. Am Assoc Immnol; 2007;179:4520–8. [DOI] [PubMed] [Google Scholar]
- 40.Hu X, Paik PK, Chen J, Yarilina A, Kockeritz L, Lu TT, et al. IFN-γ suppresses IL-10 production and synergizes with TLR2 by regulating GSK3 and CREB/AP-1 proteins. Immunity. Elsevier; 2006;24:563–74. [DOI] [PubMed] [Google Scholar]
- 41.Herrero C, Hu X, Li WP, Samuels S, Sharif MN, Kotenko S, et al. Reprogramming of IL-10 activity and signaling by IFN-γ. The Journal of Immunology. Am Assoc Immnol; 2003;171:5034–41. [DOI] [PubMed] [Google Scholar]
- 42.Keir ME, Butte MJ, Freeman GJ, Sharpe AH. PD-1 and its ligands in tolerance and immunity. Annu Rev Immunol. Annual Reviews; 2008;26:677–704. [DOI] [PMC free article] [PubMed] [Google Scholar]
- 43.Siegel RL, Miller KD, Jemal A. Cancer statistics, 2020. CA: a cancer journal for clinicians. Wiley Online Library; 2020;70:7–30. [DOI] [PubMed] [Google Scholar]
- 44.Wandmacher AM, Mehdorn A-S, Sebens S. The heterogeneity of the tumor microenvironment as essential determinant of development, progression and therapy response of pancreatic cancer. Cancers. Multidisciplinary Digital Publishing Institute; 2021;13:4932. [DOI] [PMC free article] [PubMed] [Google Scholar]
- 45.Wang L, Liu J-Q, Talebian F, Liu Z, Yu L, Bai X-F. IL-10 enhances CTL-mediated tumor rejection by inhibiting highly suppressive CD4+ T cells and promoting CTL persistence in a murine model of plasmacytoma. Oncoimmunology. Taylor & Francis; 2015;4:e1014232. [DOI] [PMC free article] [PubMed] [Google Scholar]
- 46.Gunderson A J, Rajamanickam V, Bui C, Bernard B, Pucilowska J, Ballesteros-Merino C, et al. Germinal center reactions in tertiary lymphoid structures associate with neoantigen burden, humoral immunity and long-term survivorship in pancreatic cancer. Oncoimmunology. Taylor & Francis; 2021;10:1900635. [DOI] [PMC free article] [PubMed] [Google Scholar]
- 47.Ma H, Wang H, Sové RJ, Wang J, Giragossian C, Popel AS. Combination therapy with T cell engager and PD-L1 blockade enhances the antitumor potency of T cells as predicted by a QSP model. Journal for immunotherapy of cancer. BMJ Publishing Group; 2020;8. [DOI] [PMC free article] [PubMed] [Google Scholar]
- 48.Sové RJ, Jafarnejad M, Zhao C, Wang H, Ma H, Popel AS. QSP-IO: A Quantitative Systems Pharmacology Toolbox for Mechanistic Multiscale Modeling for Immuno-Oncology Applications. CPT: pharmacometrics & systems pharmacology. Wiley Online Library; 2020;9:484–97. [DOI] [PMC free article] [PubMed] [Google Scholar]
- 49.Wang H, Ma H, Sové RJ, Emens LA, Popel AS. Quantitative systems pharmacology model predictions for efficacy of atezolizumab and nab-paclitaxel in triple-negative breast cancer. Journal for immunotherapy of cancer. BMJ Publishing Group; 2021;9. [DOI] [PMC free article] [PubMed] [Google Scholar]
- 50.Gong C, Ruiz-Martinez A, Kimko H, Popel AS. A Spatial Quantitative Systems Pharmacology Platform spQSP-IO for Simulations of Tumor—Immune Interactions and Effects of Checkpoint Inhibitor Immunotherapy. Cancers. Multidisciplinary Digital Publishing Institute; 2021;13:3751. [DOI] [PMC free article] [PubMed] [Google Scholar]
- 51.Zhang S, Gong C, Ruiz-Martinez A, Wang H, Davis-Marcisak E, Deshpande A, et al. Integrating single cell sequencing with a spatial quantitative systems pharmacology model spQSP for personalized prediction of triple-negative breast cancer immunotherapy response. Immunoinformatics. Elsevier; 2021;1:100002. [DOI] [PMC free article] [PubMed] [Google Scholar]
- 52.Ruiz-Martinez A, Gong C, Wang H, Sov́e RJ, Mi H, Kimko H, et al. Simulations of tumor growth and response to immunotherapy by coupling a spatial agent-based model with a whole-patient quantitative systems pharmacology model. PLOS Computational Biology. Public Library of Science San Francisco, CA USA; 2022;18:e1010254. [DOI] [PMC free article] [PubMed] [Google Scholar]
- 53.Wang H, Zhao C, Santa-Maria CA, Emens LA, Popel AS. Dynamics of tumor-associated macrophages in a quantitative systems pharmacology model of immunotherapy in triple-negative breast cancer. iScience. Elsevier; 2022;104702. [DOI] [PMC free article] [PubMed] [Google Scholar]
Associated Data
This section collects any data citations, data availability statements, or supplementary materials included in this article.
Supplementary Materials
Data Availability Statement
The data supporting the findings of this study (single-cell and patient data) are available online at Zenodo (RRID: SCR_004129, https://zenodo.org/record/6416102#.Yky33jfMIrY). Raw images are available from corresponding author upon reasonable requests.