

Abstract
Maturation of the mammalian nervous system requires adequate provision of thyroid hormone and mechanisms that enhance tissue responses to the hormone. Here, we report that the development of cones, the photoreceptors for daylight and color vision, requires protection from thyroid hormone by type 3 deiodinase, a thyroid hormone-inactivating enzyme. Type 3 deiodinase, encoded by Dio3, is expressed in the immature mouse retina. In Dio3−/− mice, ~80% of cones are lost through neonatal cell death. Cones that express opsin photopigments for response to both short (S) and medium-long (M) wavelength light are lost. Rod photoreceptors, which mediate dim light vision, remain largely intact. Excessive thyroid hormone in wild type pups also eliminates cones. Cone loss is mediated by cone-specific thyroid hormone receptor β2 (TRβ2) as deletion of TRβ2 rescues cones in Dio3−/− mice. However, rescued cones respond to short but not longer wavelength light because TRβ2 under moderate hormonal stimulation normally induces M opsin and controls the patterning of M and S opsins over the retina. The results suggest that type 3 deiodinase limits hormonal exposure of the cone to levels that safeguard both cone survival and the patterning of opsins that is required for cone function.
Keywords: cone photoreceptor, development, color visual system, thyroid hormone receptor, deiodinase, programmed cell death
Introduction
Thyroid hormone is critical for maturation of the mammalian nervous system. Conditions that impair thyroid hormone availability present risks to neurological development and include congenital hypothyroidism, which occurs in 1 in ~3,000 human newborns (Rovet and Daneman, 2003), iodine-deficiency (Cao et al., 1994) and insufficiency of maternal thyroid hormone during pregnancy (Morreale de Escobar et al., 2004). Neurodevelopment requires rising levels of circulating thyroid hormone at fetal and postnatal stages and as shown recently, additional means that enhance specific responses to the hormone. Type 2 deiodinase, encoded by the Dio2 gene, provides one such mechanism by amplifying local tissue levels of triiodothyronine (T3) the main active form of hormone that binds the thyroid hormone receptor. Type 2 deiodinase generates T3 by outer ring deiodination of thyroxine (T4), the most abundant form of thyroid hormone in the circulation (Kaplan and Yaskoski, 1981; Bianco et al., 2002; St Germain et al., 2005). Dio2−/− mice exhibit deafness and behavioral changes, indicating the importance of amplification of T3 levels within the nervous system (Ng et al., 2004; Galton et al., 2007).
Type 3 deiodinase, a thyroid hormone-inactivating enzyme, depletes sources of active hormone by inner ring deiodination of both T4 and T3. A developmental role has been shown for type 3 deiodinase in tail regression and asymmetrical eye growth during amphibian metamorphosis (Becker et al., 1997; Marsh-Armstrong et al., 1999). In mammals, type 3 deiodinase, encoded by Dio3, is expressed in the placenta and fetal tissues including the brain (Kaplan and Yaskoski, 1981; Escamez et al., 1999; Kester et al., 2004). This expression pattern has suggested a protective role for Dio3 in immature neural tissues, recently supported by the finding of deafness in Dio3−/− mice (Ng et al., 2009b). However, little else is known of Dio3 functions in the nervous system.
Cones are the receptor cells for daylight and color vision but the controls that direct cone development are incompletely defined. Most mammals possess dichromatic color vision, conferred by differential expression of M and S opsin photopigments for sensitivity to medium-long and short wavelengths of light, respectively (Lyubarsky et al., 1999; Mollon, 1999; Nathans, 1999). Cones are generated before birth and express S then M opsins as they migrate to their mature location in the retina (Carter-Dawson and LaVail, 1979b; Szel et al., 1993; Xiao and Hendrickson, 2000). Mice deficient for thyroid hormone receptor TRβ2 lack M opsin but retain S opsin, revealing a critical role for thyroid hormone in opsin patterning (Ng et al., 2001). To identify additional controls over cone development, we investigated deiodinases as potential modifiers of TRβ2 activity. We found that type 3 deiodinase is expressed in the immature retina and that Dio3−/− mice lose cones by neonatal cell death. Cone survival was rescued by deletion of TRβ2, demonstrating that TRβ2 is an arbiter of both cone death and opsin patterning. The results suggest that type 3 deiodinase keeps hormonal exposure of immature cones below a deleterious threshold thereby allowing both survival and opsin patterning.
Materials and Methods
Mouse strains
Mice carrying the Dio3 mutation (Hernandez et al., 2006) were backcrossed for 2 generations onto a C57BL/6J background. Dio3+/− parents were crossed to generate +/+ and −/− progeny for analyses. Whenever possible, analyses were performed on +/+ and −/− littermates. To avoid possible maternal hormonal influences, progeny for analysis were not obtained from −/− dams. Both male and female −/− progeny were analyzed and both displayed similar retinal phenotypes. Dio3−/− pups had reduced survival and represented <5% of progeny of crosses of Dio3+/− parents. Thrb2−/− mice (Ng et al., 2001) possessed a mixed 129/Sv × C57BL/6J × DBA background. Survival rates of Dio3−/− pups improved after crossing onto the background of the Thrb2−/− strain. The cone phenotype was similar on both backgrounds. For T3 treatments, C57BL/6J +/+ pups were given a daily injection (sub-cutaneous) of saline vehicle or T3 in saline (0.1 or 1.5 μg T3 in 10 μL volume) at P0 – P3. To measure the level of serum T3 attained 2 hours post-injection, serum was pooled from 4-6 pups at P4, one day older than groups taken for retinal analysis, to increase the small volumes of serum obtainable. Pregnant C57BL/6J female mice were made hypothyroid by treatment with methimazole (MMI, 0.05% w/v) and potassium perchlorate (1.0 % w/v) in the drinking water beginning at gestational day 14 and continuing until progeny were analyzed (shown in Supplemental Figure S1). Mouse experiments were performed in accordance with NIH guidelines and institutional protocols at NIDDK/NIH and University of Pennsylvania.
Deiodinase and hormone measurements
Type 3 deiodinase activity was measured as described (Hernandez et al., 2006) for individual pairs of eyes for groups of 10 - 30 embryos from 2 - 5 litters. Activity was determined by measuring, after separation by paper chromatography, the amount of [125I]-3, 3’-T2 produced after incubation of tissue homogenate for 1 hour with 2 nM [125I]-T3 in the presence of 50 mM dithiothreitol. To avoid variation from potential further deiodination of T2 product into monoiodothyronine (T1), assay conditions were employed that maintained a deiodination rate below 30% to ensure linearity with respect to the amount of protein included. Under these conditions, no significant T1 was generated and type 3 deiodinase activities were calculated as T2 generated per h and mg of protein. Radio-labeled substrate was obtained from Perkin-Elmer (Norwalk, CT). Serum total T4 and T3 levels were determined by radioimmunoassay with Coat-A-Count reagents (Diagnostic Systems Laboratories) (Hernandez et al., 2006).
Immunohistochemistry and in situ hybridization
Cryosections (10 μm thick) were blocked with PBS containing 1.5% goat serum, 0.1% BSA and 0.4% Triton X100 then incubated with primary antibodies overnight at room temperature then with biotinylated goat anti-rabbit antibodies. Detection was performed with a Vector ABC Elite kit with 3,3’-diaminobenzidine (Vector Laboratories). Antibody sources and dilutions for use: rabbit anti-opsin blue (AB5407 Chemicon 1:1,000), rabbit anti-opsin red/green (AB5405 Chemicon, 1:1,000), mouse monoclonal anti-rhodopsin (04886 Sigma-Aldrich 1:2,000), rabbit anti-activated Caspase 3 (Promega 1:500), rabbit anti-TRβ2 (Ng et al., 2009a)(1:1,000). Secondary antibodies were FITC-conjugated goat anti-rabbit (Vector Laboritories) and AlexaFluor 568 goat anti-rabbit (Invitrogen). TUNEL analysis was performed with the In Situ Cell Death Detection kit (Roche). Digoxigenin-labeled riboprobes were generated from a Dio3 cDNA amplified by PCR from mouse brain RNA and cloned into pGEM11 (Promega) corresponding to rat Dio3 bases 78-525 (accession no. RNU24282). Riboprobes were applied to 10 μm cyrosections with colorimetric detection as described (Lu et al., 2009).
Histology and transmission electron microscopy
Retinae were fixed overnight in PBS containing 2% PFA and 3% glutaraldehyde at 4°C, dehydrated through 30%, 50%, 70% and 100% ethanol then embedded in glycol methacrylate (Polysciences). Histological 3 μm thick microtome sections were stained with hematoxylin and eosin. Cone and rod nuclei were counted in 165 μm long fields of ONL in 2 representative fields/section on 3 sections/eye for 3 mice/genotype. Statistical tests were based on the Student's t-test. For transmission electron microscopy, retinae (3 mice/group) were post-fixed in 1% osmium tetroxide in PBS for 1 h and embedded in Spurr's plastic resin. Sections (600 - 800Å) were analyzed on a Zeiss transmission electron micoscope (JFE Enterprises, Brookville, Md).
Electroretinogram recordings
ERG recording methods were described previously (Lyubarsky et al., 1999; Lyubarsky et al., 2002). In brief, adult mice were dark-adapted overnight then anesthetized with a cocktail containing (in mg/g body weight): 25 ketamine, 10 xylazine, and 1000 urethane and placed on a stage maintained at 38°C. The pupil was dilated with 1% tropicamide saline solution (Mydriacil; Alconox, New York, NY). A recording electrode was placed in electrical contact with the cornea. A stainless steel bite bar served as both reference and ground electrode. ERGs were recorded with a differential amplifier with bandwidth 0.1 Hz to 1 kHz and sampled at 240 μs intervals (Axotape 2 software and acquisition board, Axon Instruments, Foster City, CA). Signals were processed offline with custom software developed with MATLAB (Mathworks, Natick, MA). Recordings were made in an 8 inch × 8 inch ×14 inch aluminum Faraday cage coated internally with UV-reflecting white paint (Kodak Scientific, Rochester, NY) which served also as a ganzfeld. For a few experiments, an Espion Electrophysiology System (Diagnosys LLC, Lowell, MA) was used. Rod responses were suppressed with constant green light at 10(P)cd/m2. To measure S opsin responses, a UV light-emitting diode (LED) was used with a peak at 367 nm, half-bandwidth of 15 nm and intensities of 0.0001. 0.0005, 0.0015, 0.005 and 0.05 (P)cd/m2. To measure M opsin responses, an LED was used with a peak at 520 nm, half-bandwith of 35 nm and intensities of 0.5, 1.5, 5.0, 15.0 and 25.0 (P)cd/m2. Sampling frequency was 100 Hz with 20 responses averaged per recorded trace.
Light stimulation
Methods for light stimulation and calibration of light stimuli were described previously (Lyubarsky et al., 1999). For monochromatic stimuli, flash intensities are reported in photons μm-2 at the retina and represent the number of quanta incident upon a unit of area of the retina. The utility of using this parameter which cannot be measured directly is that it allows for uniform representation of stimulus intensities for both pigmented and albino mice. To obtain intensities at the retina, light sources were calibrated in units of photons μm-2 at the cornea with a calibrated photodioide positioned at the location of the mouse eye in the ganzfeld stimulator as described (Lyubarsky and Pugh, 1996; Lyubarsky et al., 1999). The stimulus intensity at the retina was computed as
For pigmented mice, values for pupil and retina areas were taken as 3.1 and 14.1 mm2 respectively (Lyubarsky and Pugh, 1996). We have found that for a given illuminance, rhodopsin bleach rate in situ is 3-fold higher for albino mice than for pigmented mice (Lyubarsky et al., 2004); therefore we assumed that an effective pupil area for albino mice is 3 × 3.14 = 9.4 mm2. Intensity of broadband orange (λ>530 nm) stimuli targeting M opsin is reported in equivalent 500 nm photons μm-2; intensity of achromatic white flashes is reported in equivalent photons μm-2 at absorbance maximums of respective visual pigments (Lyubarsky et al., 1999).
Measurements of the spectral sensitivity of the cone-driven b-wave
Methods for measuring spectral sensitivity of the cone-driven b-wave have been described (Lyubarsky et al., 1999; Lyubarsky et al., 2002). Cone-driven responses were isolated by suppressing rod activity with steady achromatic background light delivering ~10,000 photoisomerizations/rod. The measure of sensitivity reported here, the fractional sensitivity, represents the fraction of the saturating cone b-wave suppressed per (photon μm-2) in the linear range of the cone b-wave response.
Single cone recordings
Responses of cones to brief flashes of calibrated monochromatic light were recorded with suction pipettes as described (Nikonov et al., 2006). In brief, the perinuclear region of 2-5 cells in the ONL of retinal slices was drawn into a suction pipette, and photocurrent (i.e. the suppression of the circulating current) measured in response to light. The contribution of rods was suppressed by a steady 500 nm background of 10,000 photons μm-2 that suppressed the rods’ circulating current.
Results
Requirement for type 3 deiodinase in cone development
To investigate a role for deiodinases in photoreceptor development and function, deiodinase activity was analyzed in mouse eye homogenates. Type 3 deiodinase activity was relatively abundant in homogenates from embryonic day 13 (E13) until birth. Activity declined postnatally but persisted at low levels into adulthood (Figure 1A). Northern blot analysis showed that expression of Dio3 mRNA paralleled that of type 3 deiodinase activity (Figure 1B). The major 2.2 kb Dio3 mRNA in eye was similar to that in the cochlea but was smaller than the most abundant 2.8 kb mRNA in adult brain; both mRNAs are thought to encode active enzyme (Dentice et al., 2007; Ng et al., 2009b). Little type 2 (Dio2) or type 1 (Dio1) deiodinase mRNA or activity was detected in eye although weak Dio2 mRNA expression was detected at later postnatal stages (not shown). In situ hybridization localized Dio3 mRNA in all neural retina layers (outer neuroblast, inner neuroblast and ganglion cell layers) in the embryo and in the neonate (Figure 1C). This widespread expression pattern is likely to include undifferentiated neuroblasts as well as many differentiating but immature cell types. The broad expression pattern persisted at postnatal stages (shown at P2) but with a general decline in signal intensity consistent with the decreased enzyme activity levels. Although individual cell types could not be identified with currently available reagents, the broad expression pattern suggested a role for type 3 deiodinase in restricting the availability of thyroid hormone for target cells in the immature retina.
Figure 1. Type 3 deiodinase expression in retinal development.

A, Type 3 deiodinase activity in mouse eye homogenates. Activity was determined for pools of eyes at the ages indicated. Note: x-axis scale differs at embryonic and postnatal ages.
B, Northern blot detection of Dio3 mRNA in eye development. The main 2.2 kb Dio3 mRNA in eye was similar to that reported in the cochlea (Ng et al., 2009b). Brain and liver, positive and negative control tissues for Dio3 expression. 28S, rRNA control for RNA integrity detected by methylene blue staining.
C, In situ hybridization detected Dio3 mRNA in all layers of the immature neural retina at E16.5 (top panel). Higher magnification (lower panels) shows signals for Dio3 at E18.5 and P2 and a control sense strand probe at P2. GCL, ganglion cell layer, ONBL, outer neuroblastic layer, INBL, inner neuroblastic layer; RPE, retinal pigmented epithelium. Scale bars, 50 μm, left panel, 20 μm, right panels.
D, Loss of retinal type 3 deiodination in Dio3−/− mice. Plots show mean activity ± sd determined for individual pairs of eyes from 7 +/+, 21 +/− and 12 −/− embryos at E18.5.
A requirement for type 3 deiodinase in cone development was revealed in Dio3−/− mice (Hernandez et al., 2006), which lacked type 3 deiodinase activity in eye (Figure 1D). To avoid possible variation in maternal influence over the phenotype, all progeny studied were derived from +/− parents. Normally, M and S opsins are expressed in opposing distribution gradients across the retina with M opsin predominating in superior and S opsin in inferior zones while cones in middle regions express varying proportions of both opsins (Szel et al., 1993; Applebury et al., 2000). Adult Dio3−/− mice lacked ~80% of both M opsin+ and S opsin+ cones (Figure 2A; counts in Figure 6B). Among the remaining cones in Dio3−/− mice there was an unusual incidence of cones with opsins located aberrantly throughout the cell body, axon and pedicle rather than in the outer segment. The results suggested that Dio3 was primarily required for the survival and maturation of cones rather than for opsin patterning.
Figure 2. Requirement for Dio3 in cone development.

A, Immunostaining of retinal sections for M and S opsin+ cones in 2 month old +/+ and Dio3−/− mice. In +/+ mice, M and S opsins are detected in outer segments (OS) with opposing distribution gradients across the superior-inferior axis of the retina. Dio3−/− mice lacked most M and S opsin+ cones; some residual cones displayed opsin mislocalized in the cell body, axon and pedicle. Sections were lightly counter-stained with hematoxylin. INL, inner nuclear layer, ONL, outer nuclear layer, RPE, retinal pigmented epithelium (grey arrowhead). Scale bar, 20 μm.
B, Retinal histology. Methacrylate sections stained with hematoxylin and eosin showing absence of most cones in adult Dio3−/− mice. Arrowheads identify cone nuclei at the outer edge of the photoreceptor layer (ONL). Cones are sparse in the ONL, most of which consists of many small, dense rod nuclei. IS, inner segment layer. Scale bar, 20 μm.
C, Transmission electron micrographs of retina showing cones (arrowheads) and rods (r) in 3 month old mice (magnification × 2,500). Fewer cone nuclei were present in Dio3−/− mice than in +/+ mice and some remaining cones showed a less distinct morphology than in +/+ mice.
D, Counts of cone and rod nuclei. Counts were determined as described in Materials and Methods and are shown as means ± sd determined for 165 μm long ONL fields on 3 μm thick methacrylate sections. Dio3−/− mice had ~20% of +/+ cone numbers (p < 0.0001). Rod numbers were not significantly different.
Figure 6. Electroretinogram responses in Dio3−/− and Dio3−/−;Thrb2−/− mice.

A, Full field cone-driven responses to achromatic and long wavelength stimuli. Black traces, saturating responses to bright (2000 scot cd m-2) white flashes (total cone response); green traces, responses to orange (λ >530 nm) flashes (M opsin+ cone response). In +/+ mice, an orange flash of 600 scot cd m-2 elicits a response almost identical to the saturating response to a white stimulus indicating that most cones express some M opsin (Lyubarsky et al., 1999). In Dio3−/− mice, amplitudes of saturating responses to white and orange flashes are ~5 fold smaller than in +/+ mice. In Dio3−/−;Thrb2−/− mice, white flashes elicit saturating cone responses of normal magnitude but orange flashes of any intensity (70 and 600 scot cd m-2)(green traces) generate only a small response consistent with lack of M opsin.
B, Cone-driven ERGs generated by short wavelength stimuli. Black traces, saturating responses elicited with bright (2000 scot cd m-2) white flashes. Blue traces, responses to ultraviolet (360 nm) flashes with estimated intensities of (photons μm-2 at the retina) 660 and 1320 for +/+ mice and 140 and 250 for Dio3−/−;Thrb2−/− mice. Similar magnitudes of response are elicited with ~5-fold dimmer stimulus in Dio3−/−;Thrb2−/− than in +/+ mice.
C, ERGs of dark-adapted mice. Top panels, responses to dim (0.02 scot cd m-2 s) flashes of green (510 nm) light. In these conditions, ERGs are represented by rod-driven (scotopic) b-waves of saturating magnitude and reflect primarily the magnitude of the rod bipolar cells’ circulating current. Bottom panels, responses to bright (200 scot cd m-2 s) achromatic flashes that saturate the a-wave amplitude, which is proportional to the rod photoreceptors’ circulating current. The corneal negative a-wave component is highlighted in red.
D, Bar charts of mean values (± sd) for ERG components and properties illustrated in panels A-C for groups of mice. Groups: 10 +/+, 7 Dio3−/−, 6 Dio3−/−;Thrb2−/−, 8 Thrb2−/− mice. Statistically significant differences in mutant mouse groups compared to +/+ mice are identified by asterisks: *, p < 0.05; **, p < 0.01 (1-tail t-tests).
Histological analysis showed that adult Dio3−/− mice at 3 months of age had ≤20% of normal total cone numbers but normal rod numbers (Figure 2B, D). Rods, the second major class of photoreceptor, mediate vision in dim light and express rhodopsin photopigment. Rods can be distinguished from cones by their greater abundance and their more compact, chromatin-dense nuclei compared to the larger, less dense nuclei of cones (Carter-Dawson and LaVail, 1979a). The cone loss in Dio3−/− mice was confirmed by transmission electron microscopy which also showed that some residual cones had a less distinct morphology than usual (Figure 2C). Dio3−/− mice showed no overt morphological abnormality in the retina other than loss of cones.
Loss of immature cones by cell death in Dio3−/− mice
Analysis of early cone markers showed that cones were generated in Dio3−/− embryos but were lost somewhat abruptly after P1 (Figure 3A). A population of newly-generated TRβ2+ cones was present in the outer neuroblastic layer (ONBL) of both Dio3−/− and wild type (+/+) embryos at E16.5. Also, S opsin+ cones were detected in both Dio3−/− and +/+ pups at P1 but by P5, few S opsin+ cells remained in Dio3−/− mice. Rhodopsin expression was not overtly altered in Dio3−/− mice.
Figure 3. Cone cell death in Dio3−/− pups.

A, Immunostaining for early cone markers. A newly-generated cone population (TRβ2+) was detected in both +/+ and Dio3−/− mice at E16.5. S opsin+ cones were also present in both genotypes at P1 but most cones were lost in Dio3−/− mice between P1 and P5. Scale bar, 20 μm.
B, Fluorescence detection of TUNEL+ (green) and S opsin+ (red) cells in +/+ and Dio3−/− pups at P2. Dio3−/− pups exhibit increased numbers of TUNEL+ and TUNEL+/S opsin+ double-positive cells (yellow, merge). In +/+ pups, most S opsin+ cones resided near the edge of the ONBL but in Dio3−/− pups, many of the remaining S opsin+ cones were dispersed in the INBL and ONBL. Scale bar, 20 μm.
C, Counts of S opsin+, TUNEL+ and double-positive (TUNEL+/S opsin+) cells at P2. Counts were determined in mid-retinal fields (400 μm long fields) on 10 μm cryosections. Groups, n = 6 eyes from 3 mice.
D, Immunostaining for activated caspase 3+ cells in retina in +/+ and Dio3−/− mice during development at postnatal stages. Positive cell numbers increased in Dio3−/− mice in the ONBL and INBL at P2 - P8. IL, inner layers (inner neuroblastic, P2, P5, or inner nuclear, P8, P24); OL, outer layers (outer neuroblastic P2, P5, or outer nuclear, P8, 24). Scale bar, 20 μm.
E, Counts of activated caspase 3+ cells determined over the full length of mid-retinal, 10 μm thick cryosections. Groups, n = 4 - 8 eyes from 2 - 4 mice per age.
Analysis of cell death markers showed that Dio3−/− pups lost cones by cell death (Figure 3B). In +/+ pups at P2, cells positive for terminal deoxynucleotidyl transferase dUTP nick end labeling (TUNEL+) were detected in the ganglion cell layer (GCL) and inner neuroblastic layer (INBL) and at lower incidence in the ONBL, in accord with the normal pattern of developmental cell death in the mouse retina (Young, 1984). In +/+ pups, most S opsin+ cells were located in the ONBL and few (1.5%) were co-labeled by TUNEL. In contrast, in Dio3−/− pups at P2, 64% of remaining S opsin+ cells were TUNEL+, suggesting that cones accounted for most of the increase in dying cells (Figure 3C). Total S opsin+ cone numbers were ~50% reduced below normal in Dio3−/− pups by P2.
The cell death incidence in Dio3−/− mice was elevated only transiently in the early postnatal period. Compared to +/+ mice at P2, Dio3−/− pups had an 8-fold increase in activated caspase 3+ cells in the ONBL and a 3-fold increase in the INBL (Figure 3D, E). By P8, Dio3−/− mice had a declining incidence of dying cells with only a small (~2-fold) increase in activated caspase 3+ cells in the ONL compared to +/+ mice. At P24, almost no dying cells were identified in any retinal layer in Dio3−/− or +/+ mice. Thus, Dio3−/− mice displayed a cone-selective, transient increase in developmental cell death rather than a widespread or progressive degeneration of the retina.
Immature cones in Dio3−/− mice were also abnormally located in the retina. Normally, neonatal cones align near the outer edge of the ONBL and over the next few days migrate inwardly towards the INBL before migrating back to the outer edge of the ONL after P12 (Rich et al., 1997). In Dio3−/− mice at P1, S opsin+ cells were correctly aligned in the ONBL but by P2, S opsin+ cells were more widely dispersed in the ONBL and INBL (Figure 3B). Cell death in Dio3−/− mice was not a consequence of such mis-location because S opsin+/TUNEL+ double-labeled cells were detected in both the ONBL and INBL.
T3-induced death of immature cones
The ability of type 3 deiodinase to inactivate thyroid hormone suggested that cone loss in Dio3−/− mice resulted from unconstrained stimulation by T3. To test the hypothesis that T3 was the mediator of cone loss, +/+ C57BL/6J pups were injected daily with increasing T3 doses or saline vehicle between P0 and P3, a period that encompassed the peak phase of cone death in Dio3−/− mice (Figure 4A). It was predicted that the highest T3 doses would overcome the protective role of type 3 deiodinase to cause cone loss. Indeed, saline or moderately high T3 doses (0.1 μg/day, s.c.) produced no overt changes in M or S opsin+ cells when analyzed at P24. However, extremely high T3 doses (1.5 μg/day) eliminated cones, demonstrated by loss of M and S opsins, loss of reactivity to peanut agglutinin (PNA), a general marker of cones, and absence of morphologically identifiable cone nuclei (Figure 4A, C). These T3 doses marginally reduced rod numbers (Figure 4D). These very high T3 doses (1.5 μg/day) gave increased numbers of TUNEL+ cells and a near complete loss of S opsin+ cells at P3 (Figure 4B) consistent with cone loss resulting from a similar process as in Dio3−/− pups. As described previously (Ng et al., 2009b), injections of 0.1 and 1.5 μg T3 (s.c) in neonates resulted in ~70 and ~270-fold increases, respectively, in serum T3 levels above levels in saline-treated or untreated +/+ pups at P4 when measured ~2 hours post-injection.
Figure 4. Excessive T3 leads to cone loss in neonatal +/+ mice.

A, Analysis of cone and rod markers at P24 following prior injections (daily s.c.) of saline or high (0.1 μg) or extremely high (1.5 μg) T3 doses in +/+ pups from P0 - P3. The highest T3 doses eliminated identifiable cones using any marker (S, M opsins, PNA). Rhodopsin+ rods remained intact. Scale bar, 20 μm.
B, Analysis of S opsin and TUNEL staining in retina in pups at P3 following injections of 1.5 μg T3 given daily from P0 to P3. T3 gave a near complete loss of S opsin+ cones and increased numbers of TUNEL+ cells. A rare residual S opsin+ cell is shown. Scale bar, 20 μm.
C, Transmission electron micrographs of +/+ mouse retina at P24 following prior injections with saline or 1.5 μg T3 at P0 – P3 (magnification × 2,500). Rods (r) and cones (arrowheads) are indicated. T3 treatment eliminated cones.
D, Cone and rod counts in +/+ mice determined at P24 following prior injection at P0 – P3 of saline, or 0.1 or 1.5 μg T3 / day. A dose of 1.5 μg T3 / day eliminated cones (***, p = 3.8 × 10⁻¹⁰) but 0.1 μg T3 / day gave no significant cone loss (p = 0.78) compared to saline treatment. Rod numbers were slightly decreased by 0.1 μg T3 / day (*, p = 0.02) and 1.5 μg T3 / day (**, p = 7.1 × 10⁻⁵). Rod and cone nuclei were counted in 210 μm long ONL fields on 3 μm methacrylate sections. Groups, n = 5 eyes from 5 mice.
To establish further that T3 was the agent of cone cell death, Dio3−/− mice were made hypothyroid during development. Dio3+/− parents were crossed and pregnant females were treated with the antithyroid agent methimazole from gestational day 14.5, as described (Lu et al., 2009). Dio3−/− pups in these litters had 3 - 5-fold increased S opsin+ cell numbers at P6 compared to untreated Dio3−/− pups although numbers were still below normal (Supplement Figure S1). The partial recovery may be explained by the technical difficulty of inducing complete hypothyroidism within embryonic and neonatal tissues.
Cone loss in Dio3−/− mice requires TRβ2
To establish that cone loss in Dio3−/− mice was a direct response of cones to T3, the cone-specific thyroid hormone receptor TRβ2 was deleted from Dio3−/− mice. It was predicted that loss of TRβ2 would make cones resistant to T3 action. Mice with the combined genotype Dio3−/−;Thrb2−/− showed a marked rescue of cone numbers (Figure 5). Almost all of these recovered cones were correctly located near the outer edge of the ONL and all cones were S opsin+. Little or no M opsin was detectable, in accord with the known requirement for TRβ2 for M opsin induction (Ng et al., 2001). The results support the conclusion that in Dio3−/− mice, cone cell death and cone mis-location are cone-intrinsic functions mediated by excessive T3 stimulation of TRβ2.
Figure 5. TRβ2 mediates cone loss in Dio3−/− mice.

A, Immunostaining for M and S opsins in retina of mice of genotypes indicated at P24. Dio3−/− mice exhibited reduced cone numbers and also an incidence of mislocated opsin+ cells in the INL and unusual cells with staining in the axon and pedicle. S opsin+ cones were recovered in Dio3−/−;Thrb2−/− mice compared to Dio3−/− mice. In Dio3−/−;Thrb2−/− mice, recovered cones were almost exclusively S opsin+ and lacked M opsin, as in Thrb2−/− mice. Most recovered cones were correctly located at the edge of the ONL in Dio3−/−;Thrb2−/− mice. Scale bar, 20 μm.
B, Counts of S and M opsin+ cones in Dio3−/− and Dio3−/−;Thrb2−/− mice. Counts were determined in 100 μm long ONL fields on 10 μm cryosections in each of the four zones shown in the inset eye diagram. Boxes indicate zones in superior and inferior retina. Groups, n = 6 eyes from 3 mice.
Cone and rod function in Dio3−/− mice
Analysis of electroretinogram (ERG) responses showed that in accord with the loss of most cones, Dio3−/− mice exhibited a 5-fold reduced magnitude of the cone b-wave generated in response to intense, saturating achromatic flashes that excite both M and S opsins, compared to +/+ mice (Figure 6A, black traces). In Dio3−/− mice, although the absolute magnitude of the cone b-wave was much reduced, intense orange flashes (>530 nm) that photoisomerize only M opsin (Lyubarsky et al., 1999) elicited near saturating responses, indicating the presence of some amount of M opsin in the remaining cones (Figure 6A, green traces).
In Dio3−/−;Thrb2−/− mice, the rescue of cones correlated with a recovery of saturating cone b-waves with magnitudes comparable to those in +/+ mice (Figure 6A). However, in Dio3−/−;Thrb2−/− mice, in accord with the lack of M opsin, a saturating orange flash elicited only a small response of ~20% of the maximal amplitude of the cone b-wave observed in +/+ mice. Cone responses in Dio3−/−;Thrb2−/− mice thus resembled those of Thrb2−/− mice in which response to short wavelengths was retained but response to medium-long wavelengths was reduced (Ng et al., 2001).
Given that cones in Dio3−/−;Thrb2−/− mice expressed almost exclusively S opsin, we measured the sensitivity of the cone b-wave response for flashes of 360 nm, a wavelength near the maximum of the spectral sensitivity of S opsin. Families of responses not exceeding 30% of the saturating response (i.e. within the linear range of the intensity-response relation for the cone b-wave) were elicited by a series of 360 nm flashes of increasing intensity. Sensitivity to 360 nm light was enhanced ~5-fold in Dio3−/−;Thrb2−/− mice compared to +/+ mice (Figure 6B, D). Thrb2−/− mice showed a similar, though smaller (2.1-fold) enhanced sensitivity for 360 nm light (Figure 6D). Previously, Thrb2−/− mice were reported to exhibit near normal, not enhanced, responses to short wavelengths based on a stimulus of 450 nm (Ng et al., 2001), a difference from the present results that is explained by the 450 nm stimulus used previously being sub-optimal for measuring S opsin sensitivity in mice.
Rod function was assessed for dark-adapted mice with responses to dim flashes that elicited saturating rod b-wave responses and bright flashes that elicited mixed rod and cone responses. The bright flash saturates the a-wave response of normal rods and cones, but because of the 30-fold greater abundance of rods, the composite a-wave arises almost completely from the suppression of the transduction current of rods (Lyubarsky et al., 1999). The amplitude of both b- and a-waves measured in this way showed a slight but significant reduction in Dio3−/− mice compared to +/+ mice (Figure 6C, upper and lower panels, respectively). In Dio3−/−;Thrb2−/− mice, the rod b-wave amplitude was normal, while the a-wave was apparently reduced, though this was not statistically significant. These results indicate that rods are only mildly affected in Dio3−/− and Dio3−/−;Thrb2−/− mice.
Properties of single cones in Dio3−/−;Thrb2−/− and Thrb2−/− mice
In the ERG, the cone b-wave represents the response of cone bipolar cells, and thus its enhancement in Dio3−/−;Thrb2−/− mice could reflect either a gain in function of S opsin phototransduction in cones or enhanced transmission and responsiveness of bipolar cells driven by S cones. To distinguish between these possibilities, we studied single cone responses in Dio3−/−;Thrb2−/− and Thrb2−/− mice (Figure 7). In mice of these genotypes, cones had normal kinetic properties, as revealed by comparison with +/+ cones in terms of their response families (Figure 7A, D, G), amplification (B, E, H); flash sensitivity and time to recover (C, F, I). As all these properties were extracted from responses to 360 nm flashes, it can be concluded that the increased b-wave sensitivity to 360 nm light (Figure 7D) does not arise from altered S opsin-driven phototransduction of individual cones but rather in alterations in synaptic transmission to bipolar cells or in properties of the bipolar cells.
Figure 7. Properties of S opsin dominant cones in ventral retina of +/+, Dio3−/−;Thrb2−/− and Thrb2−/− mice.

Each row presents data recorded from a single cone of a +/+ (A, B, C), a Thrb2−/− (D, E, F) and a Dio3−/−;Thrb2−/− (G, H, I) mouse. A, D, G, show response families, normalized by the estimated maximum response amplitude corresponding to the complete suppression of the light sensitive current (short gray horizontal lines). B, E, H, responses from corresponding panels in the first column on the expanded time scale (black traces) together with theoretical predictions of the response rising phases (gray traces)(Pugh and Lamb, 1993; Nikonov et al., 2006); the estimated values of the amplification constant A for each cone are shown. C, F, I, normalized amplitude vs flash intensity data (left ordinates) and time to 40% recovery vs flash intensity data (right ordinates) for the corresponding response families in the first column. The amplitude vs flash intensity data were fitted with exponential saturation functions: the intensities Qe that drive the cell to 1/e of saturation parameter, are shown. Recovery times for responses to saturating flashes were fitted with straight lines to estimate dominant recovery time constants (τD)(Pepperberg et al., 1992). J, plot of the spectral sensitivity of one +/+ cone (open circles), four Thrb2−/− cones (blue circles, diamonds, triangles and inverted triangles, each representing a single cone) and one Dio3−/−;Thrb2−/− cone (red diamond; for a second Dio3−/−;Thrb2−/− cone, responses at 501 nm were too insensitive to be measured). The data of each genotype are describable as the combination of opsin template spectra (Lamb, 1995) for opsins with λmax at 360 nm (mouse S opsin) and 508 nm (mouse M opsin), respectively: the S opsin template is scaled to unity, while the M opsin template has been scaled to fit the data above 500 nm. The scaling factor provides an estimate of the fraction of M opsin co-expression in S-dominant cones (Nikonov et al., 2006; Nikonov et al., 2008). Gray error bar at 508 nm plots a 99% confidence interval for M opsin co-expression in S-dominant cones of +/+ mice derived from 30 cones.
Single cone recordings confirmed that the large loss of cone b-wave sensitivity to green light in Dio3−/−;Thrb2−/− or Thrb2−/− mice (Figure 7A) arises from diminished co-expression of M opsin in S opsin dominant cones (Figure 7J). Individual ventral cones of +/+ mice all exhibit a primary mode of sensitivity at 360 nm, the λmax of mouse S opsin, and a secondary mode at 510 nm, the λmax of mouse M opsin (Figure 7J, white circles). In ventral cones of +/+ mice this secondary mode is on average ~30-fold less sensitive than the primary mode but nonetheless reflects detectable co-expression of M opsin in S opsin dominant cones (Nikonov et al., 2006). In contrast, ventral cones of Thrb2−/− and Dio3−/−;Thrb2−/− mice exhibited a nearly 100-fold further reduction in sensitivity below the average +/+ level to green light (Figure 7J, blue circles and symbols, respectively). Though the sample of individual cones from the mutant mice is small, the loss of midwave sensitivity is extremely reliable: the probability that the sensitivities at 500 nm of the Thrb2−/− or Dio3−/−;Thrb2−/− cones could be those of a random sample of the population of ventral +/+ cones is negligible.
Discussion
Dual functions of thyroid hormone in cone development
This study reveals that cone survival is sensitive to T3 and that excessive T3 exposure in neonatal mice eliminates cones. Cone loss results from administration of T3 excesses or by inactivation of type 3 deiodinase, an enzyme that degrades thyroid hormone. Susceptibility to T3-mediated cell death presents a paradox for the cone because some amount of T3 is necessary for correct dorso-ventral patterning of M and S opsins. Hypothyroid mice have retarded expression of M opsin and an extended distribution of S opsin in cones across the retina, a phenotype resembling that of Thrb2−/− mice (Lu et al., 2009). Our findings suggest that type 3 deiodinase solves this paradox for the cone by lowering exposure to T3 to a level that prevents death but promotes survival and opsin patterning (Figure 8). The widespread expression of Dio3 in the retina may be advantageous in providing a sink for T3 from any source before it reaches the target cone cell.
Figure 8.
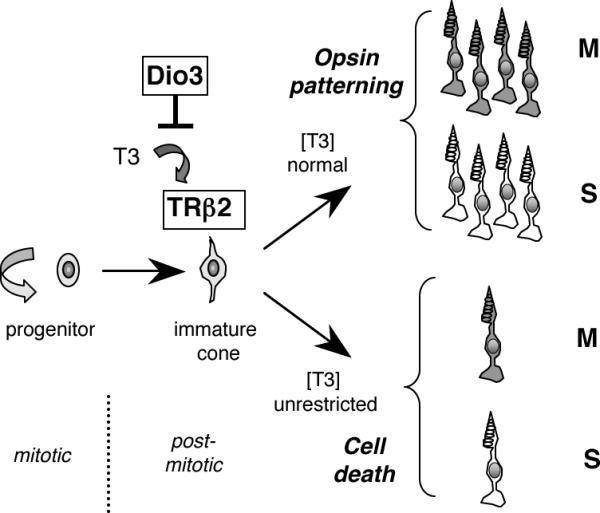
Diagram of the central role of TRβ2 in cone maturation and the role of Dio3 in limiting stimulation by T3 to beneficial levels. TRβ2 is expressed in newly-generated cones in mice and directs M opsin induction and differential patterning of M and S opsins in cones over the retina. Some amount of T3 is necessary for TRβ2 to induce M opsin and promote M and S opsin patterning. However, type 3 deiodinase constrains the exposure to T3 to prevent TRβ2-mediated cone cell death.
The surviving cones in Dio3−/− mice may represent a small population that escape death because of variability in hormonal exposure at the individual cell level. This possibility is supported by the finding that extremely high T3 doses (>250-fold above normal) given to +/+ pups eliminate all cones, presumably by exposing cones to far greater T3 levels than occur in Dio3−/− pups. Dio3−/− mice have abnormalities in the pituitary-thyroid axis that cause a premature 2 - 3 -fold rise in serum T3 levels at early postnatal stages (Hernandez et al., 2006; Ng et al., 2009b). However, in +/+ pups, T3 at levels ~70-fold above normal did not kill cones, indicating that absence of protection by type 3 deiodinase, rather than the moderately increased T3 level, is the primary cause of cone death in Dio3−/− mice.
Cones progress though distinct phases of sensitivity to T3 and are susceptible to T3-induced death only during the first postnatal week. By the second postnatal week, cones become resistant to death but sensitive to induction of M opsin (Roberts et al., 2006; Lu et al., 2009). These phases may be defined by the net action of several progressively changing factors, including serum thyroid hormone levels and levels of receptor and deiodinase expression. A previous study reported that T3 excesses at P0 - P3 suppressed S opsin expression but left PNA+ cones intact when examined at P3 (Roberts et al., 2006). It is likely that such high T3 doses ultimately would have killed most cones had analysis been performed at the later ages studied in the present work. Our results do not exclude the suggested negative regulation of S opsin expression by T3 in neonates (Ng et al., 2001; Shibusawa et al., 2003; Roberts et al., 2006) but reveal cone death to be the over-riding outcome when T3 exceeds a threshold at early stages.
Genetic cooperation and specificity of T3 action
This study reveals how close functional cooperation between receptor and deiodinase genes directs the maturation of a specific cell type, the cone, in response to T3. The findings also demonstrate the need to constrain TR activity at certain developmental stages, complementing previous evidence for mechanisms that enhance responses to T3 in target tissues. Known means of enhancing T3 action include amplification of T3 levels by type 2 deiodinase in the auditory system and brain in mice (Ng et al., 2004; Galton et al., 2007) and the specific uptake of thyroid hormone in brain by membrane transporters, as revealed by MCT8 transporter mutations in human X-linked mental retardation (Visser et al., 2008). Within the cell, a transcriptional coactivator TFIIH, which is mutated in human trichothiodystrophy, has been reported to stabilize TR binding to brain target genes in a mouse model (Compe et al., 2007). Mechanisms that both constrain and augment T3 action may prove to be equally important for any given response in neurodevelopment.
The results indicate how T3 coordinates development of cone photoreceptors within the changing developmental context of the organism as a whole. A progressive rise in thyroid hormone levels in the bloodstream is a prerequisite for maturation of many tissues but tissues vary in the threshold of T3 required and when T3 is required. Early retinal Dio3 expression protects neonatal cones from a deleterious response to T3 while the postnatal decline of Dio3 expression may contribute to the later induction of M opsin (Lu et al., 2009). Type 3 deiodination has been described in postnatal rat retinal extracts with a similar decline as occurs in the mouse (Ientile et al., 1984). Type 3 deiodinase activity or mRNA is also detected in frog, trout and chick eye (Marsh-Armstrong et al., 1999; Plate et al., 2002; Trimarchi et al., 2008). Dio3 controls additional functions in non-mammalian species such as eye growth in Xenopus laevis (Marsh-Armstrong et al., 1999). However, a role for Dio3 in cone survival may be conserved since in immature trout, thyroxine treatment induces a partial, apoptotic loss of UV-sensitive cones, a process that occurs naturally upon migration to a marine environment (Allison et al., 2006).
Cone function in absence of TRβ2 and type 3 deiodinase
In the absence of TRβ2 or of both TRβ2 and type 3 deiodinase, mice produce normal numbers of functional cones that express S but little or no M opsin. In both Thrb2−/− and Dio3−/−;Thrb2−/− mice, individual cones have largely normal physiological properties with normal activation and inactivation kinetics. One may therefore speculate that the response of cones to T3, mediated by Thrb and Dio3 genes, represents an adaptation acquired by an existing cone developmental program with the benefit of enhancing visual capability. Thus, mice lacking TRβ2 possess a basic visual system based upon rods for dim light vision and S cones for daylight vision. TRβ2 promotes M opsin expression, thereby enhancing daylight vision in the visible region of the spectrum and color discrimination. However, TRβ2 also confers the disadvantage of susceptibility to T3-mediated cone death such that the accompanying protection given by type 3 deiodinase is essential for enhancing visual capability.
We did observe that in Dio3−/−;Thrb2−/− or Thrb2−/− mice the cone ERG was significantly more sensitive to short wave light than in +/+ mice. S opsin expression is only marginally increased in adult Thrb2−/− mice (Ng et al., 2001) and is unlikely to explain fully the enhanced response. It is more likely that enhanced sensitivity occurs at the level of the synapse with the bipolar neurons that generate the cone b-wave response and may involve indirect changes in the post-synaptic bipolar neuron pool, or pre-synaptic changes in the cone. In mice lacking Nrl transcription factor, the retina has no rods but instead over-produces excess cones (Mears et al., 2001; Daniele et al., 2005). As these cones drive a b-wave with essentially normal amplitude, it follows that the cones can make functional synapses with rod bipolar cells (Strettoi et al., 2004). Thus, TRβ2 may regulate genes that control not only opsin patterning and cone death but also the properties of first-order synapses in the retina. Future study may reveal distinct sets of target genes for each of these functions of TRβ2.
We also detected a mild sensitivity of rods to T3 as Dio3−/− mice had slightly reduced rod function. Also, extremely high T3 doses in +/+ mice marginally reduced rod numbers. Although TRβ2 is cone-specific, T3 excesses may also act on other more widely expressed TR isoforms that may exist at low levels in rods. Alternatively, cone loss may indirectly influence rods through loss of cone-released factors or loss of cone-promoted cell contacts. The latter possibilities are in accord with reports of impaired rod function in human achromatopsia, in which cones are thought to carry the primary defect (Khan et al., 2007; Moskowitz et al., 2009).
Implications for retinal disease
Human DIO3 mutations are unknown but based on the Dio3−/− mouse phenotype could result in achromatopsia or rod monochromacy in which cone but not rod function is lost (Michaelides et al., 2004). Any such disorder may be syndromic since Dio3−/− mice also exhibit small stature and hearing loss (Hernandez et al., 2006; Ng et al., 2009b). Human rod monochromacy with small stature has been associated with maternal uniparental disomy of chromosome 14 which carries the DIO3 gene (Wiszniewski et al., 2007). Although the patient also carried a mutation in CNGB3, which is involved in other cases of achromatopsia, a contribution by DIO3 is not excluded. In mice, Dio3 is imprinted and is preferentially expressed from the paternal allele (Hernandez et al., 2002). Thus, maternal uniparental disomy may reduce DIO3 expression to cause overexposure to T3 thereby exacerbating the cone impairment. It is also possible that human congenital hyperthyroidism (Fisher, 2003) predisposes to cone impairment, although defects may be mild given the protective role of type 3 deiodinase. TRβ2 is detected in human fetal cones and in retinoblastoma cells which possess cone properties (Xu et al., 2009). Thus, enhancing T3 exposure may potentially provide a means of killing retinoblastoma tumor cells.
Supplementary Material
Acknowledgements
This work was supported in part by the intramural research program at NIH / NIDDK and by a Hirshl Award (D.F.), NIH grants HD09020 (V.A.G.), DK42271 (D.L.S.) and EY02660 (E.N.P.). We thank V.A. Galton for advice on the study.
References
- Allison WT, Dann SG, Veldhoen KM, Hawryshyn CW. Degeneration and regeneration of ultraviolet cone photoreceptors during development in rainbow trout. J Comp Neurol. 2006;499:702–715. doi: 10.1002/cne.21164. [DOI] [PubMed] [Google Scholar]
- Applebury ML, Antoch MP, Baxter LC, Chun LL, Falk JD, Farhangfar F, Kage K, Krzystolik MG, Lyass LA, Robbins JT. The murine cone photoreceptor: a single cone type expresses both S and M opsins with retinal spatial patterning. Neuron. 2000;27:513–523. doi: 10.1016/s0896-6273(00)00062-3. [DOI] [PubMed] [Google Scholar]
- Becker K, Stephens K, Davey J, Schneider M, Galton V. The type 2 and type 3 iodothyronine deiodinases play important roles in coordinating development in Rana catesbeiana tadpoles. Endocrinol. 1997;138:2989–2997. doi: 10.1210/endo.138.7.5272. [DOI] [PubMed] [Google Scholar]
- Bianco AC, Salvatore D, Gereben B, Berry MJ, Larsen PR. Biochemistry, cellular and molecular biology, and physiological roles of the iodothyronine selenodeiodinases. Endocr Rev. 2002;23:38–89. doi: 10.1210/edrv.23.1.0455. [DOI] [PubMed] [Google Scholar]
- Cao XY, Jiang XM, Dou ZH, Rakeman MA, Zhang ML, O'Donnell K, Ma T, Amette K, DeLong N, DeLong GR. Timing of vulnerability of the brain to iodine deficiency in endemic cretinism. N Engl J Med. 1994;331:1739–1744. doi: 10.1056/NEJM199412293312603. [DOI] [PubMed] [Google Scholar]
- Carter-Dawson LD, LaVail MM. Rods and cones in the mouse retina. I. Structural analysis using light and electron microscopy. J Comp Neurol. 1979a;188:245–262. doi: 10.1002/cne.901880204. [DOI] [PubMed] [Google Scholar]
- Carter-Dawson LD, LaVail MM. Rods and cones in the mouse retina. II. Autoradiographic analysis of cell generation using tritiated thymidine. J Comp Neurol. 1979b;188:263–272. doi: 10.1002/cne.901880205. [DOI] [PubMed] [Google Scholar]
- Compe E, Malerba M, Soler L, Marescaux J, Borrelli E, Egly JM. Neurological defects in trichothiodystrophy reveal a coactivator function of TFIIH. Nat Neurosci. 2007;10:1414–1422. doi: 10.1038/nn1990. [DOI] [PubMed] [Google Scholar]
- Daniele LL, Lillo C, Lyubarsky AL, Nikonov SS, Philp N, Mears AJ, Swaroop A, Williams DS, Pugh EN., Jr Cone-like morphological, molecular, and electrophysiological features of the photoreceptors of the Nrl knockout mouse. Invest Ophthalmol Vis Sci. 2005;46:2156–2167. doi: 10.1167/iovs.04-1427. [DOI] [PMC free article] [PubMed] [Google Scholar]
- Dentice M, Luongo C, Huang S, Ambrosio R, Elefante A, Mirebeau-Prunier D, Zavacki AM, Fenzi G, Grachtchouk M, Hutchin M, Dlugosz AA, Bianco AC, Missero C, Larsen PR, Salvatore D. Sonic hedgehog-induced type 3 deiodinase blocks thyroid hormone action enhancing proliferation of normal and malignant keratinocytes. Proc Natl Acad Sci U S A. 2007;104:14466–14471. doi: 10.1073/pnas.0706754104. [DOI] [PMC free article] [PubMed] [Google Scholar]
- Escamez MJ, Guadano-Ferraz A, Cuadrado A, Bernal J. Type 3 iodothyronine deiodinase is selectively expressed in areas related to sexual differentiation in the newborn rat brain. Endocrinology. 1999;140:5443–5446. doi: 10.1210/endo.140.11.7244. [DOI] [PubMed] [Google Scholar]
- Fisher DA. Neonatal hyperthyroid screening. J Pediatr. 2003;143:285–287. doi: 10.1067/S0022-3476(03)00384-6. [DOI] [PubMed] [Google Scholar]
- Galton VA, Wood ET, St Germain EA, Withrow CA, Aldrich G, St Germain GM, Clark AS, St Germain DL. Thyroid Hormone Homeostasis and Action in the Type 2 Deiodinase-Deficient Rodent Brain During Development. Endocrinology. 2007;148:3080–3088. doi: 10.1210/en.2006-1727. [DOI] [PubMed] [Google Scholar]
- Hernandez A, Fiering S, Martinez E, Galton VA, St Germain D. The gene locus encoding iodothyronine deiodinase type 3 (Dio3) is imprinted in the fetus and expresses antisense transcripts. Endocrinology. 2002;143:4483–4486. doi: 10.1210/en.2002-220800. [DOI] [PubMed] [Google Scholar]
- Hernandez A, Martinez ME, Fiering S, Galton VA, St Germain D. Type 3 deiodinase is critical for the maturation and function of the thyroid axis. J Clin Invest. 2006;116:476–484. doi: 10.1172/JCI26240. [DOI] [PMC free article] [PubMed] [Google Scholar]
- Ientile R, Macaione S, Russo P, Pugliese G, Di Giorgio RM. Phenolic and tyrosyl ring deiodination in thyroxine from rat retina during postnatal development. Eur J Biochem. 1984;142:15–19. doi: 10.1111/j.1432-1033.1984.tb08244.x. [DOI] [PubMed] [Google Scholar]
- Kaplan MM, Yaskoski KA. Maturational patterns of iodothyronine phenolic and tyrosyl ring deiodinase activities in rat cerebrum, cerebellum, and hypothalamus. J Clin Invest. 1981;67:1208–1214. doi: 10.1172/JCI110136. [DOI] [PMC free article] [PubMed] [Google Scholar]
- Kester MH, Martinez de Mena R, Obregon MJ, Marinkovic D, Howatson A, Visser TJ, Hume R, Morreale de Escobar G. Iodothyronine levels in the human developing brain: major regulatory roles of iodothyronine deiodinases in different areas. J Clin Endocrinol Metab. 2004;89:3117–3128. doi: 10.1210/jc.2003-031832. [DOI] [PubMed] [Google Scholar]
- Khan NW, Wissinger B, Kohl S, Sieving PA. CNGB3 achromatopsia with progressive loss of residual cone function and impaired rod-mediated function. Invest Ophthalmol Vis Sci. 2007;48:3864–3871. doi: 10.1167/iovs.06-1521. [DOI] [PubMed] [Google Scholar]
- Lamb TD. Photoreceptor spectral sensitivities: common shape in the long-wavelength region. Vision Res. 1995;35:3083–3091. doi: 10.1016/0042-6989(95)00114-f. [DOI] [PubMed] [Google Scholar]
- Lu A, Ng L, Ma M, Kefas B, Davies TF, Hernandez A, Chan CC, Forrest D. Retarded developmental expression and patterning of retinal cone opsins in hypothyroid mice. Endocrinology. 2009;150:1536–1544. doi: 10.1210/en.2008-1092. [DOI] [PMC free article] [PubMed] [Google Scholar]
- Lyubarsky AL, Pugh EN., Jr Recovery phase of the murine rod photoresponse reconstructed from electroretinographic recordings. J Neurosci. 1996;16:563–571. doi: 10.1523/JNEUROSCI.16-02-00563.1996. [DOI] [PMC free article] [PubMed] [Google Scholar]
- Lyubarsky AL, Falsini B, Pennesi ME, Valentini P, Pugh EN., Jr UV- and midwave-sensitive cone-driven retinal responses of the mouse: a possible phenotype for coexpression of cone photopigments. J Neurosci. 1999;19:442–455. doi: 10.1523/JNEUROSCI.19-01-00442.1999. [DOI] [PMC free article] [PubMed] [Google Scholar]
- Lyubarsky AL, Lem J, Chen J, Falsini B, Iannaccone A, Pugh EN., Jr Functionally rodless mice: transgenic models for the investigation of cone function in retinal disease and therapy. Vision Res. 2002;42:401–415. doi: 10.1016/s0042-6989(01)00214-0. [DOI] [PubMed] [Google Scholar]
- Lyubarsky AL, Daniele LL, Pugh EN., Jr From candelas to photoisomerizations in the mouse eye by rhodopsin bleaching in situ and the light-rearing dependence of the major components of the mouse ERG. Vision Res. 2004;44:3235–3251. doi: 10.1016/j.visres.2004.09.019. [DOI] [PubMed] [Google Scholar]
- Marsh-Armstrong N, Huang H, Remo BF, Liu TT, Brown DD. Asymmetric growth and development of the Xenopus laevis retina during metamorphosis is controlled by type III deiodinase. Neuron. 1999;24:871–878. doi: 10.1016/s0896-6273(00)81034-x. [DOI] [PubMed] [Google Scholar]
- Mears AJ, Kondo M, Swain PK, Takada Y, Bush RA, Saunders TL, Sieving PA, Swaroop A. Nrl is required for rod photoreceptor development. Nat Genet. 2001;29:447–452. doi: 10.1038/ng774. [DOI] [PubMed] [Google Scholar]
- Michaelides M, Hunt DM, Moore AT. The cone dysfunction syndromes. Br J Ophthalmol. 2004;88:291–297. doi: 10.1136/bjo.2003.027102. [DOI] [PMC free article] [PubMed] [Google Scholar]
- Mollon JD. Color vision: opsins and options. Proc Natl Acad Sci U S A. 1999;96:4743–4745. doi: 10.1073/pnas.96.9.4743. [DOI] [PMC free article] [PubMed] [Google Scholar]
- Morreale de Escobar G, Obregon MJ, del Rey FE. Maternal thyroid hormones early in pregnancy and fetal brain development. Best Pract Res Clin Endocrinol Metab. 2004;18:225–248. doi: 10.1016/j.beem.2004.03.012. [DOI] [PubMed] [Google Scholar]
- Moskowitz A, Hansen RM, Akula JD, Eklund SE, Fulton AB. Rod and rod-driven function in achromatopsia and blue cone monochromatism. Invest Ophthalmol Vis Sci. 2009;50:950–958. doi: 10.1167/iovs.08-2544. [DOI] [PMC free article] [PubMed] [Google Scholar]
- Nathans J. The evolution and physiology of human color vision: insights from molecular genetic studies of visual pigments. Neuron. 1999;24:299–312. doi: 10.1016/s0896-6273(00)80845-4. [DOI] [PubMed] [Google Scholar]
- Ng L, Hurley JB, Dierks B, Srinivas M, Saltó C, Vennström B, Reh TA, Forrest D. A thyroid hormone receptor that is required for the development of green cone photoreceptors. Nat Genet. 2001;27:94–98. doi: 10.1038/83829. [DOI] [PubMed] [Google Scholar]
- Ng L, Goodyear RJ, Woods CA, Schneider MJ, Diamond E, Richardson GP, Kelley MW, Germain DL, Galton VA, Forrest D. Hearing loss and retarded cochlear development in mice lacking type 2 iodothyronine deiodinase. Proc Natl Acad Sci U S A. 2004;101:3474–3479. doi: 10.1073/pnas.0307402101. [DOI] [PMC free article] [PubMed] [Google Scholar]
- Ng L, Ma M, Curran T, Forrest D. Developmental expression of thyroid hormone receptor beta2 protein in cone photoreceptors in the mouse. Neuroreport. 2009a;20:627–631. doi: 10.1097/WNR.0b013e32832a2c63. [DOI] [PMC free article] [PubMed] [Google Scholar]
- Ng L, Hernandez A, He W, Ren T, Srinivas M, Ma M, Galton VA, St Germain DL, Forrest D. A protective role for type 3 deiodinase, a thyroid hormone-inactivating enzyme, in cochlear development and auditory function. Endocrinology. 2009b;150:1952–1960. doi: 10.1210/en.2008-1419. [DOI] [PMC free article] [PubMed] [Google Scholar]
- Nikonov SS, Kholodenko R, Lem J, Pugh EN., Jr Physiological features of the S- and M-cone photoreceptors of wild-type mice from single-cell recordings. J Gen Physiol. 2006;127:359–374. doi: 10.1085/jgp.200609490. [DOI] [PMC free article] [PubMed] [Google Scholar]
- Nikonov SS, Brown BM, Davis JA, Zuniga FI, Bragin A, Pugh EN, Jr., Craft CM. Mouse cones require an arrestin for normal inactivation of phototransduction. Neuron. 2008;59:462–474. doi: 10.1016/j.neuron.2008.06.011. [DOI] [PMC free article] [PubMed] [Google Scholar]
- Pepperberg DR, Cornwall MC, Kahlert M, Hofmann KP, Jin J, Jones GJ, Ripps H. Light-dependent delay in the falling phase of the retinal rod photoresponse. Vis Neurosci. 1992;8:9–18. doi: 10.1017/s0952523800006441. [DOI] [PubMed] [Google Scholar]
- Plate EM, Adams BA, Allison WT, Martens G, Hawryshyn CW, Eales JG. The effects of thyroxine or a GnRH analogue on thyroid hormone deiodination in the olfactory epithelium and retina of rainbow trout, Oncorhynchus mykiss, and sockeye salmon, Oncorhynchus nerka. Gen Comp Endocrinol. 2002;127:59–65. doi: 10.1016/s0016-6480(02)00022-9. [DOI] [PubMed] [Google Scholar]
- Pugh EN, Jr., Lamb TD. Amplification and kinetics of the activation steps in phototransduction. Biochim Biophys Acta. 1993;1141:111–149. doi: 10.1016/0005-2728(93)90038-h. [DOI] [PubMed] [Google Scholar]
- Rich KA, Zhan Y, Blanks JC. Migration and synaptogenesis of cone photoreceptors in the developing mouse retina. J Comp Neurol. 1997;388:47–63. [PubMed] [Google Scholar]
- Roberts MR, Srinivas M, Forrest D, Morreale de Escobar G, Reh TA. Making the gradient: thyroid hormone regulates cone opsin expression in the developing mouse retina. Proc Natl Acad Sci U S A. 2006;103:6218–6223. doi: 10.1073/pnas.0509981103. [DOI] [PMC free article] [PubMed] [Google Scholar]
- Rovet J, Daneman D. Congenital hypothyroidism: a review of current diagnostic and treatment practices in relation to neuropsychologic outcome. Paediatr Drugs. 2003;5:141–149. doi: 10.2165/00128072-200305030-00001. [DOI] [PubMed] [Google Scholar]
- Shibusawa N, Hashimoto K, Nikrodhanond AA, Liberman MC, Applebury ML, Liao XH, Robbins JT, Refetoff S, Cohen RN, Wondisford FE. Thyroid hormone action in the absence of thyroid hormone receptor DNA-binding in vivo. J Clin Invest. 2003;112:588–597. doi: 10.1172/JCI18377. [DOI] [PMC free article] [PubMed] [Google Scholar]
- St Germain DL, Hernandez A, Schneider MJ, Galton VA. Insights into the role of deiodinases from studies of genetically modified animals. Thyroid. 2005;15:905–916. doi: 10.1089/thy.2005.15.905. [DOI] [PubMed] [Google Scholar]
- Strettoi E, Mears AJ, Swaroop A. Recruitment of the rod pathway by cones in the absence of rods. J Neurosci. 2004;24:7576–7582. doi: 10.1523/JNEUROSCI.2245-04.2004. [DOI] [PMC free article] [PubMed] [Google Scholar]
- Szel A, Rohlich P, Mieziewska K, Aguirre G, van Veen T. Spatial and temporal differences between the expression of short- and middle-wave sensitive cone pigments in the mouse retina: a developmental study. J Comp Neurol. 1993;331:564–577. doi: 10.1002/cne.903310411. [DOI] [PubMed] [Google Scholar]
- Trimarchi JM, Harpavat S, Billings NA, Cepko CL. Thyroid hormone components are expressed in three sequential waves during development of the chick retina. BMC Dev Biol. 2008;8:101. doi: 10.1186/1471-213X-8-101. [DOI] [PMC free article] [PubMed] [Google Scholar]
- Visser WE, Friesema EC, Jansen J, Visser TJ. Thyroid hormone transport in and out of cells. Trends Endocrinol Metab. 2008;19:50–56. doi: 10.1016/j.tem.2007.11.003. [DOI] [PubMed] [Google Scholar]
- Wiszniewski W, Lewis RA, Lupski JR. Achromatopsia: the CNGB3 p.T383fsX mutation results from a founder effect and is responsible for the visual phenotype in the original report of uniparental disomy 14. Hum Genet. 2007;121:433–439. doi: 10.1007/s00439-006-0314-y. [DOI] [PubMed] [Google Scholar]
- Xiao M, Hendrickson A. Spatial and temporal expression of short, long/medium, or both opsins in human fetal cones. J Comp Neurol. 2000;425:545–559. [PubMed] [Google Scholar]
- Xu XL, Fang Y, Lee TC, Forrest D, Gregory-Evans C, Almeida D, Liu A, Jhanwar SC, Abramson DH, Cobrinik D. Retinoblastoma has properties of a cone precursor tumor and depends upon cone-specific MDM2 signaling. Cell. 2009;137:1018–1031. doi: 10.1016/j.cell.2009.03.051. [DOI] [PMC free article] [PubMed] [Google Scholar]
- Young RW. Cell death during differentiation of the retina in the mouse. J Comp Neurol. 1984;229:362–373. doi: 10.1002/cne.902290307. [DOI] [PubMed] [Google Scholar]
Associated Data
This section collects any data citations, data availability statements, or supplementary materials included in this article.