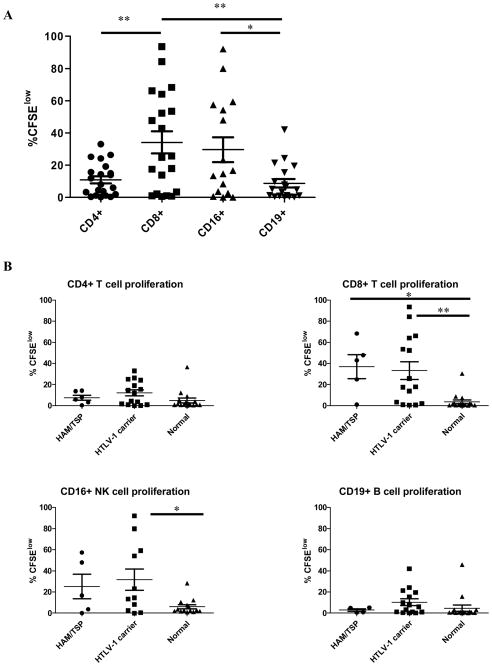
Figure 2. Spontaneous proliferation of PBMC subsets.
Proliferation was measured by CFSE dilution in cells cultured for seven days without exogenous stimulation. (A) Among HTLV-1 infected subjects CD8+ T cells and CD16+ NK cells showed the highest levels of spontaneous proliferation. (B) Spontaneous proliferation was measured in subjects with HAM/TSP (n=6), HTLV-1 carriers (n=15), and normal controls (n=16). A minimum of 30,000 live lymphocytes was collected for each subject, and cell subsets with at least 100 gated events were included for analysis of proliferation (%CFSElow). * p<0.05, ** p<0.01

