

Abstract
Understanding the evolutionary pathways to metastasis and resistance to immune checkpoint inhibitors (ICI) in melanoma is critical for improving outcomes. Here we present the most comprehensive intra-patient metastatic melanoma dataset assembled to date as part of the PEACE research autopsy programme, including 222 exome, 493 panel-sequenced, 161 RNA-seq, and 22 single-cell whole-genome sequencing samples from 14 ICI-treated patients. We observed frequent whole-genome doubling and widespread loss of heterozygosity, often involving antigen presentation machinery. We found KIT extrachromosomal DNA may have contributed to the lack of response to KIT inhibitors of a KIT-driven melanoma. At the lesion-level, MYC amplifications were enriched in ICI non-responders. Single-cell sequencing revealed polyclonal seeding of metastases originating from clones with different ploidy in one of the patients. Finally, we observed that brain metastases that diverged early in molecular evolution emerge late in disease. Overall, our study illustrates the diverse evolutionary landscape of advanced melanoma.
Introduction
In the last decade, treatment options for advanced melanoma have improved significantly (1,2). Most notable has been the development of immune checkpoint inhibitor (ICI) therapy, with reported 5-year overall survival of 52% in patients receiving combination PD1/CTLA4 blockade (3). Nonetheless, a large proportion of metastatic melanomas remain refractory to systemic therapy, highlighting the need to understand therapy failure. Studies focussing on cohort size rather than multi-tumour profiling provide a snapshot of the landscape of disease (4–6), but cannot adequately inform potential evolutionary trajectories in the progression to treatment resistance and death. Therefore, it is essential to complement these studies with in-depth sampling and analysis of the evolution of metastatic melanoma.
The research autopsy has emerged as a method to overcome the limitations of tumour sampling during life (7), with several examples in melanoma (8–11). However, various areas remain hitherto unexplored, including the genotype to phenotype link via the analysis of transcriptomic and radiological data; the application of an extensive multi-regional sampling design, shown to reveal subclones that are missed from single samples (12–14); as well as phylogenetic analyses that utilise clone-based trees rather than sample trees (15).
Another area of interest is the significance of copy number alterations in late-stage disease, ranging from focal somatic copy number alterations through arm-level changes to whole-genome duplications. Chromosomal instability is known to enhance metastatic potential, increasing somatic copy number alteration burden and fuelling natural selection (12,16); as well as supporting co-option of innate immune processes (17). Aneuploidy also correlates with reduced overall survival in anti-CTLA4 treated patients (18). Whole-genome doubling (WGD) is associated with poor prognosis in the pan-cancer setting (19) and has been reported in metastatic melanoma to varying degrees (6,11). In addition, mirrored subclonal allelic imbalance (MSAI), indicative of parallel evolution of copy number changes and ongoing chromosomal instability, is increased in WGD tumours (20). However, the degree to which WGD and chromosome instability are required for progression to late-stage disease remains unclear.
Here we present an in-depth analysis of late-stage metastatic melanoma in the first 14 patients recruited to the PEACE (Posthumous Evaluation of Advanced Cancer Environment, NCT03004755) study, with extensive multi-regional and multi-tumour sampling at autopsy (573 tumour samples in total). To address the gaps in knowledge discussed, we employ exome, transcriptome and high-depth panel sequencing data, radiological imaging, and single-cell whole-genome sequencing data. We find that whilst many late-stage melanomas exhibit WGD, this process does not appear to be required for late-stage disease. However, when WGD does occur, it is usually associated with widespread loss of heterozygosity. We also associate lesion-level immunotherapy responses to recurrent copy number changes, including MYC amplification and 1q gain. We identify polyclonal metastatic seeding in one patient through single-cell profiling, which was not identified solely from bulk sequencing data, indicating temporally separate waves of metastatic spread. In addition, we find that late-emerging brain metastases in this cohort often have distinct copy number profiles compared to other tissue sites, diverging early in the phylogenetic tree but emerging late in the clinical disease course, suggesting a period of dormancy. Lastly, we observe frequent losses of antigen-presentation genes, such as B2M and JAK2, but do not detect significant loss of neoantigens compared to non-synonymous mutations in general.
Results
Cohort overview
Our cohort comprises multiple melanoma subtypes, including cutaneous (7, CRUKP2986, CRUKP1842, CRUKP2567, CRUKP9097, CRUKP6216, CRUKP6746, CRUKP1599), acral (3, CRUKP9359, CRUKP2378, CRUKP1047), mucosal (1, CRUKP6170) and three melanomas of unknown primary site (MUP; 3; CRUKP1614, CRUKP6553, CRUKP5107) included in the PEACE study (Supplementary table 1). In total, 573 samples from 387 tumours across 14 patients were profiled using either a gene panel (493 samples; mean ± s.d. coverage 606.27x ± 71.75, range 375.61 – 1089.46; see methods for the panel design), whole-exome sequencing (WES) (222 samples; mean ± s.d. coverage 308.30x ± 122.58, range 46.76 – 1330.26), RNA sequencing (RNA-seq) (161 samples), or a combination of the three (Supplementary Fig. S1). These samples included normal and tumour tissue taken at autopsy with an emphasis on a comprehensive sampling of metastases in each patient (Supplementary table 2). In addition, archival formalin-fixed paraffin-embedded (FFPE) blocks from matched primary tumours and metastases surgically removed during life were also profiled when available. To assess intra-tumour heterogeneity, multi-regional samples were taken from individual metastases where possible (49/156 exome-profiled tumours; median of 2 samples per tumour, range 2–10). Patients received a median of 2.5 lines of treatment (range 1–6; Supplementary table 3). All patients received immune checkpoint inhibitors (ICI) during their disease course, with 9/14 treated with combination PD1 + CTLA4 blockade and five with single-agent ICIs. Eight patients were treated with MAPK targeting therapies, whilst one patient received two KIT inhibitors. Three patients were treated with chemotherapy, either temozolomide or dacarbazine in combination with a platinum agent.
We observe a wide range of total mutational burden (TMB) (figure 1a). At the patient level, TMB based on WES ranged from 2.44 to 156 mutations per Mb in cutaneous melanomas (mean ± s.d. 41.5 ± 55.1), 8.47 to 111 in MUPs (mean ± s.d. 42.8 ± 58.9), 1.11 to 6.79 in acral melanomas (mean ± s.d. 3.41 ± 2.99), and 2.18 in the mucosal melanoma, CRUKP6170. These data are consistent with prior reports (5) and reflect differing levels of mutagenic exposure between melanoma subtypes and patients, principally UV light and chemotherapy. As expected, we observed fewer indels compared to single nucleotide variants (mean ± s.d. 30.71 ± 17.95). All cases except for CRUKP6553 and CRUKP2378 had a recognized melanoma driver alteration in BRAF (V600 in 6 cases, non-V600 in 2), NRAS (3 cases) or KIT (1 case; detailed in figure 1a). Of interest, a cutaneous case (CRUKP1842) had a pathogenic germline mutation in CDKN2A (21), and had the lowest TMB of the sun-exposed cutaneous melanomas. In terms of somatic mutations, this patient had a clonal BRAF-V600 mutation (figure 1) with no additional mutations in other known drivers. This was accompanied by clonal LOH at the CDKN2A locus.
Figure 1.
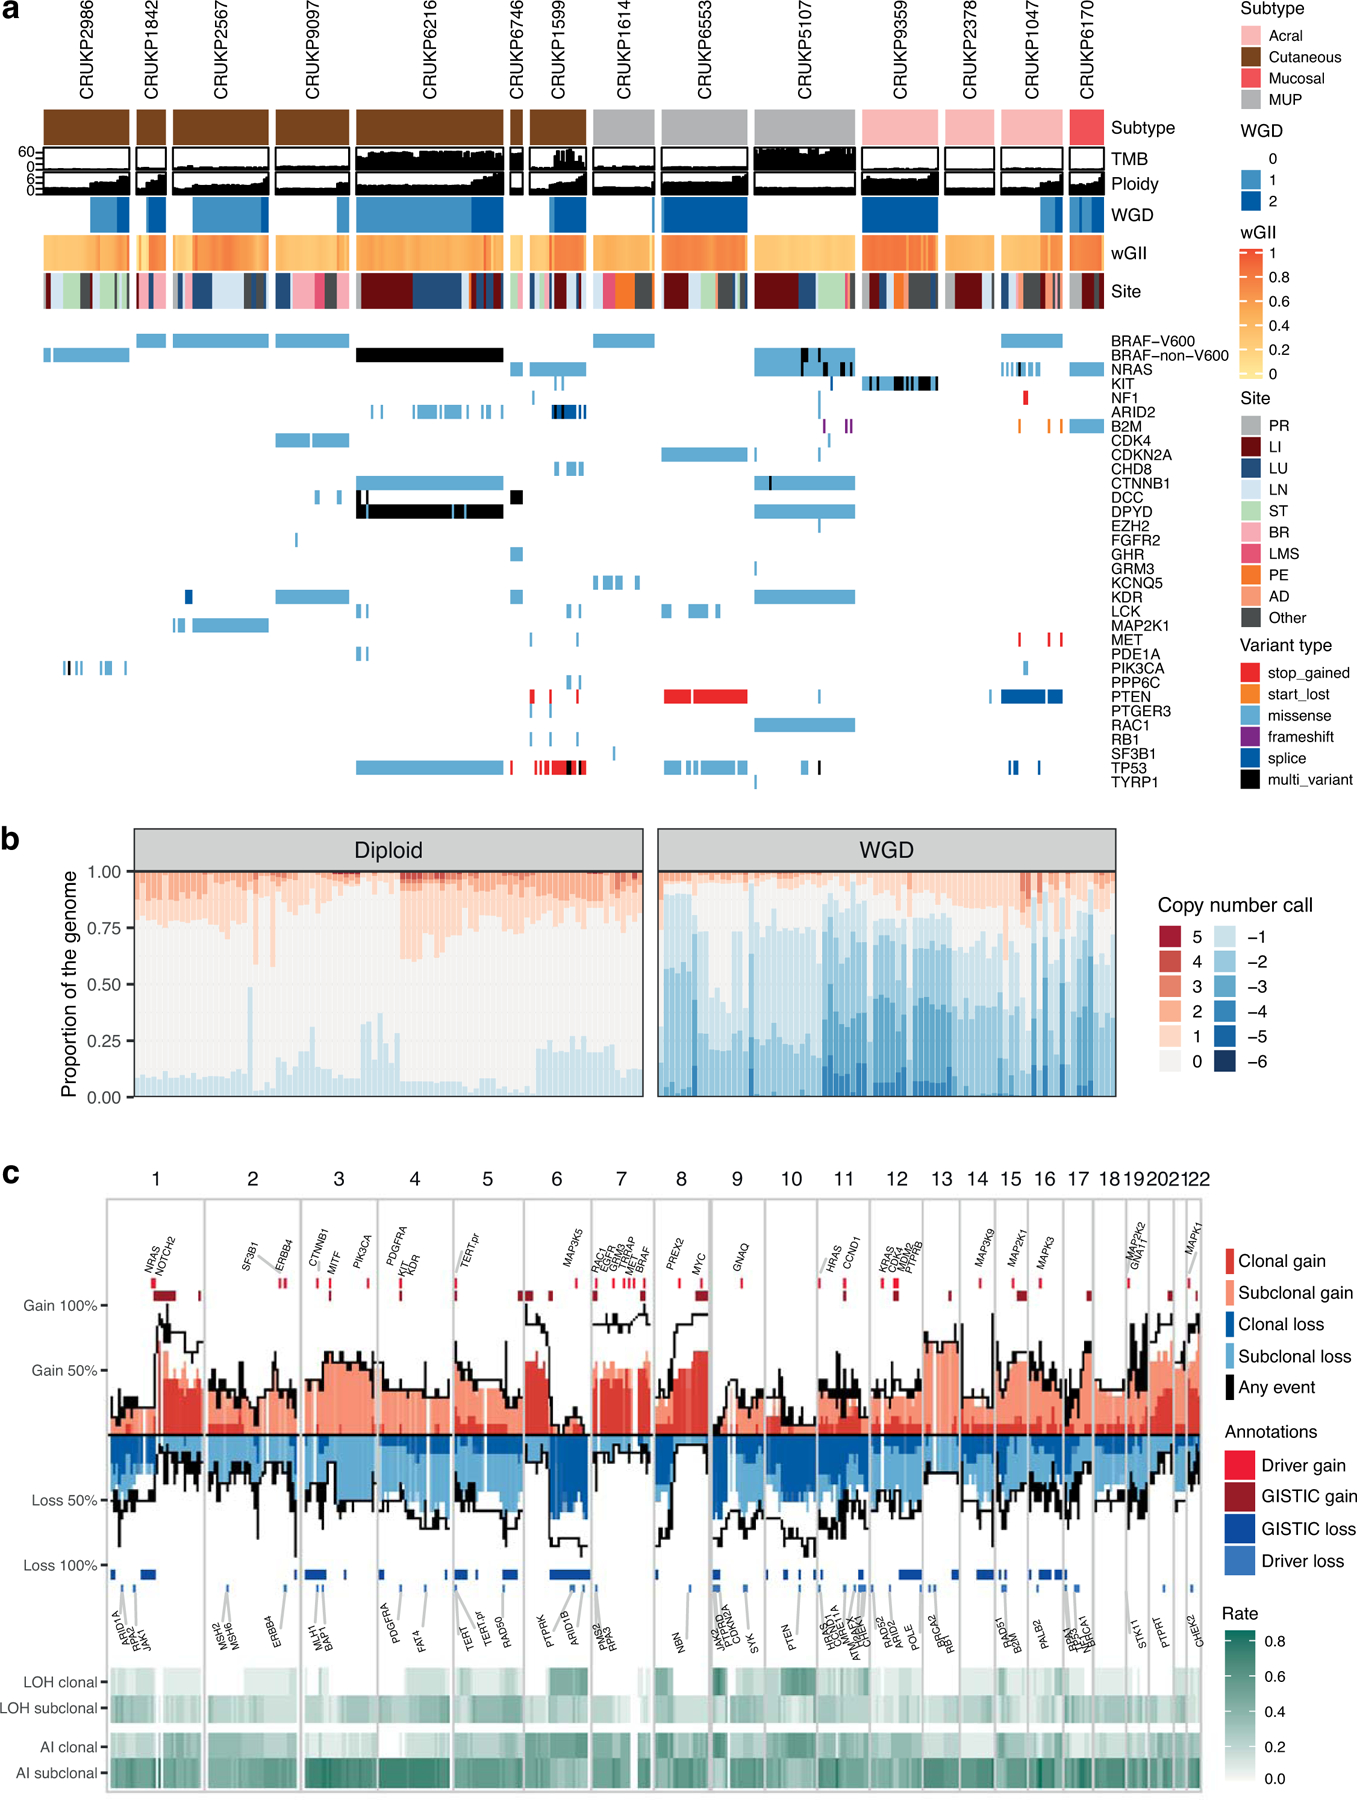
Driver mutations and SCNA overview. (a) Genomic landscape of the cohort, illustrating mutations in key melanoma driver genes, tumour mutational burden (TMB, total mutations/Mb), ploidy, whole-genome doubling status (WGD), weighted genome instability index (wGII, a SCNA burden metric) and the anatomical site of each sample. “Multi-variant” indicates the presence of more than one variant in the same gene within one sample. Panel and WES samples are included. (b) The proportion of the genome altered by copy number gains and losses per sample, in diploid and whole-genome doubled tumour samples. (c) The frequency of copy number gains and losses along the genome (based on WES data only). Dark red and blue indicate clonal events, light red and blue indicate subclonal events. Also shown are frequency of clonal and subclonal loss of heterozygosity (LOH) and allelic imbalance (AI).
Regarding somatic copy number alterations (SCNAs), we detected WGD in 11 cases (figure 1a), spanning all melanoma subtypes. We observed clonal WGD (WGD detectable in all the tumour samples in a given patient) in four cases (figure 1a). These mainly were single rounds of WGD except for CRUKP9359, where two rounds of clonal WGD were evident. By incorporating mutational timing we demonstrate instances of parallel WGD in distinct subclones of the same patient (CRUKP6216, CRUKP1599, CRUKP6553, CRUKP9359 and CRUKP1047), suggesting that WGD confers a selective advantage (example in Supplementary Fig. S2a–b). In contrast, most tumour regions in patients CRUKP2986, CRUKP9097 and CRUKP1614 were diploid, with subclonal WGD limited to a small number of tumour regions consistent with WGD appearing late in tumour evolution. An intermediate example is CRUKP2567, where WGD was detected in all the thoracic metastases but not in the brain metastasis (figure 1a). There was no significant association between the subtype of melanoma and the presence of WGD or clonal WGD, potentially limited by the size of the cohort (chi-squared tests p = 0.8 and p = 0.4, respectively).
In the context of WGD and increasing chromosome copies (ploidy), we observed significantly elevated weighted genome instability index (wGII, see Methods; R-squared = 0.6; p-value < 2.2e-16; Supplementary Fig. S3a–b), driven by copy number losses (figure 1b). The median ploidy of WGD tumours was 3.82. WGD was also associated with increased intra-patient heterogeneity of copy number alterations (subclonal wGII, the burden of copy number events not present in all tumours from a case; Wilcoxon test p = 0.006; Supplementary Fig. S3c). Regions with recurrent clonal loss of heterozygosity (LOH) were enriched in tumour suppressor genes (TSGs) (chi-squared test of genes with LOH in at least 3 patients vs other genes, P = 0.038), including 9p (CDKN2A) which we observed in 10/14 cases; 10q (PTEN) in nine cases and 6q (ARID1B) in six cases. In addition, eight cases had clonal LOH of 8p, although the selective drivers behind this event are unclear. Allelic imbalance (AI) was common (figure 1c), and subclonal AI was enriched in whole-genome doubled samples. At the gene level, the most common SCNA was amplification of BRAF, observed in 12/14 patients (clonal in 7 and subclonal in 5), including two cases without activating BRAF mutations (CRUKP6746 and CRUKP2378).
Tumour mutational signatures and evolutionary histories
Tumours exhibited a range of mutational signatures, reflecting melanoma subtype and/or chemotherapy exposure (figure 2a). In cutaneous melanoma, with the exception of a patient with a sun-protected peri-anal primary melanoma (CRUKP2986), most clonal mutations were attributed to mutational signature 7, associated with UV light exposure (22). Signature 7 was also dominant in all the cases of MUP, suggesting they arose from sun-exposed primary melanomas which subsequently regressed (23). As expected, the dominant signature in patients with acral and mucosal melanomas, was signature 1A, which is caused by deamination of 5-methylcytosine and correlates with age (24).
Figure 2.
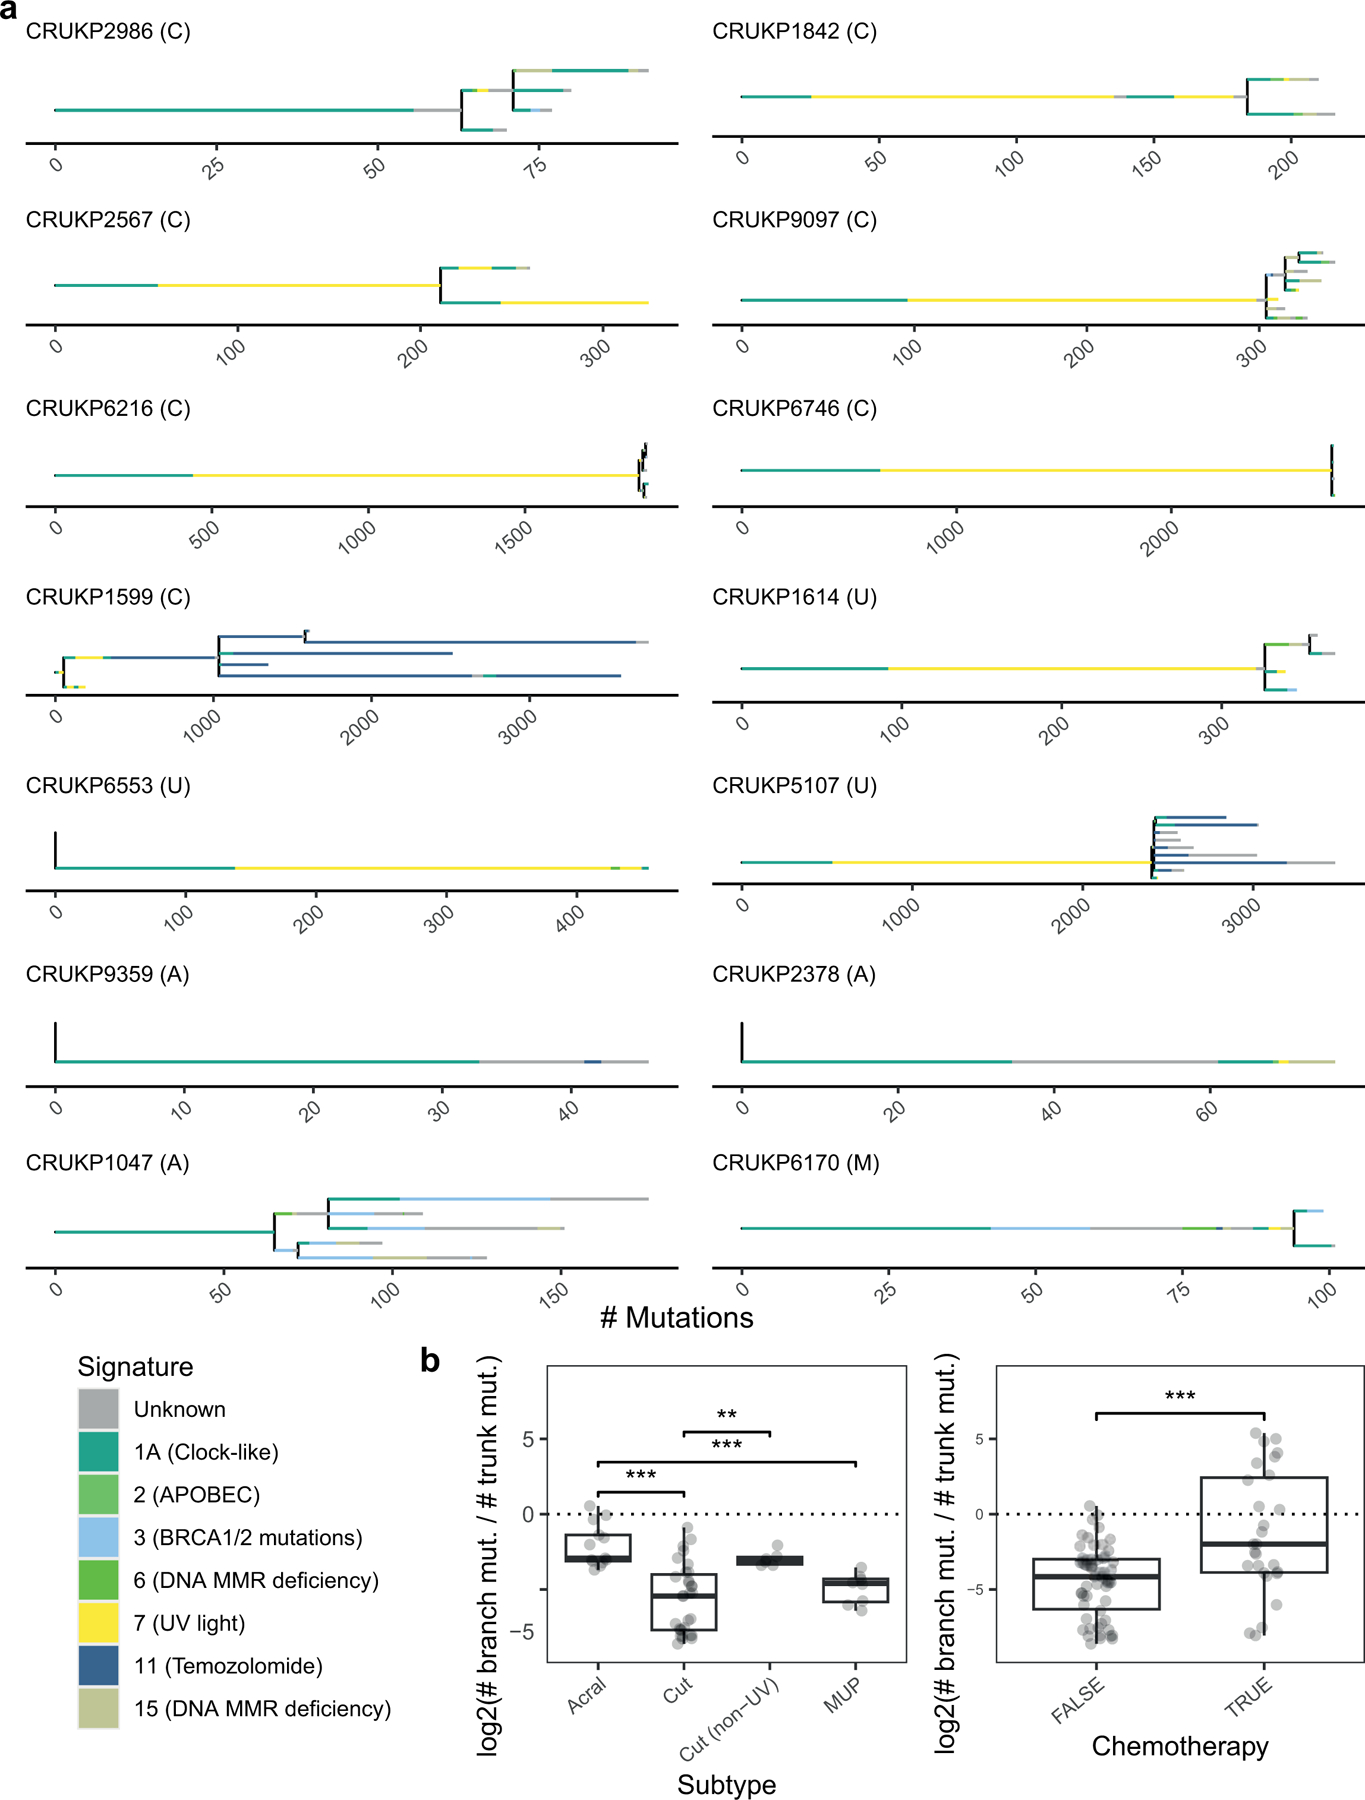
(a) Phylogenies inferred for the 14 patients. Only WES samples are included. Letters in brackets indicate melanoma subtype, C = Cutaneous, U = Melanoma of unknown primary, A = acral, M = mucosal. Branch length is proportional to the number of mutations. Branch colours represent the mutational signatures of the mutations. For clarity, only the most common mutational signatures are shown; the remainder are categorised as Unknown. Scale bars indicate the number of mutations. The legend includes etiologies for each signature (24). (b) Boxplots indicate the ratio of subclonal mutations (length of branches) to clonal mutations (length of the trunk) by subtype and chemotherapy status. Values smaller than zero indicate dominance of truncal mutations. Mann-Whitney U test used for statistical comparisons (** p < 0.01, *** p < 0.001).
To investigate the evolutionary trajectories of metastatic melanomas, we constructed clone-level phylogenies based on the single-nucleotide variants (SNVs) and small insertions or deletions (indels) identified in the WES data (see methods). We observed diverse phylogenetic structures in our cohort (figure 2a). CRUKP6553, CRUKP9359 and CRUKP2378 followed a linear evolutionary trajectory (25) with no apparent branching and a small number of subclones (ranging from 2 to 3). The pattern of metastatic seeding in these patients was monoclonal, i.e. all metastases were seeded by the same single clone (26). In contrast, CRUKP2986, CRUKP9097, CRUKP1599, CRUKP1614, CRUKP5107 and CRUKP1047 were characterised by branched phylogenies and multiple subclones (ranging from 7 to 13). The number of clones was not associated with the melanoma subtype.
We observed instances of polyclonal seeding, where genetically distinct clones in the primary tumour seeded different metastatic sites, in most patients (10 of the 14, see methods). For example, in CRUKP2567, the primary tumour was polyclonal, with subclones specific to brain and thoracic metastases. Finally we examined individual metastases for evidence of polyclonality, defined as the presence of clones from independent branches of the SNV/indel phylogeny (26). The majority of metastases appeared to be monoclonal at the SNV/indel level, consistent with an evolutionary bottle-neck during metastatic colonisation and absence of frequent cross-metastatic seeding in this cohort; some examples of polyclonal metastases were seen in pericardial, lung and brain metastases in CRUKP9097; lung metastases in CRUKP6216; a lymph node metastasis in CRUKP1599 and a soft tissue metastasis in CRUKP5107 (Supplementary Fig. S4).
Tumour mutational burden (TMB) was associated with the melanoma subtype and exposure to chemotherapy (figure 2b). Three patients received chemotherapy (either temozolomide or dacarbazine with cisplatin), of which two, CRUKP1599 and CRUKP5107, had increased subclonal TMB (as shown by branch lengths, figure 2a) characterised by mutational signature 11, linked to temozolomide exposure (22). We did not observe this mutational signature in the third patient treated with chemotherapy (CRUKP6170), potentially due to much shorter exposure immediately prior to death (two cycles, compared to >five cycles of chemotherapy in CRUKP1599 and CRUKP5107; Supplementary Table 3). We found clones shared by liver and lymph node metastases that were characterised by a chemotherapy signature in case CRUKP1599. We inferred these clones appeared after treatment initiation and are the result of inter-metastatic seeding (Supplementary Figure 4a–c).
To assess the patterns of evolution at the level of copy number, we used MEDICC2 (27) to build SCNA sample trees (Supplementary Fig. S5). SCNA-based trees were consistent with the SNV phylogenies in most cases, but in cases with linear SNV phylogeny (CRUKP6553, CRUKP9359 and CRUKP2378) they revealed SCNA-driven subclonal diversification (figure 2 and Supplementary Fig. S5). A cohort-level SCNA tree (Supplementary Fig. S6) demonstrated samples clustered by patient and not subtype, in agreement with the SCNA frequency along the genome being similar across melanoma subtypes (Supplementary Fig. S7a–c).
We next sought to examine whether the metastatic site influenced tumour SCNAs, either through shared ancestry of tumours within an organ or through convergent evolution of tumours within an organ due to selective pressure imposed by their shared environment. We observed that copy number profiles of individual metastatic tumours within the same metastatic site were clustered together in some cases (e.g. lung metastases in CRUKP1599; Supplementary Fig. S5), but not in others (e.g. liver metastases in CRUKP6216; Supplementary Fig. S5). In addition, we calculated the Fst (fixation index, commonly used in population genetics (28)) for each patient. A high Fst indicates SCNAs of tumours between metastatic sites are varied, while low Fst values indicate SCNAs of tumours vary within metastatic sites. In our cohort, the mean Fst was mostly explained by the number of metastatic sites and samples (as indicated by a linear model, R2 = 0.75, p-value = 6.8e-4), although the three MUP cases deviated more from the model suggesting greater organ-specific SCNA diversification.
To investigate parallel evolution of SCNAs we looked for evidence of mirrored subclonal allelic imbalance (MSAI, see methods), where the same SCNA event occurs more than once but involves different alleles. MSAI was common in our cohort, with at least one MSAI event observed in >95% of metastatic samples, and 20% of all AI events being mirrored. Notable was the absence of MSAI in chromosome 9, with independent subclonal LOH events always affecting the same allele even in patients without mutations in CDKN2A (CRUKP2986, CRUKP1599 and CRUKP1047). The other region with evidence of conserved allele-specific patterns of LOH was 17p, which harbours TP53. Although some losses occurred in samples with TP53 mutations, we also detected subclonal LOH of the same allele in patients without TP53 mutations (CRUKP2986 and CRUKP1842). A potential reason for these patterns is the fixation of a methylated allele with recurrent loss of the wild type allele.
Distinctive features of late-emerging brain metastases
We next considered genomic differences relative to the site of metastases. We observed the lowest burden of SCNAs, expressed as wGII, in brain metastases in this cohort (linear mixed-effects model p = 0.042; permutation test p = 0.009; figure 3a). Clones seeding the brain often diverged early in SNV and SCNA trees (Supplementary Fig. S5 and S6), with brain metastases emerging late in the clinical course of metastatic disease. Overall the correlation between early evolutionary divergence and late clinical emergence of brain metastases was consistent across patients (R = 0.86, P = 0.026; figure 3b), and particularly apparent in CRUKP1614 and CRUKP5107. Our observations are consistent with the scenario where the clone seeding the brain is characterised by lower fitness due to lower SCNA burden, and results in later emergence of detectable metastasis. In support of the latter notion, the transcriptomic data showed downregulation of DNA replication in the brain compared to thoracic disease (q-value = 5.23e-6). We found further support for this hypothesis in the case of patient CRUKP5107 who was treated with six cycles of cisplatin and dacarbazine (figure 3c). The chemotherapy mutational signature was absent only from brain metastasis (24) which was characterised by early clonal divergence and late presentation relative to other metastatic sites (figure 3d–f).
Figure 3.
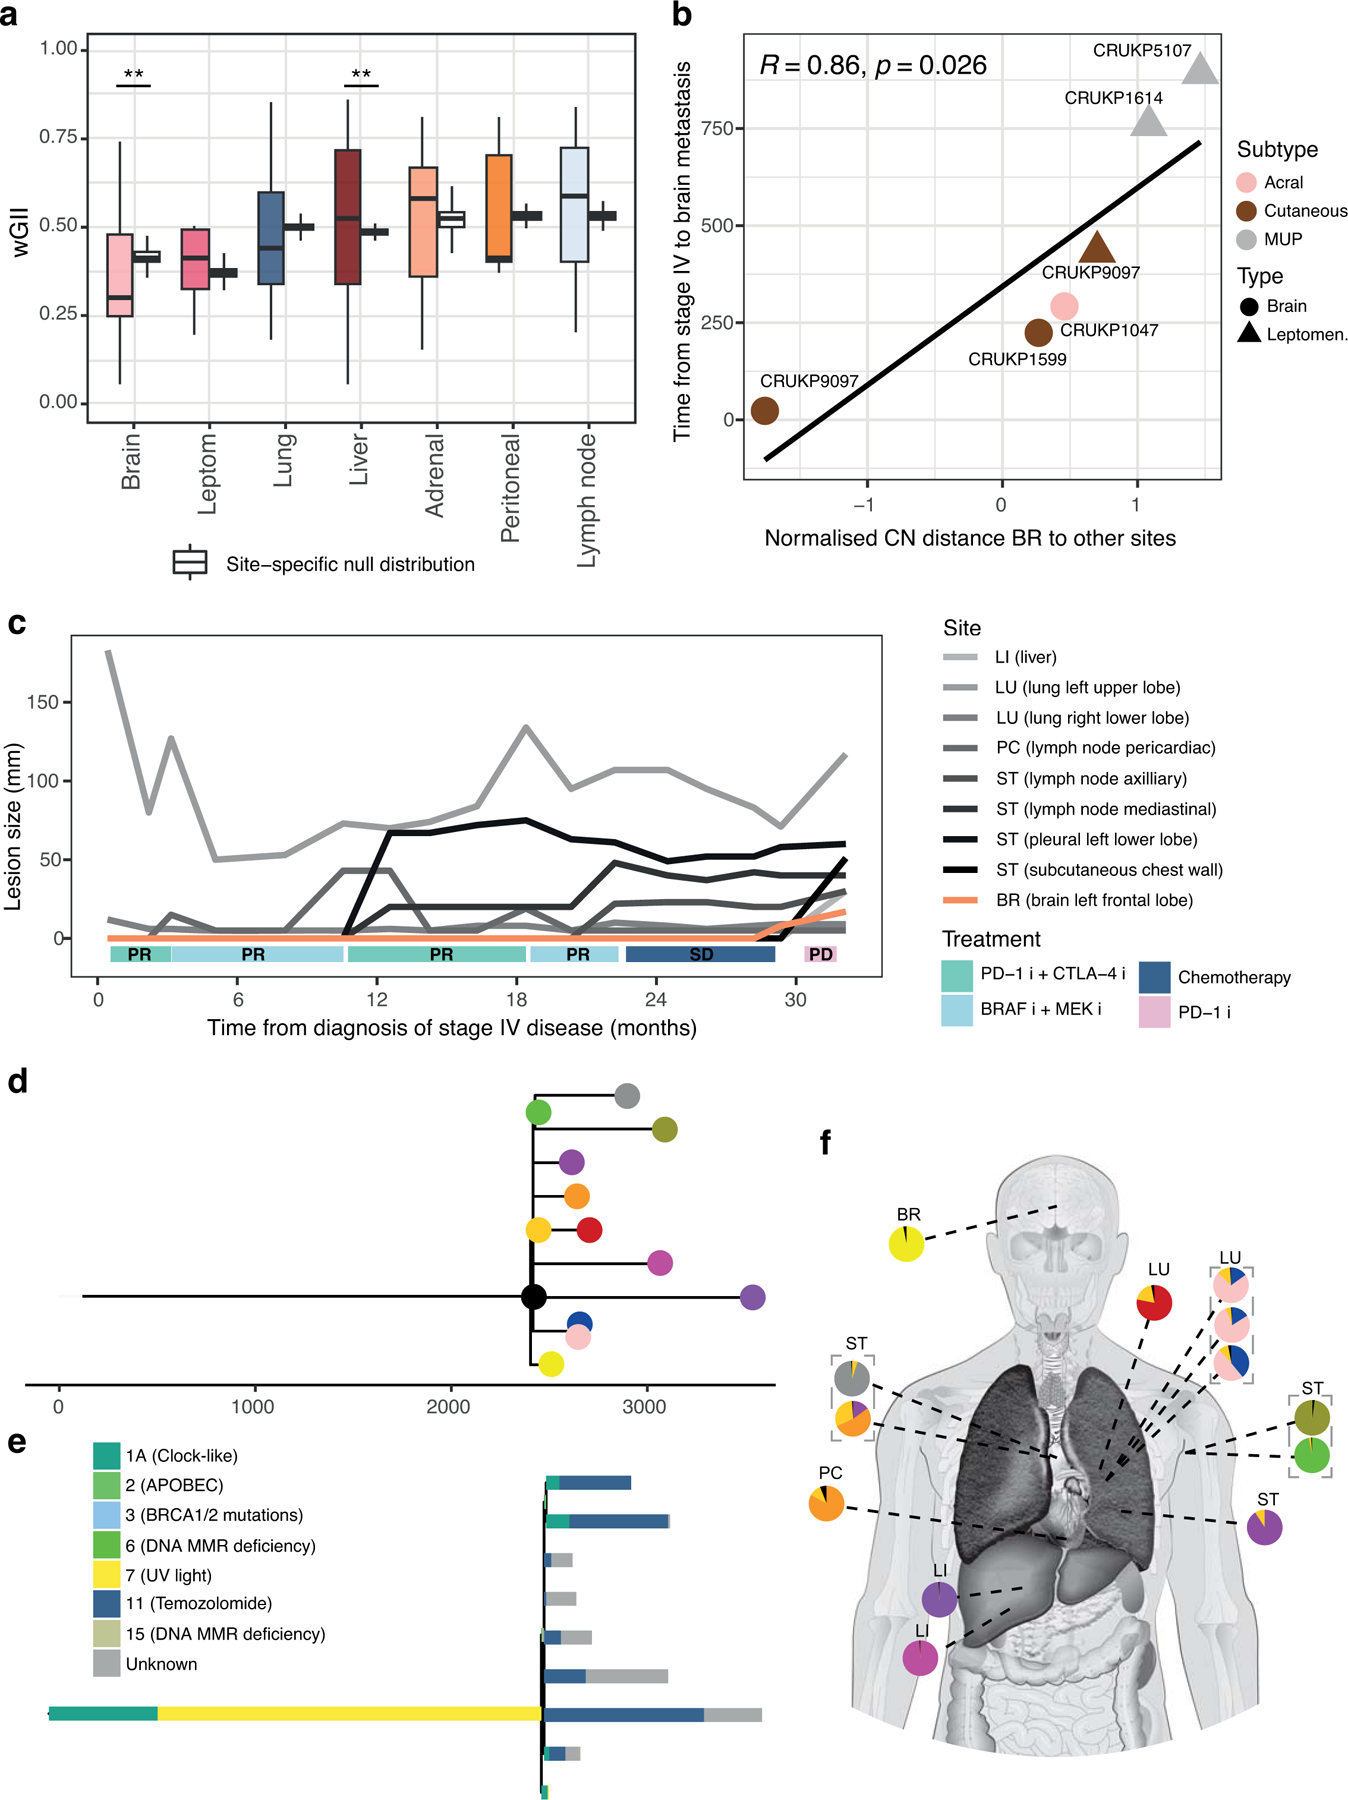
Late-emerging brain metastases have a lower CN burden. (a) Weighted genome instability index (wGII) per metastatic site. Site-specific null distributions of mean wGII were generated by randomising sample sets (from any metastatic site), while keeping patient contributions constant (see Methods). (b) Correlation between brain copy number distance to other sites and time of emergence of brain metastases after stage IV diagnosis in days. (c) Growth dynamics of tumours in patient CRUKP5107. The brain lesion (in orange) was only detected in the last two scans after the targeted therapy (BRAF inhibitor (i) + MEK i), ICI (PD-1 i + CTLA-4 i) and chemotherapy courses. (d) SNV and indel phylogenetic tree of tumour clones in patient CRUKP5107. (e) The mutational signature contributions to each clone in the phylogeny in d is shown. (f) The anatomical distribution of clones. Each pie chart represents a sample with its clonal composition indicated by the colours. A multi-regional sampling of the same tumour is indicated by the grey dashed lines. BR: brain, LU: lung, PC: pericardium, LI: liver, ST: soft tissue.
In contrast, liver metastases harboured a numerically higher burden of SCNAs relative to other sites, although these results did not reach statistical significance (permutation test P = 0.003; mixed-effects model P = 0.38). Liver metastases with a larger evolutionary divergence had a non-significant trend towards emerging earlier in the disease course (SCNA distance to other metastases vs time of emergence R = −0.27, P = 0.52, Supplementary Fig. S8). Our observations are consistent with the typically aggressive clinical behaviour of melanoma liver metastases including reduced sensitivity to ICIs (29).
Melanomas develop resistance to therapy via mutational and copy number mechanisms
Most patients treated with MAPK targeted therapy experience resistance following an initial response, with median progression-free survival of 9.3 months for dabrafenib and trametinib (30). In our cohort we observe a number of previously described mechanisms of resistance that converge on reactivation of the MAPK pathway (31), including NRAS mutations (in CRUKP1047 and CRUKP5107), parallel evolution of distinct subclonal NRAS mutations (Q61H and G13R in CRUKP5107), and a MAP2K1 mutation (in CRUKP2567) (figure 1a).
One case of a KIT mutant melanoma (CRUKP9359, clonal V650A), also harboured an extreme clonal copy number amplification at the KIT-encoding locus, with corresponding elevated KIT expression (figure 4a). Single cell sequencing of a representative metastasis revealed cell-level KIT copy number of 43–134 (figure 4b, right), a range reported in the context of ecDNA (32). We observed split sequencing reads in the single-cell pseudo bulk,, suggestive of ecDNA (figure 4c). We sought to further validate this by fluorescence in situ hybridization (FISH), and observed a large number of KIT copies co-localizing with DAPI-stained nuclear DNA in this case (figure 4d). Through hierarchical clustering of the single cell level SCNAs (excluding KIT) we observed evidence of random segregation of ecDNA which is consistent with this wide range of copy number (figure 4b, left). We note that this patient was treated with two consecutive KIT inhibitors and the extrachromosomal amplification of the drug target may have contributed to the lack of response to these agents.
Figure 4.
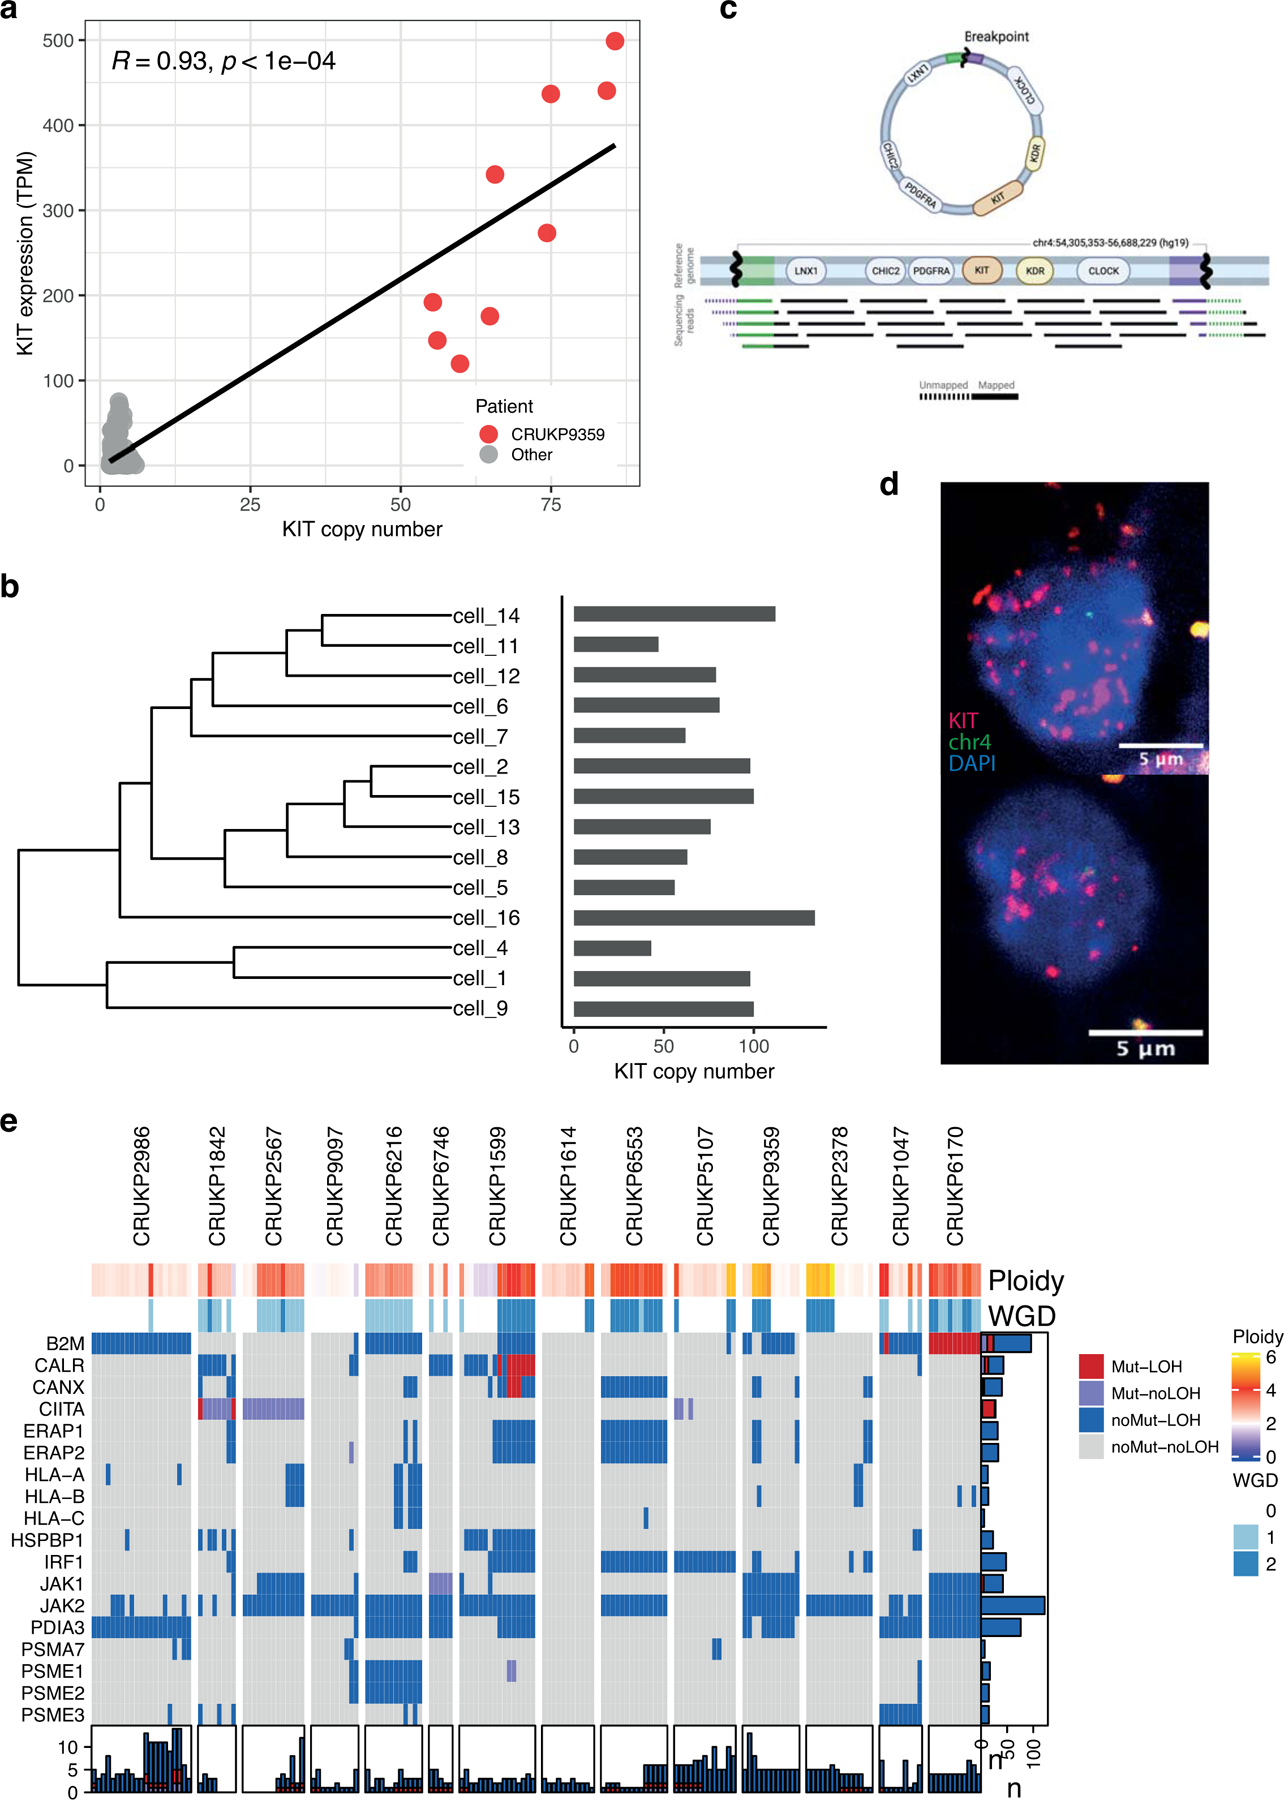
Mechanisms of resistance to therapy. (a) KIT copy number versus KIT expression in matching exome and RNA-seq samples. (b) Diagram of split reads mapping at the edges of the amplified region, from which a circular structure can be inferred. Created with BioRender.com. (c) Hierarchical clustering tree of SCNAs found in the single cells of a representative sample of CRUKP9359. Bars on the right show the copy number of KIT in each cell. (d) Images showing FISH probes against KIT (red) in individual cells. (e) Heatmap of alterations in antigen presentation genes in the exome data. Each column represents a sample. Loss of heterozygosity (LOH) events are shown in red and blue and non-synonymous mutations in red and purple. Bars on the X-axis show the number of genes altered in each sample while Y-axis bars show the number of samples altered per gene, coloured by the type of event.
All patients in this cohort received ICIs (either as single-agent (PD1 or CTLA4 inhibitors) or in combination (PD1 and CTLA4 inhibitors)) and exhibited either primary or acquired resistance to therapy, and all were ICI-refractory at the time of death and tumour sampling. Across the cohort we observed alterations in the known drivers of ICI resistance (33) including LOH in JAK2 in 12 patients and LOH in B2M in eight patients (figure 4e). The rate of LOH at these sites was higher than expected by chance for JAK2 (permutation test; p < 0.005) though not reaching significance for B2M (permutation test; p = 0.09). We additionally observed clonal mutations in JAK1 (p.S961L) in CRUKP6746 and in B2M (p.R101P) with accompanying LOH in CRUKP6170 (figure 4e). We found similar levels of HLA-LOH (5% subclonal) to those previously reported for metastatic melanoma (3% subclonal; (20)) and there was no enrichment for LOH in the region encoding HLA genes (figure 4e; (34)). We did not observe any mutations in HLA genes.
Previous work (35–37) has demonstrated within-patient heterogeneity between tumours in terms of acquired mechanisms of resistance to targeted MAPK pathway inhibition therapies. This is likely due to the stochastic nature of mutational processes between tumours, with selection acting on the first viable mechanism that arises in each tumour. We sought to examine whether this was also the case for the putative mechanisms of ICI resistance identified in our cohort, and also whether tumour site influenced these mechanisms. Hierarchical clustering of tumours by antigen-presentation machinery alterations (as in figure 4e), revealed that tumours for the most part cluster by patient rather than site (Supplementary Fig. S9). In addition, many tumours have clonally identical antigen-presentation alteration profiles within patients (figure 4e; Supplementary Fig. S9).
Genomic regions subject to copy number loss in our cohort overlapped with those previously associated with ICI resistance (38,39; Wilcoxon test p < 2.2e-16; Supplementary Fig. S10). Genes encoded by these regions were lost more often than expected in both cutaneous and acral melanomas (60.93% and 81.62% of genes respectively; permutation tests, p < 0.05), including PTEN, previously linked to immune evasion in melanoma (40).
We next looked for evidence of immunoediting, i.e. copy number losses at loci encoding neoantigens, a reported mechanism of immune evasion under ICI (41), but we observed no significant bias in favour of predicted neoantigen loss compared to nonsynonymous mutations across the cohort (Fisher’s exact test). Relatedly, we looked for evidence of downregulation in the expression of neoantigens using a binary classification of expression as in 42, first for clonal neoantigens and then for all neoantigens (clonal and subclonal). This association was significant in several patients, indicating downregulation of neoantigens in patients CRUKP2986, CRUKP6746 and CRUKP1599, which did not appear to be influenced by gene copy number dosage (Supplementary Fig. S11). However, patients CRUKP5107 and CRUKP9097 had contrasting relationships, with non-neoantigenic nonsynonymous mutations being downregulated over neoantigens. Only one of these (CRUKP5107) appeared to be influenced by gene dosage. Expanding the analysis to all neoantigens (clonal and subclonal), CRUKP2986, CRUKP1599 and CRUKP6553 had significant downregulation of neoantigens compared to non-neoantigenic nonsynonymous mutations, whereas CRUKP5107 and CRUKP9359 had the opposite relationship. Whilst histologically, tumour infiltrating lymphocyte scores were generally low at the time of post-mortem sampling (Supplementary Fig. S12–S13), these significant associations suggest that at some point, immune infiltration had caused immunoediting.
Identifying factors influencing lesion-specific response
Dynamics of response to ICI are varied and include mixed responses, where some tumours are regressing and others progressing (43). Given the diverse clonal evolutionary trajectories both within and between patients (figure 2a), including differential WGD status (figure 5a) and significantly increasing wGII with increasing WGD (figure 5b), we hypothesised that site-level responses to treatment might vary between lesions depending on their genetic constitution, whether in terms of genotype or copy number alteration. To assess this, we matched radiological response data based on RECIST criteria to panel sequencing data for each tumour, yielding an available dataset of 32 tumours from 7 patients (mean ± s.d. 4.6 ± 3.3 tumours per patient, Supplementary Table 4). This limited subset can be attributed to the selection of patients who had ICI therapy as their last line of treatment before death, as well as our multi-regional sampling design, as response data was at the lesion level. We performed a permutation-based GISTIC test to find regions that underwent significant copy-number alteration in responding vs non-responding lesions.
Figure 5.
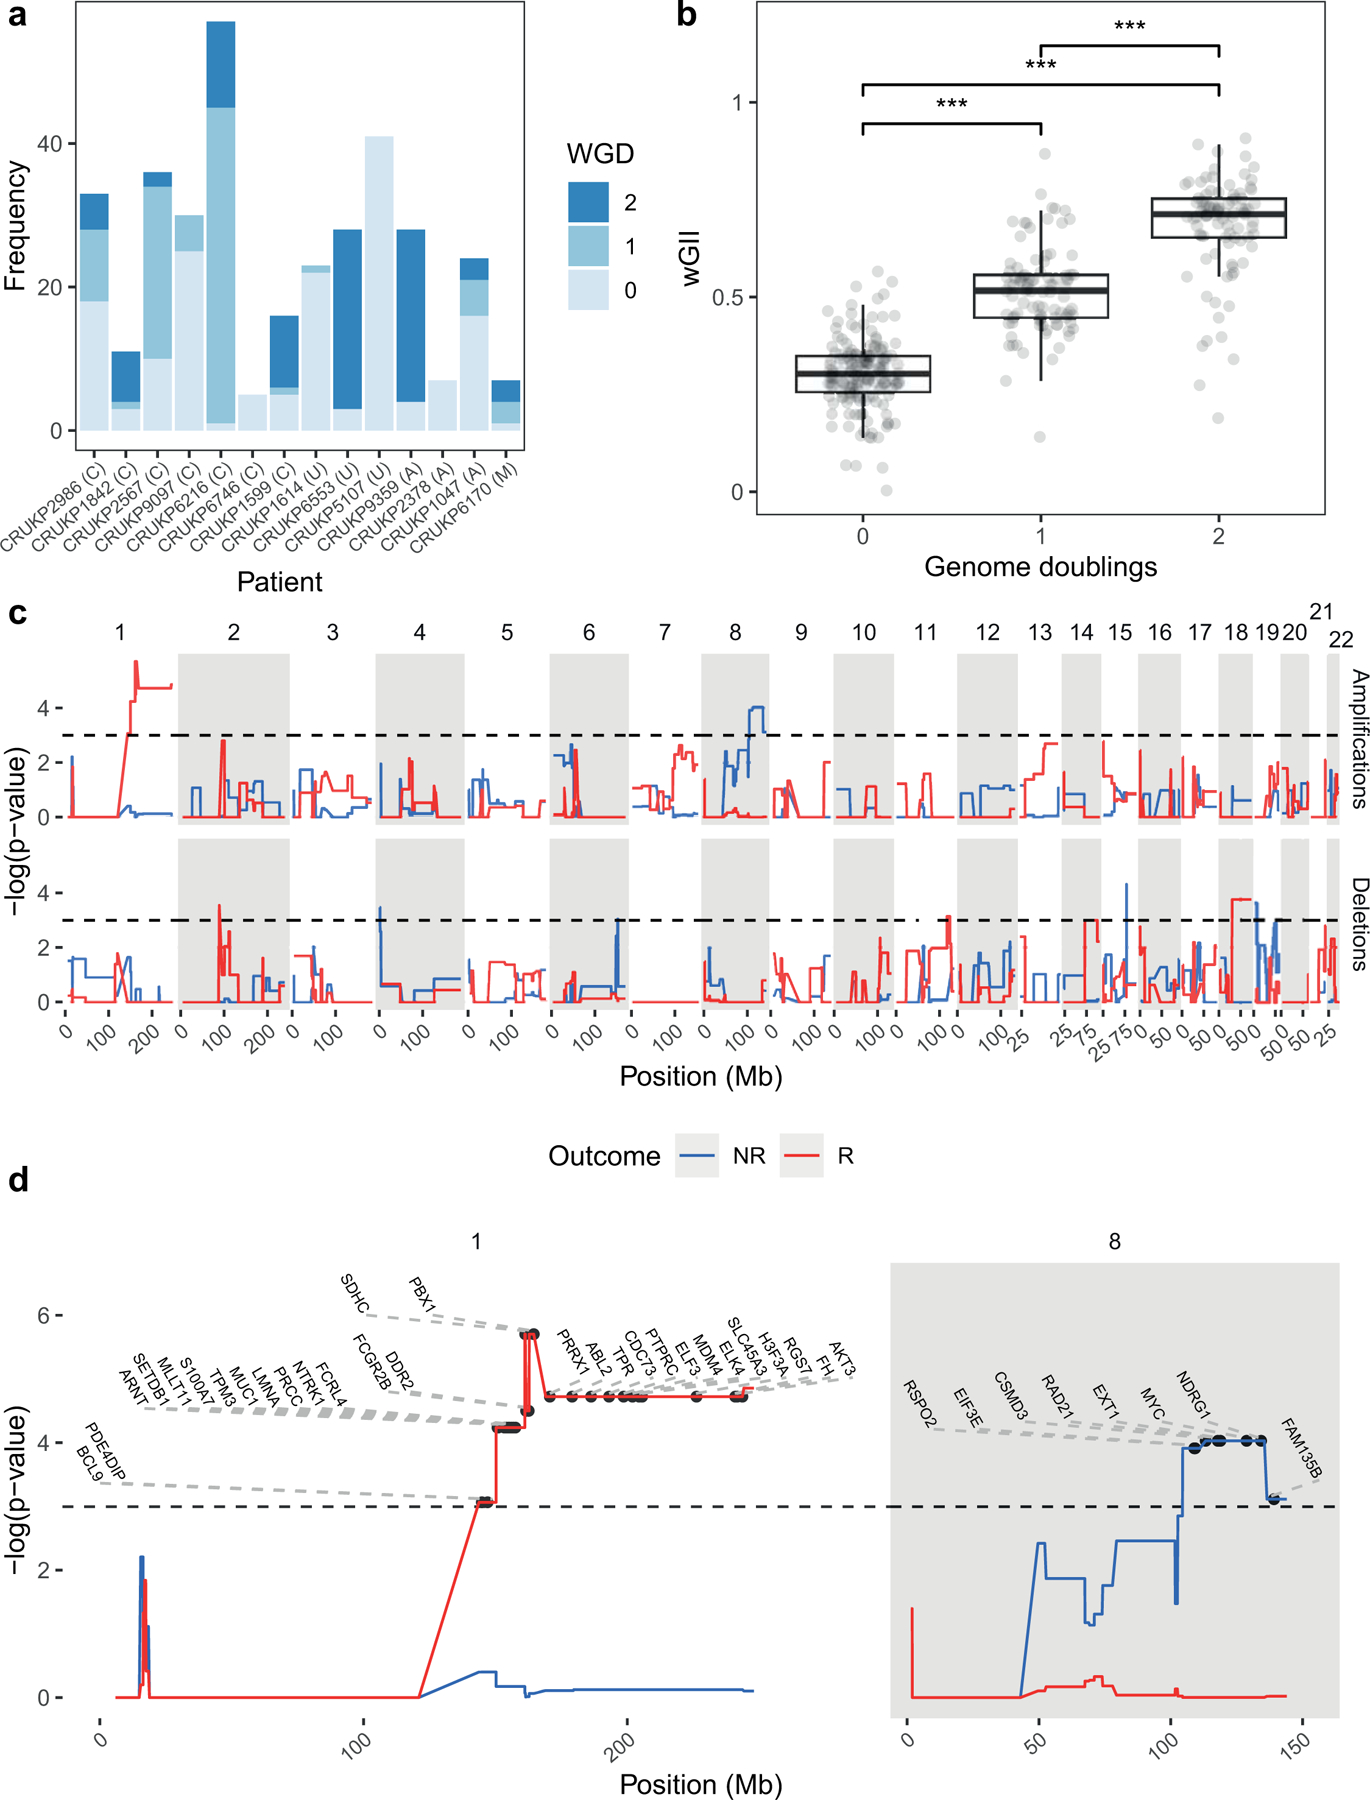
Tissue-level amplifications and deletions associated with response to ICI. A large proportion of samples underwent whole-genome doubling (a), with successive WGD events associated with increasing wGII (b). GISTIC permutation analysis (c) associated MYC amplification (chromosome 8q) with a non-responsive phenotype, as well as chromosome 1 amplification with a responsive phenotype. Horizontal black dashed lines in top two panels of (c) indicate significance (p < 0.05). (d) Significant amplifications on chromosomes 1 and 8 from (c) with COSMIC genes labelled. R = Response, NR = Non-response, wGII = Weighted genome instability index. Letters in brackets indicate melanoma subtype, C = Cutaneous, U = Melanoma of unknown primary, A = acral, M = mucosal.
Interestingly, copy number gains of chromosome 8q containing COSMIC genes RSPO2, EIF3E, CSMD3, RAD21, EXT1, MYC, NDRG1 and FAM135B, were significantly associated with lack of response at lesion-level (figure 5c–d). MYC has previously been shown to promote an immune-suppressive stroma via cooperation with Ras (44). These results indicate that MYC may also be a marker of ICI resistance in metastatic melanoma. Conversely, a focal region on chromosome 1 (figure 5d), was significantly amplified in lesions that responded to ICI. Also of interest was the 9p21 locus (45,46), which contains the prominent tumour suppressor CDKN2A, MTAP, as well as a cluster of IFN genes and has been linked to ICI resistance in pan-tumour studies (47). Loss of 9p21 was numerically more frequent in lesions with a lack of response, although this failed to reach significance in a Fisher’s exact test (p = 0.08). We also tested other loci commonly associated with therapeutic resistance in melanoma for an association between copy number alterations and lesion-level response, including BRAF, PTEN and TP53, however these were all non-significant.
Transcriptional alterations associated with late-stage melanoma
To gain insight into the transcriptional changes associated with late-stage disease we performed RNA-seq on bulk tumour samples. Tumour transcriptional profiles clustered first by patient, then by tissue-site, indicating that tumour-specific factors determine expression profile over the location of the tumour in the body. Mean purity of samples for which RNA-seq was performed was 0.72 (Supplementary Fig. S14). Differential expression analyses between tumour and normal tissue revealed the MYC targets V2 hallmark geneset as most significantly upregulated in tumour samples (q-value < 0.0001; Supplementary Table 5–6). Other significantly upregulated gene sets in tumour samples include those associated with cell division: G2M checkpoint (q-value < 0.001), E2F targets (q-value < 0.001) and mitotic spindle (q-value < 0.01).
We also investigated whether increases in ploidy were associated with transcriptional changes. Differential expression analyses revealed that hallmark genesets Mitotic Spindle (q-value < 0.005) and G2M Checkpoint (q-value < 0.05) were significantly upregulated with increasing ploidy, although for Mitotic Spindle, purity was also a significant factor (q-value < 0.01).
To assess the composition of immune cells present in tumour samples we applied consensusTME (48) to the transcriptional data from our cohort together with TCGA melanoma samples. Mean normalised enrichment scores (NES) were mostly negative for all cell types and lower than in the TCGA samples (Supplementary Fig. S15A), while treated TCGA samples showed intermediate immune scores (Supplementary Fig. S15B). Tumour Immune Dysfunction and Exclusion (TIDE) scores (49) predicted more than 98% of our samples as non-responders to ICI. Specifically, our cohort had positive immune exclusion and negative immune dysfunction scores, in agreement with the cold microenvironment observed histologically (most samples had minimal tumour infiltrating lymphocytes, Supplementary Fig. S12). We did however observe positive NES for M2 macrophages in 29.2% of samples across 11/14 patients, which are known to promote tumorigenesis (50), although it should be noted macrophage classification is more complex than the M1/M2 paradigm (51). We hypothesised that as MYC promotes macrophage recruitment through emission of the CCL9 chemokine (44), that MYC copy number amplification might be associated with M2 NES score. This association was however non-significant using both raw and purity-corrected consensusTME NES scores (Pearson correlation). Further comparison between M2 NES and ploidy was also non-significant.
A comparison of brain and extracranial metastases revealed no significant differences in immune infiltration, exclusion and dysfunction scores. However, we observed higher scores of melanocytic plasticity signature (MPS; 52) in brain metastases (Mann–Whitney U test p-value=0.00014), suggesting a less differentiated phenotype (Supplementary Fig. S16A). We further evaluated the effect of the metastatic site on pathways found to be differentially expressed in brain metastases in previous studies (53–58). No difference in the expression of OXPHOS genes across sites was found when controlling for purity, although brain metastases were significantly associated with the enrichment of the biosynthesis of unsaturated fatty acids (Supplementary Fig. S16B).
Another question of interest was the influence of local copy number changes on transcription, either of local genes, or genes at other loci via transcription factors. In a pairwise analysis of all genes, the most significant correlation was a self-association involving PHF3 on chromosome 6 (Supplementary Fig. S17). Patient CRUKP2986 had a clonal, focal copy number increase from a copy number of 2 to 15 at this locus, with corresponding increases in expression compared to other patients, suggesting that this change was under selection. PHF3 has been associated with a variety of functions, including UV-Induced DNA damage response (59) and neuronal differentiation (60). PHF3 is also significantly amplified in the TCGA cutaneous melanoma cohort. Interestingly, CRUKP2986 was a case of a non-UV-exposed melanoma, suggesting a potential alternative function for PHF3 here.
To assess the potential impact of chromosomal rearrangements on protein coding genes, we inferred putative gene fusions from the RNA-seq data. We found a mean of 10 gene fusions per patient (range 2–20), 90.8% of which were subclonal. In seven cases the fusions involved an oncogene or tumour suppressor gene, although we observed no BRAF fusions in this cohort (Supplementary Fig. S18a–b).
Investigating copy number changes at single-cell resolution
In our analysis of ploidy by FISH, we often observed cell to cell variation in ploidy within the same tumour sample (Supplementary Fig. S19). To investigate this further we used a single-cell whole genome sequencing approach (scWGS). Importantly, our particular method did not include a whole-genome preamplification step, allowing reliable generation of high-resolution single cell copy number profiles (61). We performed scWGS in one metastatic tumour from each case (n = 50 cells per sample) and included four normal samples as a control.
Overall, the inferred mean ploidies from the scWGS data were largely concordant with our estimates using bulk sequencing and FISH (Supplementary Fig. S20), suggesting most cells in the sample were a part of the same clonal expansion. In three patients, CRUKP2567, CRUKP1614 and CRUKP9359, (bulk-sequencing-estimated ploidies of 3n, 2n and 5n respectively) we identified two distinct populations (i.e. low and high ploidy) via fluorescence-activated cell sorting (FACS, Supplementary Fig. S21) and performed scWGS on both. The lower ploidy samples in CRUKP1614 and CRUKP9359 did not contain cancerous cells (Supplementary Fig. S22), as indicated by their low wGII values, suggesting homogenous ploidy in these metastases.
CRUKP2567 on the other hand was exceptional (clonal phylogeny shown in figure 6a), in that the lower ploidy population in the diaphragmatic metastasis (figure 6b) was reflective of malignant cells, indicated by their high wGII values. Further inspection of the bulk sequencing copy number tree for this patient revealed a WGD event in the branch leading to the majority of metastases, but not detected in the primary tumour or brain metastasis (figure 6c). Specifically, in the bulk copy number profile primary sample (ploidy ~ 2), we observe five copies (5n) of chromosome 5p (Supplementary Fig. 23a), which rises to 7n in the WGD diaphragmatic metastasis (ploidy ~ 3). In the single cell copy number profile of the diaphragmatic metastasis we observe both cells with 7n (from the high-ploidy FACs sorted population), and cells with 4–5n (from the lower ploidy FACs sorted population with ploidies ranging from 1 to 2, supp. figure 23b). Overall, this suggests the presence of two co-existing clones in the diaphragmatic metastasis, one WGD and one non-WGD clone. To assess this further, we performed hierarchical clustering of copy number profiles from the bulk samples and non-normal single cells from this patient (figure 6d). The resulting tree contained two primary clusters, one containing the bulk samples that had undergone WGD as well as the high-ploidy FACs-sorted single cells, and the other containing the bulk samples lacking WGD as well as the low-ploidy FACs-sorted single cells.
Figure 6.
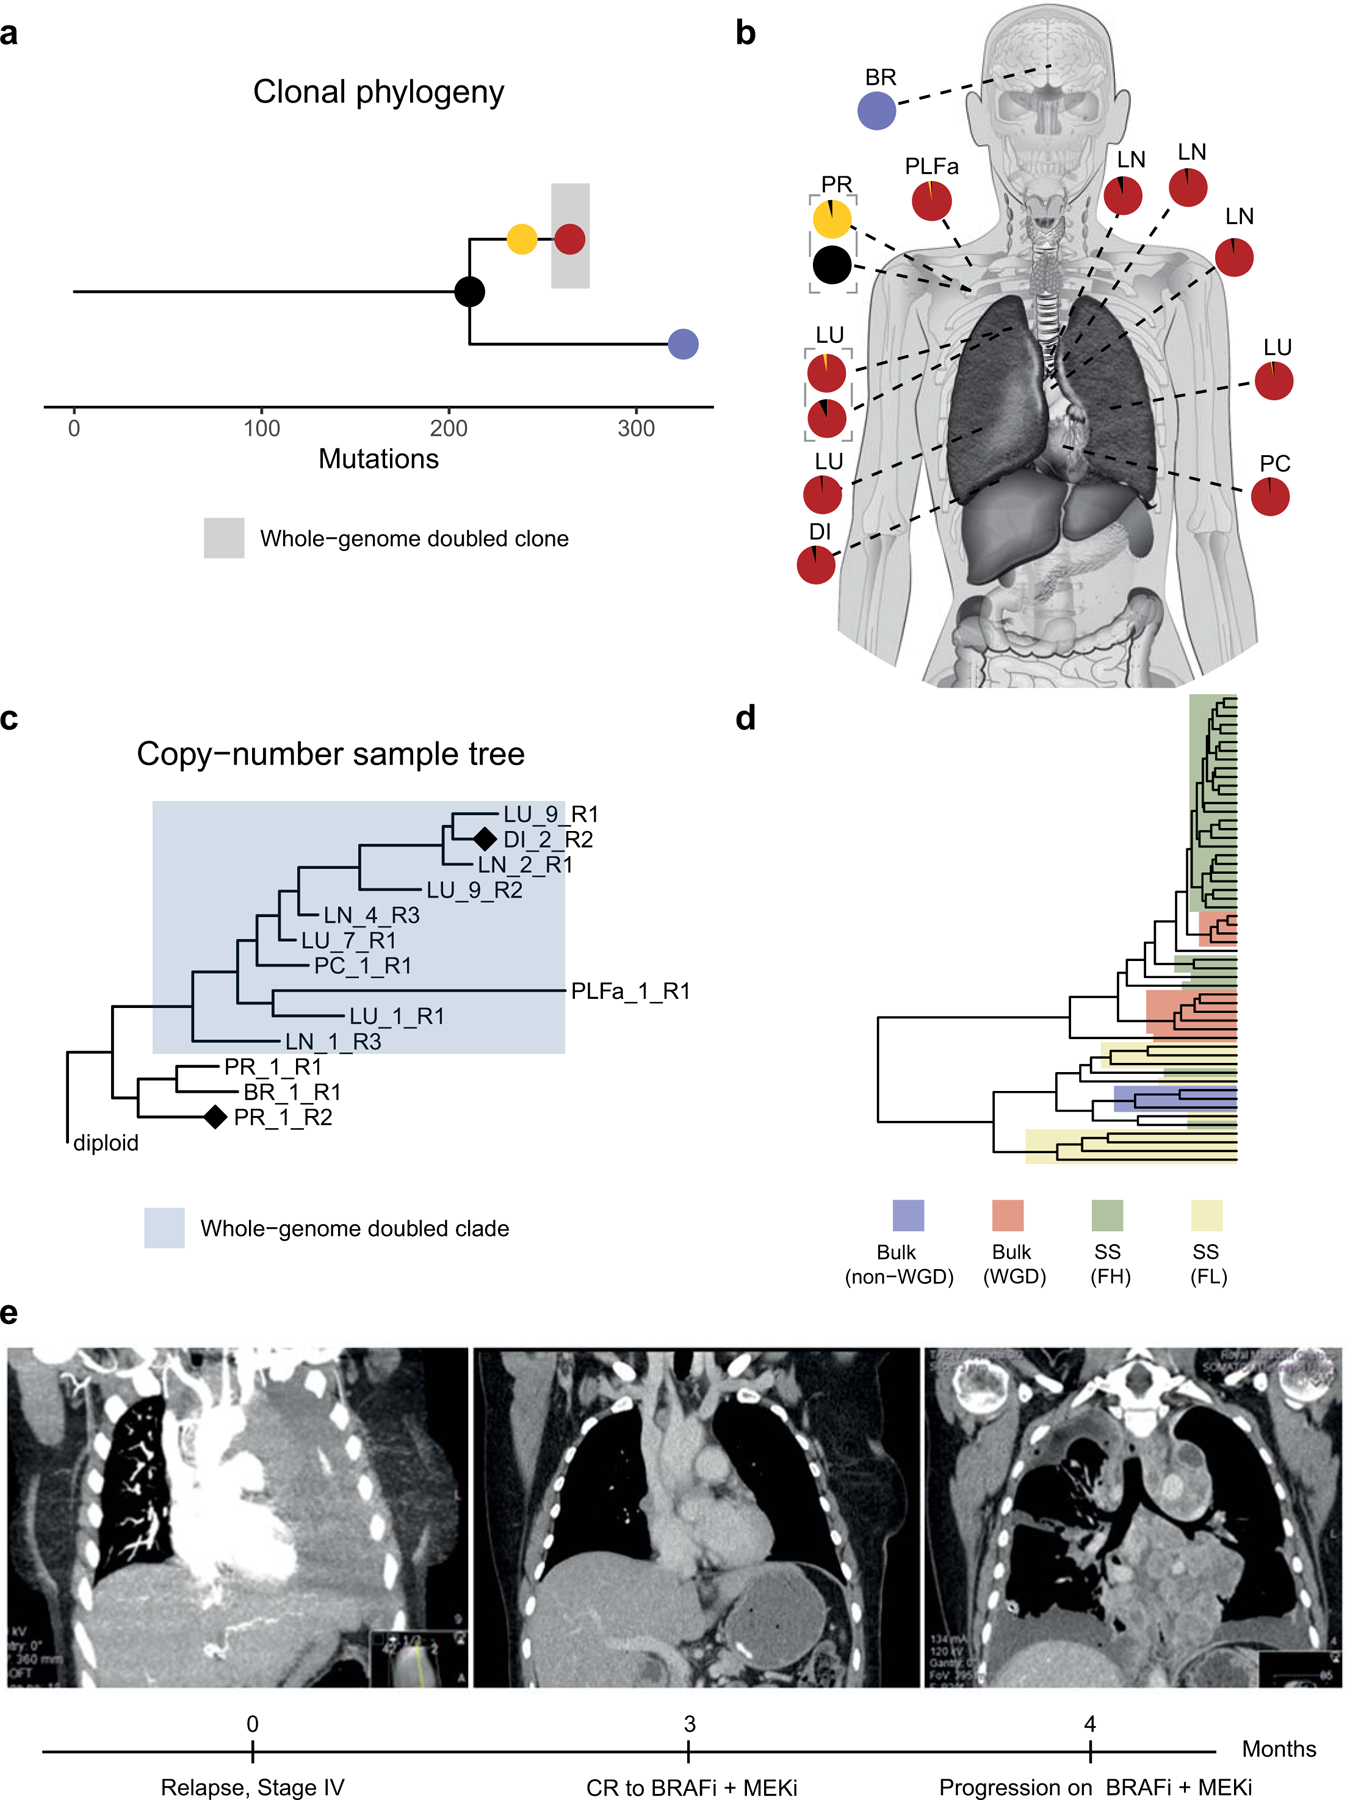
Identification of a likely non-whole-genome-doubled clone that was not identifiable from bulk sequencing data in CRUKP2567. (a) Clonal phylogeny of CRUKP2567 with anatomical diagram (b) based on bulk SNVs mapping samples to clones on the tree. Scale indicates the number of mutations. (c) MEDICC2 copy-number tree for bulk exome samples from CRUKP2567. The cluster highlighted in blue has undergone one whole-genome doubling event, whilst the other non-highlighted cluster, containing brain metastasis and primary tumour samples, has not. Diamonds indicate the samples for which bulk copy number profiles are displayed in supplementary figure 23. (d) Hierarchical clustering tree containing all single cells (SS) from FACs-high ploidy sorting (FH) and FACs-low ploidy sorting (FL) as well as whole-genome doubled (WGD) bulk samples and non-WGD bulk samples. (e) Radiological images of the patient indicating thorax upon initiation of stage IV disease, complete extracranial response to BRAF inhibitor followed by rapid re-colonization of the thorax with resistant clones (left to right). BR = Brain, LU = Lung, PR = Primary, DI = Diaphragm, LN = Lymph node, PC = Pericardium, PLFa = Pleural fluid (archival).
In terms of the clinical course of CRUKP2567, at stage IV diagnosis, this patient had extensive disease in the thoracic cavity, followed by complete extra-cranial response to combined BRAF & MEK inhibitor treatment, and subsequent rapid re-emergence of thoracic disease that was resistant to targeted treatment (figure 6e). One of the pre-treatment pleural fluid samples exhibited evidence of WGD, suggesting that clones existed with WGD both prior to and after treatment. The presence of two clones of differing WGD status in the diaphragmatic metastasis of CRUKP2567 raises the possibility that the lower ploidy non-WGD clone originates from the non-WGD pretreatment population, and that the WGD clone re-populated this site after acquisition of resistance.
Discussion
Our study expands on previous multilesional metastatic melanoma analyses (8–11,62) by increasing the number of patients studied, the number of samples per patient and the breadth of represented sites of metastases, as well as the breadth of multiomic data generated. We observe a number of different evolutionary routes to lethality. Notably among these is the presence of whole-genome doubling, which is clonal in 4 patients, subclonal in 7, and absent in 3 patients. This contrasts with previous reports, in which near “universal tetraploidization” was observed in distant metastases (11). One caveat of extensive multilesional sampling is that patient numbers are often small; as more work is performed, the extent of the influence of sampling bias will become clear. Predominantly single-lesion analyses (6) have derived a figure of 40% for the rate of whole-genome doubling in advanced melanoma, although, of course, the caveat here is that WGD may be subclonal and therefore missed in some patients. Likely, the truth lies somewhere between these two extremes. The differential status of WGD between patients was found in both cutaneous and acral melanomas, indicating that tumours use WGD to sculpt a select number of critical genes rather than being driven by the excess mutations in sun-damaged cutaneous melanomas. Copy number events found in WGD tumours were mainly losses, indicative of a mechanism to buffer against the ratchet-like accumulation of deleterious alterations, as illustrated by previous simulatory work (63).
Examination of tumour characteristics of specific sites led us to the observation that late-emerging brain metastases display unique properties compared to other sites, having lower wGII and often diverging early in the clonal phylogeny. This is reminiscent of our observations of pancreatic metastases from clear-cell renal cell carcinoma which also emerged from ancestral clones and grew slowly (16). We found that a chemotherapy mutational signature was lacking in the brain metastasis of patient CRUKP5107. Given that these chemotherapies target dividing cells, the lack of evidence in the brain suggests either lack of exposure (due to the blood-brain barrier) or a slow-cycling population of tumour cells in the brain. However, clinical manifestations of brain metastases in melanoma are varied, so it is unlikely that all brain metastases follow this path.
As was expected, we observed the acquisition of resistance to both targeted therapies (30) and ICIs (39,64,65). The former primarily involved secondary driver mutations in the MAPK pathway. The consistency of acquired resistance to targeted therapy in our cohort suggests that these treatments may have little effect on late-stage ICI-exposed melanoma. Resistance to ICIs involved copy number changes and loss of heterozygosity events in antigen presentation pathway genes, such as B2M and JAK2. Losses and mutations in these genes have been linked to primary (64) and acquired resistance to PD-1 blockade in melanoma (65), suggesting that melanoma cells become insensitive to the antiproliferative effects of IFN-γ (via JAK1/2 alterations) or lose antigen presentation (via B2M alterations). Examination of within-patient heterogeneity of antigen presentation alterations revealed that these were for the most part present clonally across all tumours, which is in contrast to data from targeted MAPK inhibition therapies (35,37), suggestive of an early acquisition of these alterations. In addition, we observed a lack of solid immunoediting signal, suggesting that neoantigen burden was not particularly important in these patients and is trumped by antigen presentation pathway changes. It must be noted however that the technical limitations of neoantigen calling from DNA-sequence data may have also influenced this analysis; neoantigens are difficult to predict and it might be the case that small numbers of true strong neoantigens were downregulated or lost that were not identified here. Other potential influences that could explain the lack of immunoediting signals include tumour microenvironmental factors such as immunoregulatory cell lineages, including M2 macrophages (66) and T regulatory cells (67). However, we did not study these in detail here.
Increasing the resolution of this analysis of treatment resistance in relation to individual lesion radiological response, we found several genes of interest that may influence response to ICIs, including MYC, known to promote an immunosuppressive stroma (44). It should be noted however that functional validation of this finding in melanoma models was beyond the scope of this work. Whilst MYC is an essential modulator of tumour growth both via tumour-cell intrinsic mechanisms and its influence on the tumour microenvironment, and immune effectors (44,68), direct targeting of MYC is not feasible (69). Instead, small-molecule inhibitors that target cofactors of MYC (70), such as histone deacetylase genes (HDACs), have been developed and are used in the clinic to treat a variety of cancers (71). Taken together, these findings suggest that the combination of ICIs with a form of MYC inhibition could be a potential therapeutic avenue in ICI-refractory melanoma. It will also be of interest to assess 9p21 loss in larger cohorts, as this event was more frequent in lesions with a lack of response, but not statistically significant.
Much of the existing postmortem melanoma research has been limited to bulk DNA sequencing data (8,10,11). The inclusion of additional data modalities, namely transcriptomics and single-cell sequencing data in our study, revealed novel findings with clinical and technical implications. PHF3 has previously been associated with UV DNA-damage response in melanoma (59); however, here, it appears to be a clonal driver of a non-sun-exposed melanoma, suggesting a potential alternative role for PHF3 in melanoma progression, warranting further investigation in larger cohorts. It should be noted that differing purity of RNA-seq samples has the potential to influence transcriptomic analyses, although in our cohort we observed relatively high purity of samples measured using WES, and did not observe specific biases in purity towards particular patients (Supplementary Fig. 24) or tissue sites (Supplementary Fig. 25). Polyclonal seeding is typically thought of in terms of mutations; bulk sequencing data and the infinite sites model allow clonal reconstruction from the pooled sequencing data of many cells (72). Reconstruction of subclonal copy number profiles, however, remains challenging. Our single-cell data reveal a case of polyclonal seeding at the level of whole-genome doubling, suggesting that sample-level trees produced with tools such as MEDICC2 (73) could underestimate intra-tumour heterogeneity at the copy number level.
In this study, we have emphasised extensive tumour sampling over patient numbers. Consequently, one of the limitations we face is low statistical power when using the patient as the unit of statistical inference. Other considerations include sampling time; as our samples are taken at post-mortem, we may miss selective events that occur during the patient’s life. Patients were also subject to multiple lines of therapy, the influences of which may be difficult to disentangle. Primary tumour samples were not available for all patients, reflecting the challenges of sampling small cutaneous lesions. Nonetheless, this detailed multi-lesional study has elucidated various important themes in advanced melanoma, shedding light on the topic of whole-genome doubling, mechanisms of resistance, polyclonal seeding at the level of copy number and more. In terms of clinical implication, the lack of response to ICIs in these late stage patients supports an emphasis on neoadjuvant ICI trials and tumour cell-intrinsic mechanisms of therapy may be required in future.
Methods
Sample procurement and processing
The Posthumous Evaluation of Advanced Cancer Environment (PEACE) study is a pan-cancer U.K. wide research autopsy programme (NCT03004755) designed to comprehensively evaluate the biology of metastatic disease and drug resistance. A list of the consortium members can be found in Supplementary Table 1. The study is sponsored by University College London Clinical Trials Unit. Inclusion criteria include patients with advanced cancer. Written informed consent was provided by patients during life or by next of kin after death. The study was approved by the Health Research Authority National Research Ethics Service (NRES) Committee London - Dulwich on the 15th August 2013 in accordance with the Human Tissue Act 2004 of the Parliament of the United Kingdom, with Research Ethics Committee reference 13/LO/0972. Post-mortems are referred to as ‘tissue harvests’ (TH) within this study. These were conducted as soon as possible following death (median 52 hours, range 23–144; median time to refrigeration 7 hours, range 1–13), at either the University College London Hospital (UCLH) or Guys and St Thomas’ NHS Foundation Trust (GSTT) mortuaries. The post- mortem interval (PMI) and time to refrigeration (TTR) were noted for each case. At TH, sampling of metastases was led by a pathologist and multiple regions of individual metastases were procured where size permitted. Individual tumour regions were bisected along the long axis with one half immediately snap frozen in liquid nitrogen before long-term storage at −80℃ and the other half fixed in 10% neutral buffered formalin prior to embedding in paraffin blocks and stored at room temperature. Fresh instruments were used for handling each individual tumour region to avoid cross-contamination. Body cavity fluid (pleural, abdominal, CSF) was also collected and following centrifugation cell pellets were isolated from supernatant and snap-frozen in liquid nitrogen. Where possible, peripheral blood was collected in life (at the time of consent) and processed to separate buffy coat and plasma. Where no blood was procured in life, blood was collected at TH by the pathologist by performing ventricular stab.
DNA and RNA extraction from frozen tissue, FFPE tissue & blood
DNA and RNA were co-purified using the AllPrep DNA/RNA mini kit. (Qiagen). Briefly, a 2mm3 piece of tissue was added to 900ul of lysis buffer and homogenised for five seconds using the TissueRaptor (Qiagen) with a fresh homogenisation probe being used for each preparation. Each lysate was applied to a QiaShredder (Qiagen) and then sequentially purified using the DNA and RNA columns according to the manufacturer’s protocol. Germline control DNA was isolated from whole blood using the DNeasy Blood and Tissue kit (Qiagen) according to the manufacturer’s protocol. Archival FFPE tissue specimens were first evaluated by a histopathologist from H&E slides to identify tumour rich areas and macrodissected from the FFPE block. Qiagen GeneRead FFPE DNA extraction kit was used for DNA purification according to the manufacturer’s protocol.
Quality control of DNA and RNA samples
For each post-mortem case, a selection of samples of DNA and RNA (from fresh-frozen tissues) were run on 1.2% agarose gels to review their quality. For DNA samples, routine tapestation analysis was performed for DNA integrity assessment (DIN score) for 11 of the 14 cases. For the other cases, library preparation was undertaken at a different institution (UCLH) for CRUKP2986 and for CRUKP1842 and CRUKP6170, these were prepared prior to this operating procedure being in place. RNA samples selected for sequencing were also assessed for integrity on the agilent bioanalyser to give an integrity score (RIN). Spearman’s correlation coefficients were calculated between the DIN and RIN scores and the post-mortem interval (PMI) and time to refrigeration (TTR). DNA integrity as measured by the DIN score was collated for 125/153 samples that were subjected to WES (82%) and correlated with both the PMI and TTR where data was available. The 28 missing samples (18%), were derived from the first three tissue harvests conducted at the start of the study (CRUKP2986, CRUKP1842, CRUKP6170) before DINs were routinely recorded and DNA stock was exhausted. Overall, the majority of samples had a DIN greater than 6 (107/125, 86%).
Evaluation of RNA integrity as measured by the RIN score was undertaken for tumour samples included in the RNA-seq analysis (n = 111 with available information). We observed a wide range of RIN scores from 0.0 to 8.2, with a median of 4.3. A RIN >6 was noted in 12%. There was a significant but weak negative correlation with the PMI (r=˗0.23, p 0.02). No trend was observed between the RIN and TTR.
Targeted panel design and validation
To facilitate the sequencing of large numbers of samples, we developed a custom melanoma gene panel. First, we performed a comprehensive review of the literature for melanoma driver genes (4,5,74–78) and selected genes involved in treatment resistance for both BRAF/MEK targeted therapy and immune checkpoint therapies (30,35,38,65,79–84) as well as DNA repair genes (85). We also included the 20 most common genes mutated in melanoma as reported in COSMIC (86) and MutSig as well as a pre-existing list of immune genes included in a renal panel (13). Genes carrying variants of germline interest that may be involved in immune-related toxicity were also included (Supplementary table 7). A single nucleotide polymorphism (SNP) backbone was included to improve the accuracy of copy number calling. The total size of the panel was 1.9Mb. We validated the panel design by ensuring sufficient coverage of all target regions and by comparing the SNV/indel and copy number calls from samples that were sequenced with both panel and whole exome sequencing. Out of all mutations called in the exome samples (see details below), 91.9% were also called in the panel data and the copy number calls were consistent between exome and panel in more than 93% of segments.
Whole Exome and Custom Panel Library Construction and Sequencing
Depending on the available yield, genomic DNA samples were normalised to either 1–3 μg or 200 ng for the Agilent SureSelectXT Target Enrichment Library Protocol (Agilent Technologies, Santa Clara, CA, USA); standard or low input sample preparation respectively. Samples were sheared to 150–200 bp using either a Covaris E220 or LE220-plus (Covaris, Woburn, MA, USA). For samples sheared using the E220 instrument the run parameters outlined in the Agilent SureSelectXT protocols were followed; for those sheared on the LE220-plus, the following optimised parameters were used: 36 iterations of sonication for 10 seconds with 30 % duty factor, 450 peak incident power and 200 cycles per burst, at 4–8 °C.
Library construction of samples was then performed following the SureSelectXT protocols, using 6 pre-capture PCR cycles for the standard input samples and 10 pre-capture PCR cycles for the 200 ng low input samples. Hybridisation and capture were performed for each individual sample using an Agilent custom target-specific capture library; Melanoma Driver Panel (version 2). Captured libraries were amplified and indexed using 13 post-capture PCR cycles in PCR reactions which included one of 96 unique single indexes. The quality and fragment size distributions of the purified libraries were assessed using the Agilent TapeStation High Sensitivity D1000 Assay on a 4200 TapeStation Instrument (Agilent Technologies). Amplified, captured, indexed libraries passing this QC step were normalised to 2 nM and pooled for sequencing, ensuring that unique indexes were allocated to all libraries in a pool. The quality and fragment size distributions of the library pool were assessed using the Agilent TapeStation High Sensitivity D1000 Assay and quantified using the Qubit dsDNA HS Assay (Thermo Fisher Scientific, Waltham, MA USA). These QC results were used to denature and dilute the pool in preparation for sequencing on the Illumina NextSeq 500 sequencing platform. The final libraries were sequenced with 150 bp paired-end reads on the NextSeq 500 at the Advanced Sequencing Facility at the Francis Crick Institute. Target coverage was 500x for tumour regions and associated normal tissue.
A subset of patient samples were nominated for whole exome sequencing (WES) to maximise the types of metastatic sites represented in the WES analysis. Genomic DNA isolated from each sample was normalised to 1–3 μg. Libraries were prepared using the Agilent SureSelectXT Human All Exon v5 enrichment capture library. The libraries were prepared using 6 pre-capture and 12 post-capture PCR cycles. The quality and fragment size distributions of the purified libraries were assessed using the Agilent TapeStation High Sensitivity D1000 Assay (Agilent Technologies). Captured whole exome libraries passing this QC step were normalised to 2 nM and pooled for sequencing on the HiSeq 4000 sequencing platform. The final libraries were sequenced with 100 bp paired-end reads on the HiSeq 4000 at the Advanced Sequencing Facility at the Francis Crick Institute. Target coverage was 250x for tumour regions and the associated normal tissue.
Library Construction from genomic DNA extracted from FFPE tissue for sequencing
For DNA extracted from Formalin-fixed paraffin embedded (FFPE) tissue, adapter-ligated libraries were prepared using the KAPA HyperPrep Kit (KAPA Biosystems, Wilmington, MA, USA) followed by Agilent SureSelectXT capture enrichment according to the manufacturers’ protocols. Samples were normalised to 400 ng and sheared to 150–200 bp using a Covaris E220 (Covaris, Woburn, MA, USA), following the parameters outlined in the KAPA HyperPrep Kit for SureSelect Target Enrichment protocol. KAPA HyperPrep libraries were generated and amplified using 10, 11 or 12 pre-capture PCR cycles and subsequently enriched using either the Agilent custom Melanoma Driver Panel or SureSelectXT Human All Exon v5 capture library. The quality and fragment size distributions of the purified libraries were assessed using the Agilent TapeStation High Sensitivity D1000 Assay (Agilent Technologies).
RNA-seq Library Construction and Sequencing
Libraries for RNA sequencing were constructed using the KAPA RNA HyperPrep RNA Kit with RiboErase (HMR) (for Illumina) (KAPA Biosystems, Wilmington, MA, USA), according to the manufacturer’s protocol. Samples were specifically depleted for both cytoplasmic (5S, 5.8S, 18S, and 28S), and mitochondrial (12S and 16S) rRNA species. RNA samples were normalised to 50–70 ng and fragmented to 200–300 bp fragments for library construction. Libraries were indexed with unique KAPA Dual-Indexed Adapters (KAPA Biosystems) and PCR amplified using 15 or 16 PCR cycles. The quality and fragment size distributions of the purified libraries was assessed on a 4200 TapeStation Instrument (Agilent Technologies). Libraries passing this QC step were normalised and pooled for sequencing on the HiSeq 4000 sequencing platform. The final libraries were sequenced with 100 bp paired-end reads, to a target depth of 50 million reads per sample, on the HiSeq 4000 at the Advanced Sequencing Facility at the Francis Crick Institute.
Single-nuclei preparation, sorting and sequencing
Single nuclei sequencing was performed following the protocol in (61; chapter 15). In short, nuclei were isolated from frozen tissue and stained with Hoescht and Propidium iodide, then populations of different ploidy were gated in FACS sorting. From each population, 48 cells were processed through library preparation and single-end DNA sequencing.
Somatic SNV, and INDEL calling from multi-region Whole Exome Sequencing (WES) and panel sequencing
Paired-end reads (2×100bp for WES, 2×150bp for panel sequencing) in FastQ format sequenced by Hiseq or NextSeq were aligned to the human reference genome (build hg19), using the Burrows-Wheeler Aligner (BWA) v0.7.15. with seed recurrences (-c flag) set to 10000 (1). Intermediate processing of Sam/Bam files was performed using Samtools v1.3.1 and deduplication was performed using Picard 1.81 (http://broadinstitute.github.io/picard/). Single Nucleotide Variant (SNV) calling was performed using Mutect v1.1.7 and small scale insertion/deletions (INDELs) were called running VarScan v2.4.1 in somatic mode with a minimum variant frequency (--min-var-freq) of 0.005, a tumour purity estimate (--tumour-purity) of 0.75 and then validated using Scalpel v0.5.3 (scalpel-discovery in --somatic mode) (intersection between two callers taken) (2–4). SNVs called by Mutect were further filtered using the following criteria: i) variants falling outside the targeted capture range (±50bp padding) or into mitochondrial chromosome, haplotype chromosome, HLA genes or any intergenic region were not considered, ii) presence of both forward and reverse strand reads supporting the variant, iii) >5 reads supporting the variant in at least one fresh-frozen tumour region of a patient, iv) variants were required to have a VAF of 0.2 in at least one fresh-frozen tumour region, v) sequencing depth needed to be ≥20 and ≤3000 across all fresh-frozen tumour regions. Mutations called in formalin-fixed and paraffin-embedded (FFPE) samples were restricted to variants which passed this additional filtering in fresh frozen samples. Dinucleotide substitutions (DNV) were identified when two adjacent SNVs were called and their VAFs were consistently balanced (based on proportion test, P≥0.05). In such cases the start and stop positions were corrected to represent a DNV and frequency related values were recalculated to represent the mean of the SNVs. Variants were annotated using Annovar (5). Individual tumour biopsy regions were judged to have failed quality control and excluded from analysis based on the following criteria: i) sequencing coverage depth below 100X, ii) low tumour purity such that copy number calling failed.
Germline variant calling
Single nucleotide polymorphisms (SNPs), were called in the germline sample using Platypus v0.8.1 with default parameters apart from --genIndels=0 and --minMapQual=40 and calls were restricted to the targeted capture range (±50bp padding). Tumour regions were genotyped based on the variants identified in the germline (parameters set to --minPosterior=0 --getVariantsFromBAMs=0). SNPs with a minimum coverage of 50x in the germline and the tumour sample were used for allele-specific copy number segmentation.
Purity, ploidy and copy number analyses
CNVkit v0.7.3 was used with default parameters on paired tumour-normal sequencing data (6). Outliers of the derived log2-ratio (logR) calls from CNVkit were detected and modified using Median Absolute Deviation Winsorization before case-specific joint segmentation of fresh-frozen samples to identify genomic segments of constant logR (7). Formalin-fixed and paraffin-embedded (FFPE) samples were segmented separately, leveraging the segment information from the fresh-frozen samples.
Tumour sample purity, average ploidy and absolute allelic copy number per segment were estimated using ABSOLUTE v1.2 in allelic mode (10). In line with recommended best practice exome ABSOLUTE solutions were reviewed by 3 bioinformaticians, with solutions selected based on the majority vote. We implemented an automated solution selection for the panel sequencing samples based on the algorithm used in the manual selection. In short, we prioritised solutions with better fit of somatic SNV multiplicity, whose clonal VAF peak matched half the purity and whose proportion of subclonal copy number segments along the genome was lower than 50%. We weighted the scores assigned to these criteria based on their variance on different solutions for the same sample, allowing us to select samples based on the most meaningful differences.
Copy number alterations were then called as losses or gains relative to overall sample wide estimated ploidy. Arm-level gains and losses were called if ≥50% of the arm were gained or lost. Driver cytoband copy number was identified by overlapping called somatic copy number segments with putative driver copy number regions previously identified by GISTIC2 analysis of TCGA melanoma data. Allele-specific segmentation was performed using the paired PSCBS method after removal of single-locus outliers (R package PSCBS v0.61.0). The frequency of events across the cohort was calculated after cohort level minimum consistency segmentation, this is, dividing segments so that all samples have common edges.
The weighted genome instability index (wGII) was calculated for every sample as the average proportion of the genome with aberrant copy number, weighted on each of the 22 autosomal chromosomes.
To evaluate the effect metastatic sites have on wGII across the cohort, we compared the mean wGII of each site to a site-specific null distribution. For each site, the null distribution consisted of the mean wGII of 10,000 sets of samples containing the same number of samples per patient as each specific site, but including samples from any metastatic site. This way, the patient effect on the mean wGII is included in the null distribution, while randomising the metastatic site effect. Additionally, we tested the effect of metastatic sites on wGII with a linear mixed effects model. Mirrored subclonal allele imbalance (MSAI) was called when samples from the same case had regions of allelic imbalance with a different parental allele lost/gained. MSAI segments were identified by annotating the minor allele (“ref” or “alt”) at every SNP overlapping the segment. SNPs with allele frequencies between 0.45 and 0.55 were excluded to avoid sequencing sampling errors. Segments were called as MSAI when they had at least 3 overlapping SNPs and >80% of SNPs were discordant between a pair of samples. Pairwise Manhattan distances were calculated for each of these segments, and sample status for each segment was assigned with 2-means clustering.
To conservatively time mutations with respect to WGD, we calculated the multiplicity of each mutation. Mutations with multiplicity equal to the major copy number of the genomic region in a WGD sample were called as pre-WGD, while mutations with multiplicity lower than the major and minor copy number were called as post-WGD. The timing of other mutations was not called. Parallel WGD events were called when pre-WGD mutations were not shared between samples.
Fluorescent in-situ hybridisation (FISH)
Upon noticing high ploidy (up to 7n) estimates in some samples, we undertook FISH on a selection of samples as an orthogonal measure. Four-micrometre sections were cut from corresponding FFPE tissue blocks of at least two samples that had been submitted for WES and a diploid control (normal spleen) was enumerated in the same manner. Following dewaxing and rehydration in ethanol, the sections were hybridised to chromosomes 2 and 15 centromere FISH probes (Abbot molecular/vysis, labelled with SpectrumFreen and SpectrumOrange flurophores respectively) using the Dako Histology FISH Accessory Kit (Dako, Denmark, K5799), according to manufacturer’s instructions. Image acquisition was performed with a confocal microscope (Zeiss Invert880 with Airyscan). Z-stack images of single nuclei were acquired and imported into Fiji for further analysis. Manual evaluation of centromeric probes were performed and in at least 300 nuclei with non-overlapping borders taken from >3 spatially distinct ‘tiles’ per slide image.
Ploidy estimates were highly significantly positively correlated between FISH and exome (Pearson test, r = 0.7, p < 0.0001; Supplementary Fig. S19 and S20), although the modal ploidy of FISH tended to underestimate exome ploidy at higher ploidies (e.g. > 3n). This is most likely due to a combination of the use of interphase FISH rather than metaphase FISH, which was necessary but is technically more challenging, e.g. due to lack of melanoma-specific probes and resulting contamination from normal cells, as well as cell-to-cell heterogeneity in ploidy. Nonetheless, at these higher ploidies the range of ploidies observed with FISH encompassed the exome estimated ploidy for the majority of cases, suggesting that this was a genuine signal.
Subclonal reconstruction
In order to estimate whether mutations were clonal or subclonal, and the clonal structure of each tumour, a modified version of PyClone was used. For each mutation, two values were calculated, obsCCF and phyloCCF. obsCCF corresponds to the observed cancer cell fraction (CCF) of each mutation. Conversely, phyloCCF corresponds to the phylogenetic CCF of a mutation. To clarify the difference between these two values, consider a mutation present in every cancer cell within a tumour. A subclonal copy number event in one tumour region may lead to loss of this mutation in a subset of cancer cells. While the obsCCF of this mutation is therefore below 1, from a phylogenetic perspective the mutation can be considered ‘clonal’ as it occurred on the trunk of the tumour’s phylogenetic tree, and, as such, the phyloCCF may be 1. To calculate the obsCCF of each mutation, local copy number (obtained from ABSOLUTE), tumour purity (also obtained from ABSOLUTE), and variant allele frequency were integrated. In brief, for a given mutation we first calculated the observed mutation copy number, nmut, describing the fraction of tumour cells carrying a given mutation multiplied by the number of chromosomal copies at that locus using the following formula:
where VAF corresponds to the variant allele frequency at the mutated base, and p, CNt, CNn are respectively the tumour purity, the tumour locus specific copy number, and the normal locus specific copy number (CNn was assumed to be 2 for autosomal chromosomes). We then calculated the expected mutation copy number, nchr, using the VAF and assigning a mutation to one of the possible local copy numbers states using maximum likelihood. In this case only the integer copy numbers were considered.
All mutations were then clustered using the PyClone Dirichlet process clustering (87). PyClone version 0.13.1 was used for two cases (CRUKP6216, CRUKP1599 due to the exceptionally high tumour mutational burden (TMB) in these cases) while the remaining cases were analysed with PyClone version 0.12.3. For each mutation, the observed variant count was used and reference count was set such that the VAF was equal to half the pre-clustering CCF. Given that copy number and purity had already been corrected, we set the major allele copy numbers to 2 and minor allele copy numbers to 0 and purity to 0.5; allowing clustering to simply group clonal and subclonal mutations based on their pre-clustering CCF estimates. We ran PyClone with 10,000 iterations and a burn-in of 1000, and default parameters, with the exception of --var_prior set to ‘BB’ and –ref_prior set to ‘normal’.
To determine the phyloCCF of each mutation, a similar procedure to that described above was implemented, with the exception that mutations were corrected for subclonal copy number events. Specifically, if the observed variant allele frequency was significantly different from that expected (P<0.01, using prop.test in R) given a clonal mutation, we determined whether a subclonal copy number event could result in a non-significant (P>0.01) difference between observed and expected VAFs. The pre-clustering CCF for each mutation was then calculated by dividing nmut by nchr. Subclonal copy number events were estimated using the raw values from Absolute output. Finally, to ensure potentially unreliable VAFs of indels did not lead to separate mutation clusters, each estimated indel CCF was multiplied by a region specific correction factor. Assuming the majority of ubiquitous mutations, present in all regions, are clonal, the region specific correction factor was calculated by dividing the median mutation CCF of ubiquitous mutations by the median indel CCF of ubiquitous indels.
Identification of subclonal mutations driven by copy number loss
Mutations were investigated in order to identify those whose absence, or low CCF values, may be driven by copy number loss events. For each tumour we identified any SNV residing in genomic segments of copy number heterogeneity across tumour regions, with minor and major copy number aberrations considered separately. For each chromosome, we grouped mutations into non-contiguous genomic segments with consistent copy number states within tumour regions and within SNV clusters defined above. To restrict our analysis to mutations lost in at least one tumour region, we determined the median CCF value of each SNV group, and only considered SNV groups where the median CCF value was <=0.25 in at least one tumour region. We then evaluated whether copy number loss coincided with lower CCF levels using a one-sided Wilcoxon test or, if more than two copy number states were present across tumour regions, a one-sided Cochrane Armitage trend test. To ensure the lower CCF value was driven by copy number and not tumour region, we also implemented a regression analysis, including both copy number and region in the model. If over 85% of mutations within a given PyClone cluster were determined to be driven by copy number, then the entire cluster was classified as copy number driven. Finally, to avoid overestimating copy number driven losses of mutations, only losses occurring in <=75% of tumour regions were considered. In addition, comparisons were made between the results of each mutations obsCCF and phyloCCF. Given that the only difference between the calculation of the two is that obsCCF does not correct for subclonal copy number events, mutations which appear clonal by phyloCCF but subclonal by obsCFF may reflect copy number driven heterogeneity. To avoid overestimating copy number driven heterogeneity only mutations with a VAF of at least 1% were considered potentially to reside on a subclonal copy number and thereby considered as potentially driven by subclonal copy number loss.
Phylogenetic tree construction
To ensure accurate tree construction, mutation clusters were first filtered to ensure no violation of evolutionary principles. In brief, two principles were considered. First, the pigeonhole principle, which states that two mutation clusters cannot be considered independent and on separate branches of an evolutionary tree if the sum of the cancer cell prevalence values of the two clusters exceeds 100% within a single tumour region. Second, a descendent clone must exhibit a smaller cellular prevalence than its ancestor within each and every tumour region, referred to as the ‘crossing rule’. Using these principles it can be determined whether particular mutation clusters conflict with each other and cannot be fitted to the same evolutionary tree. For instance, if the cellular prevalence of mutation cluster 1 in tumour region 1 is 80% and mean cellular prevalence of mutation cluster 2 in tumour region 1 is 60%, then, by the pigeonhole principle, cluster 2 must be a descendent of cluster 1. However, if, in a different tumour region, the cellular prevalence of cluster 2 is greater than cluster 1, it can be said that cluster 1 and 2 conflict due to ‘crossing rule’. To ensure accurate tree construction, only clusters with at least 5 mutations were included. For the majority of tumours, all subsequent clusters were used to manually construct a phylogenetic tree. However, for a subset of tumours evolutionary conflicts were identified and a small number of mutation clusters were therefore removed. In total, 65/177 mutation clusters were removed, 23 of these containing less than 5 mutations. This removed 528 mutations from a total 22,148 mutations, representing 2.4% of all clustered mutations. Topologies of manually constructed phylogenetic trees were verified with Pairtree (88). 10 of 14 trees had entirely consistent topologies between our manually constructed trees and the trees output by Pairtree, the four trees that were not exactly consistent had minor alterations to the topologies that did not affect any of the analyses (Supplementary Table 8).
Copy number sample trees for bulk sequencing data were inferred using MEDICC2 (27).
Polyclonal seeding from primary to metastases was determined either by assessment of multiregional samples from the primary tumour, or by inspection of the clonal phylogenetic trees and mutational signatures.
Estimating clonal proportion from CCF values for anatomy plotting
Anatomy plots are labelled with pie charts whose colours represent the clonal proportion of clones in a sample. As clone proportion is not an output of PyClone, it was necessary to create an algorithm that estimates clonal proportion jointly from the CCF values and the clonal tree topology for each patient. To do this, we developed a tree traversal algorithm as follows: start with the CCF of the basal node N1, CCFN1. If the sum of CCFs of all immediate children of N1 (CCFC1) are larger than CCFN1, scale CCFC1 to equal CCFN1. Subtract CCFC1 from CCFN1 to get the clonal proportion value of N1, CPN1. Repeat until all tips of the tree are reached.
HLA Typing
HLA typing of patients, as well as identification of mutations in HLA genes, was performed with Polysolver v1.0.0.
Neoantigen prediction and analysis of immunoediting
Neoantigens were predicted from mutation data using netMHC v4.0 or netMHCpan v4.1 where this failed. For the immunoediting analysis, tests were performed at the level of the patient. A 2×2 contingency table was calculated for predicted neoantigens that look to have undergone loss as well as nonsynonymous mutations that have undergone loss. Loss of a neoantigen or mutation was defined relative to other samples from the same patient, and was considered loss if two or more other samples contained the neoantigen, whilst other samples had loss of heterozygosity and a lack of neoantigen / mutation call at the same locus.
For the analysis of immunoediting based on changes to the expression of neoantigenic loci, we employed the same methodology as in (42). Namely, expression of neoantigens and mutations was defined in a binary manner, being expressed if there were more than 4 reads supporting the neoantigen in the RNASeq data for a sample. Each tumour was considered separately in determining the overall counts for expressed vs non-expressed neoantigens or mutations within a patient to account for changes in expression at the level of tumours. For example, for neoantigen x, tumours y and z could differentially alter the expression of x, even though x is at the same locus in both y and z.
Mutational Signature Analysis
Mutational signatures were estimated using the deconstructSigs package in R (89). Subclone specific mutational signature analysis was restricted to subclones with at least 50 mutations.
RNA-seq analyses
The sequencing data was analyzed using the nfcore/rnaseq pipeline (v3.0) (90). First, the input FastQ files underwent quality evaluation with FastQC (0.11.9) and adapter trimming with TrimGalore!(0.6.6). Next, the reads were aligned to the human reference genome GRCh37 and quantified with RSEM (1.3.1). SAMtools (1.10) was used to sort the BAM files generated by the alignment and generate mapping statistics. featureCounts was used to summarise the mapped read distribution over genomic features, and count overlaps with different classes of genomic features. Further quality control was performed by RSeQC (3.0.1) and Qualimap (2.2.2dev). MultiQC (v1.10.1) was used to check for artefacts introduced by contamination. 2 out of the 162 samples tested (both normal samples) had very high percentages of unalignable reads and were removed from subsequent analyses. Additionally, three samples showed high percentages of mitochondrial ribosomal RNA (Mt_rRNA > 1%), indicating possible bacterial contamination; these were also removed. Differential expression analyses between tumour and normal tissue were performed using VST-normalised expression values from DESeq2 (91), and using the geometric mean these values within each hallmark geneset as input into a linear mixed effects model, with tissue type (normal or tumour) and purity as fixed effects, and patient as a random effect. For examining associations between expression of hallmark genesets and the ploidy of samples, the geometric mean of VST-corrected expression values for genes in the geneset was taken, which was used as input to a linear mixed-effects model with ploidy and purity as predictors and patient as a random effect, accounting for grouping of patient samples.
RNA fusion calling
To identify RNA fusions, nf-core (90) rnafusion pipeline version 2.1.0 was used. Briefly, RNA-seq reads were aligned to reference genome GRCh38 with STAR version 2.7.10a (92) to leverage the annotations of this build. STAR-Fusion version 1.10.1 (93) was used to detect fusions. Fusion calls were conservatively filtered by LeftBreakEntropy > 0.3, SpanningFragCount > 1 and FFPM > 0.2. Fusions were called subclonal in each case when they were found in < 80% of samples.
Lesion-specific response to treatment analysis
Lesions were categorised as either progressing or not based on RECIST 1.1 criteria (94). A permutation-based GISTIC test was then performed to find regions that were significantly amplified or deleted in progressing vs non-progressing lesions.
Assessing KIT amplification and evidence for ecDNA using FISH
KIT amplification was determined using KIT/Con4 FISH probes (Empire Genomics) labelled with Orange-dUTP and Green-dUTP, respectively. Four-micrometer cryosections were generated using a cryostat set at −20 °C (BRIGHT) from tumour cryoblocks matching tumour regions in which genomic profiles showed KIT amplification. The sections were first air dried for 30 minutes and then placed in a 3:1 Methanol:acetic acid fixative for 5 minutes at room temperature. The sections were then hybridized with the FISH probes using the Dako Histology FISH Accessory Kit (Dako, Denmark, K5799), according to manufacturer’s instructions. Image acquisition was performed with a confocal microscope (Zeiss Invert880 with Airyscan). Z-stack images of single nuclei were taken and imported into Fiji for further analysis.
Supplementary Material
Statement of significance.
Despite treatment advances, melanoma remains a deadly disease at stage IV. Through research autopsy and dense sampling of metastases combined with extensive multi-omic profiling, our study elucidates the many mechanisms that melanomas use to evade treatment and the immune system, whether through mutations, widespread copy number alterations or extrachromosomal DNA.
Acknowledgements
We are indebted to the patients and their families for their participation in this study. We are grateful to the funders of this project for their support: Melanoma Research Alliance (award reference 686061), The Rosetrees Trust (grant reference number A2204), the PEACE study (C416/A21999) Royal Marsden Cancer Charity (we thank the Ross-Russell family and the the Kidney and Melanoma Cancer Fund), the Robert McAlpine Foundation and Melanoma UK. S. Turajlic and H. Pallikonda are funded by Cancer Research UK (grant reference number A29911). S.Turajlic, C. Swanton and A-L. Cattin are funded by the Francis Crick Institute, which receives its core funding from Cancer Research UK (FC10988), the UK Medical Research Council (FC10988), and the Wellcome Trust (FC10988). Outside submitted work ST is funded by the National Institute for Health Research (NIHR) Biomedical Research Centre at the Royal Marsden Hospital and Institute of Cancer Research (grant reference number A109), the Royal Marsden Cancer Charity, The Rosetrees Trust (grant reference number A2204), Roche Sequencing (grant reference numbers 10467 and 10530), the National Institute of Health ((U01 CA247439) and the US Department of Defense (award no W81XWH-22-1-0652) and VHL Alliance. ST has received speaking fees from Roche, Astra Zeneca, Novartis and Ipsen. ST has the following patents filed: Indel mutations as a therapeutic target and predictive biomarker PCTGB2018/051892 and PCTGB2018/051893 and Clear Cell Renal Cell Carcinoma Biomarkers P113326GB. C. Swanton is funded by Cancer Research UK (TRACERx (C11496/A17786), PEACE (C416/A21999) and CRUK Cancer Immunotherapy Catalyst Network); Cancer Research UK Lung Cancer Centre of Excellence (C11496/A30025); the Rosetrees Trust, Butterfield and Stoneygate Trusts; NovoNordisk Foundation (ID16584); Royal Society Professorship Enhancement Award (RP/EA/180007); National Institute for Health Research (NIHR) University College London Hospitals Biomedical Research Centre; the Cancer Research UK-University College London Centre; Experimental Cancer Medicine Centre; the Breast Cancer Research Foundation (US); and The Mark Foundation for Cancer Research (Grant 21-029-ASP). C. Swanton is in receipt of an ERC Advanced Grant (PROTEUS) from the European Research Council under the European Union’s Horizon 2020 research and innovation programme (grant agreement no. 835297). M. Jamal-Hanjani is a CRUK Career Establishment Awardee and has received funding from CRUK, NIH National Cancer Institute, IASLC International Lung Cancer Foundation, Lung Cancer Research Foundation, Rosetrees Trust, UKI NETs, NIHR, NIHR UCLH Biomedical Research Centre. K. Litchfield is funded by the UK Medical Research Council (MR/P014712/1 and MR/V033077/1), Rosetrees Trust and Cotswold Trust (A2437) and Cancer Research UK (C69256/A30194). A.Coulton is funded by the Melanoma Research Alliance (award reference 686061). I. Lobon is funded by the Bjorn Saven Fellowship Fund. F. Byrne is funded by the Rosetrees Foundation (reference CF-2021-2\129). We thank Joe Brock for providing the anatomical illustrations. We thank Karolina Rzienewicz for assistance with sample handling.
Footnotes
Conflict of interest disclosure statement
J. Murai is an employee of Ono Pharmaceutical Co. Ltd. J. Larkin reports receiving grant support and consulting fees from Achilles Therapeutics, Bristol-Myers Squibb, Merck Sharp & Dohme, Nektar, Novartis, Pfizer, Roche–Genentech, and Immunocore and consulting fees from AstraZeneca, Boston Biomedical, Eisai, EUSA Pharma, GlaxoSmithKline, Ipsen, Imugen, Incyte, iOnctura, Kymab, Merck Serono, Pierre Fabre, Secama, Vitaccess, Covance, Aveo, and Pharmacyclics. N. McGranahan reports personal fees from Achilles Therapeutics outside the submitted work; in addition, N. McGranahan has a patent for PCT/GB2018/052004, PCT/EP2016/059401, and PCT/GB2020/050221 pending. K. Litchfield reports personal fees from Roche Tissue Diagnostics; grants from CRUK TDL/Ono/LifeArc alliance; and personal fees from Monopteros Therapeutics outside the submitted work; in addition, K. Litchfield has a patent for Indel burden and CPI response pending. M. Jamal-Hanjani reports non-financial support from Achilles Therapeutics and personal fees from Achilles Therapeutics outside the submitted work; in addition, M. Jamal-Hanjani has a patent for methods for lung cancer detection issued. C. Swanton reports grants, personal fees, and other support from AstraZeneca, grants from Beohringer Ingelheim, grants and personal fees from Bristol Myers Squibb, grants from Pfizer, grants and personal fees from Roche Ventana, grants from Invitae, grants from Ono Pharmaceutical, personal fees and other support from Achilles Therapeutics, personal fees and other support from GRAIL, other support from Epic Bioscience, other support from Apogen Biotechnologies, personal fees and other support from Bicycle Therapeutics, personal fees from Amgen, personal fees from Novartis, personal fees from GSK, personal fees from MSD, personal fees from Illumina, personal fees from Genentech, personal fees from Medicxi, personal fees from Metabomed, personal fees from Roche Innovation Centre Shanghai, and personal fees from Sarah Canon Research Institute outside the submitted work; in addition, C. Swanton has a patent for PCT/GB2017/053289 issued, a patent for to targeting neoantigens (PCT/EP2016/059401) issued, a patent for identifying patent response to immune checkpoint blockade (PCT/EP2016/071471) issued, a patent for determining HLA LOH (PCT/GB2018/052004) issued, a patent for predicting survival rates of patients with cancer (PCT/GB2020/050221) issued, a patent for identifying patients who respond to cancer treatment (PCT/GB2018/051912) issued, a US patent relating to detecting tumor mutations (PCT/US2017/28013) issued, a patent for methods for lung cancer detection (US20190106751A1) issued; and C. Swanton is a Royal Society Napier Research Professor (RSRP\R\210001). This work was supported by the Francis Crick Institute, which receives its core funding from Cancer Research UK (FC001169), the UK Medical Research Council (FC001169), and the Wellcome Trust (FC001169). This research was funded in whole, or in part, by the Wellcome Trust (FC001169). ST has received speaking fees from Roche, Astra Zeneca, Novartis and Ipsen. S. Turajlic has the following patents filed: Indel mutations as a therapeutic target and predictive biomarker PCTGB2018/051892 and PCTGB2018/051893. No disclosures were reported by the other authors.
Data availability statement
Raw data is available under request on the EGA repository under accession number EGAS00001007081. Processed data used in this study is available at https://doi.org/10.5281/zenodo.7673904. The source data and code used to generate the figures can be found in https://github.com/FrancisCrickInstitute/PEACE_melanoma_14_paper.
References
- 1.Robert C, Grob JJ, Stroyakovskiy D, Karaszewska B, Hauschild A, Levchenko E, et al. Five-Year Outcomes with Dabrafenib plus Trametinib in Metastatic Melanoma. New England Journal of Medicine. Massachusetts Medical Society; 2019;381:626–36. [DOI] [PubMed] [Google Scholar]
- 2.Spain L, Larkin J, Turajlic S. New survival standards for advanced melanoma. Br J Cancer 2020;122:1275–6. [DOI] [PMC free article] [PubMed] [Google Scholar]
- 3.Larkin J, Chiarion-Sileni V, Gonzalez R, Grob J-J, Rutkowski P, Lao CD, et al. Five-Year Survival with Combined Nivolumab and Ipilimumab in Advanced Melanoma. New England Journal of Medicine. Massachusetts Medical Society; 2019;381:1535–46. [DOI] [PubMed] [Google Scholar]
- 4.Akbani R, Akdemir KC, Aksoy BA, Albert M, Ally A, Amin SB, et al. Genomic Classification of Cutaneous Melanoma. Cell. Elsevier; 2015;161:1681–96. [DOI] [PMC free article] [PubMed] [Google Scholar]
- 5.Hayward NK, Wilmott JS, Waddell N, Johansson PA, Field MA, Nones K, et al. Whole-genome landscapes of major melanoma subtypes. Nature 2017;545:175–80. [DOI] [PubMed] [Google Scholar]
- 6.Birkeland E, Zhang S, Poduval D, Geisler J, Nakken S, Vodak D, et al. Patterns of Genomic Evolution in Advanced Melanoma. Nature Communications. Nature Publishing Group; 2018;9:2665. [DOI] [PMC free article] [PubMed] [Google Scholar]
- 7.Iacobuzio-Donahue CA, Michael C, Baez P, Kappagantula R, Hooper JE, Hollman TJ. Cancer biology as revealed by the research autopsy. Nat Rev Cancer 2019;19:686–97. [DOI] [PMC free article] [PubMed] [Google Scholar]
- 8.Raaijmakers MIG, Widmer DS, Narechania A, Eichhoff O, Freiberger SN, Wenzina J, et al. Co-existence of BRAF and NRAS driver mutations in the same melanoma cells results in heterogeneity of targeted therapy resistance. Oncotarget. Impact Journals; 2016;7:77163–74. [DOI] [PMC free article] [PubMed] [Google Scholar]
- 9.Rabbie R, Ansari-Pour N, Cast O, Lau D, Scott F, Welsh SJ, et al. Multi-site clonality analysis uncovers pervasive heterogeneity across melanoma metastases. Nat Commun 2020;11:4306. [DOI] [PMC free article] [PubMed] [Google Scholar]
- 10.Makohon-Moore AP, Lipson EJ, Hooper JE, Zucker A, Hong J, Bielski CM, et al. The Genetic Evolution of Treatment-Resistant Cutaneous, Acral, and Uveal Melanomas. Clin Cancer Res 2021;27:1516–25. [DOI] [PMC free article] [PubMed] [Google Scholar]
- 11.Vergara IA, Mintoff CP, Sandhu S, McIntosh L, Young RJ, Wong SQ, et al. Evolution of late-stage metastatic melanoma is dominated by aneuploidy and whole genome doubling. Nat Commun 2021;12:1434. [DOI] [PMC free article] [PubMed] [Google Scholar]
- 12.Jamal-Hanjani M, Wilson GA, McGranahan N, Birkbak NJ, Watkins TBK, Veeriah S, et al. Tracking the Evolution of Non–Small-Cell Lung Cancer. New England Journal of Medicine. Massachusetts Medical Society; 2017;376:2109–21. [DOI] [PubMed] [Google Scholar]
- 13.Turajlic S, Xu H, Litchfield K, Rowan A, Horswell S, Chambers T, et al. Deterministic Evolutionary Trajectories Influence Primary Tumor Growth: TRACERx Renal. Cell 2018;173:595–610.e11. [DOI] [PMC free article] [PubMed] [Google Scholar]
- 14.Litchfield K, Stanislaw S, Spain L, Gallegos LL, Rowan A, Schnidrig D, et al. Representative Sequencing: Unbiased Sampling of Solid Tumor Tissue. Cell Reports 2020;31:107550. [DOI] [PubMed] [Google Scholar]
- 15.Alves JM, Prieto T, Posada D. Multiregional Tumor Trees Are Not Phylogenies. Trends in Cancer 2017;3:546–50. [DOI] [PMC free article] [PubMed] [Google Scholar]
- 16.Turajlic S, Xu H, Litchfield K, Rowan A, Chambers T, Lopez JI, et al. Tracking Cancer Evolution Reveals Constrained Routes to Metastases: TRACERx Renal. Cell 2018;173:581–594.e12. [DOI] [PMC free article] [PubMed] [Google Scholar]
- 17.Bakhoum SF, Ngo B, Laughney AM, Cavallo J-A, Murphy CJ, Ly P, et al. Chromosomal instability drives metastasis through a cytosolic DNA response. Nature 2018;553:467–72. [DOI] [PMC free article] [PubMed] [Google Scholar]
- 18.Davoli T, Uno H, Wooten EC, Elledge SJ. Tumor aneuploidy correlates with markers of immune evasion and with reduced response to immunotherapy. Science. American Association for the Advancement of Science; 2017;355:eaaf8399. [DOI] [PMC free article] [PubMed] [Google Scholar]
- 19.Bielski CM, Zehir A, Penson AV, Donoghue MTA, Chatila W, Armenia J, et al. Genome doubling shapes the evolution and prognosis of advanced cancers. Nat Genet 2018;50:1189–95. [DOI] [PMC free article] [PubMed] [Google Scholar]
- 20.Watkins TBK, Lim EL, Petkovic M, Elizalde S, Birkbak NJ, Wilson GA, et al. Pervasive chromosomal instability and karyotype order in tumour evolution. Nature 2020;587:126–32. [DOI] [PMC free article] [PubMed] [Google Scholar]
- 21.Harland M, Mistry S, Bishop DT, Newton Bishop JA. A deep intronic mutation in CDKN2A is associated with disease in a subset of melanoma pedigrees. Human Molecular Genetics 2001;10:2679–86. [DOI] [PubMed] [Google Scholar]
- 22.Alexandrov LB, Kim J, Haradhvala NJ, Huang MN, Tian Ng AW, Wu Y, et al. The repertoire of mutational signatures in human cancer. Nature 2020;578:94–101. [DOI] [PMC free article] [PubMed] [Google Scholar]
- 23.Dutton-Regester K, Kakavand H, Aoude LG, Stark MS, Gartside MG, Johansson P, et al. Melanomas of unknown primary have a mutation profile consistent with cutaneous sun-exposed melanoma. Pigment Cell & Melanoma Research 2013;26:852–60. [DOI] [PubMed] [Google Scholar]
- 24.Alexandrov LB, Nik-Zainal S, Wedge DC, Aparicio SAJR, Behjati S, Biankin AV, et al. Signatures of mutational processes in human cancer. Nature 2013;500:415–21. [DOI] [PMC free article] [PubMed] [Google Scholar]
- 25.Vendramin R, Litchfield K, Swanton C. Cancer evolution: Darwin and beyond. EMBO J 2021;40:e108389. [DOI] [PMC free article] [PubMed] [Google Scholar]
- 26.Rogiers A, Lobon I, Spain L, Turajlic S. The Genetic Evolution of Metastasis. Cancer Research 2022;82:1849–57. [DOI] [PubMed] [Google Scholar]
- 27.Kaufmann TL, Petkovic M, Watkins TBK, Colliver EC, Laskina S, Thapa N, et al. MEDICC2: whole-genome doubling aware copy-number phylogenies for cancer evolution. Genome Biology 2022;23:241. [DOI] [PMC free article] [PubMed] [Google Scholar]
- 28.Wright S The Interpretation of Population Structure by F-Statistics with Special Regard to Systems of Mating. Evolution. [Society for the Study of Evolution, Wiley]; 1965;19:395–420. [Google Scholar]
- 29.Pires da Silva I, Lo S, Quek C, Gonzalez M, Carlino MS, Long GV, et al. Site-specific response patterns, pseudoprogression, and acquired resistance in patients with melanoma treated with ipilimumab combined with anti–PD-1 therapy. Cancer 2020;126:86–97. [DOI] [PubMed] [Google Scholar]
- 30.Long GV, Stroyakovskiy D, Gogas H, Levchenko E, de Braud F, Larkin J, et al. Combined BRAF and MEK Inhibition versus BRAF Inhibition Alone in Melanoma. New England Journal of Medicine. Massachusetts Medical Society; 2014;371:1877–88. [DOI] [PubMed] [Google Scholar]
- 31.Luebker SA, Koepsell SA. Diverse Mechanisms of BRAF Inhibitor Resistance in Melanoma Identified in Clinical and Preclinical Studies. Frontiers in Oncology 2019;9:268. [DOI] [PMC free article] [PubMed] [Google Scholar]
- 32.deCarvalho AC, Kim H, Poisson LM, Winn ME, Mueller C, Cherba D, et al. Discordant inheritance of chromosomal and extrachromosomal DNA elements contributes to dynamic disease evolution in glioblastoma. Nat Genet. Nature Publishing Group; 2018;50:708–17. [DOI] [PMC free article] [PubMed] [Google Scholar]
- 33.Alvarez-Breckenridge C, Stocking J, Lastrapes M, Nayyar N, Gill CM, Bertalan M, et al. 218 Divergent Clonal Evolution of Melanoma Brain Metastases in Response to Immunotherapy. Neurosurgery 2018;65:121–2. [Google Scholar]
- 34.McGranahan N, Rosenthal R, Hiley CT, Rowan AJ, Watkins TBK, Wilson GA, et al. Allele-Specific HLA Loss and Immune Escape in Lung Cancer Evolution. Cell 2017;171:1259–1271.e11. [DOI] [PMC free article] [PubMed] [Google Scholar]
- 35.Shi H, Hugo W, Kong X, Hong A, Koya RC, Moriceau G, et al. Acquired Resistance and Clonal Evolution in Melanoma during BRAF Inhibitor Therapy. Cancer Discov. American Association for Cancer Research; 2014;4:80–93. [DOI] [PMC free article] [PubMed] [Google Scholar]
- 36.Johnson DB, Menzies AM, Zimmer L, Eroglu Z, Ye F, Zhao S, et al. Acquired BRAF inhibitor resistance: A multicenter meta-analysis of the spectrum and frequencies, clinical behaviour, and phenotypic associations of resistance mechanisms. Eur J Cancer 2015;51:2792–9. [DOI] [PMC free article] [PubMed] [Google Scholar]
- 37.Hugo W, Shi H, Sun L, Piva M, Song C, Kong X, et al. Non-genomic and Immune Evolution of Melanoma Acquiring MAPKi Resistance. Cell. Elsevier; 2015;162:1271–85. [DOI] [PMC free article] [PubMed] [Google Scholar]
- 38.Van Allen EM, Miao D, Schilling B, Shukla SA, Blank C, Zimmer L, et al. Genomic correlates of response to CTLA-4 blockade in metastatic melanoma. Science. American Association for the Advancement of Science; 2015;350:207–11. [DOI] [PMC free article] [PubMed] [Google Scholar]
- 39.Roh W, Chen P-L, Reuben A, Spencer CN, Prieto PA, Miller JP, et al. Integrated molecular analysis of tumor biopsies on sequential CTLA-4 and PD-1 blockade reveals markers of response and resistance. Sci Transl Med 2017;9:eaah3560. [DOI] [PMC free article] [PubMed] [Google Scholar]
- 40.Cabrita R, Mitra S, Sanna A, Ekedahl H, Lövgren K, Olsson H, et al. The Role of PTEN Loss in Immune Escape, Melanoma Prognosis and Therapy Response. Cancers. Multidisciplinary Digital Publishing Institute; 2020;12:742. [DOI] [PMC free article] [PubMed] [Google Scholar]
- 41.Anagnostou V, Smith KN, Forde PM, Niknafs N, Bhattacharya R, White J, et al. Evolution of Neoantigen Landscape during Immune Checkpoint Blockade in Non-Small Cell Lung Cancer. Cancer Discov 2017;7:264–76. [DOI] [PMC free article] [PubMed] [Google Scholar]
- 42.Rosenthal R, Cadieux EL, Salgado R, Bakir MA, Moore DA, Hiley CT, et al. Neoantigen-directed immune escape in lung cancer evolution. Nature 2019;567:479–85. [DOI] [PMC free article] [PubMed] [Google Scholar]
- 43.Nishino M, Dahlberg SE, Adeni AE, Lydon CA, Hatabu H, Jänne PA, et al. Tumor Response Dynamics of Advanced Non–small Cell Lung Cancer Patients Treated with PD-1 Inhibitors: Imaging Markers for Treatment Outcome. Clin Cancer Res. American Association for Cancer Research; 2017;23:5737–44. [DOI] [PMC free article] [PubMed] [Google Scholar]
- 44.Kortlever RM, Sodir NM, Wilson CH, Burkhart DL, Pellegrinet L, Swigart LB, et al. Myc Cooperates with Ras by Programming Inflammation and Immune Suppression. Cell. Elsevier; 2017;171:1301–1315.e14. [DOI] [PMC free article] [PubMed] [Google Scholar]
- 45.Han G, Yang G, Hao D, Lu Y, Thein K, Simpson BS, et al. 9p21 loss confers a cold tumor immune microenvironment and primary resistance to immune checkpoint therapy. Nat Commun 2021;12:5606. [DOI] [PMC free article] [PubMed] [Google Scholar]
- 46.Barriga FM, Tsanov KM, Ho Y-J, Sohail N, Zhang A, Baslan T, et al. MACHETE identifies interferon-encompassing chromosome 9p21.3 deletions as mediators of immune evasion and metastasis. Nat Cancer. Nature Publishing Group; 2022;3:1367–85. [DOI] [PMC free article] [PubMed] [Google Scholar]
- 47.Litchfield K, Reading JL, Puttick C, Thakkar K, Abbosh C, Bentham R, et al. Meta-analysis of tumor- and T cell-intrinsic mechanisms of sensitization to checkpoint inhibition. Cell 2021;184:596–614.e14. [DOI] [PMC free article] [PubMed] [Google Scholar]
- 48.Jiménez-Sánchez A, Cast O, Miller ML. Comprehensive Benchmarking and Integration of Tumor Microenvironment Cell Estimation Methods. Cancer Res. American Association for Cancer Research; 2019;79:6238–46. [DOI] [PubMed] [Google Scholar]
- 49.Jiang P, Gu S, Pan D, Fu J, Sahu A, Hu X, et al. Signatures of T cell dysfunction and exclusion predict cancer immunotherapy response. Nat Med. Nature Publishing Group; 2018;24:1550–8. [DOI] [PMC free article] [PubMed] [Google Scholar]
- 50.Sica A, Schioppa T, Mantovani A, Allavena P. Tumour-associated macrophages are a distinct M2 polarised population promoting tumour progression: Potential targets of anti-cancer therapy. European Journal of Cancer 2006;42:717–27. [DOI] [PubMed] [Google Scholar]
- 51.Ma R-Y, Black A, Qian B-Z. Macrophage diversity in cancer revisited in the era of single-cell omics. Trends in Immunology 2022;43:546–63. [DOI] [PubMed] [Google Scholar]
- 52.Pérez-Guijarro E, Yang HH, Araya RE, El Meskini R, Michael HT, Vodnala SK, et al. Multimodel preclinical platform predicts clinical response of melanoma to immunotherapy. Nat Med 2020;26:781–91. [DOI] [PMC free article] [PubMed] [Google Scholar]
- 53.Fischer GM, Jalali A, Kircher DA, Lee W-C, McQuade JL, Haydu LE, et al. Molecular Profiling Reveals Unique Immune and Metabolic Features of Melanoma Brain Metastases. Cancer Discovery 2019;9:628–45. [DOI] [PMC free article] [PubMed] [Google Scholar]
- 54.Kleffman K, Levinson G, Rose IVL, Blumenberg LM, Shadaloey SAA, Dhabaria A, et al. Melanoma-Secreted Amyloid Beta Suppresses Neuroinflammation and Promotes Brain Metastasis. Cancer Discovery 2022;12:1314–35. [DOI] [PMC free article] [PubMed] [Google Scholar]
- 55.Biermann J, Melms JC, Amin AD, Wang Y, Caprio LA, Karz A, et al. Dissecting the treatment-naive ecosystem of human melanoma brain metastasis. Cell 2022;185:2591–2608.e30. [DOI] [PMC free article] [PubMed] [Google Scholar]
- 56.Ngo B, Kim E, Osorio-Vasquez V, Doll S, Bustraan S, Liang RJ, et al. Limited Environmental Serine and Glycine Confer Brain Metastasis Sensitivity to PHGDH Inhibition. Cancer Discovery 2020;10:1352–73. [DOI] [PMC free article] [PubMed] [Google Scholar]
- 57.Zou Y, Watters A, Cheng N, Perry CE, Xu K, Alicea GM, et al. Polyunsaturated Fatty Acids from Astrocytes Activate PPARγ Signaling in Cancer Cells to Promote Brain Metastasis. Cancer Discovery 2019;9:1720–35. [DOI] [PMC free article] [PubMed] [Google Scholar]
- 58.Ferraro GB, Ali A, Luengo A, Kodack DP, Deik A, Abbott KL, et al. Fatty acid synthesis is required for breast cancer brain metastasis. Nat Cancer. Nature Publishing Group; 2021;2:414–28. [DOI] [PMC free article] [PubMed] [Google Scholar]
- 59.Boeing S, Williamson L, Encheva V, Gori I, Saunders RE, Instrell R, et al. Multiomic Analysis of the UV-Induced DNA Damage Response. Cell Rep 2016;15:1597–610. [DOI] [PMC free article] [PubMed] [Google Scholar]
- 60.Appel L-M, Franke V, Bruno M, Grishkovskaya I, Kasiliauskaite A, Kaufmann T, et al. PHF3 regulates neuronal gene expression through the Pol II CTD reader domain SPOC. Nat Commun 2021;12:6078. [DOI] [PMC free article] [PubMed] [Google Scholar]
- 61.van den Bos H, Bakker B, Taudt A, Guryev V, Colomé-Tatché M, Lansdorp PM, et al. Quantification of Aneuploidy in Mammalian Systems. In: Demaria M, editor. Cellular Senescence: Methods and Protocols [Internet] New York, NY: Springer; 2019. [cited 2022 Jan 12]. page 159–190. Available from: 10.1007/978-1-4939-8931-7_15 [DOI] [PubMed] [Google Scholar]
- 62.Sanborn JZ, Chung J, Purdom E, Wang NJ, Kakavand H, Wilmott JS, et al. Phylogenetic analyses of melanoma reveal complex patterns of metastatic dissemination. Proc Natl Acad Sci U S A 2015;112:10995–1000. [DOI] [PMC free article] [PubMed] [Google Scholar]
- 63.López S, Lim EL, Horswell S, Haase K, Huebner A, Dietzen M, et al. Interplay between whole-genome doubling and the accumulation of deleterious alterations in cancer evolution. Nat Genet 2020;52:283–93. [DOI] [PMC free article] [PubMed] [Google Scholar]
- 64.Shin DS, Zaretsky JM, Escuin-Ordinas H, Garcia-Diaz A, Hu-Lieskovan S, Kalbasi A, et al. Primary Resistance to PD-1 Blockade Mediated by JAK1/2 Mutations. Cancer Discov. American Association for Cancer Research; 2017;7:188–201. [DOI] [PMC free article] [PubMed] [Google Scholar]
- 65.Zaretsky JM, Garcia-Diaz A, Shin DS, Escuin-Ordinas H, Hugo W, Hu-Lieskovan S, et al. Mutations Associated with Acquired Resistance to PD-1 Blockade in Melanoma. 10.1056/NEJMoa1604958 [Internet]. Massachusetts Medical Society; 2016; 375(9), 819–829 [cited 2022 Jan 8]; Available from: 10.1056/NEJMoa1604958 [DOI] [PMC free article] [PubMed] [Google Scholar]
- 66.Shapouri-Moghaddam A, Mohammadian S, Vazini H, Taghadosi M, Esmaeili S-A, Mardani F, et al. Macrophage plasticity, polarization, and function in health and disease. Journal of Cellular Physiology 2018;233:6425–40. [DOI] [PubMed] [Google Scholar]
- 67.Paluskievicz CM, Cao X, Abdi R, Zheng P, Liu Y, Bromberg JS. T Regulatory Cells and Priming the Suppressive Tumor Microenvironment. Frontiers in Immunology, 10, 2453. [Internet]. 2019. [cited 2022 Jan 24];10. Available from: 10.3389/fimmu.2019.02453 [DOI] [PMC free article] [PubMed] [Google Scholar]
- 68.Casey SC, Baylot V, Felsher DW. The MYC oncogene is a global regulator of the immune response. Blood 2018;131:2007–15. [DOI] [PMC free article] [PubMed] [Google Scholar]
- 69.Posternak V, Cole MD. Strategically targeting MYC in cancer. F1000Res 2016;5:F1000 Faculty Rev-408. [DOI] [PMC free article] [PubMed] [Google Scholar]
- 70.Ecker J, Thatikonda V, Sigismondo G, Selt F, Valinciute G, Oehme I, et al. Reduced chromatin binding of MYC is a key effect of HDAC inhibition in MYC amplified medulloblastoma. Neuro-Oncology 2021;23:226–39. [DOI] [PMC free article] [PubMed] [Google Scholar]
- 71.Park J, Terranova-Barberio M, Zhong AY, Thomas S, Munster PN. Chapter 40 - Clinical Applications of Histone Deacetylase Inhibitors. In: Tollefsbol TO, editor. Handbook of Epigenetics (Second Edition) [Internet]. Academic Press; 2017. [cited 2022 Jan 11]. page 605–21. Available from: https://www.sciencedirect.com/science/article/pii/B9780128053881000407 [Google Scholar]
- 72.Bonizzoni P, Ciccolella S, Vedova GD, Soto M. Does Relaxing the Infinite Sites Assumption Give Better Tumor Phylogenies? An ILP-Based Comparative Approach. IEEE/ACM Transactions on Computational Biology and Bioinformatics 2019;16:1410–23. [DOI] [PubMed] [Google Scholar]
- 73.Kaufmann TL, Petkovic M, Watkins TBK, Colliver EC, Laskina S, Thapa N, et al. MEDICC2: whole-genome doubling aware copy-number phylogenies for cancer evolution. Genome Biology 2022;23:241. [DOI] [PMC free article] [PubMed] [Google Scholar]
- 74.Ding L, Kim M, Kanchi KL, Dees ND, Lu C, Griffith M, et al. Clonal Architectures and Driver Mutations in Metastatic Melanomas. PLOS ONE. Public Library of Science; 2014;9:e111153. [DOI] [PMC free article] [PubMed] [Google Scholar]
- 75.Hodis E, Watson IR, Kryukov GV, Arold ST, Imielinski M, Theurillat J-P, et al. A Landscape of Driver Mutations in Melanoma. Cell 2012;150:251–63. [DOI] [PMC free article] [PubMed] [Google Scholar]
- 76.Krauthammer M, Kong Y, Ha BH, Evans P, Bacchiocchi A, McCusker JP, et al. Exome sequencing identifies recurrent somatic RAC1 mutations in melanoma. Nat Genet. Nature Publishing Group; 2012;44:1006–14. [DOI] [PMC free article] [PubMed] [Google Scholar]
- 77.Krauthammer M, Kong Y, Bacchiocchi A, Evans P, Pornputtapong N, Wu C, et al. Exome sequencing identifies recurrent mutations in NF1 and RASopathy genes in sun-exposed melanomas. Nat Genet. Nature Publishing Group; 2015;47:996–1002. [DOI] [PMC free article] [PubMed] [Google Scholar]
- 78.Stark MS, Woods SL, Gartside MG, Bonazzi VF, Dutton-Regester K, Aoude LG, et al. Frequent somatic mutations in MAP3K5 and MAP3K9 in metastatic melanoma identified by exome sequencing. Nat Genet 2011;44:165–9. [DOI] [PMC free article] [PubMed] [Google Scholar]
- 79.Smalley I, Kim E, Li J, Spence P, Wyatt CJ, Eroglu Z, et al. Leveraging transcriptional dynamics to improve BRAF inhibitor responses in melanoma. eBioMedicine. Elsevier; 2019;48:178–90. [DOI] [PMC free article] [PubMed] [Google Scholar]
- 80.Wagle N, Van Allen EM, Treacy DJ, Frederick DT, Cooper ZA, Taylor-Weiner A, et al. MAP kinase pathway alterations in BRAF-mutant melanoma patients with acquired resistance to combined RAF/MEK inhibition. Cancer Discov 2014;4:61–8. [DOI] [PMC free article] [PubMed] [Google Scholar]
- 81.Sweis RF, Spranger S, Bao R, Paner GP, Stadler WM, Steinberg G, et al. Molecular Drivers of the Non-T Cell-Inflamed Tumor Microenvironment in Urothelial Bladder Cancer. Cancer Immunol Res 2016;4:563–8. [DOI] [PMC free article] [PubMed] [Google Scholar]
- 82.Patel SJ, Sanjana NE, Kishton RJ, Eidizadeh A, Vodnala SK, Cam M, et al. Identification of essential genes for cancer immunotherapy. Nature. Nature Publishing Group; 2017;548:537–42. [DOI] [PMC free article] [PubMed] [Google Scholar]
- 83.Spranger S, Bao R, Gajewski TF. Melanoma-intrinsic β-catenin signalling prevents anti-tumour immunity. Nature. Nature Publishing Group; 2015;523:231–5. [DOI] [PubMed] [Google Scholar]
- 84.Hugo W, Zaretsky JM, Sun L, Song C, Moreno BH, Hu-Lieskovan S, et al. Genomic and Transcriptomic Features of Response to Anti-PD-1 Therapy in Metastatic Melanoma. Cell 2016;165:35–44. [DOI] [PMC free article] [PubMed] [Google Scholar]
- 85.Chae YK, Anker JF, Carneiro BA, Chandra S, Kaplan J, Kalyan A, et al. Genomic landscape of DNA repair genes in cancer. Oncotarget. Impact Journals; 2016;7:23312–21. [DOI] [PMC free article] [PubMed] [Google Scholar]
- 86.Tate JG, Bamford S, Jubb HC, Sondka Z, Beare DM, Bindal N, et al. COSMIC: the Catalogue Of Somatic Mutations In Cancer. Nucleic Acids Res 2019;47:D941–7. [DOI] [PMC free article] [PubMed] [Google Scholar]
- 87.Roth A, Khattra J, Yap D, Wan A, Laks E, Biele J, et al. PyClone: statistical inference of clonal population structure in cancer. Nat Methods 2014;11:396–8. [DOI] [PMC free article] [PubMed] [Google Scholar]
- 88.Wintersinger JA, Dobson SM, Kulman E, Stein LD, Dick JE, Morris Q. Reconstructing Complex Cancer Evolutionary Histories from Multiple Bulk DNA Samples Using Pairtree. Blood Cancer Discovery 2022;3:208–19. [DOI] [PMC free article] [PubMed] [Google Scholar]
- 89.Rosenthal R, McGranahan N, Herrero J, Taylor BS, Swanton C. deconstructSigs: delineating mutational processes in single tumors distinguishes DNA repair deficiencies and patterns of carcinoma evolution. Genome Biology 2016;17:31. [DOI] [PMC free article] [PubMed] [Google Scholar]
- 90.Ewels PA, Peltzer A, Fillinger S, Patel H, Alneberg J, Wilm A, et al. The nf-core framework for community-curated bioinformatics pipelines. Nat Biotechnol. Nature Publishing Group; 2020;38:276–8. [DOI] [PubMed] [Google Scholar]
- 91.Love MI, Huber W, Anders S. Moderated estimation of fold change and dispersion for RNA-seq data with DESeq2. Genome Biology 2014;15:550. [DOI] [PMC free article] [PubMed] [Google Scholar]
- 92.Dobin A, Davis CA, Schlesinger F, Drenkow J, Zaleski C, Jha S, et al. STAR: ultrafast universal RNA-seq aligner. Bioinformatics 2013;29:15–21. [DOI] [PMC free article] [PubMed] [Google Scholar]
- 93.Haas BJ, Dobin A, Li B, Stransky N, Pochet N, Regev A. Accuracy assessment of fusion transcript detection via read-mapping and de novo fusion transcript assembly-based methods. Genome Biology 2019;20:213. [DOI] [PMC free article] [PubMed] [Google Scholar]
- 94.Eisenhauer EA, Therasse P, Bogaerts J, Schwartz LH, Sargent D, Ford R, et al. New response evaluation criteria in solid tumours: Revised RECIST guideline (version 1.1). European Journal of Cancer 2009;45:228–47. [DOI] [PubMed] [Google Scholar]
Associated Data
This section collects any data citations, data availability statements, or supplementary materials included in this article.
Supplementary Materials
Data Availability Statement
Raw data is available under request on the EGA repository under accession number EGAS00001007081. Processed data used in this study is available at https://doi.org/10.5281/zenodo.7673904. The source data and code used to generate the figures can be found in https://github.com/FrancisCrickInstitute/PEACE_melanoma_14_paper.