

Abstract
Introduction.
Sex influences neurodegeneration but it has been poorly investigated in dementia with Lewy bodies (DLB). We investigated sex differences in brain atrophy in DLB using MRI.
Methods.
We included 436 patients from the European-DLB consortium and the Mayo Clinic. Sex differences and sex-by-age interactions were assessed through visual atrophy rating scales (n=327; 73±8 years, 62% males) and automated estimations of regional gray matter volume and cortical thickness (n=165; 69±9 years, 72% males).
Results.
We found a higher likelihood for frontal atrophy and smaller volumes in 6 cortical regions in males and thinner olfactory cortices in females. There were significant sex-by-age interactions in volume (6 regions) and cortical thickness (7 regions) across the entire cortex.
Discussion.
We demonstrate that males have more widespread cortical atrophy at younger ages, but differences tend to disappear with increasing age, with males and females converging around the age of 75.
Keywords: Atrophy, MRI, dementia with Lewy bodies, sex differences
Background
Recently, the influence of sex and gender on neurodegenerative diseases, especially Alzheimer’s disease (AD) and Parkinson’s disease (PD), has been spotlighted1,2. Sex differences are central to current precision medicine approaches. They are expected to play a role in the prevention, diagnosis, and treatment of neurodegenerative diseases in the coming years3,4. However, fewer studies have investigated sex differences in dementia with Lewy bodies (DLB), another common form of neurodegenerative disease. Particularly, neuroimaging studies on sex differences in DLB are scarce.
Although DLB is considered a predominantly male disease, the sex ratio in DLB varies across cohorts. For example, the female-to-male ratio ranges from 0.59:1 in the Swedish Dementia Registry to 0.81:1 and 0.88:1 in cohorts from the UK and China, and 1.20:1 in the French National Alzheimer database, with a more balanced ratio above the age of 755–8. Sex influences core clinical features. While parkinsonism and rapid eye movement sleep behavior disorder (RBD)9,10, visual hallucinations are more frequent in female DLB patients11,12, with some opposite reports10.
Regarding pathological changes, a recent neuropathological study of over 1,500 donors demonstrated that DLB males more frequently have “pure” Lewy body pathology13. Another report of 205 donors showed that DLB males tended to have Lewy body pathology confined to the brainstem and limbic system at an earlier age14. In contrast, DLB females tended to accumulate Lewy body pathology at older ages with more pronounced spreading across neocortical areas, perhaps reflecting a more aggressive disease course14. This finding may partially explain the delay in meeting DLB diagnostic criteria in female patients15. Furthermore, female DLB donors are more likely to have brain co-pathologies such as AD and cerebrovascular disease13. The higher frequency of AD co-pathology observed in DLB females in postmortem studies has also been supported in vivo with the use of β-amyloid and tau cerebrospinal fluid (CSF) biomarkers12,16. Alzheimer’s disease and cerebrovascular co-pathologies influence the clinical presentation of DLB by reducing the likelihood of core clinical features17–19, particularly in older male DLB patients20.
Two recent neuroimaging studies revealed lower dopaminergic activity in female DLB patients compared with male DLB patients, and a greater vulnerability of the cholinergic system in male DLB patients21,22. Unfortunately, the data on sex differences in magnetic resonance imaging (MRI) measures of neurodegeneration in DLB is limited to only two previous studies. A study from 2004 investigated sex differences in regional cortical gray matter (GM) volume in 8 male and 8 female DLB patients23. Male DLB patients had smaller GM volumes than females in the right dorsal frontal and bilateral parietal cortices. In a recent multicenter study on 86 DLB patients (49 males and 37 females) from the European DLB (E-DLB) consortium24, we found that frontal atrophy as assessed on visual ratings was associated with the male sex and older age in DLB25.
Magnetic resonance imaging studies in DLB are usually conducted in relatively small cohorts, which makes it difficult to reach sufficient statistical power, especially for the female patient group which is often even smaller in sample size. This likely explains the lack of MRI studies on sex differences in DLB, despite the interest in the topic. We overcame this limitation by leveraging a large multicenter MRI cohort of 442 probable DLB patients, the largest cohort of this type in the field. The cohort included 280 male and 162 female DLB patients. Our main aim was to investigate sex differences in measures of neurodegeneration using MRI, through two different methods: visual ratings of brain atrophy and automated methods for volumetric and cortical thickness measures. The main reason for using two methods was to generate knowledge directly applicable to clinical settings (visual ratings from radiologists), at the same time that we replicated and expanded radiological findings using more sensitive automated techniques for regional brain atrophy. This approach also served to validate the findings and generalize across common MRI techniques. We hypothesized that male DLB patients would have more frontoparietal atrophy than female DLB patients, based on the two previous studies23,25. Further, we anticipated that female DLB patients would have more GM atrophy in the medial temporal lobe, based on previous reports indicating more frequent AD co-pathology in female DLB patients compared to male DLB patients13,16. We also had a strong interest in investigating the interaction between sex and age with MRI measures because our previous study informed us of the combined effect of both sex and age on frontal lobe atrophy in DLB25. Hence, we hypothesized that DLB patients would show a sex-by-age interaction in frontal regions. Elucidating sex differences and sex-by-age interactions will be relevant to reveal their contribution to the clinical heterogeneity of DLB, in particular when interpreting MRI in clinical practice.
Methods
Participants
This study includes patients from multiple centers from the European DLB consortium (https://www.e-dlb.com/)24 and the Mayo Clinic in the U.S.26. To address our study aim, we divided the cohort into two partially independent samples. First, we assessed sex differences using visual rating scales on clinical T1-weighted MRIs from 327 DLB patients from 14 E-DLB centers (204 males and 123 females). Second, we assessed sex differences using research-oriented automated methods, volumetric and cortical thickness measures, on high-resolution 3D T1-weighted MRIs from 165 DLB patients (119 males and 46 females; 56 of them shared with the 327 sample) from three E-DLB centers (n = 97) and the Mayo Clinic cohort from Rochester, MN, U.S. (n = 68). See Supplementary Table 1 for more details about the cohorts. For the research-oriented automated methods, we also included a group of cognitively unimpaired (CU) participants matched in sex and age with the DLB patients (Supplementary Table 2).
Dementia with Lewy bodies diagnosis was established following the 2005 international consensus criteria for probable DLB27. The presence of core clinical features was collected, including parkinsonism, visual hallucinations, cognitive fluctuations, and clinical history of probable RBD. Exclusion criteria were: (i) presence of acute delirium; (ii) terminal illness; (iii) previous stroke; (iv) psychotic or bipolar disorder; (v) craniocerebral trauma; and (vi) recent diagnosis of significant systemic disease. Age and years of education were collected for statistical analysis, and the Mini-Mental State Examination (MMSE) was used as a measure of global cognitive performance.
Alzheimer’s disease co-pathology was assessed through positivity in β-amyloid and tau biomarkers: E-DLB centers used CSF β-amyloid 1–42 and phosphorylated tau biomarkers, while the Mayo Clinic used positron emission tomography (PET) Pittsburgh compound B (PiB) and Flortaucipir (18F-AV-1451). Cerebrospinal fluid and PET biomarkers were combined as done before16, and biomarker levels were classified as normal or abnormal based on center-specific established cut-points, as explained in prior publications16,26. Moreover, the APOE genotype was recorded and carriership was considered as one or more copies of the ε4-allele.
For white matter hyperintensity (WMH) burden as a common biomarker of cerebrovascular disease, we used both the Fazekas scale28 and a semi-automated method for WMH volume estimation, which is fully described elsewhere18,29.
The ethics committee of each center approved the data collection. All patients or appropriate surrogates gave written informed consent to their participation in the study.
MRI acquisition
The MRI scans were acquired using 1.5 and 3 T scanners, including a high-resolution 3D T1-weighted magnetization prepared rapid gradient echo (MPRAGE) sequence and a fluid-attenuated inversion recovery (FLAIR) sequence, as described in more detail in previous publications18,30.
MRI visual assessment and automated preprocessing
Magnetic resonance imaging scans of the clinical cohort were rated centrally at Karolinska Institutet by a single experienced neuroradiologist, who had previously demonstrated excellent intra-rater and inter-rater reliability31. Ratings were performed fully blinded to sex, demographic, and clinical information, within the period of one year. Lobar atrophy was assessed with three visual rating scales based on T1-weighted images32. Frontal lobe atrophy was assessed with the global cortical atrophy-frontal subscale (GCA-F)33, medial temporal lobe atrophy with the medial temporal atrophy (MTA) scale34; and posterior cortex atrophy with the posterior atrophy (PA) scale35. We classified the visual ratings into normal/abnormal using established cutoffs based on normative data from 345 healthy individuals, as explained elsewhere32. In the case of the MTA scale, both age-adjusted and unadjusted scores were used, depending on the statistical analysis as explained below. Since age corrections for GCA-F and PA do not improve their diagnostic performance, unadjusted scores were used32. Procedures and methods are described in detail in previous publications28,32.
Regarding the research-oriented method for automated estimation of regional volume and cortical thickness, preprocessing was performed centrally at the Mayo Clinic as detailed previously36. Briefly, the unified segmentation algorithm in SPM12 (Wellcome Centre for Human Neuroimaging, London, UK) was used for volume estimation with the Mayo Clinic Adult Lifespan Template (MCALT, https://www.nitrc.org/projects/mcalt/) tissue priors and settings37. Regions of interest were propagated using Advanced Normalization Tools (ANTs)38. Altogether, 82 cortical, 12 subcortical, and 2 brainstem regions of interest (ROIs) were estimated (see ROIs in Supplementary Table 3). Next, ANTs DiReCT was used for the cortical thickness estimation of the cortical ROIs from the tissue probabilities39. Moreover, the estimated total intracranial volume was calculated from the tissue probabilities.
Statistical analyses
All the analyses were performed using R (The R Foundation for Statistical Computing; version 4.1.0).
Differences in demographic and clinical variables and biomarkers were assessed by t-test for continuous variables, Mann–Whitney U test for ordinal variables, and Pearson’s chi-squared test or Fisher’s exact test for categorical variables.
Regarding the clinical cohort, visual rating scales were analyzed using two types of binary logistic regression models for dichotomized variables as the outcome (0, normal visual rating score; 1, abnormal visual rating score). The first model tested for the effect of sex while controlling for the age effect. The second model tested for the interaction between sex and age. For the MTA scale, age-adjusted scores were used to test for the effect of sex, and the unadjusted scores were used to test for the interaction between sex and age.
Regarding the research-oriented automated method, two series of analyses were performed separately on volume and cortical thickness estimations after controlling for the effect of confounding variables. Control for confounding variables was done as follows. For analyses on the effect of sex, for each ROI we obtained residuals from a multiple linear regression model with age and center as predictors (model 1), separately for volume and cortical thickness as the outcome measures. Note that modeling the effect of center also corrected for the effect of field strength (3 T versus 1.5 T). For analyses investigating the interaction between sex and age, the residuals were obtained from a model with center as the only predictor (model 2), separately for volume and cortical thickness as the outcome measures. Total intracranial volume was included as an additional predictor in models 1 and 2 when volume was the outcome measure (but not when cortical thickness was the outcome measure). Supplementary models 1 and 2 including MMSE as an extra predictor were fitted for sensitivity analyses. Once confounding variables were controlled for by obtaining residuals as explained above, we conducted main analyses consisting of a first series of one-way ANOVA models with sex as the independent variable and volume or cortical thickness measures as dependent variables, with Cohen’s d for effect sizes; followed by a second series of multiple linear regression models with sex, age, and the interaction between sex and age as independent variables and volume or cortical thickness measures as dependent variables. For ROI analyses on volume and cortical thickness, we report uncorrected P-values followed by false discovery rate (FDR)40 adjusted P-values within the type of measure (volume or cortical thickness) and model (one-way ANOVA or multiple linear regression), to account for multiple testing.
Additionally, we followed main analyses with three further one-way ANOVAs to test whether our sex findings were independent of AD co-pathology, APOE genotype, and WMH burden as a common biomarker of cerebrovascular disease. These analyses were limited to the ROIs showing significant sex differences in the main analyses. For WMH burden and APOE genotype, we compared DLB males and DLB females on new residuals calculated using WMH burden or APOE genotype (separately) as extra predictors for model 1 explained above. This approach was not feasible for AD co-pathology due to the limited group size of females with a positive AD biomarker. Hence, we replicated the main one-way ANOVA in the subsample of DLB patients with AD biomarkers available (n = 122), and then we further replicated the analyses for the significant findings in the subsample of male and female DLB patients with a negative AD biomarker (n = 109). For these last one-way ANOVAs, we used the residuals from model 1 explained above.
We next investigated whether the findings from the models explained above were DLB-specific or merely reflect sex differences captured in a group of CU participants. To do that, we replicated all the analyses from the research-oriented cohort showing statistically significant sex differences or sex-by-age interactions using an external sex- and age-matched sample of CU participants, across the same regional MRI data as for the DLB patients.
Finally, we investigated whether the ROIs that resulted statistically significant in the between sex comparisons and sex-by-age interaction analyses described above were associated with clinical measures, using Pearson and point biserial correlations. For clinical measures, we initially considered the MMSE score as a continuous variable (Pearson correlation) and the four core clinical features as dichotomous variables (point biserial correlations). For ROI measures, we used residuals from model 1.
The significance level was set at P-value ≤ 0.05 in all statistical models.
Results
Sociodemographic and clinical characteristics
Table 1 shows that there were no statistically significant differences between probable DLB males and females in most of the demographic and clinical variables. Nonetheless, in the clinical cohort, DLB females were older than DLB males. In the research-oriented cohort, DLB males had a lower MMSE score than DLB females, and DLB males had a higher frequency of parkinsonism than DLB females. There were also statistically significant differences in the estimated total intracranial volume, with DLB females showing a smaller intracranial volume as expected. Therefore, further volumetric analyses were controlled for the estimated total intracranial volume, as explained in the Methods section.
Table 1.
Demographic and clinical characteristics of probable DLB males and females
| Clinical cohort (N = 327) | Research-oriented cohort (N = 165) | |||||||
|---|---|---|---|---|---|---|---|---|
| Males | Females | n, M/F | t-stat/χ2 (P-value) |
Males | Females | n, M/F | t-stat/χ2 (P-value) |
|
| Age, mean (SD) | 72.07 (8.21) | 74.81 (8.13) | 204/123 | 2.940 (0.004) | 68.73 (8.40) | 70.02 (9.03) | 119/46 | 0.867 (0.387) |
| Years of education, mean (SD, minimum - maximum) | 10.91 (4.00, 2 – 22) | 10.04 (3.75. 3 – 18) | 170/102 | 1.771 (0.078) | 13.71 (4.63, 5 – 22) | 13.41 (3.20, 6 – 22) | 119/46 | 0.446 (0.656) |
| Disease duration (years), mean (SD) | 3.23 (2.01) | 3.26 (2.58) | 90/27 | 0.070 (0.944) | 5.83 (4.63) | 5.02 (3.20) | 97/26 | 0.839 (0.403) |
| MMSE, mean (SD) | 22.58 (3.93) | 21.90 (4.33) | 201/121 | 1.451 (0.148) | 22.33 (5.47) | 24.44 (4.18) | 119/45 | 2.350 (0.020) |
| Visual hallucinations (presence) | 55.2% | 64.4% | 174/101 | 2.221 (0.136) | 53.4% | 58.7% | 116/46 | 0.366 (0.545) |
| Cognitive fluctuations (presence) | 82.7% | 87.5% | 110/80 | 0.816 (0.366) | 83.9% | 82.2% | 112/45 | 0.068 (0.795) |
| Parkinsonism (presence) | 75.3% | 80.7% | 166/88 | 0.945 (0.331) | 90.6% | 78.3% | 117/46 | 4.478 (0.034) |
| Probable RBD (presence) | 78% | 50.0% | 41/14 | 0.085 (0.052) | 80.2% | 71.8% | 111/39 | 1.183 (0.277) |
| Fazekas scale, n 0/1/2/3 | 10/70/30/35 | 7/38/28/20 | 145/93 | 6530.0 (0.662) | 4/25/10/5 | 1/6/4/1 | 44/12 | 249.5 (0.748) |
| WMH volume (cm3), mean (SD) | N/A | 16.01 (13.65) | 16.39 (12.26) | 119/46 | 0.166 (0.868) | |||
| TIV (mm3), mean (SD) | N/A | 1632.00 (134.99) | 1441.99 (117.27) | 119/46 | 8.397 (<0.001) | |||
| AD co-pathology (presence) | 14.0% | 15.4% | 43/13 | 1.000 (0.603) | 10.6% | 10.8% | 85/37 | 1.000 (0.598) |
| APOE ε4 carriers (presence) | 67.5% | 46.2% | 40/13 | 0.200 (0.147) | 45.2% | 38.6% | 115/44 | 0.561 (0.454) |
Statistically significant differences are shown in bold (P-value ≤ 0.05).
Abbreviations: F, females; M, males; MMSE, Mini-Mental State Examination; N/A, not applicable; RBD, rapid eye movement sleep behavior disorder; TIV, total intracranial volume; WMH, white matter hyperintensities; AD, Alzheimer’s disease; APOE, apolipoprotein E.
Visual rating scales of lobar atrophy (clinical cohort)
We found a significant sex effect on frontal atrophy: based on normative data from healthy individuals32 the odds for an abnormal score in GCA-F were statistically significantly higher for DLB males (40% had an abnormal GCA-F score) as compared to DLB females (28% had an abnormal GCA-F score, P-value = 0.004) (Table 2). Specifically, the odds for a male DLB patient to have an abnormal score in GCA-F was 2 times higher than for a female DLB patient (95% CI [1.28, 3.57]). For the MTA (36% abnormal in males, 41% in females) and PA (63% abnormal in males, 55% in females), there were no statistically significant sex differences. We did not find a significant interaction between sex and age in any of the three scales (Table 2).
Table 2.
Logistic regression models of visual rating scales
| Model 1: Sex effects | Effect | OR | SE | 95% CI | P-value | Abnormal score, n (%) | |
|---|---|---|---|---|---|---|---|
| Males | Females | ||||||
| GCA-F | Sex | 2.121 | 0.260 | [1.284, 3.566] | 0.004 | 81 (39.71%) | 34 (27.64%) |
| MTA | Sex | 0.804 | 0.234 | [0.508, 1.273] | 0.350 | 74 (36.27%) | 51 (41.46%) |
| PA | Sex | 1.459 | 0.237 | [0.917, 2.325] | 0.111 | 128 (62.75%) | 68 (55.28%) |
| Model 2: Sex-by-age interaction | Effect | OR | SE | 95% CI | P-value | Age of abnormal score, mean (SD) | |
| Males | Females | ||||||
| GCA-F | Sex*age | 1.018 | 0.034 | [0.951, 1.087] | 0.590 | 74.68 (6.66) | 77.06 (7.05) |
| MTA | Sex*age | 1.028 | 0.036 | [0.956, 1.103] | 0.451 | 73.43 (6.20) | 77.11 (6.72) |
| PA | Sex*age | 0.977 | 0.029 | [0.922, 1.034] | 0.417 | 72.45 (8.48) | 75.93 (8.24) |
Model 1 is a binary logistic regression model with visual rating scale scores as the dependent variable (normal versus abnormal) and both sex (variable of interest) and age (control variable) as the independent variables. For the MTA scale, the model included age-adjusted score as the dependent variable (normal versus abnormal) and sex (variable of interest). Model 2 is a binary logistic regression model with visual rating scale scores as the dependent variable (normal versus abnormal) and the interaction between sex and age (variable of interest), together with sex and age as the independent variables. For visual rating scales, values “0” and “1” correspond to “normal” and “abnormal” scores according to established cutoffs. For sex, values “0” and “1” correspond to male and female sex, respectively. Statistically significant effects are shown in bold (P-value ≤ 0.05).
Abbreviations: GCA-F, global cortical atrophy frontal-subscale; MTA, medial temporal atrophy scale; PA, posterior atrophy scale.
Automated estimations of regional atrophy (research-oriented cohort)
We found statistically significant smaller GM volumes in DLB males than in DLB females in the orbital part of the middle frontal cortex, as well as in the middle frontal, fusiform, middle occipital, middle temporal, and supramarginal cortices (Figure 1, P-value ≤ 0.05 in all measures; Supplementary Table 4). In contrast, DLB females had a smaller GM volume than DLB males in the right entorhinal cortex, as well as thinner olfactory cortices (Figure 1, P-value ≤ 0.05; Supplementary Table 3).
Figure 1.
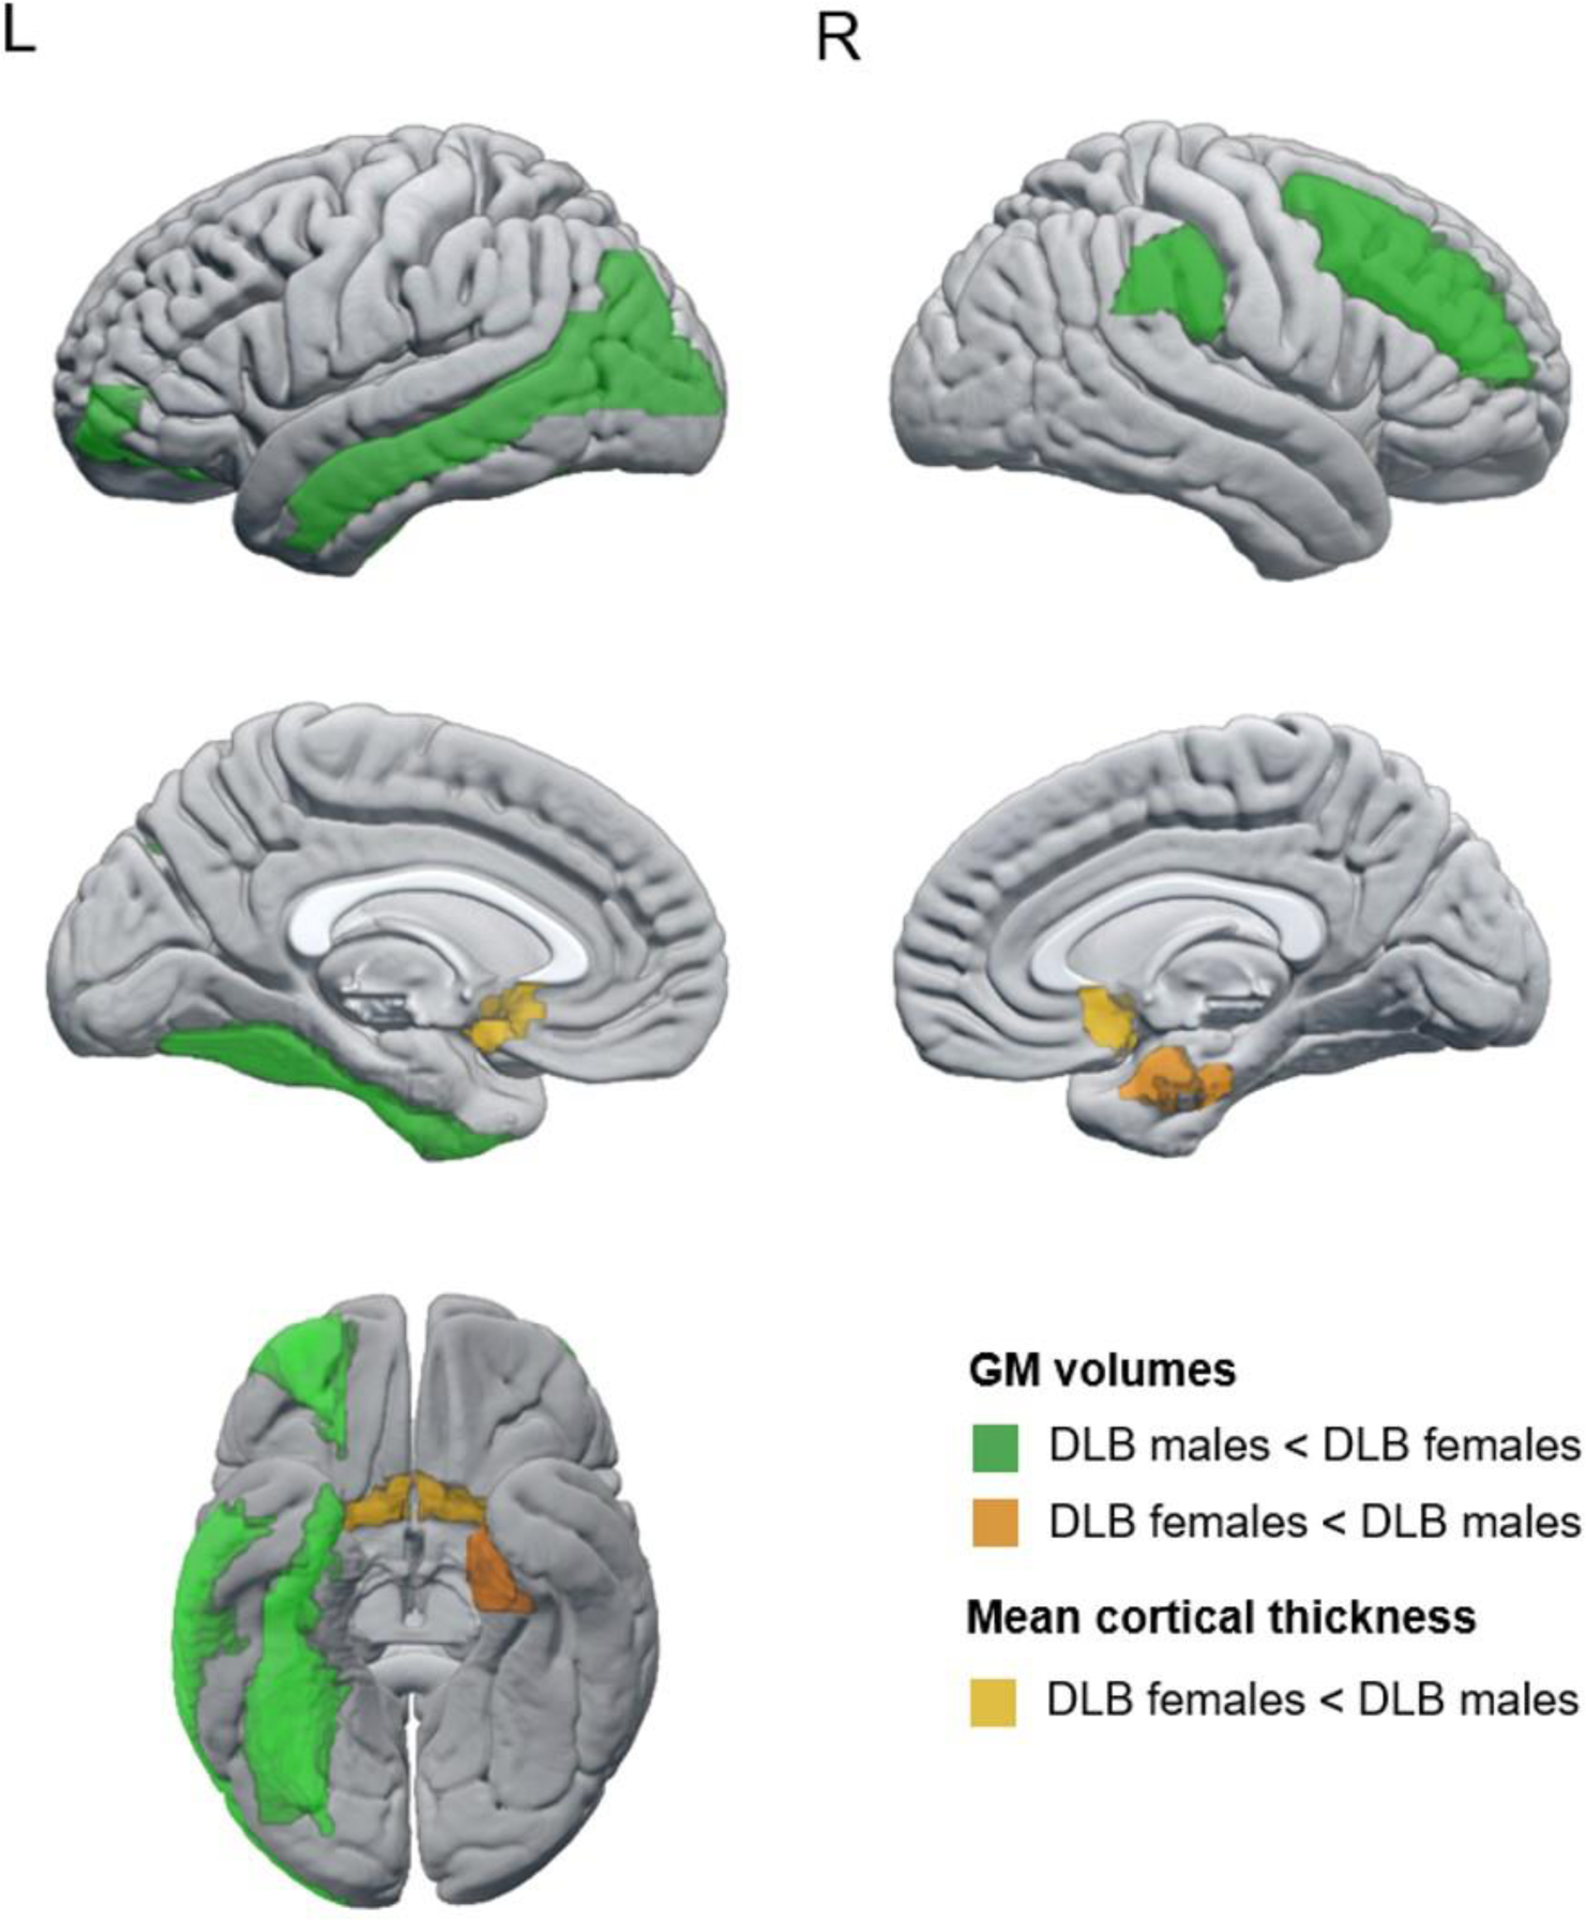
Regions showing statistically significant sex differences in automated estimations of regional atrophy in probable DLB. Regions colored in green showed a smaller GM volume in DLB males than in DLB females; regions colored in orange showed smaller/thinner estimations in DLB females than DLB males, the darker one for GM volumes and the lighter for mean cortical thickness.
Abbreviations: DLB, dementia with Lewy bodies; GM, gray matter; L, left; R, right.
We found statistically significant sex-by-age interactions in GM volume in the anterior cingulum, middle frontal, fusiform, supramarginal, and superior temporal cortices (Figure 2, Panel A; P-value ≤ 0.05; Table 3). There were also statistically significant sex-by-age interactions in cortical thickness in the angular, insular, superior occipital, and superior parietal cortices as well as in the precuneus (Figure 2, Panel A; P-value ≤ 0.05; Table 3). All these interactions showed that DLB males had significantly smaller GM volumes or thinner cortex than DLB females at younger ages, but sex differences were no longer significant at older ages (Figure 2, Panel B).
Figure 2.
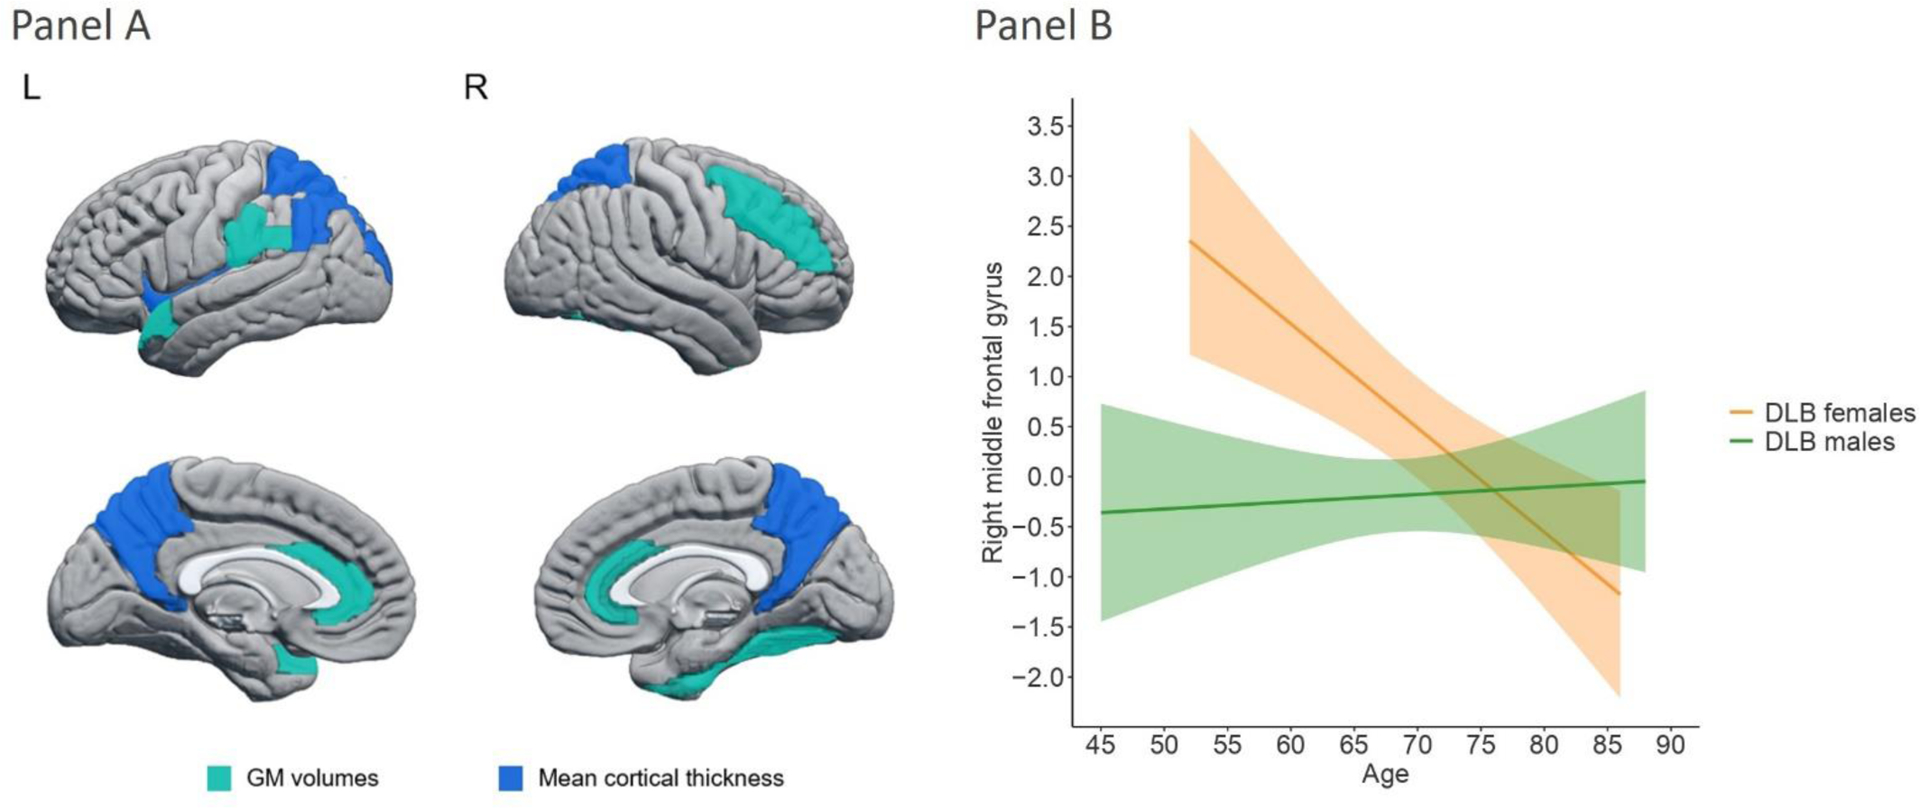
Panel A. Regions showing statistically significant sex-by-age interactions in automated estimations of regional atrophy in probable DLB. Regions colored in lighter blue correspond to GM volume estimations, and regions colored in darker blue correspond to mean cortical thickness estimations. Panel B. Significant sex-by-age interaction in the right middle frontal cortex (the region with the highest effect size, see Table 3). For all regions showing significant sex-by-age interaction, sex differences were statistically significant at younger ages and tended to be non-significant at older ages.
Abbreviations: GM, gray matter; L, left; R, right.
Table 3.
Significant sex and age interactions in automated estimations of regional atrophy in probable DLB
| B | SE | 95% CI | P-value | |
|---|---|---|---|---|
| Volumes | ||||
| Left anterior cingulum | 0.023 | 0.011 | [0.001, 0.046] | 0.035 |
| Right anterior cingulum | 0.032 | 0.015 | [0.002, 0.062] | 0.037 |
| Right middle frontal gyrus | 0.111 | 0.038 | [0.036, 0.186] | 0.004 |
| Right fusiform gyrus | 0.046 | 0.019 | [0.007, 0.084] | 0.020 |
| Left supramarginal gyrus | 0.033 | 0.016 | [0.002, 0.064] | 0.039 |
| Left superior temporal pole | 0.017 | 0.009 | [0.001, 0.035] | 0.046 |
| Mean cortical thickness | ||||
| Left angular gyrus | 0.016 | 0.006 | [0.004, 0.028] | 0.008 |
| Left insular cortex | 0.012 | 0.006 | [0.001, 0.024] | 0.040 |
| Left superior occipital gyrus | 0.015 | 0.005 | [0.005, 0.025] | 0.004 |
| Left superior parietal lobule | 0.014 | 0.006 | [0.003, 0.026] | 0.015 |
| Right superior parietal lobule | 0.012 | 0.006 | [0.001, 0.024] | 0.042 |
| Left precuneus | 0.016 | 0.007 | [0.003, 0.029] | 0.017 |
| Right precuneus | 0.014 | 0.006 | [0.001, 0.028] | 0.036 |
Multiple lineal regression analysis was used with each region of interest (ROI) as the dependent variable and sex, age, and the sex-by-age interaction as independent variables.
Abbreviations: CI, confidence interval.
The sensitivity analyses with MMSE score as an extra predictor showed that male DLB patients had smaller left middle occipital and right supramarginal volumes than female DLB patients (P-value ≤ 0.05). Further, female DLB patients had smaller right entorhinal cortex volume and thinner olfactory cortices than male DLB patients (P-value ≤ 0.05). All sex-by-age interactions remained significant after controlling for MMSE (P-value ≤ 0.05).
Concerning the follow-up models accounting for AD co-pathology, APOE genotype, and WMH burden, all the models for sex differences remained statistically significant except for the right middle frontal cortex when accounting for APOE genotype, and the left fusiform cortex when accounting for WMH burden. The sub-analysis for AD status reduced the sample from 165 to 122 participants due to missing data on biomarkers of AD. Hence, we first had to replicate our main analyses in the reduced cohort. These new analyses showed sex differences in 4 out of the 9 ROIs with statistically significant sex differences in the 165 cohort, including volume of left middle temporal, right supramarginal, and right entorhinal cortices, as well as thickness of left olfactory cortex (P-value ≤ 0.05). Starting the sub-analyses from those 4 ROIs, when we restricted the sample to male and female DLB patients with negative AD status (n = 109), the sex differences remained statistically significant for the 4 ROIs (P-value ≤ 0.05).
All significant ROIs reported in this section for sex differences and sex-by-age interactions were analysed in the CU group to clarify whether the findings are DLB-specific or merely reflect sex differences captured in the normal population. We found that CU females had a smaller GM volume than CU males only in the right entorhinal cortex (DLB males, mean = −0.083, SD = 0.270; DLB females, mean = 0.031, SD = 0.262; F = 6.112; P-value = 0.014). Otherwise, all findings reported above failed to be replicated in the CU group, suggesting that our findings are DLB-specific.
Correlations between regional atrophy and clinical measures
To ensure a proper fitting of the models, we excluded clinical measures that had less than 12 cases per sex group. Because of the high frequency of parkinsonism, cognitive fluctuations, and probable DLB in our research-oriented cohort, we did not have enough variability to model these variables, and our correlation analyses were thus limited to the MMSE and visual hallucinations. The results showed different correlations in male and female DLB patients. In male DLB patients, we observed that a smaller volume in the left middle temporal gyrus, left anterior cingulum, and right fusiform gyrus, as well as thinner bilateral olfactory cortices significantly correlated with lower MMSE scores (P-value ≤ 0.05, Supplementary Table 5). Further, a smaller volume in the orbital part of the left middle frontal gyrus and a thinner left olfactory cortex significantly correlated with the presence of visual hallucinations (P-value ≤ 0.05, Supplementary Table 5). In contrast, we found no statistically significant correlations between regional atrophy and clinical measures in female DLB patients.
Discussion
We investigated sex differences in brain atrophy in DLB. Using visual ratings and normative data from 345 healthy individuals32 we demonstrated frontal atrophy in 40% of male and 28% of female DLB patients, medial temporal atrophy in 36% of male and 41% of female DLB patients, and posterior atrophy in 63% of male and 55% of female DLB patients. These sex differences resulted statistically significant for frontal atrophy. We replicated this finding in a largely independent cohort using a research-oriented method for regional atrophy and demonstrated that the sex differences tend to disappear with increasing age, with atrophy levels converging in male and female DLB patients after the age of 75. Overall, our findings suggest more severe neurodegeneration in young DLB males, with no significant sex differences at older ages. This regional atrophy correlated with global cognitive impairment and visual hallucinations only in male DLB patients.
The greater frequency of abnormal scores in frontal atrophy visual ratings in DLB males replicates the finding from our previous study with a smaller sample25. Despite using data from the E-DLB, the statistical approach and focus differed between both studies. When explicitly testing for sex differences in our current study, DLB males showed greater frontal atrophy than DLB females. Visual ratings were interpreted clinically based on normative data from healthy individuals32. Hence, abnormal scores can be interpreted as atrophy. The clinician could expect that almost 40% of DLB males would display frontal atrophy, while DLB females would rarely show any frontal atrophy below the age of 70. This finding suggests that currently available cut-offs for frontal atrophy may need to be revisited for DLB and redefined by adjusting for sex and age, similar to previous studies in AD32. Furthermore, sex may interact with other factors such as education and disease duration, in driving frontal atrophy25. These data jointly encourage following up on sex differences in visual ratings of frontal atrophy. Advancing our current understanding of sex differences could optimize interpretations in clinical workups and enhance the current role of structural MRI in the diagnostic criteria of DLB41.
We replicated the clinical results in a largely independent cohort using automated estimations of volume and cortical thickness. We found a smaller GM volume in male than female DLB patients in several frontal, temporal, parietal, and occipital regions. In contrast, DLB females showed a smaller volume than DLB males in the right entorhinal cortex and thinner olfactory cortices. None of these sex differences resulted significant in the CU group, except for the right entorhinal cortex, indicating that our findings likely reflect sex differences that are disease-related. Only one previous publication explored sex differences in regional atrophy, in 16 DLB patients23. The authors found a smaller GM volume in male compared with female DLB patients in frontal and parietal regions. By increasing the sample size to 165 DLB patients, our study showed smaller GM volumes in male compared to female DLB patients not only in frontal and parietal regions but also in temporal and occipital cortices. These findings support a cortical vulnerability in DLB males, not only restricted to anterior brain areas. While effect sizes were comparable across areas, it seems that visual ratings only capture sex differences in frontal lobes, while automated methods may be more sensitive to detect differences across the cortical mantle. Nonetheless, frontal regions were more represented in the findings from the automated method, which may explain the sensitivity of the GCA-F scale.
We observed thinner olfactory cortex in DLB females. Olfactory function impairment has been described as a potential hallmark to discriminate between AD and DLB42–44. Notwithstanding, previous studies reported no sex differences in odor identification in DLB42,44. A promising prospect would be to investigate sex differences in DLB in olfactory identification and their structural correlates. This avenue is of interest to advance our current knowledge about the less investigated “olfactory bulb only” pathologic DLB subtype45. We recently showed that the olfactory cortex is one of the main discriminative regions between subtypes with widespread predominant cortical and predominant fronto-occipital atrophy46. The interplay between sex, age, and heterogeneity in regional atrophy and clinical phenotype in DLB deserves future investigation.
We also found that DLB females had a smaller volume in the right entorhinal cortex. Atrophy in medial temporal regions in DLB females could be explained by their higher frequency of AD co-pathology13. However, this explanation is unlikely in our cohort since we did not observe any statistically significant sex difference in AD biomarkers. Instead, our replication analyses using an age- and sex-matched group of CU participants revealed a smaller volume in the right entorhinal cortex in CU females compared with CU males. Previous studies reported the same result in CU participants47,48. Hence, one could interpret that the sex differences for the right entorhinal cortex in our cohort are likely not specific to DLB but rather reflect a common finding in the normal population.
For all findings on sex differences, we explored the potential contribution of co-pathologies. In this regard, we replicated analyses restricting the sample to patients with negative AD biomarkers. We also adjusted our statistical analyses for APOE genotype due to its association with AD pathology and temporal atrophy. Since WMH burden also correlates with GM neurodegeneration in DLB18,19, we also adjusted our models for WMH. Many of the brain regions with significant sex differences survived these sensitivity analyses, suggesting that the reported sex differences are independent of these co-pathologies and APOE genotype.
An important contribution of this study is the sex-by-age interaction, particularly in the right middle frontal gyrus. In this region, DLB males had similar GM volume across ages, while DLB females showed a steeper slope with a smaller GM volume at older ages, converging with male DLB patients around the age of 75. This finding expands our previous report, which showed the combined contribution of male sex and older age to frontal atrophy in 86 DLB patients25. In the current study, we demonstrated a statistical interaction and circumscribed the influence of sex and age on a specific frontal region using a more sensitive method in a largely independent cohort of 165 DLB patients. This finding reinforces the contribution of the male sex to frontal atrophy in DLB and includes the consideration of sex differences minimizing with increasing age. The shallow slope for male patients in the interaction plots could reflect a plateau level of high atrophy across all sampled ages since around 40% of male DLB patients demonstrated frontal atrophy32.
We found other similar sex-by-age interactions including volume in frontal (bilateral anterior cingulate gyri), temporal (right fusiform gyrus and left superior temporal pole), and parietal (left supramarginal gyrus) regions. In addition, the mean cortical thickness analyses showed significant interactions in occipital (left superior occipital gyrus), left insular, and parietal (left angular gyrus, superior parietal lobules, and bilateral precuneus) regions. These interactions may reflect cortical neurodegeneration initiated at early stages in DLB males, beyond frontal areas. A study on individuals with isolated RBD, a prodromal phase of alpha-synucleinopathy, showed cortical GM loss at that early phase49. This finding is coherent with an earlier onset and flatter disease course in DLB males, opposite to a more aggressive disease course upon dementia diagnosis in DLB females12. Future longitudinal studies should confirm if male patients display more brain atrophy earlier than female patients.
One could speculate that the steeper slope of brain atrophy in DLB females could be explained by neuroprotective factors. Perhaps, hormonal levels may delay atrophy in females50. The reduction of estrogen levels after menopause and with aging may increase the vulnerability to pathology and neurodegeneration in females. In a study about the effects of menopausal hormone therapy, we found superior and middle frontal gyri volume preservation after seven years in the treatment group (17β-estradiol) compared with placebo51. The maintenance of the dorsolateral prefrontal cortex correlated significantly with lower β-amyloid deposition. That finding highlights the sensitivity of frontal areas to estradiol neuroprotection. However, we acknowledge that the exact biological mechanisms underlying sex differences in DLB are largely unknown. Therefore, the interpretation of neuroprotective factors remains speculative, but it may encourage future studies on hormones and neurodegeneration in DLB and other diseases.
We also performed sensitivity analyses adjusting for MMSE scores. Several sex differences remained significant except mainly for frontal regions, which may suggest that the worse global cognitive performance in male DLB patients could primarily be associated with frontal atrophy. In contrast, all sex-by-age interactions remained significant.
Finally, correlation analyses showed that in male DLB patients greater GM atrophy in the middle temporal gyrus, olfactory cortex, anterior cingulum, and fusiform gyrus was associated with lower MMSE scores,and atrophy in the middle frontal gyrus and olfactory cortex was associated with the presence of visual hallucinations. A previous study demonstrated an association between atrophy in the middle frontal cortex and the presence of visual hallucinations in DLB52 Our study expands this previous finding by showing that this association is more prominent in male DLB patients.
A strength of this study is the dual analysis and validation of sex differences in clinical and research-oriented brain atrophy measures in two largely independent multi-center DLB cohorts. Besides, this is the first report on sex-by-age interactions in brain atrophy, providing findings that may have implications for clinical workup and treatment monitoring in DLB. Moreover, our automated analyses replicated the findings from visual ratings, which were assessed against normative data from 345 healthy individuals32. Our findings do not seem to reflect the sex differences reported in normal aging53,54 and were not replicated in a group of CU participants except for the right entorhinal cortex, which indicates that our findings are likely disease-specific. Future studies should investigate sex-specific neurodegenerative trajectories in DLB from early stages, including prodromal DLB. Longitudinal atrophy patterns could improve our understanding of the role of sex along the disease course in DLB. For instance, previous studies in PD showed variation in sex differences throughout the disease course55–59. Another limitation is that we estimated cognitive impairment with the MMSE score, which is a rough measure of global cognitive performance. Moreover, data on ethnicity and race was missing in our cohort, although we acknowledge that racial-ethnic diversity should be considered in future research on sex differences in DLB60.
In conclusion, male DLB patients have a more widespread cortical atrophy pattern than female DLB patients, mainly in frontal regions, which correlates with global cognitive impairment and the presence of visual hallucinations. However, these sex differences are minimized with increasing age, especially after the age of 70. These findings may have implications for the interpretation of MRI markers in clinical workup and as an endpoint in clinical trials. The characterization of sex differences from early disease stages emerges as a relevant prospect for precision medicine approaches.
Supplementary Material
Acknowledgements and Funding Sources
This work was supported by the National Institutes of Health (U01-NS100620, P50-AG016574, U01-AG006786, R37-AG011378, R01-AG041851, R01-AG040042, C06-RR018898 and R01-NS080820), Foundation Dr. Corinne Schuler, the Mangurian Foundation for Lewy Body Research, the Elsie and Marvin Dekelboum Family Foundation, the Little Family Foundation, the Robert H. and Clarice Smith and Abigail Van Buren Alzheimer’s Disease Research Program, the Western Norway Regional Health Authority, the Swedish Foundation for Strategic Research (SSF), the Swedish Research Council (VR), Karolinska Institutet travel grants, Center for Innovative Medicine (CIMED), the Swedish Brain funding (Hjärnfonden), the Swedish Alzheimer’s funding (Alzheimerfonden), ALF Medicine, the Swedish Dementia funding (Demensförbundet), the Foundation for Geriatric Diseases at Karolinska Institutet, and the Projet Hospitalier de Recherche Clinique (PHRC, IDCRB 2012-A00992-41) and Fondation Université de Strasbourg.
This paper represents independent research [part] funded by the National Institute for Health Research (NIHR) Biomedical Research Center at South London and Maudsley NHS Foundation Trust and King’s College London to D.A. The views expressed are those of the author(s) and not necessarily those of the NHS, the NIHR, or the Department of Health and Social Care.
The work was also supported by by the Ministry of Health of the Czech Republic (grant NU20-04-00294) and LX22NPO5107 (MEYS): Funded by European Union – Next Generation EU. We acknowledge the contribution of the core facility MAFIL of CEITEC supported by the MEYS CR (LM2018129 Czech-BioImaging).
J.O. was supported by a 2018 fellowship from the Spanish Ministry of Science, Innovation and Universities; and co-financed by the European Social Fund (PRE2018-086675). Z.N. is supported by The Grant Agency of Charles University (grant PRIMUS 22/MED/011). The sponsors played no role in the study design; in the collection, analysis, and interpretation of data; in the writing of the report; or in the decision to submit the article for publication. K.O. is funded by the Western Norway Regional Health Authority by Postdoc-grant 912152. D.A. is a Royal Society Wolfson Research Merit Award Holder and would like to thank the Wolfson Foundation and the Royal Society for their support. E.W. and D.F. are supported by the Swedish Foundation for Strategic Research (SSF); the Strategic Research Program in Neuroscience at Karolinska Institutet (StratNeuro); the Swedish Research Council (VR); the Åke Wiberg Foundation; Hjärnfonden; Alzheimerfonden; Demensfonden; and Birgitta och Sten Westerberg.
Conflicts
J.O., A.H., C.G.S., Z.N., A.I., P. D-G, S.A.P., K.O., MCG, N.P., F.B., A.W.L., J.H., A.P., I.R., F.M., L.B., F.M.; M.G.K., J-P T., J.S., Z.W., A.A., B.S., C.J., E.W., B.F.B., and D.F. report no disclosures relevant to the manuscript.
V.J.L. consults for Bayer Schering Pharma, Piramal Life Sciences, Life Molecular Imaging, Eisai Inc., AVID Radiopharmaceuticals, and Merck Research and receives research support from GE Healthcare, Siemens Molecular Imaging, AVID Radiopharmaceuticals and the NIH (NIA, NCI). F.B. has served as national coordinator and principal investigator for clinical trials sponsored by Biogen, Roche, Axovant, and Eisai. B.F.B. has served as an investigator for clinical trials sponsored by Biogen and Alector. He receives royalties from the publication of a book entitled Behavioral Neurology of Dementia (Cambridge Medicine, 2017), serves on the Scientific Advisory Board of the Tau Consortium, and receives research support from NIH, the Mayo Clinic Dorothy and Harry T. Mangurian Jr. Lewy Body Dementia Program, the Little Family Foundation, and the Ted Turner and Family Foundation LBD Functional Genomics Program. D.A. has received research support and/or honoraria from AstraZeneca, H. Lundbeck, Novartis Pharmaceuticals, and GE Health, and served as a paid consultant for H. Lundbeck, Eisai, and Evonik. K. K. serves on the data safety monitoring board for Takeda Global Research and Development Center, Inc.; receives research support from Avid Radiopharmaceuticals and Eli Lilly and receives funding from NIH and Alzheimer’s Drug Discovery Foundation. All authors declare no competing interests.
Footnotes
Consent Statement
All patients or appropriate surrogates gave written informed consent to their participation in the study.
References
- 1.Podcasy JL, Epperson CN. Considering sex and gender in Alzheimer disease and other dementias. Dialogues Clin Neurosci. 2016;18(4):437–446. doi: 10.31887/DCNS.2016.18.4/cepperson [DOI] [PMC free article] [PubMed] [Google Scholar]
- 2.Cerri S, Mus L, Blandini F. Parkinson’s Disease in Women and Men: What’s the Difference? J Parkinsons Dis. 2019;9(3):501–515. doi: 10.3233/JPD-191683 [DOI] [PMC free article] [PubMed] [Google Scholar]
- 3.Miller VM, Rocca WA, Faubion SS. Sex differences: Research, precision medicine, and the future of women’s health. J Womens Health (Larchmt). 2015;24(12):969–971. doi: 10.1089/jwh.2015.5498 [DOI] [PMC free article] [PubMed] [Google Scholar]
- 4.Dimech AS, Ferretti MT, Sandset EC, Chadha AS. The role of sex and gender differences in precision medicine: the work of the Women’s Brain Project. Eur Heart J. 2021;42(34):3215–3217. doi: 10.1093/eurheartj/ehab297 [DOI] [PubMed] [Google Scholar]
- 5.Fereshtehnejad SM, Religa D, Westman E, Aarsland D, Lökk J, Eriksdotter M. Demography, diagnostics, and medication in dementia with Lewy bodies and Parkinson’s disease with dementia: data from the Swedish Dementia Quality Registry (SveDem). Neuropsychiatr Dis Treat. 2013;9:927–935. doi: 10.2147/NDT.S45840 [DOI] [PMC free article] [PubMed] [Google Scholar]
- 6.Kane JPM, Surendranathan A, Bentley A, et al. Clinical prevalence of Lewy body dementia. Alzheimer’s Res Ther. 2018;10:19. doi: 10.1186/s13195-018-0350-6 [DOI] [PMC free article] [PubMed] [Google Scholar]
- 7.Gan J, Chen Z, Shi Z, et al. Sex differences in clinical cognitive impairment with Lewy bodies: a Chinese multicenter study. Biol Sex Differ. 2022;13(55). doi: 10.1186/s13293-022-00464-w [DOI] [PMC free article] [PubMed] [Google Scholar]
- 8.Mouton A, Blanc F, Gros A, et al. Sex ratio in dementia with Lewy bodies balanced between Alzheimer’s disease and Parkinson’s disease dementia: a cross-sectional study. Alzheimer’s Res Ther. 2018;10:92. doi: 10.1186/s13195-018-0417-4 [DOI] [PMC free article] [PubMed] [Google Scholar]
- 9.Utsumi K, Fukatsu R, Yamada R, Takamaru Y, Hara Y, Yasumura S. Characteristics of initial symptoms and symptoms at diagnosis in probable dementia with Lewy body disease: incidence of symptoms and gender differences. Psychogeriatrics. 2020;20(5):737–745. doi: 10.1111/psyg.12586 [DOI] [PubMed] [Google Scholar]
- 10.Bayram E, Coughlin DG, Banks SJ, Litvan I. Sex differences for phenotype in pathologically defined dementia with Lewy bodies. J Neurol Neurosurg Psychiatry. 2021;92(7):745–750. doi: 10.1136/jnnp-2020-325668 [DOI] [PMC free article] [PubMed] [Google Scholar]
- 11.Chiu PY, Teng PR, Wei CY, Wang CW, Tsai CT. Gender difference in the association and presentation of visual hallucinations in dementia with Lewy bodies: a cross-sectional study. Int J Geriatr Psychiatry. 2018;33(1):193–199. doi: 10.1002/gps.4706 [DOI] [PubMed] [Google Scholar]
- 12.van de Beek M, Babapour Mofrad R, van Steenoven I, et al. Sex-specific associations with cerebrospinal fluid biomarkers in dementia with Lewy bodies. Alzheimer’s Res Ther. 2020;12:44. doi: 10.1186/s13195-020-00610-9 [DOI] [PMC free article] [PubMed] [Google Scholar]
- 13.Barnes LL, Lamar M, Schneider JA. Sex differences in mixed neuropathologies in community-dwelling older adults. Brain Res. 2019;1719:11–16. doi: 10.1016/j.brainres.2019.05.028 [DOI] [PMC free article] [PubMed] [Google Scholar]
- 14.Fujimi K, Sasaki K, Noda K, et al. Clinicopathological Outline of Dementia with Lewy Bodies Applying the Revised Criteria: The Hisayama Study. Brain Pathol. 2008;18(3):317–325. doi: 10.1111/j.1750-3639.2008.00169.x [DOI] [PMC free article] [PubMed] [Google Scholar]
- 15.Chiu SY, Wyman-Chick KA, Ferman TJ, et al. Sex differences in dementia with Lewy bodies: Focused review of available evidence and future directions. Parkinsonism Relat Disord. 2023;107:105285. doi: 10.1016/j.parkreldis.2023.105285 [DOI] [PMC free article] [PubMed] [Google Scholar]
- 16.Ferreira D, Przybelski SA, Lesnick TG, et al. β-Amyloid and tau biomarkers and clinical phenotype in dementia with Lewy bodies. Neurology. 2020;95(24):e3257–e3268. doi: 10.1212/WNL.0000000000010943 [DOI] [PMC free article] [PubMed] [Google Scholar]
- 17.Ghebremedhin E, Rosenberger A, Rüb U, et al. Inverse Relationship Between Cerebrovascular Lesions and Severity of Lewy Body Pathology in Patients With Lewy Body Diseases. J Neuropathol Exp Neurol. 2010;69(5):442–448. doi: 10.1097/NEN.0b013e3181d88e63 [DOI] [PubMed] [Google Scholar]
- 18.Ferreira D, Nedelska Z, Graff-Radford J, et al. Cerebrovascular disease, neurodegeneration, and clinical phenotype in dementia with Lewy bodies. Neurobiol Aging. 2021;105:252–261. doi: 10.1016/j.neurobiolaging.2021.04.029 [DOI] [PMC free article] [PubMed] [Google Scholar]
- 19.Ferreira D, Przybelski SA, Lesnick TG, et al. Cross-sectional Associations of β-Amyloid, Tau, and Cerebrovascular Biomarkers With Neurodegeneration in Probable Dementia With Lewy Bodies. Neurology. Published online 2022. doi: 10.1212/WNL.0000000000201579 [DOI] [PMC free article] [PubMed] [Google Scholar]
- 20.Bayram E, Coughlin DG, Litvan I. Sex Differences for Clinical Correlates of Alzheimer’s Pathology in People with Lewy Body Pathology. Mov Disord. 2022;37(7):1505–1515. doi: 10.1002/mds.29044 [DOI] [PMC free article] [PubMed] [Google Scholar]
- 21.Boccalini C, Nicastro N, Peretti DE, Caminiti SP, Perani D, Garibotto V. Sex differences in dementia with Lewy bodies: an imaging study of neurotransmission pathways. Eur J Nucl Med Mol Imaging. 2023;50(7):2036–2046. doi: 10.1007/s00259-023-06132-4 [DOI] [PMC free article] [PubMed] [Google Scholar]
- 22.Caminiti SP, Boccalini C, Nicastro N, Garibotto V, Perani D. Sex differences in brain metabolic connectivity architecture in probable dementia with Lewy bodies. Neurobiol Aging. 2023;126:14–24. doi: 10.1016/j.neurobiolaging.2023.02.004 [DOI] [PubMed] [Google Scholar]
- 23.Ballmaier M, O’Brien JT, Burton EJ, et al. Comparing gray matter loss profiles between dementia with Lewy bodies and Alzheimer’s disease using cortical pattern matching: diagnosis and gender effects. Neuroimage. 2004;23(1):325–335. doi: 10.1016/j.neuroimage.2004.04.026 [DOI] [PubMed] [Google Scholar]
- 24.Oppedal K, Borda MG, Ferreira D, Westman E, Aarsland D. European DLB consortium: diagnostic and prognostic biomarkers in dementia with Lewy bodies, a multicenter international initiative. Neurodegener Dis Manag. 2019;9(5):247–250. doi: 10.2217/nmt-2019-0016 [DOI] [PubMed] [Google Scholar]
- 25.Abdelnour C, Ferreira D, Oppedal K, et al. The combined effect of amyloid-β and tau biomarkers on brain atrophy in dementia with Lewy bodies. Neuroimage Clin. 2020;27:102333. doi: 10.1016/j.nicl.2020.102333 [DOI] [PMC free article] [PubMed] [Google Scholar]
- 26.Kantarci K, Lowe VJ, Boeve BF, et al. AV-1451 tau and β-amyloid positron emission tomography imaging in dementia with Lewy bodies. Ann Neurol. 2017;81(1):58–67. doi: 10.1002/ana.24825 [DOI] [PMC free article] [PubMed] [Google Scholar]
- 27.McKeith IG, Dickson DW, Lowe J, et al. Diagnosis and management of dementia with Lewy bodies: Third report of the DLB Consortium. Neurology. 2005;65(12):1863–1872. doi: 10.1212/01.wnl.0000187889.17253.b1 [DOI] [PubMed] [Google Scholar]
- 28.Fazekas F, Chawluk JB, Alavi A, Hurtig HI, Zimmerman RA. MR Signal Abnormalities at 1.5 T in Alzheimer’s Dementia and Normal Aging. AJNR. 1987;8(3):421–426. [DOI] [PubMed] [Google Scholar]
- 29.Kantarci K, Petersen RC, Przybelski SA, et al. Hippocampal volumes, proton magnetic resonance spectroscopy metabolites, and cerebrovascular disease in mild cognitive impairment subtypes. Arch Neurol. 2008;65(12):1621–1628. doi: 10.1001/archneur.65.12.1621 [DOI] [PMC free article] [PubMed] [Google Scholar]
- 30.Oppedal K, Ferreira D, Cavallin L, et al. A signature pattern of cortical atrophy in dementia with Lewy bodies: A study on 333 patients from the European DLB consortium. Alzheimers Dement. 2019;15(3):400–409. doi: 10.1016/j.jalz.2018.09.011 [DOI] [PubMed] [Google Scholar]
- 31.Ferreira D, Verhagen C, Hernández-Cabrera JA, et al. Distinct subtypes of Alzheimer’s disease based on patterns of brain atrophy: longitudinal trajectories and clinical applications. Sci Rep. 2017;7:46263. doi: 10.1038/srep46263 [DOI] [PMC free article] [PubMed] [Google Scholar]
- 32.Ferreira D, Cavallin L, Larsson EM, et al. Practical cut-offs for visual rating scales of medial temporal, frontal and posterior atrophy in Alzheimer’s disease and mild cognitive impairment. J Intern Med. 2015;278(3):277–290. doi: 10.1111/joim.12358 [DOI] [PubMed] [Google Scholar]
- 33.Ferreira D, Cavallin L, Granberg T, et al. Quantitative validation of a visual rating scale for frontal atrophy: associations with clinical status, APOE e4, CSF biomarkers and cognition. Eur Radiol. 2016;26(8):2597–2610. doi: 10.1007/s00330-015-4101-9 [DOI] [PubMed] [Google Scholar]
- 34.Scheltens P, Leys D, Barkhof F, et al. Atrophy of medial temporal lobes on MRI in “probable” Alzheimer’s disease and normal ageing: diagnostic value and neuropsychological correlates. J Neurol Neurosurg Psychiatry. 1992;55(10):967–972. doi: 10.1136/jnnp.55.10.967 [DOI] [PMC free article] [PubMed] [Google Scholar]
- 35.Koedam ELGE, Lehmann M, van der Flier WM, et al. Visual assessment of posterior atrophy development of a MRI rating scale. Eur Radiol. 2011;21(12):2618–2625. doi: 10.1007/s00330-011-2205-4 [DOI] [PMC free article] [PubMed] [Google Scholar]
- 36.Schwarz CG, Gunter JL, Wiste HJ, et al. A large-scale comparison of cortical thickness and volume methods for measuring Alzheimer’s disease severity. Neuroimage Clin. 2016;11:802–812. doi: 10.1016/j.nicl.2016.05.017 [DOI] [PMC free article] [PubMed] [Google Scholar]
- 37.Schwarz CG, Gunter JL, Ward CP, et al. The Mayo Clinic Adult Lifespan Template: Better Quantification Across the Lifespan. In: Alzheimer’s Association International Conference (AAIC): Poster Presentations. Vol 13. ; 2017:792. doi: 10.1016/j.jalz.2017.06.1071 [DOI] [Google Scholar]
- 38.Avants BB, Epstein CL, Grossman M, Gee JC. Symmetric diffeomorphic image registration with cross-correlation: evaluating automated labeling of elderly and neurodegenerative brain. Med Image Anal. 2008;12(1):26–41. doi: 10.1016/j.media.2007.06.004 [DOI] [PMC free article] [PubMed] [Google Scholar]
- 39.Das SR, Avants BB, Grossman M, Gee JC. Registration based cortical thickness measurement. Neuroimage. 2009;45(3):867–879. doi: 10.1016/j.neuroimage.2008.12.016 [DOI] [PMC free article] [PubMed] [Google Scholar]
- 40.Genovese CR, Lazar NA, Nichols T. Thresholding of statistical maps in functional neuroimaging using the false discovery rate. Neuroimage. 2002;15(4):870–878. doi: 10.1006/nimg.2001.1037 [DOI] [PubMed] [Google Scholar]
- 41.Ferreira D. Structural imaging in dementia with Lewy bodies: the potential of multivariate data analysis. Psychiatry Res Neuroimaging. 2020;306:111180. doi: 10.1016/j.pscychresns.2020.111180 [DOI] [PubMed] [Google Scholar]
- 42.Williams SS, Williams J, Combrinck M, Christie S, Smith AD, McShane R. Olfactory impairment is more marked in patients with mild dementia with Lewy bodies than those with mild Alzheimer disease. J Neurol Neurosurg Psychiatry. 2009;80(6):667–670. doi: 10.1136/jnnp.2008.155895 [DOI] [PubMed] [Google Scholar]
- 43.Beach TG, Adler CH, Zhang N, et al. Severe hyposmia distinguishes neuropathologically confirmed dementia with Lewy bodies from Alzheimer’s disease dementia. PLoS One. 2020;15(4):e0231720. doi: 10.1371/journal.pone.0231720 [DOI] [PMC free article] [PubMed] [Google Scholar]
- 44.Thomas AJ, Hamilton CA, Barker S, et al. Olfactory impairment in mild cognitive impairment with Lewy bodies and Alzheimer’s disease. Int Psychogeriatr. 2022;34(6):585–592. doi: 10.1017/S1041610221001265 [DOI] [PubMed] [Google Scholar]
- 45.McKeith IG, Boeve BF, Dickson DW, et al. Diagnosis and management of dementia with Lewy bodies: Fourth consensus report of the DLB Consortium. Neurology. 2017;89(1):88–100. doi: 10.1212/WNL.0000000000004058 [DOI] [PMC free article] [PubMed] [Google Scholar]
- 46.Inguanzo A, Poulakis K, Mohanty R, et al. MRI data-driven clustering reveals different subtypes of Dementia with Lewy bodies. npj Parkinsons Dis. Published online 2023. [DOI] [PMC free article] [PubMed] [Google Scholar]
- 47.Garcia-Falgueras A, Junque C, Giménez M, Caldú X, Segovia S, Guillamon A. Sex differences in the human olfactory system. Brain Res. 2006;1116:103–111. doi: 10.1016/j.brainres.2006.07.115 [DOI] [PubMed] [Google Scholar]
- 48.Alotaibi MM, De Marco M, Venneri A. Sex differences in olfactory cortex neuronal loss in aging. Front Hum Neurosci. 2023;17. doi: 10.3389/fnhum.2023.1130200 [DOI] [PMC free article] [PubMed] [Google Scholar]
- 49.Campabadal A, Segura B, Junque C, Iranzo A. Structural and functional magnetic resonance imaging in isolated REM sleep behavior disorder: A systematic review of studies using neuroimaging software. Sleep Med Rev. 2021;59:101495. doi: 10.1016/j.smrv.2021.101495 [DOI] [PubMed] [Google Scholar]
- 50.Bustamante-Barrientos FA, Méndez-Ruette M, Ortloff A, et al. The impact of estrogen and estrogen-like molecules in neurogenesis and neurodegeneration: Beneficial or harmful? Front Cell Neurosci. 2021;15(636176). doi: 10.3389/fncel.2021.636176 [DOI] [PMC free article] [PubMed] [Google Scholar]
- 51.Kantarci K, Tosakulwong N, Lesnick TG, et al. Brain structure and cognition 3 years after the end of an early menopausal hormone therapy trial. Neurology. 2018;90(16). doi: 10.1212/WNL.0000000000005325 [DOI] [PMC free article] [PubMed] [Google Scholar]
- 52.Pezzoli S, Cagnin A, Antonini A, Venneri A. Frontal and subcortical contribution to visual hallucinations in dementia with Lewy bodies and Parkinson’s disease. Postgrad Med. 2019;131(7):509–522. doi: 10.1080/00325481.2019.1656515 [DOI] [PubMed] [Google Scholar]
- 53.Ritchie SJ, Cox SR, Shen X, et al. Sex Differences in the Adult Human Brain: Evidence from 5216 UK Biobank Participants. Cereb Cortex. 2018;28(8):2959–2975. doi: 10.1093/cercor/bhy109 [DOI] [PMC free article] [PubMed] [Google Scholar]
- 54.Christova P, Georgopoulos AP. Differential reduction of gray matter volume with age in 35 cortical areas in men (more) and women (less). J Neurophysiol. 2023;129(4):894–899. doi: 10.1152/jn.00066.2023 [DOI] [PMC free article] [PubMed] [Google Scholar]
- 55.Yadav SK, Kathiresan N, Mohan S, et al. Gender-based analysis of cortical thickness and structural connectivity in Parkinson’s disease. J Neurol. 2016;263(11):2308–2318. doi: 10.1007/s00415-016-8265-2 [DOI] [PMC free article] [PubMed] [Google Scholar]
- 56.Tremblay C, Abbasi N, Zeighami Y, et al. Sex effects on brain structure in de novo Parkinson’s disease: A multimodal neuroimaging study. Brain. 2020;143(10):3052–3066. doi: 10.1093/brain/awaa234 [DOI] [PubMed] [Google Scholar]
- 57.Oltra J, Uribe C, Campabadal A, et al. Sex differences in brain and cognition in de novo Parkinson’s Disease. Front Aging Neurosci. 2021;13:791532. doi: 10.3389/fnagi.2021.791532 [DOI] [PMC free article] [PubMed] [Google Scholar]
- 58.Oltra J, Segura B, Uribe C, et al. Sex differences in brain atrophy and cognitive impairment in Parkinson’s disease patients with and without probable rapid eye movement sleep behavior disorder. J Neurol. 2022;269:1591–1599. doi: 10.1007/s00415-021-10728-x [DOI] [PMC free article] [PubMed] [Google Scholar]
- 59.Li H, Jia X, Chen M, Jia X, Yang Q. Sex differences in brain structure in de novo Parkinson’s disease: a cross-sectional and longitudinal neuroimaging study. J Parkinsons Dis. Published online 2023. doi: 10.3233/JPD-225125 [DOI] [PMC free article] [PubMed] [Google Scholar]
- 60.Kurasz AM, Smith GE, McFarland MG, Armstrong MJ, O’Bryant S. Ethnoracial Differences in Lewy Body Diseases with Cognitive Impairment. J Alzheimer’s Dis. 2020;77(1):165–174. doi: 10.3233/JAD-200395 [DOI] [PMC free article] [PubMed] [Google Scholar]
Associated Data
This section collects any data citations, data availability statements, or supplementary materials included in this article.