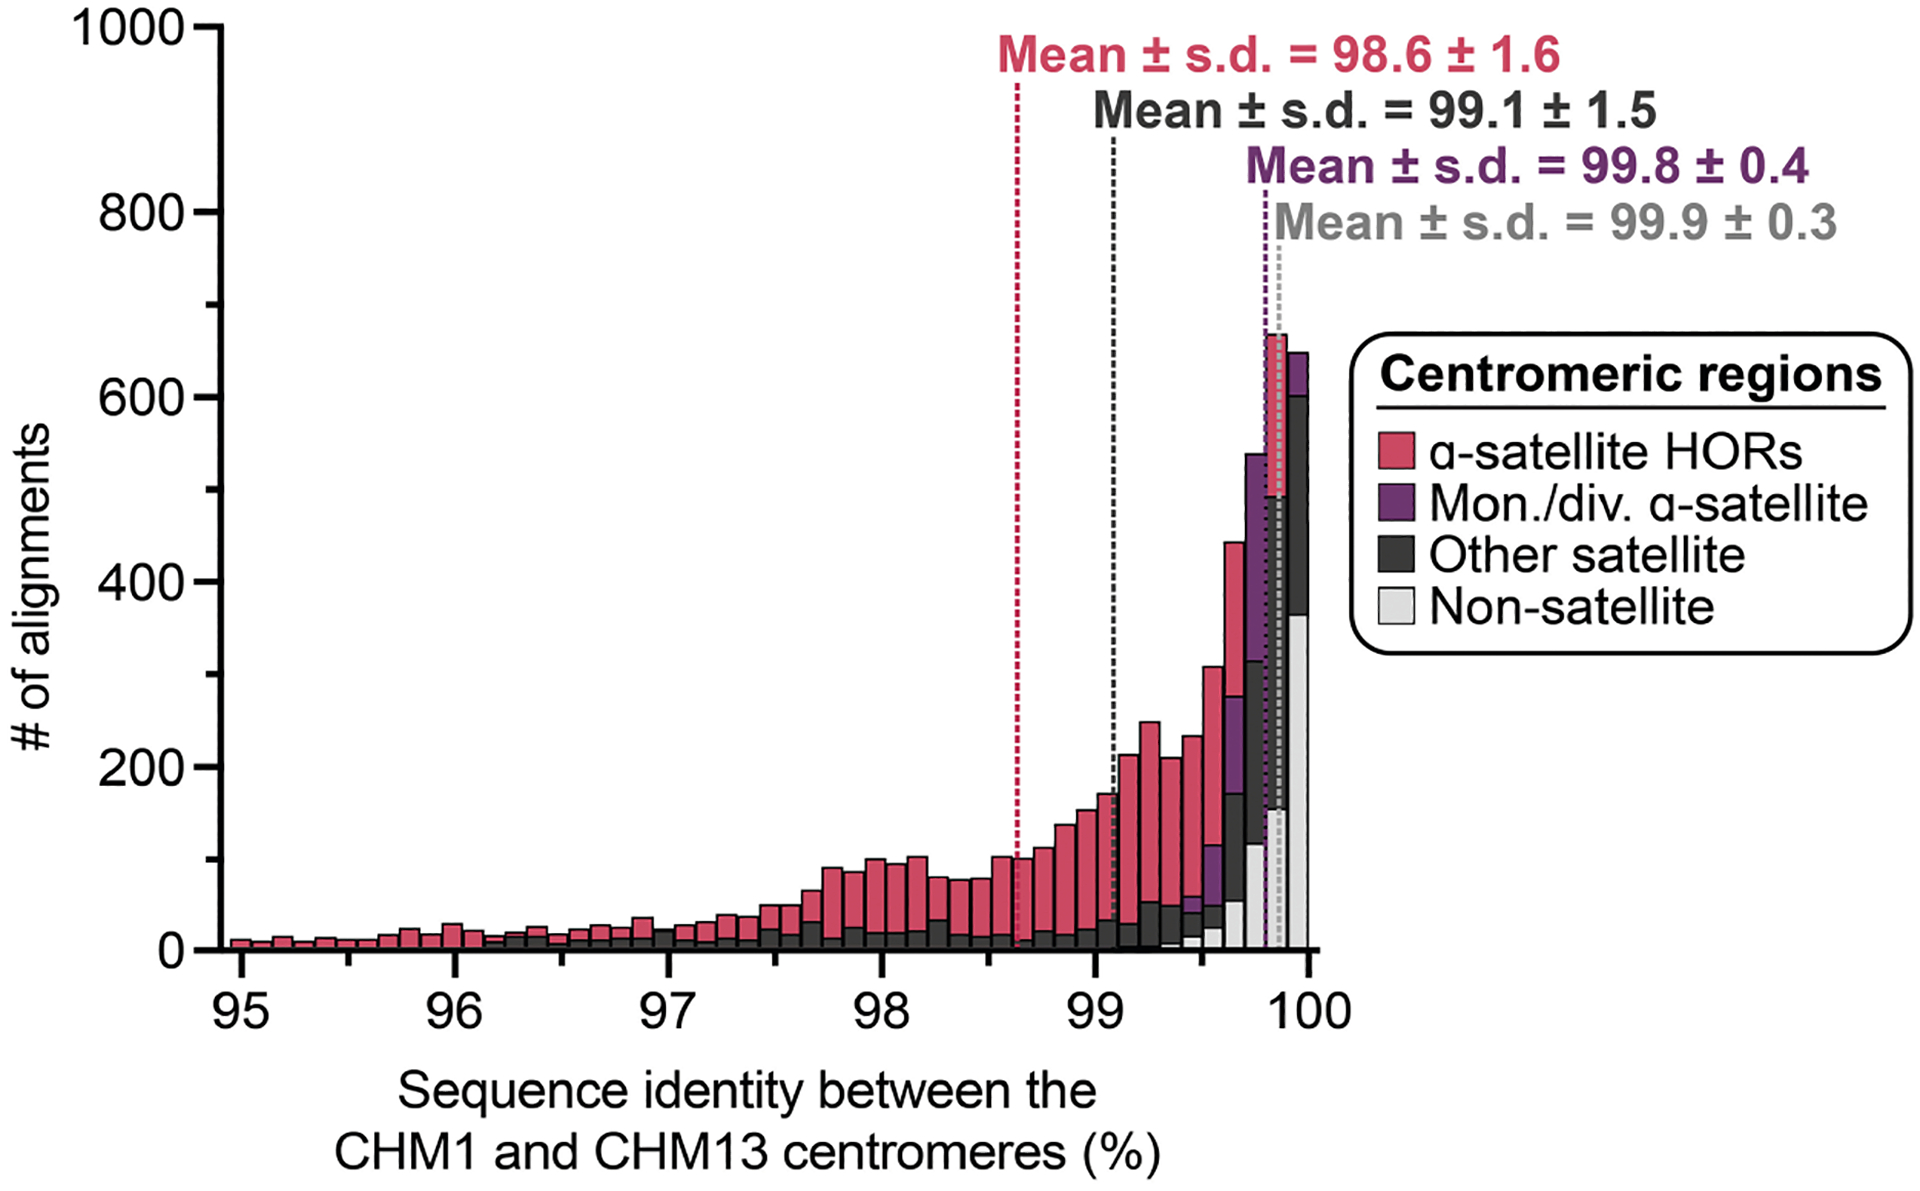
Extended Data Fig. 2 |. Sequence identities between the CHM1 and CHM13 centromeric regions.

Histogram showing the distribution of sequence identities from complete contig alignments between centromeric regions in the CHM1 and CHM13 genomes. The α-satellite HOR, monomeric/divergent α-satellite, other satellite, and non-satellite portions were assessed separately and reveal a much larger distribution in sequence identities for the α-satellite HORs. The mean and standard deviation (s.d.) are indicated.
