

Abstract
Objective
Examination of cerebral cortical structure in children with Attention-Deficit/Hyperactivity Disorder (ADHD) has thus far been principally limited to volume measures. In the current study, an automated surface-based analysis technique was used to examine the ADHD-associated differences in additional morphologic features of cerebral cortical gray matter structure, including surface area, thickness, and cortical folding.
Methods
MPRAGE images were acquired from 21 children with ADHD (9 girls) and 35 typically developing controls (15 girls), aged 8–12 years. Statistical difference maps were used to compare mean cortical thickness between groups along the cortical surface. Cortical volume, surface area, mean thickness, and cortical folding were measured within regions of interest, including the right/left hemispheres, frontal, temporal, parietal, and occipital lobes within each hemisphere, and sub-lobar regions.
Results
Children with ADHD showed a decrease in total cerebral volume and total cortical volume of over 7 and 8%, respectively; volume reduction was observed throughout the cortex, with significant reduction in all four lobes bilaterally. The ADHD group also showed a decrease in surface area of over 7% bilaterally, and a significant decrease in cortical folding bilaterally. No significant differences in cortical thickness were detected.
Conclusions
Results from the present study reveal that ADHD is associated with decreased cortical volume, surface area, and folding throughout the cerebral cortex. The findings suggest that decreased cortical folding is a key morphologic feature associated with ADHD. This would be consistent with onset early in neural development and could help to identify neurodevelopmental mechanisms that contribute to ADHD.
Keywords: MRI, ADHD, cortical folding, gyrification, cortical thickness
INTRODUCTION
Attention-Deficit/Hyperactivity Disorder (ADHD) is a developmental disorder characterized by age-inappropriate inattentiveness, hyperactivity, and impulsivity; it is estimated to affect 3–7% of school age children [American Psychiatric Association, 2000]. Despite its prevalence, the neurobiological basis of ADHD is yet to be established. Deficits in executive control functions, including response inhibition, are among the most consistent behavioral findings in ADHD. Observation of similar behavioral deficits in adults with acquired brain lesions has led to speculation that ADHD may be attributable to abnormalities in frontal-subcortical circuits [Barkley, 1997; Heilman, 1991].
Anatomic imaging studies have accrued evidence for structural brain abnormalities in ADHD. The most consistent finding is reduced total cerebral volume (TCV), ranging from 3 to 8% [Carmona et al., 2005; Castellanos et al., 1996, 2002; Mostofsky et al., 2002]. Despite the probable neuroanatomic heterogeneity among children diagnosed with ADHD, there are suggestions of predominance of findings in the frontal cortex [Castellanos et al., 1996; Mostofsky et al., 2002; Sowell et al., 2003], although reduced volume has also been observed in regions corresponding to parietal [Castellanos et al., 2002; Filipek et al., 1997] and temporal [Carmona et al., 2005; Castellanos et al., 2002] cortices. Abnormalities have also been observed in the basal ganglia and cerebellum, which have been imputed to form “nodes” in circuits principally interconnected with the frontal cortex [Castellanos et al., 2002; Filipek et al., 1997; Mostofsky et al., 1998, 2002].
Most anatomic MRI studies of the cerebral cortex in ADHD have relied on a volumetric approach, in which gray and white matter volumes are measured within parcellated subregions. Initial studies used manual parcellation, with subregions defined by callosal landmarks [Castellanos et al., 1996; Filipek et al., 1997]. More recently, investigators have used cortical landmarks to define functionally relevant lobar (frontal, parietal, temporal, occipital) and sublobar (e.g., prefrontal, premotor, anterior cingulate) regions with findings revealing decreased volumes in both prefrontal and premotor regions [Kates et al., 2002; Mostofsky et al., 2002].
Although it has been shown that children with ADHD have decreased cortical volume, the precise morphologic contributions to reduced cortical volume remains unclear. The cerebral cortex is a highly convoluted structure topologically equivalent to a two-dimensional sheet. Decreased cortical volume in ADHD must therefore be associated with either a thinning of the cortex or a decrease in the total surface area of the cortex (or a combination of both.)
If decreased cortical volume in ADHD is indeed associated with decreased surface area, then it is important to move to examine cortical folding. This is because when the cortex can no longer expand radially due to the limited size imposed by the calvarium, as is the case with humans, the only way for surface area to increase is if the cortex becomes more folded. In this way, cortical folding is critical to increasing the structural and functional capacity of the cerebral cortex. Thus, decreased cortical volume in ADHD, beyond the amount expected as a result of reduced TCV, may be due to a decreased degree of cortical folding.
The effect of cortical folding on cortical volume may be offset, of course, by cortical thinning, and in neurodevelopment cortical thinning and increased cortical folding may actually be related. One theory suggests that cortical folding is induced by tension along axons, which depend on nonuniform distribution of neuronal differentiation and neurite growth [Van Essen, 1997]; recent experiments have supported this hypothesis [Mima and Mikawa, 2004]. Tension would likely increase cortical thickness along gyri and decrease cortical thickness within sulci, possibly resulting in either increased or decreased overall mean cortical thickness, resulting in either increased or decreased cortical volume, respectively.
In this study, we examine how each of these factors is associated with ADHD to better understand the morphologic contributions to reduced cortical volume in ADHD.
In the past several years, investigators have begun to use surface-based approaches to examine cerebral cortical abnormalities associated with neuropsychiatric disorders including schizophrenia [Park et al., 2006; Thompson et al., 2004] and bipolar disorder [Lyoo et al., 2006], as well as ADHD [Makris et al., 2007; Shaw et al., 2006]. Surface-based approaches have an advantage over volumetric approaches in that they allow for more precise descriptions of anatomical deficits, including detailed analysis of cortical shape along several dimensions including thickness, surface area, and degree of folding. Another advantage of surface-based approaches is that they allow for statistical parametric mapping of cortical thickness. This method does not require predefined, user-specified regions of interest (ROIs), and thus has the potential to localize regions of abnormality in cortical gray matter structure, without the biases imposed by the predefinitions of arbitrarily defined landmarks. Further, knowledge of the topographical organization of function along the surface of the cerebral cortex indicates that a surface-based approach may be useful for identifying functionally relevant anatomical abnormalities. This is highly advantageous for investigation of anatomical structure in populations for whom the neurological findings are not sufficiently established to allow prediction of the most relevant ROI, or if deficits are not confined to any particular ROI.
Sowell et al. [2003] used an automated technique to investigate ADHD-associated abnormalities in cortical density (a measure related to cortical thickness) and distance from center along the cortical surface. Cortical density was computed at each cortical surface point as the proportion of segmented gray matter volume to total volume within a sphere of radius 15 mm centered at that point. Findings included decreased cortical gray matter density in children with ADHD within the dorsal prefrontal and anterior temporal cortices, and increased gray matter volumes within posterior temporal and inferior parietal regions. In a longitudinal study, Shaw et al. [2006] examined cortical thickness in children with ADHD using an automated surface-based technique; findings revealed overall decreased cortical thickness in ADHD, with the most notable decreases occurring bilaterally in the superior medial frontal cortex and in the right anterior temporal cortex. In a study of adults with ADHD, Makris et al. [2007] found decreased mean cortical thickness in nearly all a priori regions comprising a network thought to modulate attention and executive function, including bilateral dorsolateral prefrontal, orbital frontal, anterior/posterior cingulate, and in the right lateral inferior parietal region, angular gyrus, and supramarginal gyrus.
Inconsistencies among studies investigating anatomical abnormalities in ADHD suggest that abnormalities may not be confined to one region, or that measures of thickness or density may not be sufficient to explain existing deficits. None of the studies of ADHD that employed surface-based techniques examined cortical folding. Cortical folding in other disorders has been examined using gyrification index (GI), defined as the ratio of inner contours to outer contours of the cortex [Zilles et al., 1988]. Using manually delineated inner and outer contours in MRI to calculate GI, Schmitt et al. [2002] found increased cortical folding in young adults with Williams syndrome compared with controls, indicating that the relationship between cognitive functions and cortical folding is not always a direct one. Recently, automated surface-based measures have been developed to measure cortical folding along the entire surface, including the folding index (FI) measure [Van Essen and Drury, 1997]; however, measures of cortical folding such as these have not yet been applied in studies of children with ADHD.
For this study we applied the fully automated FreeSurfer software program (http://www.nmr.mgh.harvard.edu). FreeSurfer uses a surface-based approach that provides a means of comparing local mean cortical thickness values between study populations. Furthermore, this approach can be used to measure cortical volume, surface area, and folding across the entire cortex and within ROIs. We hypothesized that children with ADHD would show decreased cortical volume, thickness, and surface area, with the greatest abnormality localized to the frontal cortex.
MATERIALS AND METHODS
Participants
The study included 21 children with ADHD and 35 age-and gender-matched controls. The ADHD group included 12 boys and 9 girls with a mean age of 10.8 years (range 8.7–12.8). The control group included 20 boys and 15 girls with a mean age of 10.6 years (range 8.4–13.0).
Participants were recruited from outpatient clinics at the Kennedy Krieger Institute, and from local area pediatricians, local chapters of children and adults with attention-deficit/hyperactivity disorder (CHADD), schools, social/service organizations (e.g., Boy/Girl Scouts), and advertisements in the community (e.g., postings at libraries).
All children entering the study had a Full Scale IQ estimate of at least 80 based on present performance on the Wechsler Intellectual Scale for Children WISC-3rd edition [Wechsler, 1991] (n = 8) or the WISC-4th edition [Wechsler, 2003] (n = 48). None of the children had a history of speech/language disorder or a reading disability, and all had a basic reading standard score of 85 (16th percentile) or higher on the word reading subtest from the Wechsler individual achievement test, 1st edition (WIAT) [Wechsler, 1991] (n = 8) or Second Edition (WIAT-II) [Wechsler, 2002] (n = 48).
The structured parent interview, diagnostic interview for children and adolescents-4th edition (DICA-IV) [Reich et al., 1997] and ADHD-specific and broad behavior rating scale (Conners’ parent and teacher rating scales-revised CPRS-R, CTRS-R, long form [Conners, 1997]) were used to confirm ADHD diagnosis.
The CPRS-R and DSM IV criteria were also used to evaluate ADHD subtype (i.e., Predominantly hyperactive-impulsive ADHD-HI, Predominantly inattentive ADHD-I, or Combined ADHD-C). As only one child met criteria for ADHD-HI, the ADHD-C and ADHD-HI were combined into a single ADHD-C/HI group, with 6 children in the ADHD-I group and 15 children in the ADHD-C/HI group.
The DICA-IV was also used to examine for the presence of other psychiatric disorders. Children with comorbid conduct disorder, mood disorder, generalized anxiety disorder, separation anxiety disorder, or obsessive-compulsive disorder were excluded from this study. Children with comorbid oppositional defiant disorder (ODD) or simple phobia were included; ODD was present in eight of the subjects with ADHD and simple phobia was present in four, including two subjects with both. Children with ADHD were excluded from the study if they were taking longer-acting psychoactive medications (i.e., other than stimulants).
Additional exclusion criteria for controls included history of mental health services for behavior or emotional problems, history of academic problems requiring school-based intervention services or history of defined primary reading or language-based learning disability. Parents of children in the control group also completed the DICA-IV and CPRS-R. Control children who met criteria for any psychiatric diagnosis on the DICA-IV, other than simple phobia, were excluded from the study. Control children with T-scores greater than 60 on the ADHD (DSM-IV inattention, DSM-IV hyperactivity) subscales of CPRS-R were also excluded from the study.
The Hollingshead Index (1975) was used to determine Socioeconomic Status (SES) for each child in the study [Hollingshead, 1975].
The study was approved by the Johns Hopkins University School of Medicine Institutional Review Board. Participants provided written consent (caregivers) and assent (children) before beginning testing and received a copy of the consent form.
MRI Acquisition, Surface Reconstruction, and Image Analysis
T1-weighted 3D-volume MPRAGE images (matrix size = 256 × 256, echo time = 3 ms, repetition time = 7 ms, field of view = 260 mm, slice thickness = 1.2 mm) were acquired using a 1.5T Philips Gyroscan NT for each subject in the study and processed using a fully automated procedure.
Initial processing included computation of the Talairach transformation matrix using tools developed at the Montreal Neurological Institute [Collins et al., 1994; Talairach and Tournoux, 1988] and intensity normalization to correct for variability in the signal due to magnetic field inhomogeneities and artifacts [Dale et al., 1999]. The skull and dura matter were removed from the normalized image using a technique that combines a watershed algorithm with deformable surface models [Segonne et al., 2004].
The intensity normalized, skull-stripped image was then segmented into white and nonwhite matter. Cutting planes were used to remove the brainstem and to separate the hemispheres from one another, and white matter was filled to create a single connected volume within each hemisphere. A surface tessellation was generated around this volume and smoothed using a deformable surface algorithm to define the gray/white surface. The surface defining the boundary between gray matter and cerebrospinal fluid, or pial surface, was determined by deforming the gray/white surface outward [Dale et al., 1999; Fischl et al., 1999a, 2001]. These surfaces form the inner and outer boundaries of the cerebral cortex, respectively, and all matter between these surfaces is labeled as gray matter. Gray/white and pial surfaces from all the subjects in the study were aligned to a surface-based coordinate system and combined to create an average brain [Fischl et al., 1999b].
Full brain cortical thickness maps were generated for each subject. At each vertex along the pial surface, cortical thickness was computed as the distance from the gray/white boundary to the pial surface, as described in Fischl and Dale [2000]. TCV was measured as total volume contained within the pial surface for both hemispheres.
An automated labeling system was used to parcellate the cortex into 34 gyral-based ROIs for each hemisphere; this method has been validated with manual measurements [Desikan et al., 2006]. A probabilistic labeling algorithm [Fischl et al., 2004] was used to apply this parcellation to the cortical surfaces of each subject. Cortical volume was measured for each ROI as the volume contained between the parcellated portions of gray/white and pial surfaces. All surface measurements (surface area, mean cortical thickness, and FI) were measured along the pial surface corresponding to each ROI. FI was computed using the maximum and minimum principle curvatures (kmax and kmin, computed along the major and minor axes, respectively) as described in Van Essen and Drury: “The FI was computed by integrating the product of the maximum principal curvature and the difference between maximum and minimum curvature and dividing by 4π (the integral for a cylinder the length of which equals its diameter).” [Van Essen and Drury, 1997].
Full-hemisphere and lobar values were obtained for volume, surface area, and FI by summing each measure across all sub-lobar ROIs pertaining to each hemisphere or lobe. Full-hemisphere and lobar mean thickness was computed by multiplying the mean thickness (tr) of each sub-lobar ROI (r = 1:n) pertaining to the lobe or hemisphere by the number of vertices in the sub-lobar ROI (vr) and averaging across all vertices:
Statistical Analysis
Pearson’s chi-squared (χ2) test was used to examine differences in gender distribution between the ADHD and control groups, and two-way Analysis of Variance (ANOVA) was used to examine the effect of gender, diagnosis, and gender-diagnosis interactions on FSIQ and age.
Effect of age on TCV and full-hemisphere cortical thickness, volume, surface area, and FI were examined. Results of this analysis determined if age was to be entered as a covariate in the analysis of each measure.
Statistical difference maps for cortical thickness between groups were generated and displayed on an average brain generated from all subjects [Fischl and Dale, 2000]. A false discovery rate of P = 0.05 was applied to the statistical difference maps to correct for multiple comparisons.
Two-way ANOVA was used to examine effects of gender, diagnosis, and gender-diagnosis interactions on TCV and cortical thickness within all ROIs (full-hemisphere, lobar, sublobar).
Two-way ANCOVA with TCV entered as a covariate (to adjust for scaling effects) was conducted to examine gender, diagnosis, and gender-diagnosis interaction effects on cortical volume, surface area, and FI within all ROIs. TCV was not entered as a covariate in the analysis of cortical thickness, as this measure should not be affected by scaling. Unadjusted ANOVA was also conducted for lobar ROIs to examine the effect of diagnosis without correcting for TCV. Additionally, we examined effects of ADHD subtype and comorbid ODD in ADHD subjects for all measures.
Bonferroni correction for multiple comparisons was applied to lobar (8) and sublobar (66) measures; however, uncorrected P-values are also reported for lobar measures. For all analyses, a statistical threshold of P < 0.05 was used to determine significance, with P < 0.1 considered a trend.
Outliers were defined as subjects whose measurements exceeded three standard deviations from the mean and were excluded for the analysis of that measure.
RESULTS
Group Statistics
The groups of children with ADHD and typically developing controls did not differ significantly in age [F(1.55) = 0.6, P = 0.5], FSIQ [F(1.55) = 1.0, P = 0.3], or gender [χ2 = 0.08, P = 0.8]. Across both diagnostic groups, boys and girls did not differ significantly in age [F(1.55) = 0.6, P = 0.5] or FSIQ [F(1.55) = 0.6, P = 0.4].
Age Effects
Regression analysis revealed no significant effect of age for: TCV [r2 = 0.05, P = 0.1], cortical volume [left, r2 = 0.02, P = 0.3; right, r2 = 0.03, P = 0.2], surface area [left, r2 < 0.01, P = 0.5; right, r2 < 0.01, P = 0.6], or FI [left, r2 < 0.01, P = 0.8; right, r2 = 0.02, P = 0.3].
A negative correlation was observed between age and mean cortical thickness [left, r2 = 0.4, P < 0.001; right, r2 = 0.5, P < 0.001]; this effect was observed bilaterally in all four lobes of each hemisphere (all P < 0.01, corrected).
Total Cerebral Volume
Children with ADHD showed a greater than 7% reduction in TCV compared with controls [ADHD, 1099± 92 cm3; Control, 1188 ± 94 cm3; F(1.55) = 14.7, P < 0.001]. There was also a significant effect of gender, with girls showing a 7% reduction in TCV compared with boys [Girls, 1105 ± 92 cm3; Boys, 1192 ± 94 cm3; F(1.55) = 14.9, P < 0.001]. No gender-by-diagnosis interaction effects were observed [F(1.55) = 0.8, P = 0.4].
Cortical Volume
Children with ADHD showed reduced cortical volumes compared with controls, with a reduction of more than 8% in each hemisphere (Table I). ANCOVA with TCV as a covariate revealed a significant effect of diagnosis (dx) bilaterally (left, P = 0.001; right, P = 0.003), but no effect of gender. No gender-by-diagnosis interaction effect was observed.
TABLE I.
Cortical volume (cm3) (Mean ± SD)
| ROI | Control | ADHD | df | Effect: gender |
Effect: dx |
Effect: gender × dx |
||||||
|---|---|---|---|---|---|---|---|---|---|---|---|---|
| F | P | Pcorr | F | P | Pcorr | F | P | Pcorr | ||||
| Left | 341 ± 24 | 310 ± 19 | 55 | 0.42 | 0.52 | 11.74 | 0.001 | 0.05 | 0.83 | |||
| Right | 345 ± 25 | 316 ± 20 | 55 | 0.14 | 0.71 | 9.46 | 0.003 | 0.02 | 0.89 | |||
| Left frontal | 127 ± 8.8 | 117 ± 9.6 | 55 | 0.89 | 0.35 | 1.0 | 4.33 | 0.043 | 0.340 | 0.01 | 0.90 | 1.0 |
| Right frontal | 131 ± 9.6 | 119 ± 9.7 | 55 | 1.31 | 0.26 | 1.0 | 3.53 | 0.066 | 0.530 | 0.25 | 0.62 | 1.0 |
| Left temporal | 90.1 ± 7.0 | 82.9 ± 4.2 | 55 | 0.02 | 0.89 | 1.0 | 5.19 | 0.027 | 0.210 | 1.69 | 0.20 | 1.0 |
| Right temporal | 90.7 ± 6.9 | 83.8 ± 5.1 | 55 | 1.91 | 0.17 | 1.0 | 4.95 | 0.030 | 0.240 | 0.25 | 0.62 | 1.0 |
| Left parietal | 97.3 ± 8.4 | 88.1 ± 7.0 | 55 | 0.30 | 0.59 | 1.0 | 4.64 | 0.036 | 0.290 | 0.07 | 0.79 | 1.0 |
| Right parietal | 101 ± 8.1 | 90.7 ± 6.5 | 55 | 0.11 | 0.74 | 1.0 | 8.22 | 0.006 | 0.048 | 0.00 | 0.95 | 1.0 |
| Left occipital | 25.9 ± 2.7 | 22.6 ± 2.1 | 55 | 0.48 | 0.49 | 1.0 | 10.70 | 0.002 | 0.015 | 0.10 | 0.75 | 1.0 |
| Right occipital | 23.7 ± 2.7 | 21.6 ± 2.1 | 55 | 0.09 | 0.77 | 1.0 | 1.02 | 0.320 | 1.001 | 0.15 | 0.70 | 1.0 |
Unadjusted ANOVA revealed a significant effect of diagnosis in all four lobes, with children with ADHD showing decreased volume compared with controls (all P < 0.05, corrected). ANCOVA with TCV as a covariate revealed that children with ADHD showed significantly decreased cortical volume in the temporal and parietal lobes, and in the left occipital and frontal lobes, with a trend observed in the right frontal lobe (Table I). After correction for multiple comparisons this effect was only observed in the left occipital lobe and the right parietal lobe. No gender-by-diagnosis interaction effect was observed.
ANCOVA revealed no significant effect of diagnosis on cortical volume for any sublobar ROI (P < 0.05, corrected), although a trend was observed in the banks of the superior temporal sulcus, left hemisphere [F(1.54) = 11.62, P = 0.085, corrected].
Cortical Surface Area
Children with ADHD showed reduced surface area compared with controls, with a reduction of more than 8% in each hemisphere (Table II). ANCOVA with TCV as a covariate revealed a significant effect of diagnosis (P < 0.001, bilaterally). A significant effect of gender (girls smaller than boys) was observed in the left hemisphere (P = 0.026), with a trend in the right hemisphere (P 5 0.067). No gender-by-diagnosis interaction effect was observed.
TABLE II.
Surface area (cm2) (Mean ± SD)
| ROI | Control | ADHD | df | Effect: gender |
Effect: dx |
Effect: gender × dx |
||||||
|---|---|---|---|---|---|---|---|---|---|---|---|---|
| F | P | Pcorr | F | P | Pcorr | F | P | Pcorr | ||||
| Left | 1157 ± 89 | 1058 ± 66 | 55 | 5.24 | 0.026 | 13.20 | <0.001 | 1.21 | 0.28 | |||
| Right | 1166 ± 91 | 1061 ± 67 | 55 | 3.51 | 0.067 | 15.89 | <0.001 | 0.85 | 0.36 | |||
| Left frontal | 414.9 ± 30 | 380.5 ± 31 | 55 | 1.87 | 0.18 | 1.0 | 5.61 | 0.022 | 0.17 | 0.00 | 0.98 | 1.0 |
| Right frontal | 420.3 ± 33 | 384.8 ± 31 | 55 | 0.43 | 0.51 | 1.0 | 3.96 | 0.052 | 0.41 | 0.34 | 0.56 | 1.0 |
| Left temporal | 298.5 ± 26 | 275.3 ± 14 | 55 | 1.22 | 0.27 | 1.0 | 3.86 | 0.055 | 0.44 | 3.72 | 0.059 | 0.47 |
| Right temporal | 298.9 ± 26 | 273.6 ± 18 | 55 | 7.03 | 0.011 | 0.085 | 6.40 | 0.015 | 0.12 | 2.28 | 0.14 | 1.0 |
| Left parietal | 338.1 ± 30 | 309.4 ± 22 | 55 | 2.56 | 0.12 | 0.93 | 3.80 | 0.057 | 0.45 | 0.15 | 0.70 | 1.0 |
| Right parietal | 351.2 ± 29 | 315.3 ± 18 | 55 | 1.42 | 0.24 | 1.0 | 16.99 | <0.001 | 0.001 | 2.16 | 0.15 | 1.0 |
| Left occipital | 105.0 ± 11 | 93.14 ± 9.2 | 55 | 2.34 | 0.13 | 1.0 | 7.42 | 0.009 | 0.071 | 0.14 | 0.71 | 1.0 |
| Right occipital | 95.79 ± 10 | 87.70 ± 8.1 | 55 | 0.04 | 0.85 | 1.0 | 0.76 | 0.390 | 1.0 | 0.03 | 0.87 | 1.0 |
Unadjusted ANOVA revealed a significant effect of diagnosis in all four lobes bilaterally, with children with ADHD showing decreased surface area compared with controls (all P < 0.05, corrected). ANCOVA with TCV as a covariate revealed that children with ADHD showed significantly decreased surface area in the frontal lobes bilaterally, the left occipital lobe, and the right temporal and parietal lobes, with a trend observed in the left temporal and parietal lobes (Table II). After correction for multiple comparisons this effect was only observed in the right parietal lobe, with a trend observed in the left occipital lobe. No gender-by-diagnosis interaction effect was observed.
ANCOVA revealed no significant effect of diagnosis on cortical surface area for any sublobar ROI.
Cortical Thickness
No differences in cortical thickness were detected between the ADHD group and control group in statistical difference maps. Further, ANCOVA with age entered as a covariate revealed no difference in mean cortical thickness between the ADHD and control group (Table III).
TABLE III.
Mean thickness (mm) (Mean ± SD)
| ROI | Control | ADHD | df | Effect: gender |
Effect: dx |
Effect: gender × dx |
||||||
|---|---|---|---|---|---|---|---|---|---|---|---|---|
| F | P | Pcorr | F | P | Pcorr | F | P | Pcorr | ||||
| Left | 3.28 ± 0.13 | 3.26 ± 0.12 | 55 | 11.22 | 0.002 | 0.01 | 0.91 | 0.78 | 0.38 | |||
| Right | 3.30 ± 0.13 | 3.30 ± 0.11 | 55 | 9.86 | 0.003 | 0.90 | 0.35 | 2.12 | 0.15 | |||
| Left frontal | 3.45 ± 0.15 | 3.44 ± 0.13 | 55 | 12.49 | 0.001 | 0.007 | 0.06 | 0.80 | 1.0 | 0.01 | 0.93 | 1.0 |
| Right frontal | 3.49 ± 0.14 | 3.48 ± 0.11 | 55 | 15.33 | <0.001 | 0.002 | 0.14 | 0.71 | 1.0 | 0.09 | 0.76 | 1.0 |
| Left temporal | 3.39 ± 0.11 | 3.39 ± 0.12 | 55 | 7.01 | 0.011 | 0.086 | 0.11 | 0.74 | 1.0 | 0.82 | 0.37 | 1.0 |
| Right temporal | 3.42 ± 0.12 | 3.44 ± 0.10 | 54 | 5.38 | 0.024 | 0.20 | 1.91 | 0.17 | 1.0 | 1.36 | 0.25 | 1.0 |
| Left parietal | 3.16 ± 0.15 | 3.12 ± 0.14 | 55 | 7.19 | 0.010 | 0.079 | 0.55 | 0.46 | 1.0 | 1.92 | 0.17 | 1.0 |
| Right parietal | 3.15 ± 0.15 | 3.15 ± 0.13 | 55 | 5.04 | 0.029 | 0.23 | 0.55 | 0.46 | 1.0 | 4.38 | 0.041 | 0.33 |
| Left occipital | 2.73 ± 0.12 | 2.69 ± 0.12 | 55 | 3.15 | 0.082 | 0.65 | 0.95 | 0.34 | 1.0 | 2.03 | 0.16 | 1.0 |
| Right occipital | 2.74 ± 0.12 | 2.72 ± 0.12 | 55 | 1.04 | 0.310 | 1.0 | 0.01 | 0.94 | 1.0 | 1.20 | 0.28 | 1.0 |
Similarly, unadjusted ANOVA revealed no difference in thickness between the ADHD and control groups within any of the four lobes. ANCOVA revealed a significant effect of gender, however, with girls showing increased cortical thickness compared with boys (left, Girls: 3.33 ± 0.11, Boys: 3.23 ± 0.12, P = 0.002; right, Girls: 3.35 ± 0.10, Boys: 3.26 ± 0.12, P = 0.002) (Table III). No gender-by-diagnosis interaction effect was observed.
ANCOVA revealed no significant effect of diagnosis on cortical thickness for any sublobar ROI.
Cortical Folding
Children with ADHD showed reduced FI compared with controls; ANCOVA with TCV as a covariate revealed a significant effect of diagnosis; children with ADHD showed significantly decreased FI (P = 0.003, bilaterally) (Table IV, Fig. 1). No effect of gender was observed, although there was a trend for a gender-by-diagnosis interaction effect in the right hemisphere (P = 0.060, adusted) with separate analysis of the boys and girls revealing that boys with ADHD showed decreased FI in the right hemisphere compared with control boys (P < 0.001), whereas girls with ADHD did not show reduced FI compared with control girls (P = 0.7).
TABLE IV.
Folding index (Mean ± SD)
| ROI | Control | ADHD | df | Effect: gender |
Effect: dx |
Effect: gender × dx |
||||||
|---|---|---|---|---|---|---|---|---|---|---|---|---|
| F | P | Pcorr | F | P | Pcorr | F | P | Pcorr | ||||
| Left | 2313 ± 264 | 2016 ± 189 | 54 | 0.23 | 0.63 | 9.40 | 0.003 | 0.18 | 0.67 | |||
| Right | 2327 ± 271 | 2037 ± 175 | 54 | 2.01 | 0.16 | 9.63 | 0.003 | 3.71 | 0.060 | |||
| Left frontal | 817.1 ± 105 | 715.3 ± 113 | 54 | 0.09 | 0.77 | 1.0 | 4.06 | 0.049 | 0.39 | 1.69 | 0.20 | 1.0 |
| Right frontal | 855.9 ± 107 | 728.8 ± 73.1 | 54 | 0.25 | 0.62 | 1.0 | 11.20 | 0.002 | 0.012 | 1.20 | 0.28 | 1.0 |
| Left temporal | 584.7 ± 82.9 | 515.2 ± 57.2 | 54 | 0.94 | 0.34 | 1.0 | 4.23 | 0.045 | 0.36 | 0.02 | 0.88 | 1.0 |
| Right temporal | 587.6 ± 83.1 | 521.0 ± 66.8 | 55 | 1.77 | 0.19 | 1.0 | 3.23 | 0.078 | 0.63 | 1.59 | 0.21 | 1.0 |
| Left parietal | 662.1 ± 91.5 | 572.6 ± 57.4 | 55 | 0.00 | 0.97 | 1.0 | 7.43 | 0.009 | 0.070 | 0.08 | 0.78 | 1.0 |
| Right parietal | 665.2 ± 88.8 | 594.2 ± 46.6 | 55 | 1.25 | 0.27 | 1.0 | 2.88 | 0.096 | 0.77 | 4.35 | 0.042 | 0.34 |
| Left occipital | 240.5 ± 45.7 | 213.1 ± 33.1 | 54 | 0.80 | 0.38 | 1.0 | 1.76 | 0.190 | 1.0 | 0.43 | 0.52 | 1.0 |
| Right occipital | 225.5 ± 46.1 | 193.4 ± 28.2 | 54 | 2.40 | 0.13 | 1.0 | 2.92 | 0.094 | 0.75 | 1.86 | 0.18 | 1.0 |
Figure 1.
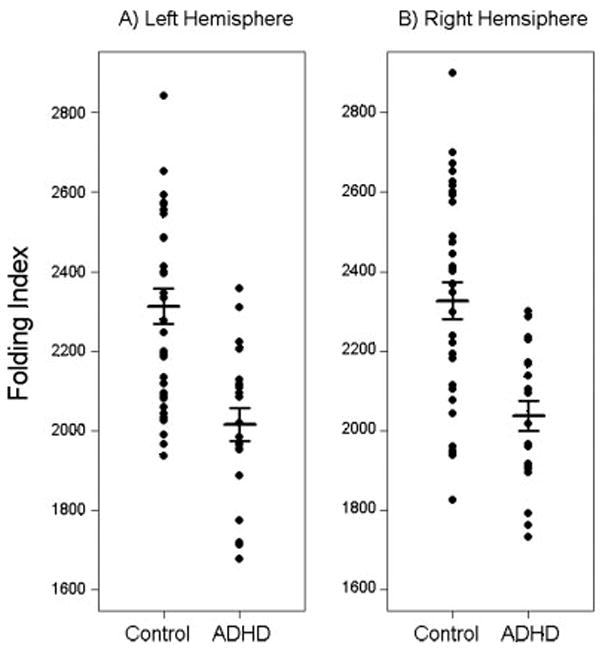
Plots of folding index, grouped by diagnosis, are shown for the left (A) and right (B) hemispheres. Horizontal bars indicate the mean and standard error for each group. Findings revealed significantly reduced FI in ADHD (P = 0.003, bilaterally).
Unadjusted ANOVA revealed a significant effect of diagnosis for FI, with children with ADHD showing a significant reduction in FI in all four lobes bilaterally (P < 0.05, corrected), with the exception of the right parietal lobe (P = 0.12, corrected). ANCOVA with TCV as a covariate revealed a significant effect of diagnosis in the frontal lobes bilaterally and the temporal and parietal lobes of the left hemisphere, with a trend observed in the right temporal, parietal, and occipital lobes (Table IV). After correction for multiple comparisons, this effect was only observed in the right frontal lobe (P = 0.012), with a trend observed in the left parietal lobe (P = 0.070). No effects of gender were observed, however a gender-by-diagnosis interaction effect was observed in the right parietal lobe (P = 0.042, adjusted) with boys with ADHD showing decreased FI compared with control boys (P = 0.006) and girls with ADHD showing no difference compared with control girls (P = 0.7).
ANCOVA examining effects in sublobar ROIs revealed a significant effect of diagnosis on FI in only one region—the lateral division of the left orbitofrontal cortex [F(1.54) = 12.9, P = 0.049, corrected], with a trend in the right pars triangularis of the inferior frontal gyrus [F(1.54) = 11.5, P = 0.090, corrected].
Analyses of Effects of ADHD Subtype and Comorbid ODD
No effect of ADHD subtype was observed for TCV, volume, surface area, thickness, or FI. No effect of comorbid ODD was observed for any measure, however, a trend was observed for mean cortical thickness bilaterally [left, F(1.20) = 3.21, P = 0.089; right, F(1.20) = 3.20, P = 0.090], with children with ADHD and comorbid ODD showing decreased cortical thickness compared with children with ADHD alone.
DISCUSSION
Results from the present study reveal that ADHD is associated with decreased TCV and cortical volume of ~ 7 and 8%, respectively; findings which are consistent with those from prior studies [Carmona et al., 2005; Castellanos et al., 1996, 2002; Mostofsky et al., 2002]. Examination of additional morphologic measures of cerebral cortical structure revealed that children with ADHD show decreased surface area and cortical folding, but not decreased cortical thickness.
These results indicate that cortical folding is an important contributing factor to the reduced cortical volume observed in ADHD beyond the amount expected due to reduced TCV. What does this reveal about cortical development in ADHD? Studies of gyrification in early development indicate that cortical folding begins at around 16 weeks of gestation and reaches its peak, overshooting average adult levels, at about 18 months of age; this is followed by a gradual return to adult levels at about 23 years of age [Armstrong et al., 1995]. These findings have implications for understanding the pathogenesis of ADHD. They suggest that biological contributions to ADHD may begin early in development, during gestation through infancy when folding is increasing; alternatively, it could be the case that decreased cortical folding in ADHD is due to a more rapid decline of cortical folding towards adult levels. Longitudinal studies across a wide age range of children/adolescents would help to clarify this question.
In contrast to recent findings of decreased cortical thickness in children [Shaw et al., 2006] and adults with ADHD [Makris et al., 2007], the current study reveals no differences in cortical thickness between the ADHD and control groups. In the prior pediatric study, children with ADHD showed decreased cortical thickness in several regions, principally within bilateral superior medial frontal cortices; the findings from the adult study revealed cortical thinning in a priori regions comprising a network thought to be critical for modulation of attention and executive function.
Discrepancies between our findings and those of prior studies may be due to differences in the study populations; both of the previous studies included ADHD subjects with comorbid diagnoses that served as exclusion criteria in the current study. The prior child study included children with comorbid conduct disorder, learning disorder, mood disorder, anxiety disorder, and tic disorder, whereas in the current study, ADHD subjects were free of any comorbidities, with the exception of ODD and simple phobia. For the adult study, the presence of substance abuse disorder in many of the subjects (50% in ADHD and 33% in controls) might have impacted the findings; none of our pediatric subjects had any such history of substance abuse. Differences between our findings and those from the adult study may also be explained by the fact that the cerebral cortex has been shown to thin with age, both in the present study and in previously documented work [Salat et al., 2004]; cortical thickness differences found in adults may not be present during childhood. Finally, differences between ours and the prior pediatric study, which included 163 subjects with ADHD and 166 controls, might also be due to reduced power in the current study. In contrast to surface area and volume measures, cortical thickness is measured at tens of thousands of vertices along the surface. ADHD-associated differences in cortical thickness may therefore be inherently difficult to detect and require a larger sample size.
Although no effect of diagnosis was observed, a significant gender effect was observed for cortical thickness, with girls showing increased thickness compared with boys. Recent studies have reported overall increased mean cortical thickness in adult females compared with adult males [Im et al., 2006; Luders et al., 2006] and throughout the lifespan [Sowell et al., 2007]. Findings from the current study are consistent with these results and for the first time show that increased cortical thickness in females is also observed in children.
Additionally, across both groups of subjects, we found girls have smaller TCV compared with boys. This is consistent with findings from previous studies [Caviness et al., 1996; Giedd et al., 1997]. Girls did not show differences in cortical volume or FI compared with boys after correction for TCV, but did show decreased cortical surface area compared with boys, although this result is not as robust as the finding of decreased cortical surface area in ADHD compared with controls.
Inconsistent with one of our hypotheses, we did not find ADHD-associated abnormalities in cortical structure to be predominantly localized to the frontal lobes; rather, we found that decreases in cortical volume and folding were observed throughout the cortex, with the greatest effect of volume observed in the right parietal and left occipital lobes. The findings contrast some with those from a prior volumetric study from our laboratory [Mostofsky et al., 2002]. In both studies, ADHD was associated with a reduction in total volume across the entire right and left hemispheres; however, in the prior study lobar analyses revealed volumetric reduction to be principally localized to the frontal lobes. The prior study included only boys and the sample size was substantially smaller (n = 12). The small sample size might be particularly relevant in that ADHD-associated reductions in temporal, parietal, and occipital lobar tissue volumes (in addition to frontal) were in fact observed in the prior study; however, they did not reach significance after Bonferroni correction for multiple comparisons. The greater number of subjects in the current study may have allowed power sufficient to detect reductions across all four lobes.
Differences in methodology might also contribute to the discrepancy, with distinctly different lobar tissue volumes defined in each of the studies. In the previous study, semiautomated techniques were used to determine lobar tissue volumes (including both gray and white matter); this is in contrast to the current study, in which strictly cortical (and therefore predominantly gray matter) volumes were defined using a fully-automated surface-based technique. Consistent with the current findings, reduced frontal lobe gray matter volume was observed in the previous study [Mostofsky et al., 2002]; however, gray and white matter were not investigated separately within the temporal, parietal, and occipital lobes.
Similarly, children with ADHD showed decreased cortical folding throughout the cortex. For cortical folding, however, the greatest effect of diagnosis was observed in the right frontal lobe, raising the possibility that this may be a marker for right frontal dysfunction hypothesized to contribute to ADHD [Barkley 1997; Filipek et al., 1997; Heilman, 1991; Makris et al., 2007].
Several investigators have posited that observed deficits in executive control in ADHD point to dysfunction within frontal-subcortical circuits [Denckla and Reiss, 1997; Halperin and Schulz, 2006; Heilman, 1991]. While some anatomic imaging findings indicate abnormalities localized to these regions [Kates et al., 2002; Mostofsky et al., 2002], the more distributed nature of abnormalities in both cortical folding and volume found in this and other studies of ADHD [Castellanos et al., 2002] may also be indicative of decreased capacity for interconnections between frontal and posterior cortical regions. Interconnectivity between these regions is important for both bottom-up and top-down modulation central to executive control, including that involved in modulation of attention [Gazzaley et al., 2005], and may therefore be important in the pathophysiology of ADHD. Executive control must be exerted over some substantive process, so that feed-forward from posterior regions influences frontal executive status. Comorbidity between learning disabilities and ADHD may also be based upon decreased interconnectivity (posterior–anterior and reciprocal). Further examination of the functional integrity of these interconnections, as well as their structural integrity, for instance using DTI, may be important to understanding the brain basis of ADHD.
CONCLUSION
Detailed analysis of cerebral cortical structure using an automated surface-based analysis technique confirmed previous findings of anatomical deficits in children with ADHD, including decreased TCV and decreased cortical volume. The findings further reveal that decreased cortical volume in ADHD is principally related to differences in cortical folding, not cortical thickness, suggesting that decreased cortical folding is the key morphologic feature associated with the disorder, and thus may be essential for understanding the pathogenesis of ADHD. To our knowledge, this is the first study to examine cortical folding in ADHD. Further investigation will be needed to evaluate the relevance of cortical folding in ADHD and potential applications for early diagnosis. Further study with larger numbers of subjects will allow us to examine these findings in greater detail, to better understand the relationship between cortical folding and cortical thickness across development, and to examine the association between cortical folding and the clinical features of ADHD.
Acknowledgments
Authors thank Dr. Bruce Fischl for his help regarding the use of the FreeSurfer software.
Contract grant sponsor: National Institute of Health (NIH); Contract grant number: K02 NS04485, R01 NS047781, R01 NS043480; Contract grant sponsor: Mental Retardation and Developmental Disabilities Research Center; Contract grant number: HD-24061; Contract grant sponsor: Johns Hopkins General Clinical Research Center; Contract grant number: M01 RR00052.
References
- Armstrong E, Schleicher A, Omran H, Curtis M, Zilles K. The ontogeny of human gyrification. Cereb Cortex. 1995;5:56–63. doi: 10.1093/cercor/5.1.56. [DOI] [PubMed] [Google Scholar]
- American Psychiatric Association. Diagnostic and Statistical Manual of Mental Disorders. 4. Washington, DC: American Psychiatric Association, Arlington, VA; 2000. [Google Scholar]
- Barkley RA. Behavioral inhibition, sustained attention, and executive functions: Constructing a unifying theory of ADHD. Psychol Bull. 1997;121:65–94. doi: 10.1037/0033-2909.121.1.65. [DOI] [PubMed] [Google Scholar]
- Carmona S, Vilarroya O, Bielsa A, Tremols V, Soliva JC, Rovira M, Tomas J, Raheb C, Gispert JD, Batlle S, Bulbena A. Global and regional gray matter reductions in ADHD: A voxel-based morphometric study. Neurosci Lett. 2005;389:88–93. doi: 10.1016/j.neulet.2005.07.020. [DOI] [PubMed] [Google Scholar]
- Castellanos FX, Geidd JN, Marsh WL, Hamburger SD, Vaituzis AC, Dickstein DP, Sarfatti SE, Vauss YC, Snell JW, Lange N, Kyasen D, Krain AL, Ritchie GF, Rajapakse JC, Rapoport JL. Quantitative brain magnetic resonance imaging in attention-deficit hyperactivity disorder. Arch Gen Psychiatry. 1996;53:607–616. doi: 10.1001/archpsyc.1996.01830070053009. [DOI] [PubMed] [Google Scholar]
- Castellanos FX, Lee PP, Sharp W, Jeffries NO, Greenstein DK, Clasen LS, Blumenthal JD, James RS, Ebens CL, Walter JM, Zijdenbos A, Evans AC, Giedd JN, Rapoport JL. Developmental trajectories of brain volume abnormalities in children and adolescents with attention-deficit/hyperactivity disorder. JAMA. 2002;288:1740–1748. doi: 10.1001/jama.288.14.1740. [DOI] [PubMed] [Google Scholar]
- Caviness VS, Kennedy DN, Richelme C, Rademacher J, Filipek PA. The human brain age 7–11 years: A volumetric analysis based on magnetic resonance images. Cereb Cortex. 1996;6:726–736. doi: 10.1093/cercor/6.5.726. [DOI] [PubMed] [Google Scholar]
- Collins DL, Neelin P, Peters TM, Evans AC. Automatic 3D intersubject registration of MR volumetric data in standardized Talairach space. J Comput Assist Tomogr. 1994;18:192–205. [PubMed] [Google Scholar]
- Conners CK. In: Conners’ rating scales—Revised Technical Manual. Conners CK, editor. North Tonawanda, New York: Multi-Health Systems; 1997. [Google Scholar]
- Dale AM, Fischl B, Sereno MI. Cortical surface-based analysis I: Segmentation and cortical surface reconstruction. Neuroimage. 1999;9:179–194. doi: 10.1006/nimg.1998.0395. [DOI] [PubMed] [Google Scholar]
- Denckla MB, Reiss AL. Prefrontal-subcortical circuits in developmental disorders. In: Krasnegor NA, Goldman-Rakic PS, editors. Development of the Prefrontal Cortex. Baltimore: Paul H. Brooks; 1997. pp. 283–293. [Google Scholar]
- Desikan RS, Segonne F, Fischl B, Quinn BT, Dickerson BC, Blacker D, Buckner RL, Dale AM, Maguire RP, Hyman BT, Albert MS, Killiany RJ. An automated labeling system for subdividing the human cerebral cortex on MRI scans into gyral based regions of interest. Neuroimage. 2006;31:968–980. doi: 10.1016/j.neuroimage.2006.01.021. [DOI] [PubMed] [Google Scholar]
- Filipek PA, Semrud-Clikeman M, Steingard RJ, Renshaw PF, Kennedy DN, Biederman J. Volumetric MRI analysis comparing subjects having attention-deficit hyperactivity disorder with normal controls. Neurology. 1997;48:589–601. doi: 10.1212/wnl.48.3.589. [DOI] [PubMed] [Google Scholar]
- Fischl B, Dale AM. Measuring the thickness of the human cerebral cortex using magnetic resonance images. Proc Natl Acad Sci. 2000;97:11044–11049. doi: 10.1073/pnas.200033797. [DOI] [PMC free article] [PubMed] [Google Scholar]
- Fischl B, Sereno MI, Dale AM. Cortical surface-based analysis II: Inflation, flattening, and a surface-based coordinate system. Neuroimage. 1999a;9:195–207. doi: 10.1006/nimg.1998.0396. [DOI] [PubMed] [Google Scholar]
- Fischl B, Sereno MI, Tootell RBH, Dale AM. High-resolution inter-subject averaging and a coordinate system for the cortical surface. Hum Brain Mapp. 1999b;8:272–284. doi: 10.1002/(SICI)1097-0193(1999)8:4<272::AID-HBM10>3.0.CO;2-4. [DOI] [PMC free article] [PubMed] [Google Scholar]
- Fischl B, Liu A, Dale AM. Automated manifold surgery: Constructing geometrically accurate and topologically correct models of the human cerebral cortex. IEEE Trans Med Imaging. 2001;20:70–80. doi: 10.1109/42.906426. [DOI] [PubMed] [Google Scholar]
- Fischl B, van der Kouwe A, Destrieux C, Halgren E, Seginne F, Salat D, Busa E, Seidman LJ, Goldstein J, Kennedy D, Caviness V, Makris N, Rosen B, Dale AM. Automatically parcellating the human cerebral cortex. Cereb Cortex. 2004;14:11–22. doi: 10.1093/cercor/bhg087. [DOI] [PubMed] [Google Scholar]
- Gazzaley A, Cooney JW, McEvoy K, Knight RT, D’Esposito M. Top-down enhancement and suppression of the magnitude and speed of neural activity. J Cogn Neurosci. 2005;17:507–517. doi: 10.1162/0898929053279522. [DOI] [PubMed] [Google Scholar]
- Giedd JN, Castellanos FX, Rajapakse JC, Vaituzis AC, Rapoport JL. Sexual dimorphism of the developing human brain. Prog Neuropsychopharmacol Biol Psychiatry. 1997;21:1185–1201. doi: 10.1016/s0278-5846(97)00158-9. [DOI] [PubMed] [Google Scholar]
- Halperin JM, Schulz KP. Revisiting the role of the prefrontal cortex in the pathophysiology of attention-deficit/hyperactivity disorder. Psychol Bull. 2006;132:560–581. doi: 10.1037/0033-2909.132.4.560. [DOI] [PubMed] [Google Scholar]
- Heilman KM. A possible pathophysiologic substrate of attention deficit hyperactivity disorder. J Child Neurol. 1991;6:S74–S79. doi: 10.1177/0883073891006001s09. [DOI] [PubMed] [Google Scholar]
- Hollingshead AB. Four Factor Index of Social Status. New Haven, CT: Yale University, Department of Sociology; 1975. [Google Scholar]
- Im K, Lee JM, Lee J, Shin YW, Kim IY, Kwon JS, Kim SI. Gender difference analysis of cortical thickness in healthy young adults with surface-based methods. Neuroimage. 2006;31:31–38. doi: 10.1016/j.neuroimage.2005.11.042. [DOI] [PubMed] [Google Scholar]
- Kates WR, Frederikse M, Mostofsky SH, Folley BS, Cooper K, Mazur-Hopkins P, Kofman O, Singer HS, Denckla MB, Pearlson GD, Kaufmann WE. MRI parcellation of the frontal lobe in boys with attention deficit hyperactivity disorder or Tourette syndrome. Psychiatry Res. 2002;116:63–81. doi: 10.1016/s0925-4927(02)00066-5. [DOI] [PubMed] [Google Scholar]
- Luders E, Narr KL, Thompson PM, Rex DE, Woods RP, Deluca H, Jancke L, Toga AW. Gender effects on cortical thickness and the influence of scaling. Hum Brain Mapp. 2006;27:314–324. doi: 10.1002/hbm.20187. [DOI] [PMC free article] [PubMed] [Google Scholar]
- Lyoo IK, Sung YH, Dager SR, Friedman SD, Lee JY, Kim SJ, Kim N, Dunner DL, Renshaw PF. Regional cerebral cortical thinning in bipolar disorder. Bipolar Disord. 2006;8:65–74. doi: 10.1111/j.1399-5618.2006.00284.x. [DOI] [PubMed] [Google Scholar]
- Makris N, Biederman J, Valera EM, Bush G, Kaiser J, Kennedy DN, Caviness VS, Faraone SV, Seidman LJ. Cortical thinning of the attention and executive function networks in adults with attention-deficit/hyperactivity disorder. Cereb Cortex. 2007;17:1364–1375. doi: 10.1093/cercor/bhl047. [DOI] [PubMed] [Google Scholar]
- Mima T, Mikawa T. Folding of the tectal cortex by local remodeling of neural differentiation. Dev Dyn. 2004;229:475–479. doi: 10.1002/dvdy.10459. [DOI] [PubMed] [Google Scholar]
- Mostofsky SH, Reiss AL, Lockhart P, Denckla MB. Evaluation of cerebellar size in attention deficit hyperactivity disorder. J Child Neurol. 1998;13:434–439. doi: 10.1177/088307389801300904. [DOI] [PubMed] [Google Scholar]
- Mostofsky SH, Cooper KL, Kates WR, Denckla MB, Kaufmann WE. Smaller prefrontal and premotor volumes in boys with ADHD. Biol Psychiatry. 2002;52:785–794. doi: 10.1016/s0006-3223(02)01412-9. [DOI] [PubMed] [Google Scholar]
- Park HJ, Lee JD, Chun JW, Seok JH, Yun M, Oh MK, Kim JJ. Cortical surface-based analysis of 18F-FDG PET: Measured metabolic abnormalities in schizophrenia are affected by cortical structural abnormalities. Neuroimage. 2006;31:1434–1444. doi: 10.1016/j.neuroimage.2006.02.001. [DOI] [PubMed] [Google Scholar]
- Reich W, Welner Z, Herjanic B. The Diagnostic Interview for Children and Adolescents-IV. North Tonawanda: Multi-Health Systems; 1997. [Google Scholar]
- Salat DH, Buckner RL, Snyder AZ, Greve DN, Desikan RS, Busa E, Morris JC, Dale AM, Fischl B. Thinning of the cerebral cortex in aging. Cereb Cortex. 2004;14:721–730. doi: 10.1093/cercor/bhh032. [DOI] [PubMed] [Google Scholar]
- Schmitt JE, Watts K, Eliez S, Bellugi U, Galaburda AM, Reiss ALÂ. Increased gyrification in Williams syndrome: Evidence using 3D MRI methods. Dev Med Child Neurol. 2002;44:292–295. doi: 10.1017/s0012162201002109. [DOI] [PubMed] [Google Scholar]
- Segonne F, Dale AM, Busa E, Glessner M, Salat D, Hahn HK, Fischl B. A hybrid approach to the skull stripping problem in MRI. Neuroimage. 2004;22:1060–1075. doi: 10.1016/j.neuroimage.2004.03.032. [DOI] [PubMed] [Google Scholar]
- Shaw P, Lerch J, Greenstein D, Sharp W, Clasen L, Evans A, Giedd J, Castellanos FX, Rapoport J. Longitudinal mapping of cortical thickness and clinical outcome in children and adolescents with attention-deficit/hyperactivity disorder. Arch Gen Psychiatry. 2006;63:540–549. doi: 10.1001/archpsyc.63.5.540. [DOI] [PubMed] [Google Scholar]
- Sowell ER, Thompson PM, Welcome SE, Henkenius AL, Toga AW, Peterson BS. Cortical abnormalities in children and adolescents with attention-deficit hyperactivity disorder. Lancet. 2003;362:1699–1707. doi: 10.1016/S0140-6736(03)14842-8. [DOI] [PubMed] [Google Scholar]
- Sowell ER, Peterson BS, Kan E, Woods RP, Yoshii J, Bansal R, Xu D, Zhu H, Thompson PM, Toga AW. Sex differences in cortical thickness mapped in 176 healthy individuals between 7 and 87 years of age. Cereb Cortex. 2007;17:1550–1560. doi: 10.1093/cercor/bhl066. [DOI] [PMC free article] [PubMed] [Google Scholar]
- Talairach J, Tournoux P. Co-planar Stereotaxic Atlas of the Human Brain. New York: Thieme Medical Publishers; 1988. [Google Scholar]
- Thompson PM, Hayashi KM, Sowell ER, Gogtay N, Giedd JN, Rapoport JL, de Zubicaray GI, Janke AL, Rose SE, Semple J, Doddrell DM, Wang Y, van Erp TG, Cannon TD, Toga AW. Mapping cortical change in Alzheimer’s disease, brain development, and schizophrenia. Neuroimage. 2004;23(Suppl 1):S2–S18. doi: 10.1016/j.neuroimage.2004.07.071. [DOI] [PubMed] [Google Scholar]
- Van Essen DC. A tension-based theory of morphogenesis and compact wiring in the central nervous system. Nature. 1997;385:313–318. doi: 10.1038/385313a0. [DOI] [PubMed] [Google Scholar]
- Van Essen DC, Drury HA. Structural and functional analyses of human cerebral cortex using a surface-based atlas. J Neurosci. 1997;17:7079–7102. doi: 10.1523/JNEUROSCI.17-18-07079.1997. [DOI] [PMC free article] [PubMed] [Google Scholar]
- Vance A, Silk TJ, Casey M, Rinehart NJ, Bradshw JL, Bellgrove MA, Cunnington R. Right parietal dysfunction in children with attention deficit hyperactivity disorder, combined type: A functional MRI study. Mol Psychiatry. 2007 doi: 10.1038/sj.mp.4001999. Epub ahead of print. [DOI] [PubMed] [Google Scholar]
- Wechsler D. Wechsler Intelligence Scale for Children-III. San Antonio, TX: The Psychological Corporation; 1991. [Google Scholar]
- Wechsler DL. Wechsler Individual Achievement Test-II. San Antonio, TX: The Psychological Corporation; 2002. [Google Scholar]
- Wechsler DL. Wechsler Intelligence Scale for Children. 4. San Antonio, TX: The Psychological Corporation; 2003. [Google Scholar]
- Zilles K, Armstrong E, Schleicher A, Kretschmann HJ. The human pattern of gyrification in the cerebral cortex. Anat Embryol (Berl) 1988;179:173–179. doi: 10.1007/BF00304699. [DOI] [PubMed] [Google Scholar]