

Abstract
Using a laser velocimeter, responses to tones were measured at a basilar membrane site located about 1.2 mm from the extreme basal end of the gerbil cochlea. In two exceptional cochleae in which function was only moderately disrupted by surgical preparations, basilar membrane responses had characteristic frequencies (CFs) of 34–37 kHz and exhibited a CF-specific compressive nonlinearity: Sensitivity near the CF decreased systematically and the response peaks shifted toward lower frequencies with increasing stimulus level. Response phases also changed with increases in stimulus level, exhibiting small relative lags and leads at frequencies just lower and higher than CF, respectively. Basilar membrane responses to low-level CF tones exceeded the magnitude of stapes vibrations by 54–56 dB. Response phases led stapes vibrations by about 90° at low stimulus frequencies; at higher frequencies, basilar membrane responses increasingly lagged stapes vibration, accumulating 1.5 periods of phase lag at CF. Postmortem, nonlinearities were abolished and responses peaked at ~0.5 octave below CF, with phases which lagged and led in vivo responses at frequencies lower and higher than CF, respectively. In conclusion, basilar membrane responses near the round window of the gerbil cochlea closely resemble those for other basal cochlear sites in gerbil and other species.
Keywords: inner ear, auditory, basilar membrane, cochlear mechanics, compressive nonlinearity
INTRODUCTION
Although the Mongolian gerbil is widely used as a model for studying the mammalian auditory system, including its development and aging, few studies have measured the vibrations of the basilar membrane in this species (Cooper 2000; Ren and Nuttall 2001; Xue et al. 1995). We describe here the magnitude and phase characteristics of basilar membrane responses to tones at a site near the round window of the gerbil cochlea where one comparable investigation found insensitive and almost linear responses (Xue et al. 1995). Basilar membrane responses in two cochleae exhibited prominent compressive nonlinearities which resembled, qualitatively and quantitatively, those at comparable sites in other mammalian species (Cooper 1999; Cooper and Rhode 1992, 1997; Narayan and Ruggero 2000; Rhode and Recio 2000) as well as at other basal locations in gerbil cochleae (Cooper 2000; Ren and Nuttall 2001). The present results have been reported in preliminary form in an abstract (Overstreet and Ruggero 1998) and in a Ph.D. dissertation (Overstreet 2000). [Some of the results reported here differ from those in the dissertation; the data have been extensively reanalyzed using different sound-stimulus calibrations (see Methods) and some errors have been corrected.]
METHODS
Animal preparation
All experiments were conducted in accordance with the guidelines of the Northwestern University’s Animal Care and Use Committee. Subjects were Mongolian gerbils (Meriones unguiculatus) with ages between 90 and 160 days after birth (DAB). Gerbils were sedated with a 0.01-mL subcutaneous injection of ketamine HCl (100 mg/mL) and initially anesthesized with an intraperitoneal injection of sodium pentobarbital (48 mg/kg), supplemented as needed to maintain deep anesthesia. During the course of the experiment the animals were kept hydrated with 0.1-cc intraperitoneal injections of Pedialyte (Abbott Laboratories, Abbott Park, IL; each liter of this solution contains 45 mEq Na, 20 mEq K, 35 mEq Cl, 30 mEq citrate, and 25g dextrose), administered at ~90-minute intervals. The gerbils were placed upon a vibration-isolation table (Technical Manufacturing Corporation, Durham, CT; model No. 63–561) within a sound-insulated chamber (Industrial Acoustics Company), Bronx NY. Rectal temperature was monitored and maintained at 39°C by means of a servo-controlled, battery-powered electrical heating pad wrapped around the animal. All gerbils were tracheotomized and intubated to maintain a patent airway.
The gerbil’s head was firmly affixed to a custom-made holder which was heated to maintain normal cochlear temperature during physiological recordings (to compensate for the effects of deep anesthesia and the widely opened bulla) (Brown et al. 1983; Shore and Nuttall 1985). The left pinna was removed to allow the insertion into the ear canal of a speculum containing the probe tube of Knowles EK3103 miniature microphone and the sound source (Knowles Electronics, Itasca, IL). After opening the ventral aspect of the bulla, a silver-wire ball electrode was placed on the bone near the round window to record compound action potentials (CAPs) evoked by tone pips. The CAP thresholds as a function of stimulus frequency served as an “audiogram” to assess cochlear sensitivity. The round-window membrane was then removed and reflective glass microbeads were allowed to gently settle on the basilar membrane nearby.
Sound system and its calibration
Acoustic stimuli were generated via a modified RadioShack tweeter (RadioShack, Fort Worth, TX) (Chan et al. 1993) coupled to the ear speculum. The tweeter was driven with electrical sinusoids (1–40 kHz) digitally synthesized with a Tucker-Davis system (Tucker-Davis Technologies, Gainesville, FL) controlled by a computer. The sensitivity and phases of basilar membrane vibrations presented in this article were referenced to pressure using a “hybrid calibration” combining an “in situ probe-tube calibration” measured in each ear with an average “artificial-cavity calibration” (Overstreet and Ruggero 2002). This procedure was adopted because we found that referencing stapes vibrations to pressure calibrations measured in situ with a probe tube introduced valleys and peaks in velocity magnitude-vs-frequency curves at frequencies higher than 30 kHz which appeared to be local and largely spurious features without counterpart in the effective pressure driving ossicular vibrations.
An in situ probe-tube calibration was measured in the ear canal of each gerbil using a miniature microphone fitted with a thin, small-diameter probe tube whose tip was placed within 2.5 mm of the tympanic membrane. The artificial-cavity calibration was an average of measurements in an enclosed cavity simulating the external ear canal of the gerbil with a 1/8-in. Brüel & Kjaer microphone (B & K, Langen, Germany) as a stand-in for the tympanic membrane. At stimulus frequencies 16.5 kHz and lower, the magnitudes of the hybrid pressure calibrations were identical to those measured in situ; at frequencies higher than 25 kHz, they were identical to the magnitudes in the artificial-cavity calibration; between 16.5 and 25 kHz, the magnitudes were weighted averages of the in situ and artificial-cavity calibrations, with the weight of the latter increasing smoothly from nil at 16.5 kHz to 100% at 25 kHz. The phases of the hybrid calibration were obtained by adding pure delays of 162–165 μs to “minimum” phases computed from the magnitudes of the hybrid calibration (Overstreet and Ruggero 2002).
Stimulus protocol
CAP thresholds were measured using an automated procedure which, for each stimulus frequency, determined the sound pressure level (SPL, expressed in decibels referenced to 20 μPa) required to achieve a predetermined CAP magnitude (typically, 7 μV). Stimuli were tone pips with onset phases randomized to cancel out cochlear microphonics and ramped with a 0.75-ms rise/fall time to efficiently synchronize the neural spikes without losing frequency resolution due to spectral splatter.
Stimuli for the measurement of stapes and basilar membrane vibrations were 5-ms tones presented every 50 ms with rise/fall times of 0.75 ms. Basilar membrane and stapes velocity responses to 256–4098 stimulus repetitions were time averaged for each stimulus condition, depending upon the signal-to-noise ratio. Responses were used only if their averaged magnitudes exceeded the magnitude of the noise floor by at least 6 dB. (The noise floor was defined as the average spectral magnitude at frequencies adjacent to those of the stimulus tones).
Laser velocimetry data collection
Basilar membrane and stapes velocity responses were recorded with Dantec (Skovlunde, Denmark) laser velocimeter, which consists of a 20-mW He-Ne laser, a headstage, and a Doppler frequency tracker (Ruggero and Rich 1991). The headstage was coupled to an Olympus compound microscope (Olympus, America, Inc., Melville, NY) equipped with a 20X ultra-long working-distance objective (Mitutoyo 20SL, N.A. 0.42, Mitutoyo America Corp., Aurora, IL) focused on one or more microbeads (diameter = 20–30 μm) placed on the basilar membrane or the head of the stapes. The Doppler frequency tracker generated a voltage signal proportional to target velocity by comparing the frequencies of the light beams emitted by the laser and reflected from the glass bead. This voltage signal was digitized with 16-bit resolution at a sampling rate of 166 kHz and stored on a computer.
Data analysis
MATLAB programs (Mathworks, Natick, MA) were used to compute the discrete Fourier transform of the time-averaged response waveforms. The velocity-response magnitudes and phases were imported into a spreadsheet (EXCEL, Microsoft Corp., Redmond, WA) for further processing. All magnitude and phase averages were 3-point smoothed and then exported into AXUM (Mathsoft, Cambridge MA) for graph generation. Three-point smoothing was used to reduce spectral jaggedness caused by variations in sensitivity of responses recorded at different times at odd and even multiples of 500 Hz.
RESULTS
Vulnerability of basilar membrane responses near the round window of the gerbil cochlea
At a site of the gerbil cochlea located 3 mm from the round window (as estimated by Olson 1999) normal basilar membrane vibrations are characterized by substantial compressive nonlinearity (i.e., response-growth rates lower than 1 dB per 1 dB of stimulus increase) and high sensitivity at the characteristic frequency (Cooper 2000; Ren and Nuttall 2001). [We use “best frequency” (BF) to refer to the stimulus frequency that elicits the most sensitive auditory response, regardless of cochlear health; we reserve “characteristic frequency” (CF) to refer to the BF of responses to low-level stimuli in normal adult cochleae.] In the present study such characteristics were demonstrated in only 2 out of about 180 adult gerbils in which basilar membrane measurements were attempted at a site distant 1.2 mm from the round window. [Many of the gerbils were used to develop surgical and other experimental procedures. Cochlear trauma (indicated by CAP threshold elevations at high stimulus frequencies) often occurred after excising the round window membrane.] Even in these two animals, basilar membrane responses probably were not representative of those in entirely normal cochleae: at the time that the recording of vibrations began, CAP thresholds at frequencies flanking the CFs of the recording sites [averaging 30 dB SPL in normal cochleae (Overstreet 2000)] had undergone elevations of 33 and 36 dB relative to thresholds measured 2 or 4 hours earlier (immediately after opening the bulla and before removal of the round-window membrane). These elevations were probably caused principally by deterioration of basilar membrane sensitivity but they may reflect additional dysfunction of the inner hair cells or auditory nerve fibers.
Velocity-intensity functions
Figure 1 plots the magnitudes of basilar membrane responses to tones in one gerbil cochlea (eo155) as a function of SPL. In Figure 1A, response magnitudes are expressed as peak velocity, with stimulus frequency indicated as the parameter (legend in Fig. 1B). Responses to 35-kHz (CF) tones grew at an approximately linear rate between 20 and 30 dB SPL but grew at compressive rates, averaging 0.4 dB/dB, at higher intensities. Responses to other stimuli with frequency near CF also grew at compressive rates. In contrast, responses to tones with frequency well below CF (e.g., 21.5 kHz and lower) grew at a linear rate (1 dB/dB; thick dashed line). Responses to near-CF tones in another cochlea (eo162) also grew at a compressive rate of 0.4 dB/dB (see Figs. 3 and 5).
FIG. 1.
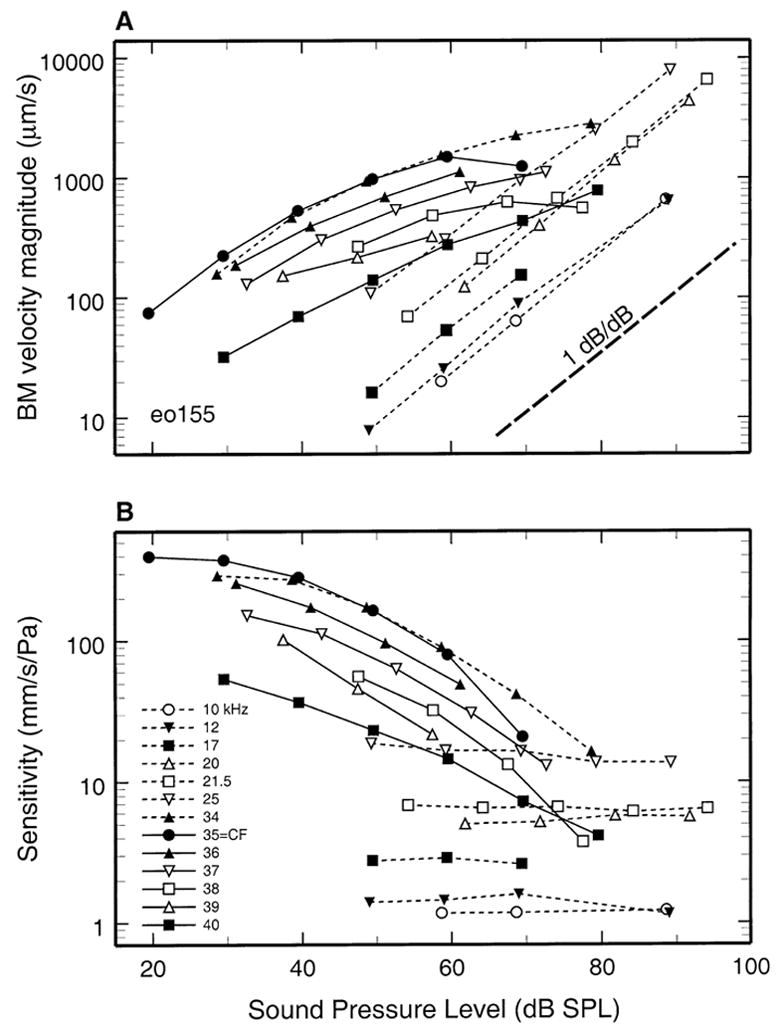
Input/output functions for basilar membrane responses to tones near the round window of the gerbil cochlea. Solid lines connect data points for stimulus frequencies equal to and higher than CF. Thin dashed lines connect data points for stimulus frequencies lower than CF. A. Basilar membrane velocity magnitude as a function of stimulus intensity for several frequencies. The thick dashed line indicates lineargrowth (1dB/dB). B. Sensitivity of basilar membrane vibrations (velocity divided by stimulus pressure, mm/s/Pa) plotted as a function of stimulus SPL.
FIG. 3.
Basilar membrane and stapes vibration as a function of stimulus frequency and level. Data from gerbil eo162. All other details as for Fig. 2.
FIG. 5.
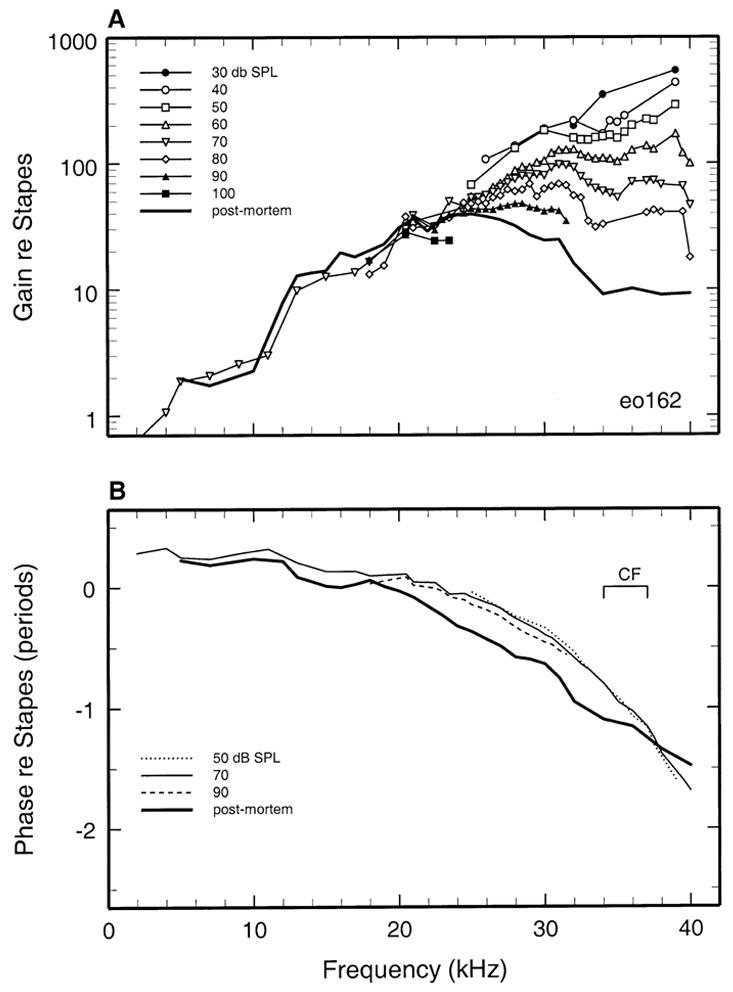
Basilar Membrane vibrations relative to stapes motion plotted as a function of stimulus frequency with SPL as the parameter. Data from gerbil eo162. All other details as for Fig. 4.
Response sensitivity as function of stimulus level and frequency
Figure 1B replots the data of Figure 1A as sensitivity-intensity functions, i.e., the variation of velocity magnitude normalized to a pressure of 1 Pa as a function of SPL (the parameter is stimulus frequency). For stimuli near CF, the compressive nonlinearity resulted in decreases of sensitivity as a function of increasing SPL. For 35-kHz (CF) tones, the reduction of sensitivity amounted to 25.5 dB between 30 and 70 dB SPL. At frequencies sufficiently lower than CF (e.g., 20 or 21.5 kHz), basilar membrane response sensitivity did not vary with stimulus intensity.
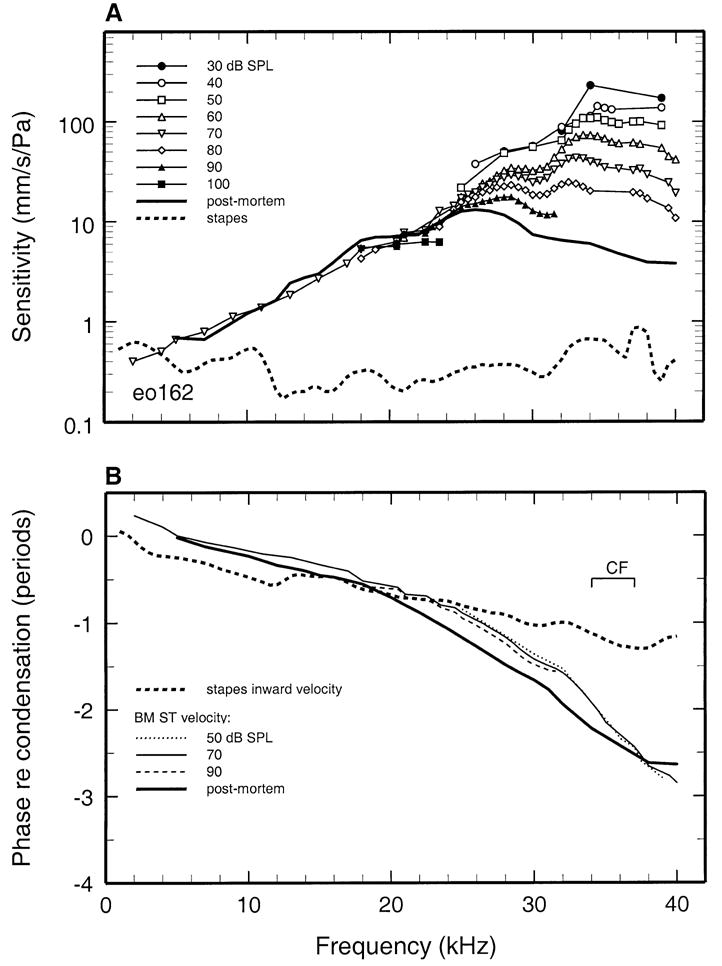
Sensitivity data (including those of Fig. 1B) are plotted in Figure 2A in the form of iso intensity functions, with stimulus frequency indicated in the abscissa and stimulus SPL as the parameter. For stimulation with CF tones at 20 dB SPL, response sensitivity was about 400 mm/s/Pa. In another cochlea (Fig. 3A), the CF fell in the range between 34 and 37 kHz but could not be determined more precisely. In that frequency range, sensitivity was about 240 mm/s/Pa at 30 dB SPL. In both cochleae, responses became more broadly tuned and less sensitive as a function of increasing stimulus level.
FIG. 2.
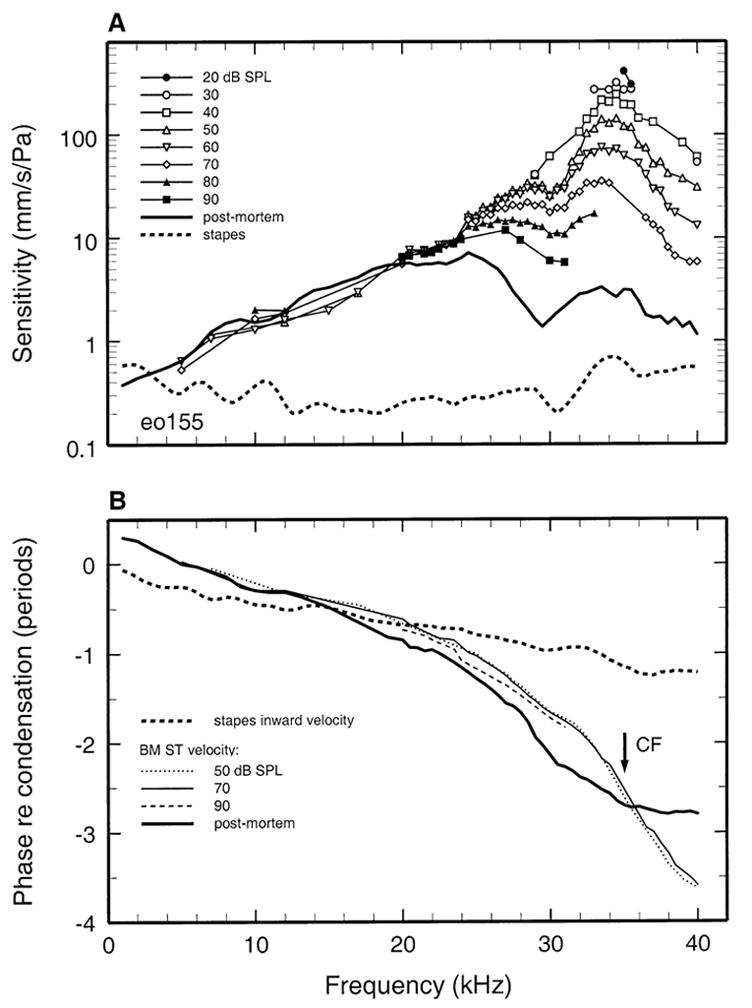
Basilar membrane and stapes vibration as a function of stimulus frequency and level. Basilar membrane velocity normalized to pressure (mm/s/Pa) is shown as a function of frequency with stimulus SPL as the parameter (symbols). Also shown are the sensitivity of stapes responses (dashed line) and of postmortem basilar membrane responses in the same animal (thick solid line). A. Magnitude data. B. The phases of basilar membrane and stapes responses (velocity toward scala tympani and inward velocity, respectively), expressed relative to the time of peak condensation, are plotted as a function of frequency. Data from gerbil eo 155.
For comparison with the responses of the basilar membrane, Figures 2A and 3A also show the velocity sensitivity of stapes responses recorded in the same gerbils. Since the responses of the stapes grew linearly, only one sensitivity curve is shown for each ear, although for most frequencies this curve represents averages of responses obtained at two or more stimulus levels. The stapes response magnitudes in both ears were relatively uniform across frequencies, hovering around 0.4–0.5 mm/s/Pa (Overstreet and Ruggero 2002).
The phases of basilar membrane and stapes responses to tones, referenced to stimulus pressure, are shown in Figures 2B and 3B. Inward velocity of the stapes was approximately in phase with peak condensation at low stimulus frequencies and reached a lag somewhat exceeding 1 period at 40 kHz. As expected, basilar membrane response phases changed at a faster rate than stapes responses as a function of frequency, exhibiting the familiar pattern of a relatively shallow slope at frequencies well below CF and a steep slope around CF. Basilar membrane responses at CF lagged low-frequency responses by 2–3 periods.
Basilar membrane responses referenced to stapes vibration
To assess the frequency and intensity dependencies of basilar membrane responses to tones in isolation from the response properties of the middle ear, the basilar membrane data of Figures 2 and 3 are presented in Figures 4 and 5 after normalization to stapes motion. For cochlea eo155, the magnitude of basilar membrane responses to CF tones exceeded those of the stapes by a factor of 600 (i.e., ~56 dB) at 20 dB and 350 at 40 dB (Fig. 4). Figure 5 presents basilar membrane data referenced to stapes vibrations for a second cochlea (eo162). In isolation from middle-ear effects, the peak gain (re stapes) was 550 (or 54 dB) at 30 dB SPL, i.e., very similar to the peak gain in cochlea eo155. Sensitivities in the two cochleae also varied similarly as a function of stimulus frequency and level: As stimulus intensity was raised from 30 to 90 dB SPL, the BFs shifted downward by about 0.5 octave and gains at BF decreased by 19 and 22 dB, respectively, in eo155 and eo162.
FIG. 4.
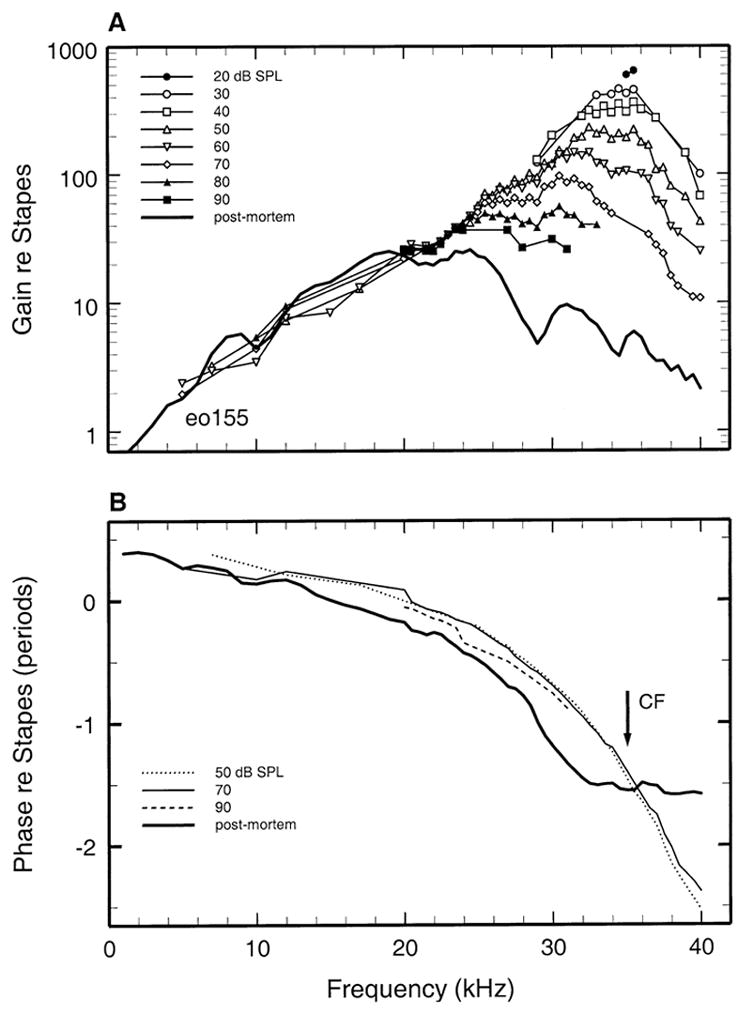
Basilar membrane vibrations relative to stapes motion plotted as a function of frequency with SPL as the parameter. The thick solid lines indicates postmortem responses. A. Basilar membrane sensitivity functions (velocity magnitude re stapes velocity magnitude). B. The phases of basilar membrane velocity toward scala tympani relative to inward stapes velocity. Data from gerbil eo155.
Figures 4B and 5B show the phases of basilar membrane responses plotted relative to the responses of the stapes. The phase-vs.-frequency curves of basilar membrane velocity toward scala tympani led those of inward stapes velocity at low frequencies and exhibited the two-segment pattern typical of basilar membrane responses at the base of the cochlea (reviewed by Robles and Ruggero 2001): a shallow slope at low frequencies and a steep slope around CF. The group delays for these segments were 24 and 205 μs in cochlea eo155 (Fig. 4) and 15 and 130 μs in cochlea eo162 (Fig. 5). In both cochleae, the accumulated phase lag was about 1.5 periods near CF, and responses exhibited small relative lags and leads with increasing stimulus level at frequencies lower and higher than CF.
Postmortem responses
Basilar membrane responses were recorded postmortem in cochleae eo155 (Figs. 2 and 4), eo162 (Figs. 3 and 5), and in two other cochleae (Fig. 6). Postmortem responses grew linearly and their magnitudes at CF were 30–40 dB lower than the peak in vivo gains (Figs. 4 and 5).
FIG. 6.
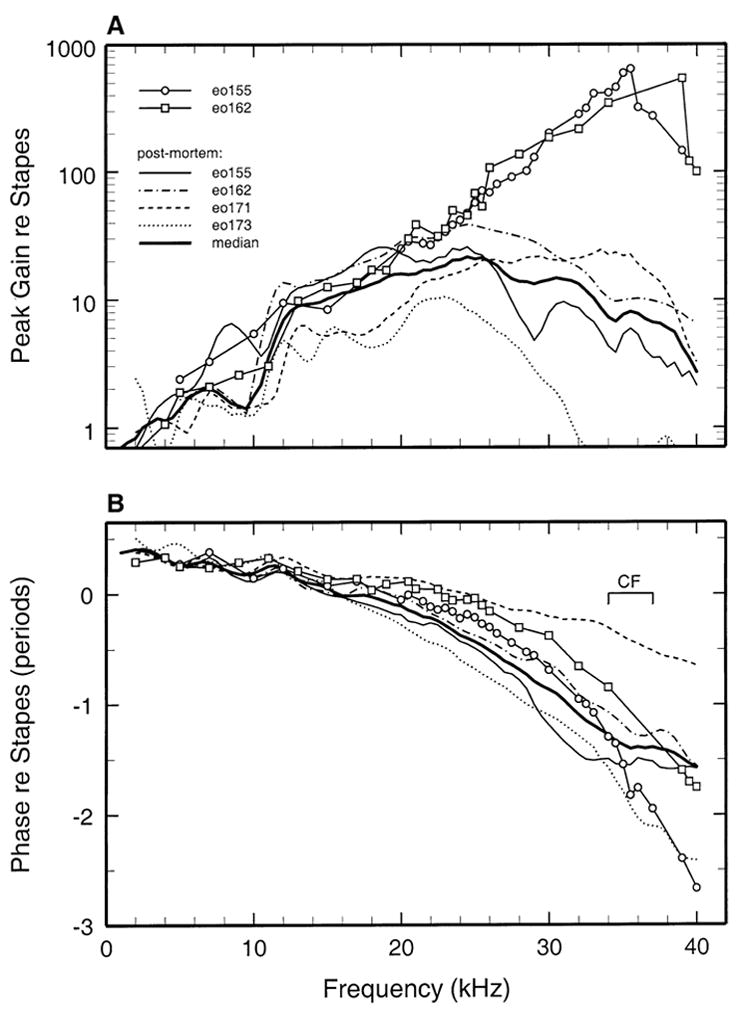
A comparison of basilar membrane responses in vivo (open symbols) and postmortem (thin lines). Also shown are the medians of the postmortem functions (thick continuous lines). A. The peak gain magnitudes of in vivo basilar membrane responses in two cochleae and of postmortem responses in the same and in two other cochleae (thin lines). B. The response phases corresponding to the gains of 1A.
In cochlea eo155, postmortem basilar membrane responses exhibited large phase shifts relative to responses in vivo (Fig. 4B). In contrast with the steep phase slope characterizing in vivo responses near CF, the phases of postmortem responses approached a plateau at a frequency (~30 kHz) well below CF. Thus, in comparison with in vivo responses, postmortem phases exhibited large lags and leads, respectively, at frequencies lower and higher than CF. In another cochlea (eo162), the postmortem phase shifts (Fig. 5B) were qualitatively similar to those in eo155 but less pronounced.
Figure 6 compares in vivo basilar membrane responses in two cochleae with postmortem responses in four cochleae (including the two from which the in vivo responses were recorded). Figure 6A shows response magnitudes, expressed as gain re stapes (i.e., basilar membrane velocity divided by stapes velocity). The postmortem gain curves varied widely, especially at frequencies higher than BF, probably due to differences in recording sites. Postmortem, the response-velocity peaks were 23–25 dB less sensitive than the maximum gains of in vivo responses.
Figure 6B shows the phases of maximum basilar membrane velocity toward scala tympani (relative to maximum inward velocity of the stapes) of in vivo responses in two cochleae as well as the postmortem response phases in four cochleae. Phase lags were negatively correlated with BFs, e.g., lags at 40 kHz of <1 period and 2.5 periods, respectively, corresponded to BFs of 35 and 23 kHz. On average, postmortem responses substantially lagged in vivo responses at frequencies < CF and led in vivo responses at frequencies > CF, i.e., a pattern qualitatively similar (but exaggerated in magnitude) to that evident in the phases of in vivo responses to intense stimuli relative to responses to low-level stimuli.
DISCUSSION
The frequency-position map of the gerbil cochlea
Our estimate of CF for the basilar membrane site located some 1.2 mm from the basal extreme of the gerbil cochlea — 34–37 kHz — is in excellent agreement with a frequency-place map derived by fitting the Greenwood equation (Greenwood 1961, 1990) to CF and place data from labeled auditory nerve fibers (Müller 1996). According to this map, the CF of auditory nerve fibers innervating inner hair cells at the 1.2-mm site of a gerbil cochlea of average length (11.1 mm) is 36.2 kHz. [This value contrasts with earlier estimates derived from cochlear micro-phonics (Sokolich et al. 1976) and the summating potential (Olson and Mountain 1991) (20 and 17 kHz, respectively), which were probably marred by inaccuracies caused by the long wavelengths of gross cochlear potentials.]
“Passive” mechanical responses near the round window of the gerbil cochlea
Vibrations of the basilar membrane near the round window of the gerbil cochlea were measured in vivo in one previous investigation (Xue et al. 1995) and derived from recordings of pressure in scala tympani in another (Olson 1998, 1999)]. Both investigations reported insensitive and linear (or nearly linear) responses, which probably resulted from severe cochlear injury caused by the preparatory surgery (also a common occurrence in the present study, see the Results section). Thus, it is not surprising that the previous in vivo results resemble the present postmortem data in several respects, including BFs of 25–30 kHz, sensitivity at BF of about 10 mm/s/Pa (Olson 1999) or 20 dB re umbo (Xue et al. 1995), and a “tip-to-tail” ratio (measured between BF and 4–8 kHz) of about 20 dB.
The phases of in vivo (but “passive”) basilar membrane responses reported by Xue et al. (1995) also resemble the postmortem phases measured in the present study (Fig. 6): phase leads of ~0.25 period at low frequencies and a cumulative phase lag approaching 1 period at ~36 kHz, re ossicular vibrations. Some of the basilar membrane phase-vs.-frequency curves derived from pressure measurements (Olson 1998) also exhibit comparable lags (i.e., a phase accumulation of 1.4 periods at 36 kHz). In addition, the phase data of Olson (1998, 1999) [but not those of Xue et al. (1995)] include high-frequency plateaus comparable to those of the present postmortem recordings (Figs. 2–5).
Similarity of mechanical responses near the round window and at other basal sites of the gerbil cochlea
Basilar membrane responses at the 1.2-mm site of the gerbil cochlea resemble those at sites with CFs of 14–19 kHz (Cooper 2000; Ren and Nuttall 2001) located about 1.8 mm farther away from the round window [according to an estimate by Olson (1999)]. At the two locations, response magnitudes grew at similar compressive rates (0.4–0.5 dB/dB) and the frequencies of the response peaks shifted downward by 0.5–0.6 octave with increasing stimulus level. At the 14–19-kHz site, gains (re stapes) for responses to 30- or 40-dB CF tones were 300 (Ren and Nuttall 2001) and 700 (Cooper 2000), comparable to the gains (550 or 600) for 20- or 30-dB CF tones at the 34–37- kHz site (Figs. 4 and 5). Postmortem basilar membrane vibrations at the two sites were 20–40 times larger than stapes vibrations (Figs. 4–6; Ren and Nuttall 2001).
At both the 1.2- and 3-mm locations, phase lags re stapes were 1–1.5 periods at CF, continued accumulating by at least one additional period at frequencies higher than CF, and varied as a function of increasing stimulus level in qualitatively the same manner (lags and leads below and above CF, respectively). The one way in which the results at the two basilar membrane sites differ significantly is that the group delays (re stapes) at low frequencies and near CF are much shorter at the 1.2-mm site (15–24 and 130–205 μs respectively) than at the 3-mm site [70 and 500 μs (Ren and Nuttall 2001); 110–160 and 370–500 μs (Cooper 2000)]. Perusal of Table 2 of Robles and Ruggero (2001) suggests that such a trend in gerbil (i.e., shorter near-CF group delays at sites closer to the round window) may be consistent with results for other species.
Are basilar membrane responses near the round window less sensitive than at other basal sites?
Some studies of basilar membrane vibrations near the round windows of the cochleae of guinea pig (Cooper and Rhode 1992), chinchilla (Narayan and Ruggero 2000), and gerbil (Xue et al. 1995) reported responses that were less sensitive than at other basal locations in the same species (reviewed by Robles and Ruggero 2001). However, newer measurements suggest that the apparent sensitivity differences are related to surgical damage, to which the region near the round window may be especially susceptible (Narayan and Ruggero 2000; Olson 1999). As discussed in the subsection above, basilar membrane responses at the 1.2-mm site of the gerbil cochlea are as sensitive as at a site located 1.8 mm farther away from the round window.
Similarly, Cooper (1999) found greater nonlinearity and sharper frequency tuning at the hook region of the guinea pig cochlea than had been reported by an earlier study of cochleae with higher neural thresholds (Cooper and Rhode 1992). Again, a systematic comparison of responses at the hook region and at other basal locations of the chinchilla cochlea indicates that basilar- membrane gains re stapes are approximately uniform — about 79 dB — in the entire CF range of 5.5–15 kHz (Rhode and Recio 2000). This value is 22 dB greater than previously reported for the 15-kHz site (Narayan and Ruggero 2000) but identical to the one calculated for the 9-kHz region in the same species (Ruggero et al. 1990). In conclusions, in reasonably normal mammalian cochleae, the sensitivity of basilar membrane responses near the round window appear to be similar to those at other, less extreme, basal sites.
Acknowledgments
The authors were supported by Grant R01-DC-00419 from the National Institute on Deafness and Other Communication Disorders (NIH). They thank Jon Siegel for his help in the modification of the RadioShack tweeter and two anonymous referees for their thoughtful comments. The substance of this article was part of a doctoral dissertation (Overstreet 2000).
References
- Brown MC, Smith DI, Nuttall AL. Anesthesia and surgical trauma: their influence on the guinea pig compound action potential. Hear Res. 1983;10:345–358. doi: 10.1016/0378-5955(83)90097-7. [DOI] [PubMed] [Google Scholar]
- Chan JC, Musicant AD, Hind JE. An insert earphone system for delivery of spectrally shaped signals for physiological studies. J Acoust Soc Am. 1993;93:1496–1501. doi: 10.1121/1.406807. [DOI] [PubMed] [Google Scholar]
- Cooper NP. Vibration of beads placed on the basilar membrane in the basal turn of the cochlea. J Acoust Soc Am. 1999;106:L59–L64. doi: 10.1121/1.428147. [DOI] [PubMed] [Google Scholar]
- Cooper NP. Basilar membrane vibrations in the basal turn of the gerbil cochlea. Abstr Assoc Res Otolaryngol. 2000;23:205. [Google Scholar]
- Cooper NP, Rhode WS. Basilar membrane mechanics in the hook region of cat and guinea-pig cochleae: sharp tuning and non-linearity in the absence of baseline position shifts. Hear Res. 1992;63:163–190. doi: 10.1016/0378-5955(92)90083-y. [DOI] [PubMed] [Google Scholar]
- Cooper NP, Rhode WS. Mechanical responses to two-tone distortion products in the apical and basal turns of the mammalian cochlea. J Neurophysiol. 1997;78:261–270. doi: 10.1152/jn.1997.78.1.261. [DOI] [PubMed] [Google Scholar]
- Greenwood DD. Critical bandwidth and the frequency coordinates of the basilar membrane. J Acoust Soc Am. 1961;33:1344–1356. [Google Scholar]
- Greenwood DD. A cochlear frequency-position function for several species–29 years later. J Acoust Soc Am. 1990;87:2592–2605. doi: 10.1121/1.399052. [DOI] [PubMed] [Google Scholar]
- Müller M. The cochlear place-frequency map of the adult and developing Mongolian gerbil. Hear Res. 1996;94:148–156. doi: 10.1016/0378-5955(95)00230-8. [DOI] [PubMed] [Google Scholar]
- Narayan SS, Ruggero MA. Basilar-membrane mechanics at the hook region of the chinchilla cochlea. In: Wada H, Takasaka T, Ikeda K, Ohyama K, Koike T, editors. Recent Developments in Auditory Mechanics. Singapore: World Scientific; 2000. pp. 95–101. [Google Scholar]
- Olson ES. Observing middle and inner ear mechanics with novel intracochlear pressure sensors. J Acoust Soc Am. 1998;103:3445–3463. doi: 10.1121/1.423083. [DOI] [PubMed] [Google Scholar]
- Olson ES. Direct measurement of intra-cochlear pressure waves. Nature. 1999;402:526–529. doi: 10.1038/990092. [DOI] [PubMed] [Google Scholar]
- Olson ES, Mountain DC. In vivo measurement of basilar membrane stiffness. J Acoust Soc Am. 1991;89:1262–1275. doi: 10.1121/1.400535. [DOI] [PubMed] [Google Scholar]
- Overstreet EH. The development of basilar membrane mechanics in the mammalian cochlea. Doctoral Dissertation; University of Minnesota: 2000. [Google Scholar]
- Overstreet EH, Ruggero MA. Basilar membrane mechanics at the hook region of the Mongolian gerbil cochlea. Abstr Assoc Res Otolaryngol. 1998;21:181. [Google Scholar]
- Overstreet EH, Ruggero MA. Development of wide-band middle ear transmission in the Mongolian gerbil. J Acoust Soc Am Ill. 2002:261, 270. doi: 10.1121/1.1420382. [DOI] [PMC free article] [PubMed] [Google Scholar]
- Ren T, Nuttall AL. Basilar membrane vibration in the basal turn of the sensitive gerbil cochlea. Hear Res. 2001;151:48–60. doi: 10.1016/s0378-5955(00)00211-2. [DOI] [PubMed] [Google Scholar]
- Rhode WS, Recio A. Study of mechanical motions in the basal region of the chinchilla cochlea. J Acoust Soc Am. 2000;107:3317–3332. doi: 10.1121/1.429404. [DOI] [PubMed] [Google Scholar]
- Robles L, Ruggero MA. Mechanics of the mammalian cochlea. Physio Rev. 2001;81:1305–1352. doi: 10.1152/physrev.2001.81.3.1305. [DOI] [PMC free article] [PubMed] [Google Scholar]
- Ruggero MA, Rich NC. Application of a commercially-manufactured Doppler-shift laser velocimeter to the measurement of basilar-membrane vibration. Hear Res. 1991;51:215–230. doi: 10.1016/0378-5955(91)90038-b. [DOI] [PMC free article] [PubMed] [Google Scholar]
- Ruggero MA, Rich NC, Robles L, Shivapuja BG. Middle-ear response in the chinchilla and its relationship to mechanics at the base of the cochlea. J Acoust Soc Am. 1990;87:1612–1629. doi: 10.1121/1.399409. [DOI] [PMC free article] [PubMed] [Google Scholar]
- Shore SE, Nuttall AL. The effects of cochlear hypothermia on compound action potential tuning. J Acoust Soc Am. 1985;77:590–598. doi: 10.1121/1.391877. [DOI] [PubMed] [Google Scholar]
- Sokolich WG, Hamernik RP, Zwislocki JJ, Schmiedt RA. Inferred response polarities of cochlear hair cells. J Acoust Soc Am. 1976;59:963–974. doi: 10.1121/1.380955. [DOI] [PubMed] [Google Scholar]
- Xue S, Mountain DC, Hubbard AE. Electrically evoked basilar membrane motion. J Acoust Soc Am. 1995;97:3030–3041. doi: 10.1121/1.413103. [DOI] [PubMed] [Google Scholar]