

Abstract
Background and Objectives
The Advisory Committee on Immunization Practices has identified health care workers (HCWs) as a priority group to receive influenza vaccine. Although the importance of HCW to the health care system is well understood, the potential role of HCW in transmission during an epidemic has not been clearly established.
Methods
Using a standard SIR (Susceptible–Infected–Recovered) framework similar to previously developed pandemic models, we developed an agent-based model (ABM) of Allegheny County, PA, that incorporates the key health care system features to simulate the spread of an influenza epidemic and its effect on hospital-based HCWs.
Findings
Our simulation runs found the secondary attack rate among unprotected HCWs to be approximately 60% higher (54·3%) as that of all adults (34·1%), which would result in substantial absenteeism and additional risk to HCW families. Understanding how a pandemic may affect HCWs, who must be available to treat infected patients as well as patients with other medical conditions, is crucial to policy makers’ and hospital administrators’ preparedness planning.
Keywords: Computer simulation, infectious disease transmission, human influenza, professional to patient, agent-based model, pandemic
Our agent-based simulation model of Allegheny County, PA, finds that protecting hospital-based health care workers (HCWs) before or early in a pandemic will reduce absenteeism and have positive effects on the community as a whole.
Introduction
An important part of planning for an influenza pandemic is to understand how the pandemic may affect health care workers (HCWs). Most preparedness plans are contingent upon keeping the health care workforce available to treat infected patients as well as those with other medical conditions. However, as infected patients visit health care facilities (HCFs), they will interact closely with HCWs, who in turn will interact with other uninfected patients, colleagues, and their own family members. If infected, HCWs will not be able to perform their duties and could infect others.
Therefore, policy makers, hospital administrators, and other decision makers may need to forecast how many HCWs may become infected, how many HCWs will be available, how many patients each HCW should see, how soon HCWs should be protected, and the potential effects of varying HCW compliance with protective measures.
To help better understand the answers to these questions, we developed an agent-based computer simulation model (ABM) of Allegheny County, PA, that incorporates its health care system into a Susceptible–Infected–Recovered (SIR) disease model framework and simulates the interaction of hospital-based HCWs within the health care system and with workplaces, schools, households, and community activities. Using this model, we examined the potential impact of a severe influenza epidemic on HCWs and the potential effects of different control measures, including the positive effect of timely therapeutic protections combined with other measures.
Materials and methods
Allegheny County study area
Allegheny County lends itself well to an epidemic simulation study. It contains a large metropolitan area – Pittsburgh – with adjoining suburban and rural areas geographically well circumscribed (limited daily influx and efflux) than other large metropolitan areas such as New York City or Washington, DC (Figure 1). The county’s population is 97% urban,1 with workplace density centers both in Pittsburgh and outside the city (Figures 2 and 3). The county’s population is also the second oldest among US counties, with 17·8% of its inhabitants 65 years or older (April 2000 US Census), an age-group particularly susceptible to influenza and its complications.2,3 The total house-hold population for Allegheny County in 2000 was 1 241 049.
Figure 1.

Allegheny County’s location in Pennsylvania.
Figure 2.
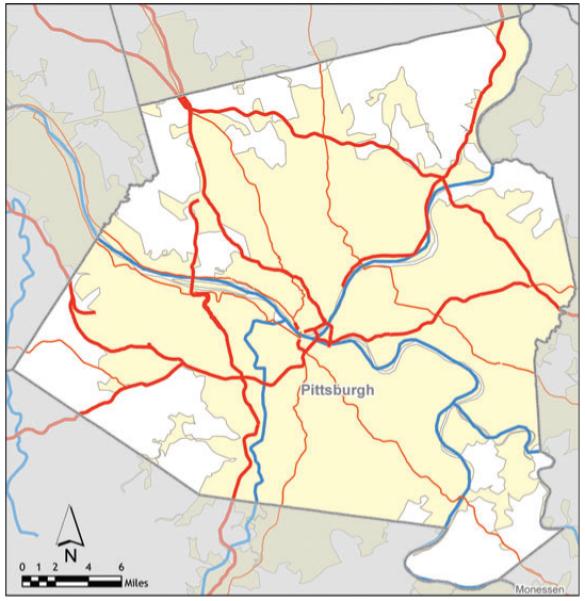
Pittsburgh in Allegheny County.
Figure 3.

Allegheny County population density.
The ArcGIS Business Analyst identified 48 595 businesses with total employment of 601 022.* We selected synthesized workplaces of similar size and location to the actual hospitals and tagged them as hospitals, so the model could track HCWs through the simulations. Figure 4 locates the schools and hospitals.4
Figure 4.
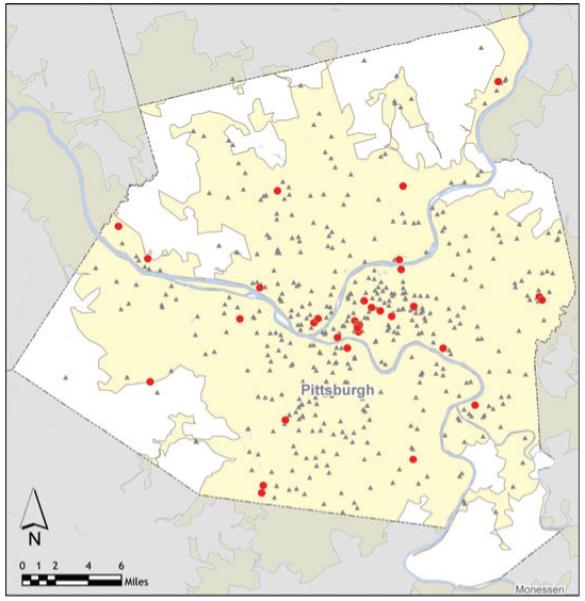
Allegheny County schools and hospitals.
Synthetic census-based data
We developed a synthetic agent database to represent Allegheny County’s human population. In an ABM, agents represent individual persons. Complex, large-scale social systems are simulated by assigning behaviors and activities to agents within the population, then allowing agents to interact with each other and the environment.
We adapted and extended a method originally developed by Beckman et al.5 that employs the US Census Bureau’s Public Use Microdata files and Census aggregated data to generate synthesized, geospatially explicit human agents who represent actual populations when aggregated.6 Each agent is assigned to a household with other agents. After first generating a US population of 105 480 101 households containing 273 624 650 people (2000 Census), we extracted the synthesized households and persons for Allegheny County.
Model description
Our SIR-based ABM model assumes that all people are initially in a susceptible disease state. On contact with infectious people, susceptible people (S) may move into the infectious state (I). After the infectious period, infectious people move to the recovered state (R), in which they remain immune to subsequent infections for the rest of the simulation.
Our ABM also can track features similar to those defined by Ferguson et al.7 and Germann et al.8 including age, sex, occupation, household location, household membership, school assignment of students and teachers, work location assignment of employed adults, work status as employed or unemployed, and disease status. Consistent with the results of the Models of Infectious Disease Agent Study (MIDAS) combined model study, only two-thirds of infected patients exhibit symptoms.9
Agents were assigned households using the US 2000 Census. Our model assigned 212 315 school-aged children to 484 school locations in a manner similar to Ferguson et al.7 Each of Allegheny County’s 524 869 adults was assigned to one of its 35 317 workplaces by using the Census 2000 Special Tabulation: Census Tract of Work by Census Tract of Residence (STP 64) database. Adults mix at each workplace.
A special segment of the 35 317 workplaces is the 35 HCFs imbedded in the ArcGIS Business Analyst that employ an estimated 43 300 persons, of which 19 508 are HCWs who see patients on a daily basis.10 The HCFs include outpatient clinics, emergency rooms, and inpatient facilities. HCWs that are part of the synthetic population are assigned to work at one of the 35 HCFs.
Model parameters and social network structure
Our ABM transmission probabilities (Table 1) were obtained from a study by Longini et al.,11 which is derived from data on the 1957–1958 Asian influenza pandemic. The contact probabilities in Table 1 depend on the age of both the infectious and susceptible persons and represent the likelihood of these two individuals having contact of sufficient duration and closeness for possible influenza transmission. The 1 242 755 individuals (2000 Allegheny County household population) are the model’s circulating agents. In communities, agents interact with other agents in close proximity. An agent interacts daily with other family members. Non-family members sharing a household interact with each other less than daily but at least four times a week. In schools and workplaces, each student or worker contacts a fixed mean number of persons per day.12 Each student or worker has a random probability of interacting with people in other classrooms or offices at his/her school or workplace. Workers in small firms (i.e. single offices) have repeated contacts with the same people daily. Finally, all agents, including students, interact in the community every day including weekends.13 Each HCF employee interacts daily and randomly with other HCF employees in the same clinic/hospital. A subgroup of these employees (HCWs) also interacts with patients, some of whom may have influenza.
Table 1.
Probability of an infected individual transmitting influenza to a susceptible individual during an interaction between the two
| Contact group | Infected individual | Susceptible individual | Transmission probability* |
|---|---|---|---|
| Household | Adult | Adult | 0·4 |
| Household | Child | Adult | 0·3 |
| Household | Adult | Child | 0·3 |
| Household | Child | Child | 0·6 |
| School | Elementary student | Elementary student | 0·0435 |
| School | Middle student | Middle student | 0·0375 |
| School | High student | High student | 0·0315 |
| Workplace | Adult | Adult | 0·0575 |
| Hospital | HCW | HCW | 0·0575 |
| Hospital | HCW | Patient | 0·01 |
| Hospital | Patient | HCW | 0·01 |
| Community | All | Child | 0·00255 |
| Community | All | Adult | 0·00480 |
Model calibration
Our model was calibrated using the Ferguson et al. approach from historical (1957–1958, 1968–1969) influenza pandemics. Our calibration targets followed the 30–70 rule developed by Ferguson et al. that 70% of all transmission occurred outside the household (of which 33% occurred in the general community and 37% in schools and workplaces) with transmission rates in schools double that in workplaces, which we interpreted as 24·5% and 12·5%, respectively.7 Calibration involved targeting an epidemic with a 34% attack rate (AR), consistent with the 1957–1958 pandemic,11 and estimating daily contact rates by assumptions (Table 2) to satisfy the 30–70 rule. These contact patterns reproduce an epidemic similar to the 1957–1958 epidemics with a basic reproductive rate (R0) of 1·4, where R0 is the expected number of secondary cases that a typical infected individual will produce in the susceptible population. Table 2 lists the estimated number of contacts per day per social network category. We generated 100 calibrated epidemics using 100 distinct random number sequences, each seeded with a single-infected adult. We also tested the sensitivity of this calibration scheme against an alternative calibration method also described by Ferguson et al.7 We also investigated an alternative calibration rule that assumed equal transmission rates in schools and workplaces, which produced a flatter infection curve but left the principal study conclusions unchanged.
Table 2.
Contacts per day for different individuals in the model
| Location | Individual | Mean number of contacts per day |
Social network |
|---|---|---|---|
| Classroom | Student | 18 | School |
| School outside of classroom | Student | 15 | School |
| Outside of school | Student | 18 | Community |
| Weekend activity | Student | 27 | Community |
| Workplace (within office) | Worker | 6 | Workplace |
| Workplace (outside office) | Worker | 3 | Workplace |
| Community | All | 36 | Community |
| Health care facility (with other co-workers within clinic, emergency room, or ward) |
HCW | 3 | Health care facility |
| Health care facility (with co-workers outside specific clinic, emergency room, or ward) |
HCW | 6 | Health care facility |
| Health care facility (with patients) | HCW that sees patients | 30 | Health care facility |
HCW, health care worker.
We assume a proportion (50%) of sick students and workers stay at home and do not interact with anyone outside of the household. Also, our workplace absentee rate is consistent with other models. However, we use a school absentee rate that is generally lower than other models (Ferguson et al. use a 90% absentee rate). Additionally, we made the following assumptions: 45% of the HCFs staff interact with patients; each HCW sees a daily mean of 30 patients; 40% of patients with influenza symptoms visit a HCF;14-19 50% of sick students and workers stay home with no community contacts unless they see a HCW; 20% of working adults work on weekends; and student/community and adult/community contacts increase by 50% on weekends.
Results
Table 3 summarizes the first 10 realizations (of 100) runs, each with an AR of 34%. We varied the seeding assumption from 1 to 100 random seeds, introduced on day 0 of the epidemic. If an epidemic was realized, the total AR was not sensitive to the seeding assumption that generated it.
Table 3.
Results of sample simulation runs
| Distribution of where infections occurred |
|||||||
|---|---|---|---|---|---|---|---|
| Simulation run number |
Overall serologic attack rate (%) |
Total number of health care workers infected |
Peak total population infections |
% of total infections in community |
% of total infections in households |
% of total infections in schools |
% of total infections in workplaces |
| 1 | 33·3 | 5196 | 16 425 | 33·2 | 29·9 | 24·4 | 12·5 |
| 2 | 34·0 | 5325 | 16 476 | 33·2 | 30·1 | 24·1 | 12·6 |
| 3 | 34·1 | 5323 | 17 079 | 33·2 | 29·9 | 24·3 | 12·6 |
| 4 | NA | NA | NA | NA | NA | NA | NA |
| 5 | 34·0 | 5304 | 16 625 | 33·4 | 30·1 | 24·1 | 12·5 |
| 6 | 34·2 | 5374 | 16 474 | 33·2 | 30·0 | 24·1 | 12·6 |
| 7 | 33·7 | 5210 | 16 400 | 33·3 | 29·9 | 24·4 | 12·4 |
| 8 | 33·9 | 5225 | 16 813 | 33·4 | 29·9 | 24·4 | 12·4 |
| 9 | NA | NA | NA | NA | NA | NA | NA |
| 10 | 34·2 | 5324 | 16 994 | 33·4 | 30·0 | 24·1 | 12·5 |
| *Ave | 33·9 | 5285 | 16 661 | 33·3 | 30·0 | 24·2 | 12·5 |
Ave = the average of the eight runs that resulted in an epidemic. Two of the 10 runs did not result in an epidemic and, based on a larger sample, an estimated 82% of runs would be realized. The runs covered a period of 124–140 days. Each run peaks on one of two Fridays (day 48 or 55) and estimated attack rate exhibits a small variance.
Figure 5 illustrates two epidemic curves: the first is an R0 =1·4 (AR = 34%) epidemic, and the second has increased pathogen transmissibility with an R0 = 2·0 (AR = 44%), similar to the pandemic of 1918.7,20 We focused on the R0 = 2·0 baseline epidemic, which is consistent with those presented in Halloran et al.9 Both epidemics illustrated in Figure 5 use the contact assumptions shown in Table 2. The continuous lines in Figure 5 represent trend lines based on a 4-day moving average, which smoothes out irregular patterns produced by the weekend effect (i.e. students and workers having different weekend contact patterns).
Figure 5.

Infection curves comparing baseline R0 = 1·4 and R0 = 2·0 epidemics.
The model simulates the operations of the HCF outpatient clinics, emergency room, and inpatient clinics of Allegheny County hospitals. Forty-five per cent of the employees of the 35 HCFs are HCWs who see patients on a daily basis.10 We were able to identify explicit HCF locations and employee levels. Therefore, it was feasible to link our synthetic workplaces to real HCFs and then assign doctors in the synthetic data to those facilities. The total number of HCWs is 19 508 persons. For comparison purposes, we selected a sample of non HCW adults and then ran the baseline (no intervention) R0 = 2·0 model and recorded the impact on various sectors of the population, including HCWs and their families. Tables 4-6 summarize the results. Table 4 and Figure 6 illustrate the main population categories tracked by our model including students, adults, and the total population. The AR for all Allegheny residents is 43·4%, which is consistent with the other MIDAS models for an R0 = 2·0 epidemic. Age-specific infection rates varied from school-aged persons (76·1%), HCWs (54·3%) to non-HCW adults (34·1%). A matched sample of adults to compare with HCWs recorded an AR of 32·8%. The high AR for children is supported by a number of arguments, see for example, http://www.fluwikie.com/pmwiki.php?n=Consequences.Schools.
Table 4.
Population comparisons
| Measure | Adults | Health care workers |
Students | Total |
|---|---|---|---|---|
| Population | 927 765 | 19 508 | 230 440 | 1 242 755 |
| Number infected throughout epidemic |
316 203 | 10 592 | 175 424 | 539 834 |
| Overall serologic attack rate |
34·1 | 54·3 | 76·1 | 43·4 |
Table 6.
Baseline epidemic morbidity effects
| Measure | Effects |
|---|---|
| Total morbidity | 362 564 |
| Peak infection period | Day 38–48, 1 days >20 000 infections per day |
| Peak infection day | 27 061 infections per day |
| School/work absenteeism | 174 680 persons |
| School/work absenteeism | 1 048 080 days |
| Unable to see patient | 21 106 |
Caveats: 50% of symptomatic persons stay home (adults and children) and then only infect others within the home. The asymptomatic rate for adults and children is assumed to be 33%. HCWs see on average 30 patients per day, and the average length of stay at home is 6 days.
Figure 6.

Infection curves for students, adults, and total Allegheny residents.
Figure 6 displays the infection curve for adults, students, and total populations and indicates that the epidemic curve in school-aged children is larger than the adult epidemic for the first 40 days. We tracked the disease status of family members in HCW households. The HCW population of 19 508 has an additional 36 938 persons that live in HCW-occupied households. The HCW household member risk (57·8%) is slightly above HCW risk due to the higher AR of children. We show these results in the third column (50 patients/day) of Table 5. The high AR and the earlier wave of infections in children suggest that that they are a principal source of influenza transmission to the HCW household members and we estimate that 73·5% of HCW household members were infected by persons outside of the household and 7·1% were infected by students. Thus, <20% of HCW family members were infected by the HCW or the spouse of the HCW, which seems to confirm this conjecture.
Table 5.
Serologic attack rate among health care workers (HCWs) and HCW family members when varying number of patients seen by HCW
| Measure/Patients per day |
Number of patients seen by a clinical HCW each workday |
|||
|---|---|---|---|---|
| 10 | 30 | 50 | 70 | |
| HCWs | ||||
| Total population | 19 508 | 19 508 | 19 508 | 19 508 |
| Total infected | 10 448 | 10 786 | 11 000 | 11 180 |
| Serologic AR (%) | 53·6 | 55·2 | 56·4 | 57·3 |
| HCW family members | ||||
| Total population | 36 938 | 36 938 | 36 938 | 36 938 |
| Total infected | 21 024 | 21 362 | 21 983 | 22 276 |
| Serologic AR (%) | 56·9 | 57·8 | 59·4 | 60·3 |
| Total population, AR | 43·0 | 43·5 | 44·3 | 45·4 |
AR, attack rate.
Table 5 also presents a sensitivity analysis of the HCW contact rate. We varied the rate from 10 to 70 contacts per day. The response measures presented in Table 5 indicate that the AR of the major subpopulation categories vary little in response to significant changes in the HCW contact rate. A change of sevenfold in this rate (10-70) varies the baseline AR from 43·0% to 45·4% or about 5·3%.
Table 6 illustrates the epidemic’s effect on morbidity. A summary of the impacts indicates that a peak infection period (with over 20 000 infections per day) persists for 11 days. Total influenza-related absenteeism exceeded 174 000 persons and 1 million days were lost to clinical illness. Finally, more than 13 000 patient visits to HCWs would not occur, requiring substitute HCW personnel.
To compare non-HCW adults with HCWs, we randomly selected a sample of adults equal in number and age to the HCW population and compared their infection curves (Figure 7). The two curves show the infections per day for HCF-based HCWs and the same number of randomly selected adults, respectively. The HCWs had a higher AR (55·2%) than the randomly selected adult population (32·8%), which indicates that HCWs are at greater risk for illness than the general adult population. In addition, Table 7 provides evidence of increased HCW risk of infection versus the general adult population. The table compares the ARs of HCWs versus non-HCW adults by age, and shows that HCWs have higher ARs than the adult population across all adult age groups.
Figure 7.

Infection curves for health care workers and a matched sample of adults.
Table 7.
Age specific attack rates in adults versus health care workers (HCWs)
| Adult population |
HCWs |
|||||
|---|---|---|---|---|---|---|
| Age range (years old) |
Population | Number infected |
Serologic attack rate (%) |
Population | Number infected |
Serologic attack rate |
| 16 < 25 | 126 860 | 70 236 | 55·4 | 3216 | 2115 | 65·8 |
| 25 < 45 | 350 988 | 129 084 | 36·8 | 8965 | 4752 | 53·0 |
| 45 < 65 | 293 325 | 96 252 | 32·8 | 5942 | 3079 | 51·8 |
| 65 < 75 | 110 618 | 30 930 | 28·0 | 1384 | 704 | 50·9 |
| 75+ | 105 615 | 24 224 | 22·9 | 0 | 0 | 0 |
Finally, our HCW vaccine protection results are displayed in Tables 8 and 9. The model’s protection mechanism is based on the product of coverage and efficacy. We also include a delay mechanism such that when an AR threshold is realized, the baseline level of protection advances to a higher level of protection fostered by, for example, epidemic awareness. Using this framework, we can identify protection from a variety of devices including vaccines, respirators, and face masks.
Table 8.
The sensitivity of attack rate (AR) in response to increasing delays in the distribution of vaccine to health care workers
| Delay in vaccination from the start of epidemic (days) |
End of delay trigger threshold serologic AR (%) |
Total population serologic AR (%) |
|---|---|---|
| 0 | 0·0 | 40·4 |
| 25 | 1·0 | 40·7 |
| 37 | 10·0 | 41·0 |
| 43 | 20·0 | 41·9 |
| >50 | >50·0 | 43·7 |
Table 9.
Total attack rate for five vaccine coverage assumptions
| Vaccine coverage among health care workers (%) |
Total population attack rate (%) Main calibration rule |
Risk reduction (%) |
|---|---|---|
| 0 | 43·6 | 0·0 |
| 25 | 42·8 | 1·8 |
| 50 | 42·1 | 3·4 |
| 75 | 41·0 | 6·0 |
| 100 | 40·4 | 7·4 |
Table 8 presents the total AR with five different vaccination delay assumptions. A vaccine efficacy assumption based on the Basta et al.’s study21 is fixed at 78% for each assumption and the length of delay is triggered by an AR threshold. Each run assumes that the vaccine is distributed to all HCWs according to an increasing AR threshold. The thresholds correspond to delays of 50, 43, 37, 25, and 0 days after the start of the epidemic. The change in AR is small but steady for each delay assumption.
Table 9 demonstrates the relationship between HCW vaccination coverage and AR. Five different coverage assumptions are simulated. As in Table 8, the total AR runs were generated based on a vaccine efficacy estimate of 78% from the Basta et al. study.21 The coverage assumptions are 0%, 25%, 50%, 75%, and 100% coverage. We show in Table 9 the overall AR realized under the efficacy–coverage assumption and the reduction in risk caused by this level of risk versus no protection. In addition, we made runs that simulated the use of face masks by HCWs. We used an efficacy value of 30% and a coverage level of 50% derived from the MacIntyre et al.’s study.22 We interpreted these values as an upper bound of protection and the overall AR of 42·7% represents a comparable risk reduction estimate equal to vaccine protection at the 25% coverage level (Table 9).
Discussion
Our study can help policy makers make key decisions by illustrating how vaccinating HCWs in a timely fashion, by making vaccines available and persuading HCWs to comply, can reduce HCW illness and positively affect both the health care system and the community. Maintaining an adequate healthy HCW force is vital to any epidemic preparedness plan. When making such plans, the key decision makers must understand how a severe epidemic may affect the available health care workforce. Although decision makers undoubtedly realize that HCWs will be at risk for infection, our study can help them forecast an epidemic’s effects on HCWs and absenteeism by providing perspective, benchmarks, and starting points on which to base their planning.
In addition, our results demonstrate that vaccinating HCWs in a timely fashion, which includes making the vaccine available and getting HCWs to comply, can have a positive effect on HCWs and, in turn, health care system operations and the community. Further, although the number of patients a HCW contacts each day affects the overall AR among HCWs and affects their availability to treat patients, in an epidemic, the increased patient volume from influenza cases, disease exacerbations, and psychological stress (i.e. ‘worried well’) and the decreased availability of HCWs may force each HCW to see more patients than usual. Decision makers can use our information to consider how to manage the number of patients each HCW sees.
By incorporating additional elements and analyses of the health care system, our model extends the MIDAS’ initiative work. Ferguson et al. developed large-scale mathematical models to explore the complex landscape of intervention strategies using Southeast Asia (attempting to contain the epidemic at its source),20 Great Britain, and the USA as examples.9 Longini et al.11 also examined the possibility of containing a flu epidemic at its source in a rural region of Thailand. Germann et al.8 used a stochastic simulation model to investigate the spread of a pandemic influenza virus strain throughout the entire US population for an R0 of 1·6–2·4 and the impact of different combinations of antiviral agents, vaccines, and social-distancing measures on the pandemic’s timing and magnitude. Eubank et al.23 developed a discrete event simulation approach to model influenza propagation through Chicago, IL, using random sample individual-specific activity structures, which provided the time, locations, and types of activities and derived contact patterns for all individuals in the city. This model assumed a fixed probability of transmission across all social network classes, with transmission occurring as a function of contact duration and proximity of contact. Six scenarios were simulated, each with differing percentages of cases diagnosed/treated and compliance with social-distancing directives.
There are also unique and important models outside of MIDAS. For example, a study by Glass et al.24 addressed the role of social distancing on the spread on influenza in the USA and highlighted the powerful influence of school-aged children, with school closure and keeping teenagers at home reducing ARs by 90%. This model is agent-based, with many characteristics similar to the MIDAS models (e.g. emphasizing social networks characteristics and their role in disease spread). One important difference is that the Glass et al.’s model focused on a synthetic community substantially smaller than those studied by the MIDAS models. However, the results of this model and the MIDAS model are relatively consistent. Another example is a stochastic simulation model by Habler et al.25 derived from a model described in Longini et al.26 The simulated region is a small urban US community infected by a H2N2 virus with 1957–1958 pandemic properties. A notable feature of this model is that the number and duration of contacts is different on weekdays and weekend days. This is different than all of the other models described earlier.
Gardam et al.27 explicitly represented the health care sector within the simulation framework. However, their model has important differences from our Allegheny County model, Their objective was to simulate the impact of protecting HCWs on the spread of the epidemic. Their study region was the Province of Ontario in Canada (population >13 million). The model they described is an equation-based model and the compartment representing subjects seeking treatment from HCWs is the only source of infections for the HCW population. In contrast, the HCWs in the Allegheny County model can be infected by their spouses, children, coworkers, random community members they interact with, as well as patients seeking treatment. The Gardam et al.’s study employs an epidemic with an estimated R0 between 1·25 and 1·41, which is comparable with the 1957–58 pandemic. Our Allegheny County model results are based on an epidemic with an R0 equal to 2·0 and comparable with the 1918 pandemic.
Limitations
All computer models are simplifications of reality and provide decision makers with information on possible scenarios and relationships, not policy decisions. Although our current assumptions came from reference sources or previously published models, it is possible they may not hold in the event of a severe influenza epidemic. Our model only included HCFs that were identified in the ArcGIS Business Analyst database and therefore did not include every outpatient clinics in the county.
In addition, our model did not factor in potential psychological effects on HCWs that may lead to further voluntary absenteeism.
Conclusions
Our Allegheny County model portrayed an epidemic with a secondary AR that reproduced the Spanish influenza epidemic of 1918,7 and showed that vaccinating HCWs in a timely manner, which includes getting the vaccine to HCWs and having them comply with vaccination, can modestly help reduce the overall AR. In a pandemic of this severity, the AR for HCWs was nearly 60% higher (54·3%) than that of all adults (34·1%). This HCW AR leads to high work absenteeism. Our model may help decision makers limit the number of patients each HCW sees. Future studies will investigate additional ways to protect HCWs.
Acknowledgements
This study was supported by the following grants from the Models of Infectious Disease Agent Study (MIDAS): RTI–U01-GM070698; and University of Pittsburgh – U01-GM070708. The authors thank Craig R. Hollingsworth for technical writing and editing assistance.
Biographical sketch
Philip C. Cooley is an RTI Fellow in bioinformatics and high-performance computing and principal scientist and Assistant Director of Bioinformatics. He has more than 40 years of experience developing computer models to study environmental health and disease transmission scenarios. He has been extensively involved in designing and implementing influenza transmission models to study and manage pandemic flu, and is currently the Co-PI of the MIDAS Informatics Group. His current research includes an assessment of statistical methods for biomarker explorations as part of genome-wide analysis studies, and has developed a database of loci with known genetic properties.
Footnotes
ArcGIS Business Analyst’ is a commercial geospatial data product containing the locations and sizes of over 14 000 000 businesses in the USA.
Disclaimers
The opinions expressed by authors contributing to this journal do not necessarily reflect the opinions of the Centers for Disease Control and Prevention or the institutions with which the authors are affiliated.
References
- 1.US Census Bureau [Accessed 18 February 2009];American fact finder. Available at http://factfinder.census.gov/home/saff/main.html?_lang=en.
- 2.Rotstein G. [Accessed 24 May 2001];Allegheny still second oldest big county in United States. Philadelphia Post-Gazette. Available at http://www.post-gazette.com/headlines/20010524census4.asp.
- 3.US Department of Health and Human Services [Accessed 16 February 2009];Pandemics and pandemic threats since 1900. Available at pandemicflu.gov/general/historicaloverview.html.
- 4.Pennsylvania Department of Health [Accessed 14 February 2009];Directory of Pennsylvania Hospitals and Ambulatory Surgery Centers: data from the Bureau of Health Statistics and Research’s Hospital Questionnaire and Ambulatory Surgery Center Questionnaire for the July 1, 2006–June 30, 2007. Available at http://www.dsf.health.state.pa.us/health/lib/health/facilities/directories/20062007HOSPITALASCDIRECTORY.pdf.
- 5.Beckman RJ, Baggerly K, McKay MD. Creating synthetic baseline populations. Transp Res A Policy Prac. 1996;30(6):415–429. [Google Scholar]
- 6.Wheaton WD, Cajka JC, Chasteen BM, et al. [Accessed 29 December 2009];Synthesized population databases: a US geospatial database for agent-based models. doi: 10.3768/rtipress.2009.mr.0010.0905. Research Triangle Park, NC. Available at http://dx.doi.org/10.3768/rtipress.2009.mr.0010.0905. doi: 10.3768/rtipress.2009.mr.0010.0905. [DOI] [PMC free article] [PubMed]
- 7.Ferguson N, Cummings DAT, Fraser C, Cajka JC, Cooley PC, Burke DS. Strategies for mitigating an influenza pandemic. Nature. 2006;442:448–452. doi: 10.1038/nature04795. [DOI] [PMC free article] [PubMed] [Google Scholar]
- 8.Germann TC, Kadau K, Longini IM, Jr, Macken CA. Mitigation strategies for pandemic influenza in the United States. 2006 Apr 11;103(15):5935–40. doi: 10.1073/pnas.0601266103. Epub 2006 Apr 3. [DOI] [PMC free article] [PubMed] [Google Scholar]
- 9.Halloran EM, Ferguson NM, Eubank S, et al. Modeling targeted layered containment of an influenza pandemic in the United States. Proc Natl Acad Sci U S A. 2008;105(12):4639–4644. doi: 10.1073/pnas.0706849105. [DOI] [PMC free article] [PubMed] [Google Scholar]
- 10. [Accessed 3 February 2009]; About.com Health Service; Ucompare Hospitals. Hospital Quick Check Report for Allegheny County; Facility Information – Staff. About.com Available at http://www.ucomparehealthcare.com/hospital/report2.html?L=962207715494939153911&R=xlkHEHbkaJ3CDBg40zJ9W3yqe&I=9622077&page=2&sub=3.
- 11.Longini I, Jr, Nizam A, Xu S, et al. Containing pandemic influenza at the source. Science. 2005;309:1083–1087. doi: 10.1126/science.1115717. [DOI] [PubMed] [Google Scholar]
- 12.Kashti O. [Accessed 3 February 2009];Gov’t approves plan to reduce number of students per classroom. Haaretz.com Sun., 27 January 2008 Shvat 20, 5768. Available at http://www.haaretz.com/hasen/spages/948522.html.
- 13.Cauchemez S, Valleron AJ, Boëlle PY, Antoine Flahault A, Ferguson NM. Estimating the impact of school closure on influenza transmission from Sentinel data. Nature. 2008;452:750–754. doi: 10.1038/nature06732. [DOI] [PubMed] [Google Scholar]
- 14.Rothberg MB, Rose DN. Vaccination versus treatment of influenza in working adults: a cost-effectiveness analysis. Am J Med. 2005;118(1):68–77. doi: 10.1016/j.amjmed.2004.03.044. [DOI] [PubMed] [Google Scholar]
- 15.Weeks WB, Wallace AE. Time and money: a retrospective evaluation of the inputs, outputs, efficiency, and incomes of physicians. Arch Intern Med. 2003;163:944–948. doi: 10.1001/archinte.163.8.944. [DOI] [PubMed] [Google Scholar]
- 16.Nichol KL, Hauge M. Influenza vaccination of health care workers. Infect Control Hosp Epidemiol. 1997;18:189–194. doi: 10.1086/647585. [DOI] [PubMed] [Google Scholar]
- 17.Nichol KL, Lind A, Margolis KL, et al. The effectiveness of vaccination against influenza in healthy, working adults. N Engl J Med. 1995;333:889–893. doi: 10.1056/NEJM199510053331401. [DOI] [PubMed] [Google Scholar]
- 18.Nichol KL, Lind A, Margolis KL, et al. [Accessed 21 December 2009];The effectiveness of vaccination against influenza in healthy, working adults. JAMA. 2000 284(13):1655–1663. doi: 101001/jama284131655. Available at http://jama.ama-assn.org/cgi/content/full/284/13/1655. [Google Scholar]
- 19.Bridges CB, William W, Thompson WW, et al. [Accessed 29 December 2009];Effectiveness and cost-benefit of influenza vaccination of healthy working adults: a randomized controlled trial. JAMA. 2000 284(13):1655–1663. doi: 10.1001/jama.284.13.1655. doi: 101001/jama284131655. Available at http://jama.ama-assn.org/cgi/content/full/284/13/1655. [DOI] [PubMed] [Google Scholar]
- 20.Ferguson N, Cummings DAT, Cauchemez S, et al. Strategies for containing an emerging influenza pandemic in Southeast Asia. Nature. 2005;437:209–214. doi: 10.1038/nature04017. [DOI] [PubMed] [Google Scholar]
- 21.Basta NE, Halloran ME, Matrajt L, Longini IM., Jr. Estimating influenza vaccine efficacy from challenge and community-based study data. Am J Epidemiol. 2008;168(12):1343–1352. doi: 10.1093/aje/kwn259. [DOI] [PMC free article] [PubMed] [Google Scholar]
- 22.MacIntyre CR, Cauchemez S, Dwyer DE, et al. Face mask use and control of respiratory virus transmission in households. Emerg Infect Dis. 2009;15(2):233–241. doi: 10.3201/eid1502.081167. [DOI] [PMC free article] [PubMed] [Google Scholar]
- 23.Eubank S, Guclu H, Anil Kumar VS, et al. Modelling disease out-breaks in realistic urban social networks. Nature. 2004;429:180–184. doi: 10.1038/nature02541. [DOI] [PubMed] [Google Scholar]
- 24.Glass RJ, Glass LM, Beyeler WE, Min HJ. Targeted social distancing design for pandemic influenza. Emerg Infect Dis. 2006;12(11):1671–1681. doi: 10.3201/eid1211.060255. [DOI] [PMC free article] [PubMed] [Google Scholar]
- 25.Habler MJ, Shay DK, Davis XM, et al. Effectiveness of interventions to reduce contact rates during a simulated infectious pandemic. Emerg Infect Dis. 2007;13(4):581–589. doi: 10.3201/eid1304.060828. [DOI] [PMC free article] [PubMed] [Google Scholar]
- 26.Longini IM, Halloran ME, Nizam A, Yang Y. Containing pandemic influenza with antiviral agents. Am J Epidemiol. 2004;159:623–633. doi: 10.1093/aje/kwh092. [DOI] [PubMed] [Google Scholar]
- 27.Gardam M, Liang D, Moghadas SM, Wu J, Zeng Q, Zhu H. The impact of prophylaxis of healthcare workers on influenza pandemic burden. J R Soc Interface. 2007;4:727–734. doi: 10.1098/rsif.2006.0204. [DOI] [PMC free article] [PubMed] [Google Scholar]