

Abstract
Muscle atrophy remains a significant concern in multiple inflammatory conditions, including injury, sepsis, cachexia and HIV associated wasting. Herein, we show that inflammatory stressors, including TNF–α, IFN–γ or LPS, potently induced the novel expression of the RNA editor ADAR1, an observation not previously described in muscle cells. We also observed that cytokine stimulation suppressed muscle associated microRNAs, an observation also not previously demonstrated. To map potential effects of ADAR1 induction in the muscle program, we conducted knockdown and over-expression studies in the mouse C2C12 muscle precursor cell (MPC) line and in primary human MPCs. We show that knockdown of stress-induced ADAR1 increased inflammation-mediated declines in the muscle differentiation markers myogenin and myosin heavy chain, and knockdown reduced levels of active phosphorylated Akt (phospho-Akt), but had no effect on microRNA transcript levels, suggesting a role for ADAR1 in buffering inflammatory stress effects on myogenic transcription and protein synthesis pathways. Additionally, over-expression of recombinant ADAR1 suppressed active phosphorylated dsRNA-dependent protein kinase (phospho-PKR), consistent with a role for ADAR1 in limiting inflammation driven catabolic atrophy pathways. Collectively, these data identify a novel regulatory role for ADAR1 activation under inflammatory stress to both promote muscle protein synthesis pathways and limit atrophy pathways.
Introduction
Skeletal muscle maintenance requires a dynamic balance of anabolic and catabolic processes that regulate cell architecture and protein turnover (Dreyer and Volpi, 2005; Timmerman and Volpi, 2008). This balance can be skewed towards muscle protein loss by inflammation (Arnold et al., 2007; Tidball, 2005). The severity of decline in muscle mass and function can range from a gradual loss, as observed in age-associated sarcopenia, to a steeper decline in muscle mass observed in muscle wasting conditions such as HIV infection and cancer cachexia. Muscle atrophy is broadly associated with an elevated inflammatory cytokine burden, notably TNF–α (originally termed “cachectin” for its association with cancer cachexia (Beutler et al., 1985)) and IFN–γ (Smith et al., 2007).
The muscle cellular program is initiated through activation and differentiation of quiescent muscle progenitor cells (MPCs) resident in muscle tissue in a process that is characterized by a transition from single nucleated myoblasts to multinucleated cells termed myotubes in vitro and myofibers in vivo. Molecular features of this transition include temporally regulated expression of transcriptional regulators (e.g., MyoD, Myogenin), microRNA regulators that influence RNA translation into protein (e.g., miR-1, miR-206 and miR-133) and muscle structural proteins, e.g., myosin heavy chain (MHC). These regulatory processes form a network; for example, MyoD is a transcriptional regulator of muscle microRNA expression (Rao et al., 2006). In turn, the regulated expression of microRNAs miR-1, miR-206 and miR-133 influence the balance between MPC proliferation and renewal versus differentiation and fusion through modulation of the relative levels of SRF and HDAC4 translation (Chen et al., 2006).
Inflammatory stress is broadly recognized to activate innate immune response pathways, such as the toll like receptor (TLR) family which function in a variety of cellular and physiologic contexts (Pasare and Medzhitov, 2004), including muscle tissue homeostasis (Frost et al., 2006). A notable inflammatory stress mediator is the IFN-γ inducible dsRNA-dependent protein kinase (PKR), a critical negative regulator that when activated through phosphorylation blocks protein synthesis through phosphorylation of EIF-2α (Samuel, 2001), thereby promoting muscle atrophy (Eley et al., 2007; Eley and Tisdale, 2007; Tisdale, 2009). Recent studies dissecting the signaling pathways activated during muscle inflammatory stress also indicate that IFN–γ can potentiate TNF–α mediated atrophy by promoting increased mRNA instability in MyoD and Myogenin (Guttridge et al., 2000). Inflammation mediated declines in these transcription factors are also associated with activated iNOS/NO signaling (Di Marco et al., 2005) and protein breakdown mediated through the muscle specific E3 ligases atrogin-1/Mafbx and MuRF1 (Smith et al., 2007). The atrogenes MafBx and MuRF1 are differentially induced by cytokines such as TNFα through p38 MAPK and NFκB pathways (Glass, 2005) as well as through IFN–γ signaling (Smith et al., 2007). Thus, inflammatory signaling induces multiple molecular pathways that converge to potentiate the atrophy phenotype.
Additional studies conducted primarily in leukocytes indicate that inflammatory stressors such as TNF–α, IFN–γ lipopolysaccharide (LPS), viral dsRNA and its mimetic compound poly(I:C), all activate the RNA editor ADAR-1 (Adenosine deaminase acting on RNA -1) (Patterson et al., 1995; Yang et al., 2003). Two isoforms of the ADAR1 protein have been described, with a constitutively expressed isoform, ADAR1(p110), and an interferon-inducible isoform, ADAR1(p150) (George and Samuel, 1999a, b; Patterson and Samuel, 1995; Patterson et al., 1995). Though initially identified in association with an antiviral stress response, ADAR1 is now recognized to have a larger role in modulating both host mRNA and microRNA transcript sequence through an RNA editing function (Yang et al., 2006), as well as a role in suppressing PKR mediated blockade of protein synthesis in 293T cells, an embryonic kidney cell line (Nie et al., 2007). Herein, we describe the novel expression and potential role for ADAR1 in muscle cell differentiation during inflammatory stress, which has not been previously addressed.
Results
Previous studies evaluating the tissue distribution of ADAR1 identified expression within brain and leukocyte cells, but not in muscle. However, those studies were based on analysis of unstimulated levels within skeletal muscle (Melcher et al., 1996). To evaluate the potential for stress-induced expression of ADAR1 in skeletal muscle, we stimulated C2C12 MPCs with an array of inflammatory stressors including TNF–α, IFN–γ or LPS under both growth promoting media conditions (GM, 10% serum) and differentiation promoting media conditions (DM, 2% serum). Total RNA was harvested from parallel cultures daily, for 1-3 days. As shown in figure 1, ADAR1 expression was potently induced from low baseline levels by LPS, TNF–α and IFN–γ, suggesting that innate inflammatory stress potently induce ADAR1 expression in MPCs. Notably, inflammatory stimulation of ADAR1 expression was far more efficient in differentiation media conditions than in growth media, despite the presence of similar inflammatory ligands (Figure 1e). TNF–α and IFN–γ also efficiently suppressed myosin heavy chain 3 (MHC) expression, as previously reported in a study of cytokine mediated muscle atrophy (Guttridge et al., 2000) (Figure 1a). These data suggest that stress induced expression of ADAR1 likely occurs in muscle concomitant with stress induced signaling that promotes atrophy and declines in MHC (Eley et al., 2007; Eley and Tisdale, 2007).
Figure 1. Pro-inflammatory stimuli induce ADAR1 gene expression in differentiating muscle cells.

C2C12 MPCs were induced to differentiate by switching to low serum differentiation media (DM, see A-D) or left in growth media (GM, see E) for 3 days and monitored for myosin heavy chain 3 expression as a control (A) or ADAR1 expression (B-E) in the presence of LPS (1ug/mL) (B), TNF-α (10ng/mL) (C), IFN–γ (10ng/mL) (D) or TNF–α/IFN–γ (each at 5ng/mL, E). Note MHC was suppressed by TNF–α and IFN–γ, as previously shown (Guttridge et al., 2000). ADAR1 expression was clearly observed in the context of inflammatory signals during differentiation (B-D) and minimally observed in growth media (E). A Wilcoxon signed-rank test for each condition was performed for the series A-E and resulting p-values are shown in upper right. Standard deviations for each time point are also shown.
Previous studies of inflammatory effects on muscle cells have demonstrated that TNF–α and IFN–γ can reduce the mRNA stability of myogenic regulatory factors, such as MyoD (Di Marco et al., 2005; Guttridge et al., 2000). To our knowledge, however, the effect of inflammatory ligands on muscle associated microRNAs in MPCs has not yet been reported. Therefore, to evaluate the quantitative influence of TNF–α and IFN–γ on the expression of microRNAs miR-1, miR-206 and miR-133, we cultured C2C12 cells in DM media to stimulate miR expression, in the presence of IFN–γ, TNF-α, or media alone as a reference control. Cells were harvested for total RNA on days 1-4, post stimulation. As shown in Figure 2A, in contrast to untreated cells that displayed increases in miR-1, miR-206 and miR-133 in the differentiation time course as previously reported (Chen et al., 2006), IFN–γ and TNF–α stimulated cells displayed marked declines in miR expression. Notably, declines in microRNA were specific to miR-1, miR-206 and miR-133, because miR-24, another muscle associated microRNA, increased with differentiation and was relatively insensitive to IFN-γ and TNF–α treatment (Figure 2A). To our knowledge, a decline in muscle specific microRNAs upon cytokine exposure during differentiation has not been previously reported. However, our observed miR suppression is consistent with cytokine mediated attenuation of MyoD (Acharyya et al., 2004; Guttridge et al., 2000), an upstream regulator of these microRNAs (Rao et al., 2006). The observed declines in microRNA expression were correlated with reduced muscle protein synthesis, based on quantitation of MHC immunostaining at day 4, post stimulation (Figure 2B). From these data, we conclude that inflammatory stress induces declines in both muscle associated miRNAs and muscle protein levels (e.g., MHC).
Figure 2. Pro-inflammatory stimuli suppress muscle associated microRNA expression.
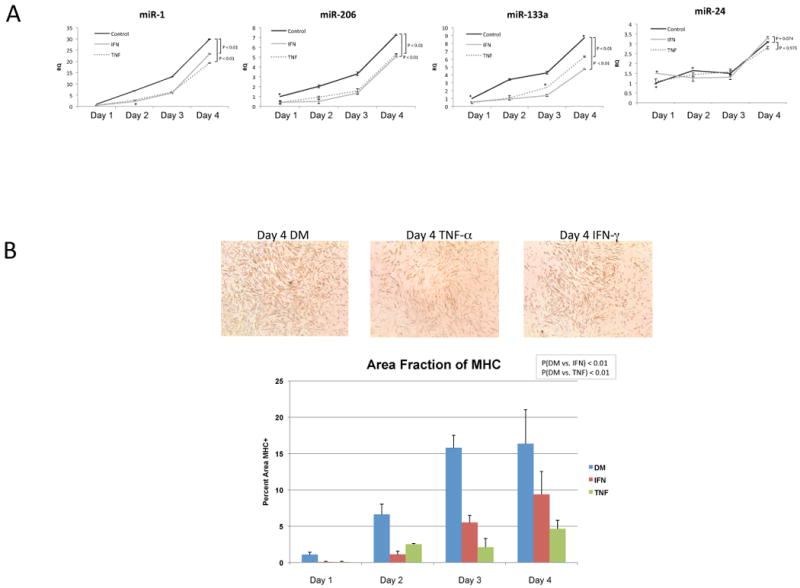
A: C2C12 MPCs were cultured for 1-4 days in differentiation media in the presence of TNF-α (10ng/ml) or IFN-γ (10ng/ml) added once at the start of culture. Total RNA was harvested and real-time PCR performed on the indicated microRNAs and normalized to snoRNA controls. A Wilcoxon signed-rank test was performed and resulting P-values are shown. Standard deviations for each time point are also shown. B: C2C12 MPCs were cultured for 1-4 days in differentiation media in the presence of TNF-α (10ng/ml) or IFN-γ (10ng/ml) added once at the start of culture. At 24-hour intervals after initial stimulation, cells were fixed with 3.7% formaldehyde and subsequently immunostained for Myosin Heavy Chain. Images of duplicate wells were taken and analyzed using ImageJ. Total Myosin Heavy Chain area was determined and compared to total area of the image. Standard deviations and t-test results for four replicate measurements with each condition are shown.
We were next interested in evaluating the potential influence of stress-induced ADAR1 on microRNA and myogenic markers (i.e., Myogenin, MHC) during differentiation. To measure this, MPCs were differentiated in the presence of inflammatory stimuli for 24 hours to induce ADAR1 expression, then transfected with ADAR1 siRNA or a control to knockdown ADAR1 expression, then cultured for an additional 48 hours before harvesting total RNA. To determine whether knockdown of ADAR1 influenced myogenic marker expression during differentiation, we measured levels of Myogenin and myosin heavy chain (MHC), as well as ADAR1 expression to estimate the efficiency of knockdown. As shown in Figure 3, siRNA to ADAR1 reduced expression of ADAR1 to 54% of IFN-γ and 34% TNF–α induced control levels, indicating efficient knockdown. In association with declines in ADAR1 due to knockdown, there was also a significant decline in Myogenin and MHC transcript levels, i.e., p = 0.015 for IFN-γ and p≅31 for TNF–α. To determine if knockdown of ADAR1 expression increased the inflammation driven declines in microRNA levels, we measured miR-1, miR-206 and miR-133 in a replicate set of transfectants. By contrast to Myogenin and MHC, the microRNAs miR-1, miR-206 and miR-133 were insensitive to knockdown of ADAR1 in the same cells, suggesting that ADAR1 does not appear to influence the microRNA component of the muscle program under stress conditions, (data not shown). These data collectively indicate that ADAR1 limits inflammation-mediated declines, in part through protecting myogenic markers downstream of the microRNA machinery, and support a role for ADAR1 as an inflammatory buffer.
Figure 3. ADAR1 expression limits cytokine mediated declines in myogenesis.
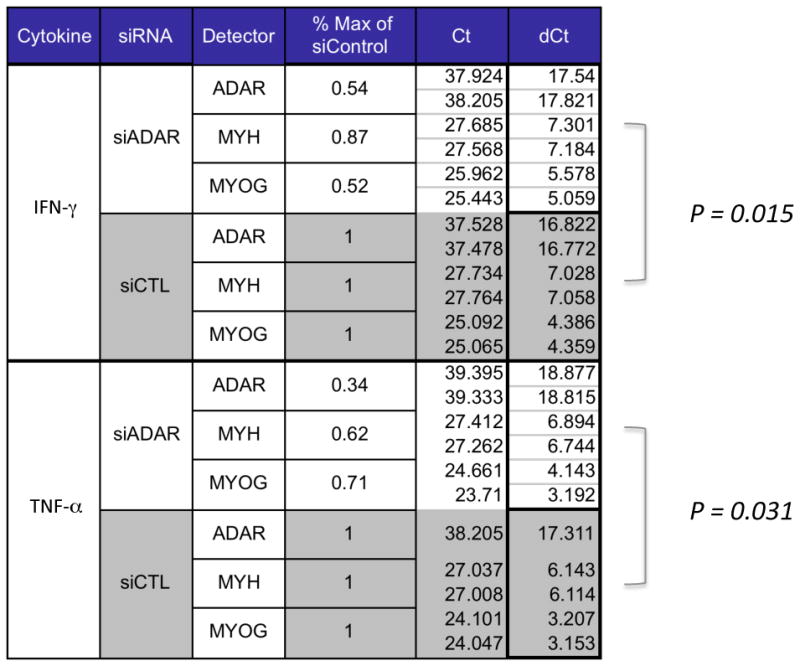
C2C12s were induced to differentiate in the presence of IFN-γ or TNF-α for 24 hours then transfected with siRNA to ADAR1 or control (Accell siRNA) and cultured for an additional 48 hours before total RNA was harvested. To determine whether knockdown of ADAR1 influenced myogenic marker expression, we measured RNA levels of the myogenic markers Myogenin and myosin heavy chain (MHC), as well as ADAR. As shown, siRNA to ADAR1 reduced expression of ADAR1 to 54% or 34%of induced levels, IFN-γ and TNF-α respectively. In these same cells, there was a representative decline in Myogenin levels (52% of control in IFN-γ stimulated, 71% of control in TNF-α stimulated, p= 0.015) and in MHC (87% of control in IFN-γ stimulated cells, 62% of control in TNF-α stimulated, p=0.031). A Wilcoxon signed-rank test was performed for trend differences between siADAR1 versus siCTL in both IFN-γ and TNF-α treatments, with p-values as shown.
Inflammatory stress, including IFN–γ (Hovanessian, 2007; Samuel, 1979) and TNF–α (Jeffrey et al., 2002), induce the dsRNA protein kinase PKR, a critical regulator of protein synthesis and a mediator of inflammation mediated muscle atrophy (Eley et al., 2007; Eley and Tisdale, 2007; Tisdale, 2009). As recently described (Nie et al., 2007), human ADAR(p150) over-expression in 293T cells dosimetrically reduced levels of the active form of PKR (phospho-PKR) and reduced levels of phospho-eIF-2α, a substrate of active PKR and regulator of protein synthesis (Nie, 2007).These data suggest that ADAR1 limits the PKR induced block to protein synthesis under conditions of stress in 293T cells, consistent with a direct interaction between ADAR1 and PKR as was recently proposed (Toth et al., 2009). We were therefore interested in whether over-expression of the inducible isoform of ADAR1, ADAR1(p150), would influence PKR activity in MPCs. As shown in Figure 4A, over-expression of ADAR1 in human MPCs, reduced levels of the active form of PKR (phospho-PKR) by approximately 50% (Figure 4B), with no effect on total PKR levels. These data suggest a role for ADAR1 in modulating PKR activity and presumably downstream targets that control protein synthesis, such as EIF-2α.
Figure 4. ADAR1 reduces phospho-PKR levels in muscle cells.
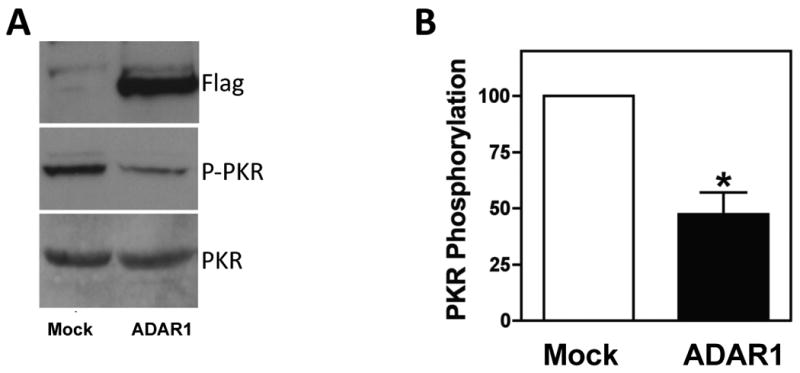
A: Primary human myoblasts were mock transfected or transfected with an ADAR1-encoding flag-tagged plasmid. Forty-eight hours after transfection cells were lysed, and total PKR expression and phosphorylated PKR were analyzed by western blot. A representative example from three independent experiments is shown. B: Quantitation of PKR phosphorylation. Values were normalized to total PKR quantities. P-values for triplicate measurements are shown.
The stress induced p38 MAPK is also a target of PKR and can mediate cytokine activation of proteasome activity (Li et al., 2005) as well as broadly influence myogenesis (Keren et al., 2006). In data not shown, ADAR1 over-expression suppressed levels of MAPK activation due to stress exposure, notably for p38 MAPK and p54 JNK in 293T cells. Such data suggest a protective role for ADAR1 in limiting a broad array of stress inducible pathways in multiple cell types.
The observed capacity for ADAR1 to attenuate pathways associated with blocks in protein synthesis and catabolic activity prompted us to ask whether ADAR1 might also influence reciprocal pathways associated with protein synthesis and anabolic activity in MPCs. Many previous studies have demonstrated that myogenic hypertrophy is positively associated with increased Akt (also known as protein kinase B, PKB) activity leading to downstream eIF-2α mediated increases in muscle protein synthesis, in part through phosphorylation and de-repression of GSK3β activity (Cross et al., 1995). To evaluate whether ADAR1 expression would influence levels of active Akt (i.e., phospho–Akt) during differentiation, we transfected MPCs with siRNA to ADAR1, cultured for one day in differentiation media, followed by stimulation for two days with IFN–γ to induce endogenous ADAR1 expression. Cells were harvested for total protein, then total and phosphorylated levels of Akt protein were measured by western blot. As shown in Figure 5, knockdown of ADAR1 expression by siRNA resulted in dramatic declines of phospho–Akt levels, whereas IFN–γ stimulated cells with control siRNA displayed much higher levels of phospho–Akt. These data indicate that ADAR1 promotes pro-anabolic myogenic signaling by protecting stress induced declines in active Akt, in addition to limiting inflammatory driven activation of PKR and the subsequent presumed blockade of protein synthesis pathways.
Figure 5. ADAR1 knockdown impairs phospho-Akt levels in cytokine stimulated differentiating muscle cells.
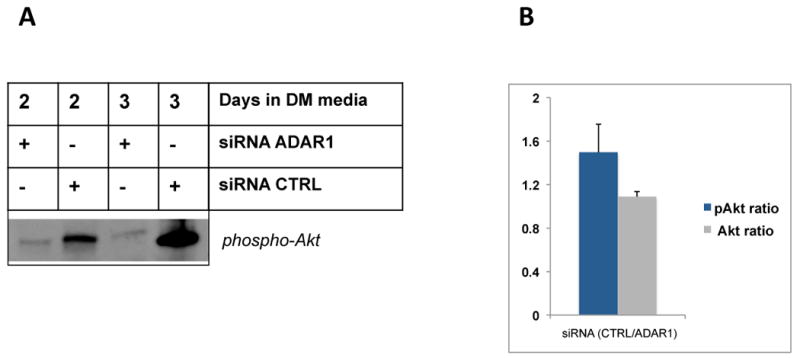
C2C12 MPCs were plated and, on the following day, transfected in duplicate using siRNA to ADAR1 or control (Accell siRNA control). 24 hours post-transfection, cells were stimulated with IFN–γ to induce ADAR1 expression and cultured for two and three days, then harvested and pooled for total protein on day 2 and day 3, respectivley. Total Akt and phospho-Akt (Cell Signaling) levels were probed by western blot, as indicated. The p-Akt bands and total Akt (not shown) for each transfection pair were quantified using ImageJ and relative intensities were plotted on a bar graph and significance evaluated using a t-test, p = 0.079, indicating a trend difference.
Discussion
In this study, we show that differentiating myoblasts express ADAR1 upon exposure to multiple inflammatory stimuli (e.g., LPS, TNF–α and IFN–γ Although inflammatory activation of ADAR1 expression has been described in leukocytes, this is the first report to our knowledge demonstrating stress activation of ADAR1 in muscle. ADAR1 was not expressed appreciably under growth conditions, suggesting that ADAR1 primarily functions when cells experience stress (e.g. exposure to inflammatory ligands) while concurrently undergoing differentiation. We go on to show that inflammatory stress also reduces expression of muscle specific microRNAs miR-1, miR-133a, and miR-206. To our knowledge, stress mediated decline in microRNAs during myogenic differentiation has also not been previously reported and therefore expands the molecular phenotype of cellular atrophy. This observation however is consistent with cytokine mediated attenuation of MyoD (Acharyya et al., 2004; Guttridge et al., 2000), an upstream regulator of these microRNAs (Rao et al., 2006). Thus, stress induced ADAR1 activation in muscle likely occurs in the same context of stress induced signaling pathways that promote atrophy (Eley et al., 2007; Eley and Tisdale, 2007).
In knockdown experiments, we show that reduced ADAR1 levels exacerbate inflammation-mediated declines in myogenic markers such as Myogenin and MHC, supporting a role for ADAR1 as a buffer to inflammatory stress (see Figure 3). Knockdown of ADAR1 expression did not appear to influence muscle microRNA levels for miR-1, miR-206 and miR-133, either in the context of basal or stress induced conditions (data not shown). However, ADAR1 may have more subtle effects on microRNA, since ADAR1 has been demonstrated to edit miR-1 in vitro, raising as yet the untested possibility that ADAR1 can directly influence microRNA biogenesis and function in muscle proliferation and differentiation (Yang et al., 2006). Conversely, miR-1 downregulates ADAR1 expression in vitro, suggesting a potential for cross-regulation (Lim et al., 2005). Further experimentation outside of the scope of this study will be required to better understand the role of ADAR1 in the context of inflammatory stress during muscle remodeling in vivo.
In gain-of-function experiments using human MPCS (Figure 4), ADAR1 reduced active phospho-PKR levels, consistent with a role in rescuing the block to protein synthesis induced by stress activated PKR (Nie et al., 2007). The regulation of protein synthesis in skeletal muscle is critically regulated at the translational initiation step, with a key role for the eukaryotic initiation factor - 2α (eIF-2α. In cachexia models for atrophy, there is an observed increase in phospho-eIF-2α in association with declines in myofibrillar proteins (Eley et al., 2008), suggesting that elevated phospho-eIF-2α levels contribute to net protein loss. A direct interaction of ADAR1 and PKR (both dsRNA binding proteins) has been recently described to result in PKR inhibition (Clerzius et al., 2009; Toth et al., 2009), consistent with results in this study. Recent other studies have also shown that viral infection induces interferon signaling resulting in eIF-2α phosphorylation with subsequent inhibition of protein synthesis (de Haro et al., 1996; Thomis and Samuel, 1992). This suggests that PKR modulation by ADAR1 may be a broadly relevant mechanism for regulating protein synthesis in response to both intrinsic and extrinsic pro-inflammatory agents. Activation of PKR may provide the link between inhibition of protein synthesis and induction of muscle protein degradation. This may have relevance to muscle atrophy in a range of conditions, e.g., cancer cachexia, HIV-AIDS, sepsis and disuse atrophy (Eley 2007).
ADAR1 also attenuated stress induced MAPK activation, a target of PKR. Inflammatory stress is an antagonist of anabolic IGF-1 signaling, in part through i) blocking downstream activation of pro-anabolic phospho-Akt levels thereby reducing protein synthesis (Aguirre et al., 2002; Strle et al., 2006), and ii) through stimulation of catabolic pathways, namely p38 MAPK and NF-κB mediated activation of MAFbx and MuRF1 atrogenes (Glass, 2005). Thus, the trend we observed that ADAR1 promotes myogenic signaling by attenuating stress induced declines in phospho-Akt (p = 0.079) raises an intriguing role for ADAR1 in protecting anabolic activity in the context of stress (see Figure 5). Akt is a critical signaling kinase within the IGF-1 growth axis, leading to de-repression of protein synthesis through phosphorylation of GSK3β (Cross et al., 1995). Supportive studies have shown that TNF-α / IFN-γ and IGF-1 are mutually antagonistic, with Akt as a positive regulator for myogenesis and a negative regulator for proteasome mediated atrophy, reviewed in (Glass, 2005).
There is a growing recognition that inflammatory stress also engages regulatory feedback mechanisms to resolve and tightly regulate the inflammatory response (Liu et al., 2007; O'Connell et al., 2007; Taganov et al., 2006). ADAR1 may operate in a similar fashion, induced by inflammation to limit inflammatory mediated damage (see model in Figure 6). Consistent with this view, knockdown of ADAR1 expression increased susceptibility to inflammation mediated declines in muscle markers and over-expression reduced phospho-PKR activity. A similar role for ADAR1 in buffering IFN–γ mediated damage during hematopoiesis has been recently described (Hartner et al., 2009).
Figure 6. Model for ADAR1 effects on muscle homeostasis during inflammatory stress.

In the schematic, muscle homeostasis (i.e., protein turnover) represents a balance of atrophy and growth signaling pathways. Inflammatory ligands in the microenvironment stimulate innate pathways such as IFN-γ to induce muscle atrophy. Inflammation in this model also induces a feedback regulation through activation of ADAR1, which suppresses atrophy pathways and induces muscle growth, possibly through modulating myogenic transcription, Akt activity and PKR activity, to thereby minimize declines in muscle atrophy.
ADAR1 expression and activity has been broadly implicated in the context of other inflammatory conditions; namely, HIV infection and molecular mechanisms of aging. In HIV infection, ADAR1 is upregulated (Montano et al., 2006), raising the possibility, based on data in this study, that ADAR1 may be induced to modulate infection associated stress by influencing PKR activity, as shown in other studies (Clerzius et al, 2009). Also, in studies of the genetic basis of aging, the ADAR gene family was associated with exceptional longevity in humans (Sebastiani et al., 2009). This is an intriguing observation, given reported declines in ADAR gene family activity with multiple diseases (Maas et al., 2006) and the stress buffering role for ADAR1 observed in this study. Collectively, the data presented in this report suggest a dual role for ADAR1 in both limiting stress atrophy and increasing myogenic pathways. This study provides new avenues for understanding intrinsic cellular mechanisms that underlay muscle atrophy and novel therapeutic strategies to assist intervention.
Material and Methods
Cell culture, transfection
Murine C2C12 myoblasts were obtained from ATCC (Manassas, VA) and maintained in growth medium (GM) that consisted of High Glucose Dulbeccos Minimum Essential Medium (DMEM) from Gibco, 10% Fetal Bovine Serum (FBS) from Gibco and 1% penicillin/streptomycin (Invitrogen). To induce differentiation, cells were allowed to reach 70% confluency, washed with PBS (1×) and switched to differentiation medium (DM) that consisted of Low Glucose DMEM supplemented with 2% Horse Serum (Gibco) and 1% penicillin/streptomycin. Primary human myoblasts were obtained from Cook Myosite Inc. (Pittsburgh, PA) and maintained using the MyoTonic Growth Media Kit (Catalog # MK-4444). Three independent isolates (40M, 17M, and 25M) were used for transfection experiments. Myoblasts were transfected with flag-tagged ADAR1 plasmid using Lipofectamine LTX (Invitrogen). Mock transfected myoblasts were used as a control. Forty-eight hours post transfection, cells were collected, and lysed. All cell lines used were maintained in a 37°C incubator at 5% CO2. Cells were passaged approximately every two days and were kept below 70% confluency.
Stimulations
Recombinant mouse interferon–γ (IFN-γ) and human tumor necrosis factor–α (TNF-α) were obtained from Calbiochem and Sigma–aldrich, respectively. To stimulate cell lines, recombinant protein was added to the cells when switching over to DM at a concentration of 10ng/mL for both IFN-γ and TNF-α separately. When cells were stimulated with IFN-γ and TNF-α together, they were each added at a concentration of 5ng/mL.
Quantitative real-time RT-PCR
Total RNA was isolated using the TRIzol (Invitrogen) method according to manufacturer instructions. We used this method of RNA extraction to ensure proper extraction of small RNAs (i.e. microRNAs). The Taqman One-Step RT-PCR Master Mix Reagents Kit from Applied Biosystems was used for relative quantitation of all non-microRNA targets. Target mRNA oligonucleotide primer/probe sets were obtained from Applied Biosystems. Assay IDs are as follows: Adar (Mm00508001_m1), Myogenin (Mm00446194_m1), and MyHC3 (Mm01332475_g1). Real-time PCR for non-microRNA targets was performed with the ABI Prism 7000 Sequence Detection System (Applied Biosystems); 30 min. at 48°C, 10 min. at 95°C and 40 cycles, denaturation: 15 sec. at 95°C, annealing/extension: 1 min. at 60°C. Fluorescence was measured during the annealing/extension step. Results were analyzed using the ABI Prism 7000 Sequence Detection System software via the ΔΔCt method. All samples were performed in duplicate and normalized to the relative expression of the eukaryotic 18S or GAPDH endogenous controls. For quantitation of all microRNA targets, the Taqman MicroRNA Reverse Transcription Kit from Applied Biosystems was used. Target microRNA Assay IDs are as follows: miR-1 (002222), miR-24 (000402), miR-133a (002246), and miR-206 (000510). Real-time PCR for microRNA targets was performed with the ABI Prism 7000 Sequence Detection (Applied Biosystems); Reverse Transcription: 30 min. at 16°C, 30 min. at 42°C and 5 min. at 85°C. Real-Time PCR: 10 min. at 95°C and 40 cycles, denaturation: 15 sec. at 95°C, annealing/extension: 1 min. at 60°C. Results were analyzed using the ABI Prism 7000 Sequence Detection System software via the ΔΔCt method. All samples were performed in duplicate and normalized to the relative expression of the small nucleolar RNA snoRNA202 (Applied Biosystems Part #4380914).
Protein and phospho-protein determination
AKT detection
Primary antibodies obtained from Cell Signaling. Cells were washed with PBS and lysed with cold lysis buffer (50mM Tris-Cl, pH 6.8, 150mM NaCl, 0.1% SDS, 1% NP-40) treated with 7× protease inhibitor cocktail tablets (Roche). Total cell lysates were quantified using the Bradford Assay. 5ug of protein was mixed with 2× loading buffer (Laemmli sample buffer (Bio-Rad): β-mercaptoethanol in a ratio of 19:1) and heated for 1 minute at 100°C. Samples were run through 10% polyacrylamide gels (Bio-Rad) for 1 hour at 90 volts then subsequently transferred to a PVDF membrane. Membranes were blocked for 1 hour at room temperature with TBS with 0.1% Tween-20 (TBS-T) and 5% bovine serum albumin (BSA). Primary antibodies were diluted 1:1000 in TBS-T + 5% BSA and incubated with agitation at room temperature for two hours. After washing membranes with TBS 3 times for 5 minutes, secondary HRP-linked antibodies were diluted 1:5000 in TBS-T + 5% BSA and incubated with agitation at 4°C overnight. Membranes were treated with enhanced chemiluminescence western blotting detection reagents (GE Lifesciences) and exposed to ECL hyperfilm (GE Lifesciences). Membranes were then treated with stripping solution (100mM β-mercaptoethanol, 2% SDS, 62.5mM Tris-HCl pH6.7) and re-probed once.
PKR detection
ADAR1 was detected using an anti-FLAG M2 antibody (Stratagene); anti-PKR was obtained from Cell Signaling Technology; anti-phospho-PKR was obtained from Millipore. PKR phosphorylation status was assessed by SDS-PAGE and western blot analysis. PKR phosphoryation was quantified using MultiGauge v.3.1 (Fujifilm).
siRNA
Dharmacon Accell siRNA against mouse ADAR1 was used (Accession #NM_001038587). Non-targeting siRNA from Dharmacon was used as a negative control (Catalog #D-001910-01-05). Accell siRNA delivery media was used and the siRNA was added according to manufacturer instructions. Delivery media was supplemented with 2% horse serum to avoid serum starvation and to initiate/perpetuate differentiation. siRNA was either added for 24 hours and then stimulated with inflammatory cytokines (TNF-α, IFN-γ) in DM or cells were stimulated first for 24 hours and then siRNA was added. After cells were in siRNA for 48 or 72 hours (72 or 48 hour stimulation, respectively), total RNA was extracted via the TRIzol (Invitrogen) method according to manufacturer instructions.
Statistical methods
Statistical significance was estimated using the non-parametric method, the Wilcoxon signed rank test without an assumption of normality in the data. Pairwise Wilcoxon comparisons (with a one-sided alternative) were conducted for each sample relative to the control within the same experimental set. Only p-values <0.05 were considered significant. Standard deviations or standard errors are also indicated. Values marked with an asterisk represent an average of duplicates.
Acknowledgments
The authors wish to acknowledge support by the National Institutes of Health (NIH/NIAMS) to MM (R01 AR055115) and support by the Muscular Dystrophy Association to KL and the Boston Claude D. Pepper Older Americans Independence Center.
References
- Acharyya S, Ladner KJ, Nelsen LL, Damrauer J, Reiser PJ, Swoap S, Guttridge DC. Cancer cachexia is regulated by selective targeting of skeletal muscle gene products. J Clin Invest. 2004;114:370–378. doi: 10.1172/JCI20174. [DOI] [PMC free article] [PubMed] [Google Scholar]
- Aguirre V, Werner ED, Giraud J, Lee YH, Shoelson SE, White MF. Phosphorylation of Ser307 in insulin receptor substrate-1 blocks interactions with the insulin receptor and inhibits insulin action. J Biol Chem. 2002;277:1531–1537. doi: 10.1074/jbc.M101521200. [DOI] [PubMed] [Google Scholar]
- Arnold L, Henry A, Poron F, Baba-Amer Y, van Rooijen N, Plonquet A, Gherardi RK, Chazaud B. Inflammatory monocytes recruited after skeletal muscle injury switch into antiinflammatory macrophages to support myogenesis. J Exp Med. 2007;204:1057–1069. doi: 10.1084/jem.20070075. [DOI] [PMC free article] [PubMed] [Google Scholar]
- Beutler B, Greenwald D, Hulmes JD, Chang M, Pan YC, Mathison J, Ulevitch R, Cerami A. Identity of tumour necrosis factor and the macrophage-secreted factor cachectin. Nature. 1985;316:552–554. doi: 10.1038/316552a0. [DOI] [PubMed] [Google Scholar]
- Chen JF, Mandel EM, Thomson JM, Wu Q, Callis TE, Hammond SM, Conlon FL, Wang DZ. The role of microRNA-1 and microRNA-133 in skeletal muscle proliferation and differentiation. Nat Genet. 2006;38:228–233. doi: 10.1038/ng1725. [DOI] [PMC free article] [PubMed] [Google Scholar]
- Clerzius G, Gelinas JF, Daher A, Bonnet M, Meurs EF, Gatignol A. ADAR1 interacts with PKR during human immunodeficiency virus infection of lymphocytes and contributes to viral replication. J Virol. 2009;83:10119–10128. doi: 10.1128/JVI.02457-08. [DOI] [PMC free article] [PubMed] [Google Scholar]
- Cross DA, Alessi DR, Cohen P, Andjelkovich M, Hemmings BA. Inhibition of glycogen synthase kinase-3 by insulin mediated by protein kinase B. Nature. 1995;378:785–789. doi: 10.1038/378785a0. [DOI] [PubMed] [Google Scholar]
- de Haro C, Mendez R, Santoyo J. The eIF-2alpha kinases and the control of protein synthesis. Faseb J. 1996;10:1378–1387. doi: 10.1096/fasebj.10.12.8903508. [DOI] [PubMed] [Google Scholar]
- Di Marco S, Mazroui R, Dallaire P, Chittur S, Tenenbaum SA, Radzioch D, Marette A, Gallouzi IE. NF-kappa B-mediated MyoD decay during muscle wasting requires nitric oxide synthase mRNA stabilization, HuR protein, and nitric oxide release. Mol Cell Biol. 2005;25:6533–6545. doi: 10.1128/MCB.25.15.6533-6545.2005. [DOI] [PMC free article] [PubMed] [Google Scholar]
- Dreyer HC, Volpi E. Role of protein and amino acids in the pathophysiology and treatment of sarcopenia. J Am Coll Nutr. 2005;24:140S–145S. doi: 10.1080/07315724.2005.10719455. [DOI] [PMC free article] [PubMed] [Google Scholar]
- Eley HL, Russell ST, Tisdale MJ. Attenuation of muscle atrophy in a murine model of cachexia by inhibition of the dsRNA-dependent protein kinase. Br J Cancer. 2007;96:1216–1222. doi: 10.1038/sj.bjc.6603704. [DOI] [PMC free article] [PubMed] [Google Scholar]
- Eley HL, Skipworth RJ, Deans DA, Fearon KC, Tisdale MJ. Increased expression of phosphorylated forms of RNA-dependent protein kinase and eukaryotic initiation factor 2alpha may signal skeletal muscle atrophy in weight-losing cancer patients. Br J Cancer. 2008;98:443–449. doi: 10.1038/sj.bjc.6604150. [DOI] [PMC free article] [PubMed] [Google Scholar]
- Eley HL, Tisdale MJ. Skeletal muscle atrophy, a link between depression of protein synthesis and increase in degradation. J Biol Chem. 2007;282:7087–7097. doi: 10.1074/jbc.M610378200. [DOI] [PubMed] [Google Scholar]
- Frost RA, Nystrom GJ, Lang CH. Multiple Toll-like receptor ligands induce an IL-6 transcriptional response in skeletal myocytes. Am J Physiol Regul Integr Comp Physiol. 2006;290:R773–784. doi: 10.1152/ajpregu.00490.2005. [DOI] [PubMed] [Google Scholar]
- George CX, Samuel CE. Characterization of the 5′-flanking region of the human RNA-specific adenosine deaminase ADAR1 gene and identification of an interferon-inducible ADAR1 promoter. Gene. 1999a;229:203–213. doi: 10.1016/s0378-1119(99)00017-7. [DOI] [PubMed] [Google Scholar]
- George CX, Samuel CE. Human RNA-specific adenosine deaminase ADAR1 transcripts possess alternative exon 1 structures that initiate from different promoters, one constitutively active and the other interferon inducible. Proc Natl Acad Sci U S A. 1999b;96:4621–4626. doi: 10.1073/pnas.96.8.4621. [DOI] [PMC free article] [PubMed] [Google Scholar]
- Glass DJ. Skeletal muscle hypertrophy and atrophy signaling pathways. Int J Biochem Cell Biol. 2005;37:1974–1984. doi: 10.1016/j.biocel.2005.04.018. [DOI] [PubMed] [Google Scholar]
- Guttridge DC, Mayo MW, Madrid LV, Wang CY, Baldwin AS., Jr NF-kappaB-induced loss of MyoD messenger RNA: possible role in muscle decay and cachexia. Science. 2000;289:2363–2366. doi: 10.1126/science.289.5488.2363. [DOI] [PubMed] [Google Scholar]
- Hartner JC, Walkley CR, Lu J, Orkin SH. ADAR1 is essential for the maintenance of hematopoiesis and suppression of interferon signaling. Nat Immunol. 2009;10:109–115. doi: 10.1038/ni.1680. [DOI] [PMC free article] [PubMed] [Google Scholar]
- Hovanessian AG. On the discovery of interferon-inducible, double-stranded RNA activated enzymes: the 2′-5′oligoadenylate synthetases and the protein kinase PKR. Cytokine Growth Factor Rev. 2007;18:351–361. doi: 10.1016/j.cytogfr.2007.06.003. [DOI] [PubMed] [Google Scholar]
- Jeffrey IW, Bushell M, Tilleray VJ, Morley S, Clemens MJ. Inhibition of protein synthesis in apoptosis: differential requirements by the tumor necrosis factor alpha family and a DNA-damaging agent for caspases and the double-stranded RNA-dependent protein kinase. Cancer Res. 2002;62:2272–2280. [PubMed] [Google Scholar]
- Keren A, Tamir Y, Bengal E. The p38 MAPK signaling pathway: A major regulator of skeletal muscle development. Mol Cell Endocrinol. 2006 doi: 10.1016/j.mce.2006.03.017. [DOI] [PubMed] [Google Scholar]
- Li YP, Chen Y, John J, Moylan J, Jin B, Mann DL, Reid MB. TNF-alpha acts via p38 MAPK to stimulate expression of the ubiquitin ligase atrogin1/MAFbx in skeletal muscle. FASEB J. 2005;19:362–370. doi: 10.1096/fj.04-2364com. [DOI] [PMC free article] [PubMed] [Google Scholar]
- Lim LP, Lau NC, Garrett-Engele P, Grimson A, Schelter JM, Castle J, Bartel DP, Linsley PS, Johnson JM. Microarray analysis shows that some microRNAs downregulate large numbers of target mRNAs. Nature. 2005;433:769–773. doi: 10.1038/nature03315. [DOI] [PubMed] [Google Scholar]
- Liu Y, Shepherd EG, Nelin LD. MAPK phosphatases--regulating the immune response. Nat Rev Immunol. 2007;7:202–212. doi: 10.1038/nri2035. [DOI] [PubMed] [Google Scholar]
- Maas S, Kawahara Y, Tamburro KM, Nishikura K. A-to-I RNA editing and human disease. RNA Biol. 2006;3:1–9. doi: 10.4161/rna.3.1.2495. [DOI] [PMC free article] [PubMed] [Google Scholar]
- Melcher T, Maas S, Herb A, Sprengel R, Seeburg PH, Higuchi M. A mammalian RNA editing enzyme. Nature. 1996;379:460–464. doi: 10.1038/379460a0. [DOI] [PubMed] [Google Scholar]
- Montano M, Rarick M, Sebastiani P, Brinkmann P, Navis A, Wester CW, Thior I, Essex M. Gene expression profiling of HIV-1 infection and perinatal transmission in Botswana. Genes and Immunity. 2006;7:298–309. doi: 10.1038/sj.gene.6364297. [DOI] [PMC free article] [PubMed] [Google Scholar]
- Nie Y, Hammond GL, Yang JH. Double-stranded RNA deaminase ADAR1 increases host susceptibility to virus infection. J Virol. 2007;81:917–923. doi: 10.1128/JVI.01527-06. [DOI] [PMC free article] [PubMed] [Google Scholar]
- O'Connell RM, Taganov KD, Boldin MP, Cheng G, Baltimore D. MicroRNA-155 is induced during the macrophage inflammatory response. Proc Natl Acad Sci U S A. 2007;104:1604–1609. doi: 10.1073/pnas.0610731104. [DOI] [PMC free article] [PubMed] [Google Scholar]
- Pasare C, Medzhitov R. Toll-like receptors: linking innate and adaptive immunity. Microbes Infect. 2004;6:1382–1387. doi: 10.1016/j.micinf.2004.08.018. [DOI] [PubMed] [Google Scholar]
- Patterson JB, Samuel CE. Expression and regulation by interferon of a double-stranded-RNA-specific adenosine deaminase from human cells: evidence for two forms of the deaminase. Mol Cell Biol. 1995;15:5376–5388. doi: 10.1128/mcb.15.10.5376. [DOI] [PMC free article] [PubMed] [Google Scholar]
- Patterson JB, Thomis DC, Hans SL, Samuel CE. Mechanism of interferon action: double-stranded RNA-specific adenosine deaminase from human cells is inducible by alpha and gamma interferons. Virology. 1995;210:508–511. doi: 10.1006/viro.1995.1370. [DOI] [PubMed] [Google Scholar]
- Rao PK, Kumar RM, Farkhondeh M, Baskerville S, Lodish HF. Myogenic factors that regulate expression of muscle-specific microRNAs. Proc Natl Acad Sci U S A. 2006;103:8721–8726. doi: 10.1073/pnas.0602831103. [DOI] [PMC free article] [PubMed] [Google Scholar]
- Samuel CE. Mechanism of interferon action: phosphorylation of protein synthesis initiation factor eIF-2 in interferon-treated human cells by a ribosome-associated kinase processing site specificity similar to hemin-regulated rabbit reticulocyte kinase. Proc Natl Acad Sci U S A. 1979;76:600–604. doi: 10.1073/pnas.76.2.600. [DOI] [PMC free article] [PubMed] [Google Scholar]
- Samuel CE. Antiviral actions of interferons. Clin Microbiol Rev. 2001;14:778–809. doi: 10.1128/CMR.14.4.778-809.2001. table of contents. [DOI] [PMC free article] [PubMed] [Google Scholar]
- Sebastiani P, Montano M, Puca A, Solovieff N, Kojima T, Wang MC, Melista E, Meltzer M, Fischer SE, Andersen S, et al. RNA editing genes associated with extreme old age in humans and with lifespan in C. elegans. PLoS One. 2009;4:e8210. doi: 10.1371/journal.pone.0008210. [DOI] [PMC free article] [PubMed] [Google Scholar]
- Smith MA, Moylan JS, Smith JD, Li W, Reid MB. IFN-gamma does not mimic the catabolic effects of TNF-alpha. Am J Physiol Cell Physiol. 2007;293:C1947–1952. doi: 10.1152/ajpcell.00269.2007. [DOI] [PubMed] [Google Scholar]
- Strle K, Broussard SR, McCusker RH, Shen WH, LeCleir JM, Johnson RW, Freund GG, Dantzer R, Kelley KW. C-jun N-terminal kinase mediates tumor necrosis factor-alpha suppression of differentiation in myoblasts. Endocrinology. 2006;147:4363–4373. doi: 10.1210/en.2005-1541. [DOI] [PubMed] [Google Scholar]
- Taganov KD, Boldin MP, Chang KJ, Baltimore D. NF-kappaB-dependent induction of microRNA miR-146, an inhibitor targeted to signaling proteins of innate immune responses. Proc Natl Acad Sci U S A. 2006;103:12481–12486. doi: 10.1073/pnas.0605298103. [DOI] [PMC free article] [PubMed] [Google Scholar]
- Thomis DC, Samuel CE. Mechanism of interferon action: autoregulation of RNA-dependent P1/eIF-2 alpha protein kinase (PKR) expression in transfected mammalian cells. Proc Natl Acad Sci U S A. 1992;89:10837–10841. doi: 10.1073/pnas.89.22.10837. [DOI] [PMC free article] [PubMed] [Google Scholar]
- Tidball JG. Inflammatory processes in muscle injury and repair. Am J Physiol Regul Integr Comp Physiol. 2005;288:R345–353. doi: 10.1152/ajpregu.00454.2004. [DOI] [PubMed] [Google Scholar]
- Timmerman KL, Volpi E. Amino acid metabolism and regulatory effects in aging. Curr Opin Clin Nutr Metab Care. 2008;11:45–49. doi: 10.1097/MCO.0b013e3282f2a592. [DOI] [PMC free article] [PubMed] [Google Scholar]
- Tisdale MJ. Mechanisms of cancer cachexia. Physiol Rev. 2009;89:381–410. doi: 10.1152/physrev.00016.2008. [DOI] [PubMed] [Google Scholar]
- Toth AM, Li Z, Cattaneo R, Samuel CE. RNA-specific adenosine deaminase ADAR1 suppresses measles virus-induced apoptosis and activation of protein kinase PKR. J Biol Chem. 2009;284:29350–29356. doi: 10.1074/jbc.M109.045146. [DOI] [PMC free article] [PubMed] [Google Scholar]
- Yang JH, Luo X, Nie Y, Su Y, Zhao Q, Kabir K, Zhang D, Rabinovici R. Widespread inosine-containing mRNA in lymphocytes regulated by ADAR1 in response to inflammation. Immunology. 2003;109:15–23. doi: 10.1046/j.1365-2567.2003.01598.x. [DOI] [PMC free article] [PubMed] [Google Scholar]
- Yang W, Chendrimada TP, Wang Q, Higuchi M, Seeburg PH, Shiekhattar R, Nishikura K. Modulation of microRNA processing and expression through RNA editing by ADAR deaminases. Nat Struct Mol Biol. 2006;13:13–21. doi: 10.1038/nsmb1041. [DOI] [PMC free article] [PubMed] [Google Scholar]