

Abstract
The cellular level of neurogenic differentiation 1 (NeuroD) is modulated differentially by μ-opioid receptor agonists: fentanyl increases NeuroD level by reducing the amount of miR-190, an inhibitor of NeuroD expression, whereas morphine does not alter NeuroD level. In the current study, NeuroD activity was demonstrated to be also under agonist-dependent regulation. After three-day treatment, morphine and fentanyl decreased the activity of the Ca2+/calmodulin-dependent protein kinase II α (CaMKIIα), which phosphorylates and activates NeuroD. Because NeuroD activity is determined by both the CaMKIIα activity and the cellular NeuroD level, the overall NeuroD activity was reduced by morphine, but maintained during fentanyl treatment. The differential effects of agonists on NeuroD activity were further confirmed by measuring the mRNA levels of four NeuroD downstream targets: doublecortin, Notch1, NeuroD4 and Roundabout 1. Decreased dendritic spine stability and μ-opioid receptor signaling capability were also observed when NeuroD activity was attenuated by miR-190 overexpression or treatment with KN93, a CaMKIIα inhibitor. The decrease could be rescued by NeuroD overexpression which restored NeuroD activity to the basal level. Furthermore, elevating NeuroD activity attenuated the morphine-induced decrease in dendritic spine stability. Therefore, by regulating NeuroD activity, μ-opioid receptor agonists modulate the stability of dendritic spines.
Keywords: Opioid, ERK, CaMKII, Dendritic spine, Hippocampus, NeuroD
Introduction
Neurogenic differentiation 1 (NeuroD or BETA2) is a member of the basic helix-loop-helix transcription factor family. It is essential for the development of the central nervous system (CNS) and the formation of the endocrine system. Severe defects in granule cells of the cerebellum and hippocampal dentate gyrus have been identified in NeuroD-null mice rescued by exogenous insulin (Cho and Tsai, 2004). The cellular level of NeuroD is differentially regulated by μ-opioid receptor (OPRM1) agonists (Zheng et al., 2010b). Fentanyl suppresses the expression of microRNA-190 (miR-190), which binds complimentarily to NeuroD mRNA and decreases the mRNA and protein levels of NeuroD. Morphine treatment has no effect on the expression of miR-190 and NeuroD (Zheng et al., 2010b).
RNAi against NeuroD shortens the dendrites of cerebellar granule neurons (Gaudilliere et al., 2004). NeuroD functions depend on its phosphorylation on Ser336 by the Ca2+/calmodulin-dependent protein kinase II α (CaMKIIα). KN93, an inhibitor of CaMKIIα, attenuates NeuroD activity (Gaudilliere et al., 2004). Thus NeuroD activity hinges on both its expression and CaMKIIα-mediated phosphorylation. CaMKIIα is also a downstream kinase of OPRM1. Acute treatment with morphine increases the activity of CaMKIIα, while CaMKIIα activity decreases after chronic morphine treatment in the rat hippocampus (Lou et al., 1999). Although how fentanyl regulates CaMKIIα is unknown, the interaction between fentanyl and the CaMKIIα pathway has been suggested (Chen et al., 1993).
Chronic morphine treatment decreases dendritic spine density in hippocampal neurons by causing the collapse of preexisting dendritic spines, whereas agonists which induce robust receptor internalization (e.g., etorphine and fentanyl) do not (Liao et al., 2005; Liao et al., 2007a; Liao et al., 2007b). The significance of the spine collapse in the chronic drug action remains to be determined, but the observation that OPRM1 clusters on the dendritic spines (Liao et al., 2005) suggests that the collapse of spines may impair the signaling capability of OPRM1. Furthermore, the degrees of receptor internalization induced by agonists correlate with the destabilizing effects of agonists on dendritic spine stability (Liao et al., 2007b). This correlation might be the basis for the higher tolerance induced by morphine as compared to fentanyl, when equivalent in vivo doses of these two agonists were used (Duttaroy and Yoburn, 1995).
Although the detailed mechanisms remain unknown, a constitutively active mutant of CaMKIIα increases dendritic spine formation (Pratt et al., 2003). In addition, CaMKIIα-mediated NeuroD phosphorylation is required for the development and maintenance of dendrite morphology (Gaudilliere et al., 2004). Therefore, the CaMKIIα-NeuroD pathway may contribute to opioid-induced modulation of dendritic spine stability. In the current study, the effects of two OPRM1 agonists, morphine and fentanyl, and CaMKIIα on NeuroD activity were determined in primary hippocampal cultures from rats. The contribution of NeuroD activity to dendritic spine stability and to morphine-induced decrease in spine stability was also investigated.
Materials and Methods
Primary hippocampal neuron cultures and virus construction
Primary cultures of rat hippocampal neurons were prepared as described (Liao et al., 2007b). Matured neurons (three weeks after plating) were used in current study. For imaging analysis, DsRed (Clontech, Mountain View, CA, USA) in pRK5 vector was transfected into neurons with Lipofectamine 2000 (Invitrogen, Carlsbad, CA, USA) one week after plating. Treatments began on the 21st day after plating, and live-cell imaging of the neurons was captured before and after three-day treatment, with a BD CARV II™ Confocal Imager and a Leica DMIRE2 fluorescence microscope and analyzed with IPlab 4.0 software (BD Biosciences-193 Bioimage, MD) as previously reported (Zheng et al., 2008b). Spines were defined as dendritic protrusions with an expanded head that was 50% wider than its neck. Because there is no significant generation of new spines (Liao et al., 2007b), spine stability was measured by spine density and volume (overall DsRed fluorescence of spines). Images were adjusted to achieve comparable fluorescence intensities in the cell bodies before analysis.
Lentiviruses expressing miR-190 (190-vir: 5'-TGCTGTGATATGTTTGATATATTAGGGTTTTGGCCACTGACTGACCCTAATATCAAACATATCA-3') or a control oligonucleotide (con-vir : 5'-TGCTAGAGACCAGATTACCCGGGTGTAATGGTCTCA-3') were constructed in V5-DEST using the Lentiviral miR RNAi Expression System (Invitrogen) following manufacturer's instructions. Thus con-vir and 190-vir also express EGFP. The nd-vir was generated by inserting NeuroD cDNA between the SpeI and XhoI sites of V5-DEST (Invitrogen). ECFP (with its own CMV promoter) from ECFP-N1 (Clontech) was inserted into the XbaI site of the V5-DEST. Viruses were produced by transfecting 293FT cells with V5-DEST constructs together with pLP1 and pLP2 and pLP-VSVG (Invitrogen). Viral titers (~1.2 × 10⁶ TU/mL) were determined in neuroblastoma N2A cells. Infection efficiency was greater than 60%.
Immunoprecipitation and immunoblotting
Immunoblotting and immunoprecipitation were performed as described previously (Zheng et al., 2008a). Cells were divided into three equal aliquots. One aliquot was used to prepare the nucleus extract with the NE-PER Nuclear and Cytoplasmic Extract kit (Pierce). Nucleus extract was mixed with an antibody against NeuroD for 6 hrs and then with Protein G beads (Invitrogen) overnight at 4°C. Proteins bound to the beads were then extracted by using the sample buffer. NeuroD phosphorylation was determined by measuring the amounts of phosphorylated serine (pSer) in the immunoprecipitated NeuroD. The second aliquot was used to measure total NeuroD after nucleus extraction. The last aliquot was used for whole cell lysis with the same kit to determine the levels of phosphorylated CaMKIIα, total CaMKIIα, total extracellular signal-regulated kinase (ERK), and β-actin.
Total ERK and NeuroD antibodies were purchased from Cell Signaling (Danvers, MA, USA); CaMKIIα and phosphorylated CaMKIIα antibodies were from Genscript (Piscataway, NJ, USA); and pSers from Sigma (St. Louis, MO, USA). The secondary antibody with AP conjugation was from BioRad Laboratory (Hercules, CA, USA).
Real-time PCR
Total RNAs was extracted with miRNAs using the miRNeasy mini kit (Qiagen), and reverse transcribed with miScript Reverse Transcription Kit (Qiagen). Real-time PCR was done by using the miScript SYBR Green PCR Kit (Qiagen). GAPDH served as the internal control. Primers were listed below. NeuroD : 5'-CTTCCCGGTGCATCCCTACTCCTACC-3' and 5'-AGGAAGGGCTGGTGCAATCAGTTAGG-3'; miR-190: 5'- TGATATGTTTGATATATTAGGT-3'; DCX: 5'- ACTGACATCACAGAAGCGATCAAACTGG-3' and 5'- ACTGCTAGAAGTTCCATTTGCGTCTTGG -3'; ND4: 5'- CAATCTGCCCTCTTGGAGAAGCGTGAGG-3' and 5'-GCGTTGAATGCACATGCCCTGAACTTACA-3'; Notch1: 5'-CACCACGCCTCTCCCACCTGCCTGTAGC-3' and 5'-TGCCTGTGTGCTTAGTGTGCCCGGAGTC-3'; Robo1: 5'-CACCAGCCAGGACATCTGCGCAGAGAGG-3' and 5'-GGTGGAAGGTCTCGCTTTGCTGTCTTCG-3'; GAPDH: 5'-CCTGCACCACCAACTGCTTAGC-3' and 5'-GCCAG TGAGCTTCCCGTTCAGC-3'.
OPRM1 Signaling
The OPRM1-mediated extracellular signal-regulated kinase (ERK) phosphorylation and adenylyl cyclase inhibition were monitored to determine signaling capability of OPRM1. Phosphorylated ERK was determined by immunoblotting as described previously (Zheng et al., 2008a). Briefly, after 5 min treatment with morphine or fentanyl, the immunoreactivity of phosphorylated ERK was measured and normalized to those of total ERK and β-actin. Adenylyl cyclase inhibition was determined by measuring cellular cAMP level as described previously (Zhao et al., 2006). Briefly, the ability of agonist to attenuate forskolin-induced cAMP was used to indicate the decrease in adenylyl cyclase activity.
TUNEL assay
TUNEL assays were carried out with ApopTag In Situ Apoptosis Detection kit (Millpore, MA, USA) following the manufacturer's instruction. Apoptosis cells were stained with red fluorescence, and counterstained with DAPI (Santa Cruz, Paso Roble, CA, USA). Apoptosis was quantified by calculating the percentage rate of TUNEL positive cells in the DAPI positive cells. As a positive control, cells were treated with 1 μM staurosporin for 24 hours to induce apoptosis.
Statistic methods
Experiments were repeated at least four times (more than eight individual neurons for image analysis). Data were analyzed and compared by one-way ANOVA with Dunnett-test as post-hoc test for comparisons, except Fig. 5C and Fig. 7C and Table 1 for which two-way ANOVA and Bonferroni-test were used. Error bars and “*” presented the standard deviations and significant changes (p<0.05), respectively.
Fig. 5. NeuroD activity is required to maintain spine stability.

Primary cultures were treated with PBS (control), con-vir, 190-vir, 190-vir & nd-vir, nd-vir, KN92 (2μM), KN93 (2μM) or KN93 (2μM) + nd-vir for three days.
Live-cell images on Day 0 and Day 3 of a portion of a single dendrite from a representative neuron were presented in (A). EGFP and ECFP were used to indicate successful infection of con-vir/190-vir and nd-vir, respectively. Spine densities on Day 0 and 3 were quantified and presented in (B). Spine volumes were calculated by the overall DsRed fluorescence, and normalized against the fluorescence intensity on Day 3 was normalized against that on Day 0 (C). The apoptosis rates were also determined, with neurons treated with 1 μM staurosporin for 24 hours serving as positive control(D).
Fig. 7. Elevating NeuroD activity attenuates morphine-induced decrease in spine stability.

Primary hippocampal neuron cultures were treated with PBS (Control), DMSO (0.1%), morphine (1 μM), morphine (1 μM) & nd-vir, fentanyl (10 nM), fentanyl (10 nM) & 190-vir or fentanyl (10 nM) & KN93 for 3days.
Live-cell images on Day 0 and Day 3 of a portion of a dendrite from a representative neuron were presented in (A), while spine densities on Day 0 and Day 3 were presented in (B). Spine volumes were measured by the overall DsRed fluorescence, and the fluorescence intensity on Day 3 was normalized against that on Day 0 (C). Apoptosis rates were measured as in Fig. 5D (D).
Table 1. NeuroD activity and spine stability influence OPRM1 signaling.
Rat primary hippocampal neuron cultures were infected with PBS, con-vir, 190-vir, 190-vir plus nd-vir or nd-vir for three days. Cells were then treated for 5 minutes with 1 μM morphine or 10 nM fentanyl before ERK phosphorylation was measured. Serial doses of morphine (10 μM~0.01 nM) or etorphine (100 nM~0.1 pM) were used to determine the dose response of the agonists to induce adenylyl cyclase inhibition as described in Materials and Methods. To determine ERK phosphorylation, the immunoreactivity of phosphorylated ERK was normalized to the immunoreactivity of total ERK and β-actin, and the results were further normalized against those in un-treated cells. Adenylyl cyclase inhibition induced by agonists was indicated by both IC50 (KI) and the maximum inhibition (Max. Inh). No difference in the basal levels of OPRM1 signaling was observed in different groups. The data with “*” indicated the decreased signaling capability of OPRM1.
| Morphine | Fentanyl | |||||
|---|---|---|---|---|---|---|
| AC inhibition |
Phos-ERK | AC inhibition |
Phos-ERK | |||
| KI (nM) | Max. Inh. (%) | (% of Control) | KI (pM) | Max. Inh. (%) | (% of Control) | |
| PBS | 24.2±6.5 | 30.0±2.7 | 173±15 | 165±40 | 29.2±5.1 | 178±8 |
| Con-vir | 26.0±3.5 | 28.9±4.2 | 165±16 | 201±45 | 27.4±4.3 | 174±10 |
| 190-vir | 67.6±8.1* | 10.0±3.1* | 125±8* | 857±109* | 7.7±2.8* | 128±4* |
| 190-vir&nd-vir | 38.7±9.4 | 21.6±3.2 | 151±5 | 256±48 | 23.1±3.8 | 159±13 |
| nd-vir | 22.2±4.8 | 33.4±2.5 | 177±25 | 178±27 | 27.2±3.1 | 176±13 |
Results
Morphine, but not fentanyl, decreases NeuroD activity
Recently we reported that chronic fentanyl, but not morphine, treatment decreased the cellular level of miR-190 in primary rat hippocampal neuron cultures and in mouse hippocampi. Because miR-190 inhibited NeuroD expression, fentanyl increased the levels of NeuroD (Zheng et al., 2010b). Since NeuroD requires phosphorylation to sustain dendritic morphology, we examined whether NeuroD activity mediated the differential effects of OPRM1 agonists on dendritic spine stability.
The maximum effects of OPRM1 agonists on miR-190 expression and spine stability are observed on the third day of agonist treatment (Liao et al., 2005; Zheng et al., 2010b). In addition, 10 nM fentanyl induces the maximum decrease in miR-190. And 1 μM morphine is equivalent to 10 nM fentanyl in activating OPRM1 (Zheng et al., 2010b). Therefore primary rat hippocampal neuron cultures were treated with 1 μM morphine or 10 nM fentanyl for 3 days.
As shown in Fig 1A and B, fentanyl increased both the protein and mRNA levels of NeuroD, while morphine did not. This increase in NeuroD level was inversely related to the decrease in miR-190 expression as previously reported (Zheng et al., 2010b). Fentanyl, but not morphine, decreased miR-190 expression (Fig 1B).
Fig. 1. Morphine, but not Fentanyl, decreases NeuroD activity.
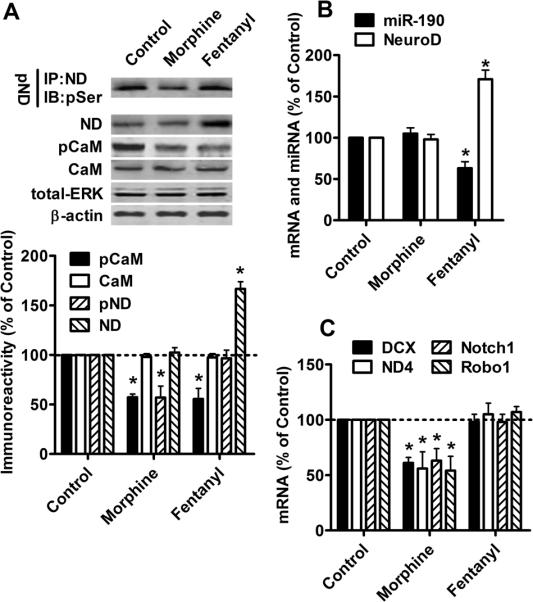
Primary rat hippocampal cultures were treated with PBS (control), 1 μM morphine or 10 nM fentanyl for three days.
(A) The amount of phosphorylated serine was determined in immunoprecipitated NeuroD to indicate NeuroD phosphorylation (pND). Total NeuroD (ND) was measured in the nuclear extracts. The total CaMKIIα (CaM), phosphorylated CaMKIIα (pCaM), total ERK (ERK) and β-actin were detected in whole cell lysis. Total ERK and β-actin served as internal controls.
(B) The levels of miR-190 and NeuroD mRNA were measured by real-time PCR.
(C) mRNA levels of DCX, ND4, Notch1 and Robo1 were determined by real-time PCR. The results (A–C) were normalized against those in control samples.
Because phosphorylation on Ser336 of NeuroD is essential for NeuroD activity (Gaudilliere et al., 2004), NeuroD activity was quantified by determining the amount of phosphorylated serine residue in immunoprecipitated NeuroD. NeuroD phosphorylation decreased after three-day morphine treatment, but was not affected by fentanyl (Fig. 1A). To confirm that the changes in NeuroD phosphorylation represented changes in NeuroD activity, the mRNA levels of four NeuroD targets, DCX, NeuroD4 (ND4), Notch1 and Roundabout 1 (Robo1), were measured. NeuroD has been reported to significantly increase the mRNA levels of these four genes (Seo et al., 2007). As indicated in Fig. 1C, mRNA levels of these targets decreased after morphine treatment, but not after fentanyl treatment, demonstrating that morphine decreased NeuroD activity, while fentanyl did not.
Both morphine and fentanyl decrease CaMKIIα phosphorylation
The effects of agonists on NeuroD activity were different from those on the cellular level of NeuroD, suggesting that miR-190 was not the only factor involved in regulating NeuroD activity. Chronic morphine treatment inactivates CaMKIIα, an upstream activator of NeuroD (Lou et al., 1999; Gaudilliere et al., 2004). We measured CaMKIIα activity by determining CaMKIIα phosphorylation at the Thr286 residue (Colbran and Brown, 2004). The level of CaMKIIα phosphorylation decreased after chronic treatment with either morphine or fentanyl (Fig. 1A). However, the expression of CaMKIIα was not affected. Hence, OPRM1 agonists could control NeuroD activity via two mediators, miR-190 and CaMKIIα. Morphine reduced CaMKIIα activity but not miR-190 expression, thereby decreasing NeuroD activity. In contrast, NeuroD activity was constant during fentanyl treatment, since fentanyl reduced both CaMKIIα activity and miR-190 expression.
Modulating NeuroD cellular level controls NeuroD activity
Lentiviruses were prepared in order to demonstrate that NeuroD activity can be modulated at the level of NeuroD protein expression, several. 190-vir and nd-vir were constructed to ectopically express miR-190 and NeuroD, while con-vir was constructed to serve as a negative control. As indicated in the Fig. 2A and B, con-vir did not change the cellular NeuroD level (both protein and mRNA levels) or miR-190. However, a significant increase in miR-190 level was observed three days after 190-vir infection. Decreased NeuroD expression was observed at the same time, which is consistent with the inhibitory effects of miR-190 on NeuroD expression. In parallel, infection with nd-vir did not affect miR-190, but increased NeuroD at both the mRNA and protein levels (Fig. 2A and B). When primary hippocampal neuron cultures were infected with 190-vir and nd-vir simultaneously, no measurable decrease in NeuroD expression was observed, even though miR-190 was elevated (Fig. 2 A and B). Thus, the inhibitory effects of miR-190 on NeuroD level can be reversed by nd-vir-mediated over-expression of NeuroD.
Fig. 2. NeuroD level correlates with its activity.

Primary cultures were treated with PBS (control), con-vir, 190-vir, 190-vir & nd-vir and nd-vir for three days.
(A) The amount of phosphorylated NeuroD, total NeuroD, total CaMKIIα, phosphorylated CaMKIIα, total ERK and β-actin were determined as in Fig. 1A.
(B) The levels of miR-190 and NeuroD mRNA were measured by real-time PCR.
(C) The mRNA levels of DCX, ND4, Notch1 and Robo1 were determined with real-time PCR. The results (A–C) were normalized against those in control samples.
Changes in NeuroD phosphorylation were also monitored in primary hippocampal neuron cultures infected with these viruses. 190-vir decreased while nd-vir increased the amount of phosphorylated NeuroD (Fig. 2A). NeuroD phosphorylation was maintained at the basal level when primary hippocampal neuron cultures were infected with both 190-vir and nd-vir (Fig. 2A). Consistently 190-vir decreased while nd-vir increased the mRNA levels of DCX, ND4, Notch1 and Robo1 (Fig. 2C). When 190-vir and nd-vir were used to co-infect primary cultures, mRNAs levels of these four targets were close to the basal levels (Fig 2C), as was NeuroD phosphorylation. These viruses were then used to modulate NeuroD levels, thereby controlling NeuroD activity.
Modulating CaMKIIα activity also controls NeuroD activity
KN92 and KN93 were used to demonstrate that NeuroD activity can be modulated at the level of NeuroD phosphorylation. KN93 is a specific inhibitor for CaMKII, while KN92 is a structural analog of KN93 which does not inhibit CaMKII (Sumi et al., 1991). The activity of CaMKIIα was indicated by its autophosphorylation on Thr286 (Wayman et al., 2008), and KN93 has been reported to decrease the autophosphorylation of CaMKIIα (Sumi et al., 1991). As predicted, no significant change in CaMKIIα phosphorylation or CaMKIIα expression was observed after three-day treatment with 2μM KN92 (Fig. 3A). However, 2μM KN93 decreased Thr286 phosphorylation of CaMKIIα but left CaMKIIα expression unchanged (Fig. 3A). The two inhibitors had no effects on NeuroD and miR-190 levels (Fig 3A and B). However, KN93, but not KN92, decreased NeuroD activity as indicated by NeuroD phosphorylation and the mRNA levels of four NeuroD targets (Fig. 3A and C). Thus, NeuroD activity can be altered by modulating CaMKIIα activity without changes in NeuroD expression.
Fig. 3. NeuroD activity correlates with its phosphorylation by CaMKIIα.

Primary cultures were treated with PBS (control), KN92 (2μM), KN93 (2μM) or KN93 (2μM) & nd-vir for three days.
(A) The amount of phosphorylated NeuroD, total NeuroD, total CaMKIIα, phosphorylated CaMKIIα, total ERK and β-actin were determined as in Fig. 1A.
(B) The levels of miR-190 and NeuroD mRNA were measured by real-time PCR.
(C) The mRNA levels of DCX, ND4, Notch1 and Robo1 were determined with real-time PCR. The results (A–C) were normalized against those in control samples.
NeuroD over-expression, however, was able to reverse the KN93-induced decrease in NeuroD activity. In the primary hippocampal neuron cultures infected with nd-vir and treated with KN93, decrease in CaMKIIα phosphorylation was observed (Fig 3A). However, due to the nd-vir-mediated increase in NeuroD, the amount of NeuroD being phosphorylated and mRNA levels of the four NeuroD targets in these primary neuron cultures were not significantly different from those observed in control primary neuron cultures (Fig 3A and C). Therefore, NeuroD activity can be maintained even when CaMKIIα is inhibited.
NeuroD activity is involved in maintaining dendritic spine stability
Prior to examining the relationship between NeuroD activity and dendritic spine stability, we monitored dendritic morphology and spine density of the primary hippocampal neuron cultures under control conditions. DsRed in pRK5 vector was transfected into primary rat hippocampal neuron cultures one week after plating. Two weeks after transfection, dendritic spines were monitored for three days. As shown in Fig. 4A and B, the formation of new spines [0.4±0.2 spine/0.1mm (n=8)] and the collapse of existing spines [0.5±0.2 spine/0.1mm dendrite (n=8)] were not significant during a three-day treatment with PBS. The density of dendritic spine was determined to be 41±2 spine/0.1mm dendrite (n=8) and 41±4 spine/0.1mm dendrite (n=8) on Day 0 and Day3, respectively (Fig. 4C). Overall volume of dendritic spines was measured by determining DsRed fluorescence intensity. Overall volume of dendritic spines was constant during the three days, and the spine volume on Day 3 is 102±5 % of that on Day 0. In addition, the spines were stable during the three-day treatment. Only 5% spines [2.7±0.9 spine/0.1mm dendrite, (n=8)] shrank by more than 20%, and only 6% spines [2.3±0.7 spine/0.1mm dendrite, (n=8)] enlarged by more than 20%.
Fig. 4. Spine collapse and new spine formation during control PBS treatment.

Primary cultures from rat hippocampal neurons were treated with PBS (control) three days. Live-cell images on Day 0 (A) and Day 3 (B) of a representative neuron were presented. Spine densities on Day 0 and Day 3, the numbers of spines that collapsed, newly formed, shrank or enlarged during three days were also summarized in (C).
The effects of various treatments on dendritic spine stability were then examined. As shown in Fig. 5A, successful infection of primary cultures with con-vir or 190-vir was represented by the fluorescence of EGFP, while the fluorescence of ECFP represented the successful infection by nd-vir. In 190-vir-infected primary neuron cultures, spine density decreased from 43 ± 3.2 spine/0.1mm (n=9) on Day 0 to 33±3.1 spine/0.1mm (n=9) on Day 3 (Fig. 5B). A 55±17% (n=9) decrease in spine volume was also observed (Fig. 5C). This loss in spine density and in spine volume suggests a decrease in spine stability, because few new spines formed in control cultures during the three-day treatment (Fig. 4C). The decrease in spine volume appeared larger than that in spine density because some spines only shrank but did not collapse. Similar decrease in spine stability was observed in primary cultures treated with KN93, but not in those treated with con-vir or KN92 (Fig. 5A–C). In addition, spine collapse was not due to the apoptosis of primary neurons, because apoptosis rates in treated primary neuron cultures were not higher than that in the control cultures (Fig. 5D).
Since NeuroD activity was decreased by the treatment with 190-vir or KN93 (Fig 2 and 3), there is a correlation between decreased NeuroD activity and reduced spine stability. To further test this correlation, nd-vir was used to infect primary cultures together with 190-vir or KN93. As shown in Fig. 5A–C, the spine collapse induced by 190-vir and KN93 was restored by nd-vir. However, nd-vir alone did not change spine density or spine volume (Fig. 5A–C), suggesting that the basal NeuroD activity is not limiting for spine formation and that the recovery of spine density/volume is not due to the ability of nd-vir to increase spine density/volume, but due to the ability of nd-vir to restore NeuroD activity.
NeuroD activity mediates the effects of agonists on spine stability
As noted above, morphine decreased, while fentanyl maintained, NeuroD activity (Fig. 1). Meanwhile, morphine has been reported to reduce spine stability, but fentanyl did not affect spine stability (Liao et al., 2005; Liao et al., 2007a). Thus we examined whether morphine decreases spine stability by suppressing NeuroD activity. Although one-day morphine treatment significantly decreases spine stability, the effect of three-day morphine treatment is more pronounced, so the morphology of primary cultures was monitored for three days under opioid treatment (Liao et al., 2005). To determine whether decreased NeuroD activity contributed to the destabilizing effect of morphine on dendritic spines, 190-vir and nd-vir were used simultaneously with OPRM1 agonists to modulate the NeuroD activity.
Consistently with Fig. 1 and a previous report (Zheng et al., 2010b), three-day morphine treatment decreased CaMKIIα phosphorylation and NeuroD activity (both the amount of phosphorylated NeuroD and the mRNA levels of NeuroD targets), but did not alter the expression of miR-190 or NeuroD (Fig. 6). In addition, three-day morphine treatment reduced spine stability (Fig 7A). Spine densities were 43±3.3 spine/0.1mm (n=12) and 33±5.1 spine/0.1mm (n=12) on Day 0 and Day 3, respectively (Fig 7B), and spine volume decreased by 44±18% after three-day morphine treatment (Fig 7C). Thus chronic morphine treatment decreased NeuroD activity and spine stability.
Fig. 6. Overexpressing NeuroD counteracts morphine-induced decrease in NeuroD activity.

Primary cultures were treated with PBS, morphine (1 μM), morphine (1 μM) & nd-vir, fentanyl (10 nM), fentanyl (10 nM) & 190-vir or fentanyl (10 nM) & KN93 for 3days.
(A) The amount of phosphorylated NeuroD, total NeuroD, total CaMKIIα, phosphorylated CaMKIIα, total ERK and β-actin were determined as in Fig. 1A.
(B) The levels of miR-190 and NeuroD mRNA were measured by real-time PCR.
(C) The mRNA levels of DCX, ND4, Notch1 and Robo1 were determined by real-time PCR. The results (in A–C) were normalized against those in control samples.
If morphine decreased spine stability by suppressing NeuroD activity, restoring NeuroD activity should prevent morphine-induced spine collapse. When nd-vir was used to infect primary neurons simultaneously with morphine treatment, the cellular level of NeuroD increased significantly (Fig. 6A). However, NeuroD phosphorylation level and mRNA levels of the four NeuroD targets were close to the basal levels (Fig 6A&C), suggesting that the morphine-induced decrease in NeuroD activity was largely reversed. Moreover, the ability of morphine to reduce spine stability was also impaired (Fig 7A). Spine densities were 41±3.9 spine/0.1mm (n=12) and 39±4.7 spine/0.1mm (n=12) on Day 0 and Day 3, respectively (Fig 7B). In addition, spine volume on Day 3 was 87±12% of that on Day 0 (Fig 7C). Since, restoring NeuroD activity can attenuate the inhibitory effect of morphine on spine stability, this suggests that morphine decreases spine stability by suppressing NeuroD activity.
Fentanyl regulated NeuroD activity via two mechanisms: it reduced NeuroD activation by inhibiting CaMKIIα activity, but it also enhanced NeuroD expression by suppressing miR-190 (Fig. 6). The net result is that fentanyl did not alter the levels of phosphorylated NeuroD and the mRNA of the four NeuroD targets (Fig. 6A and C). In fentanyl-treated primary cultures, spine densities were 40±4.0 spine/0.1mm (n=12) and 40±6 spine/0.1mm (n=12) on Day 0 and Day 3, respectively (Fig 7B). In addition, spine volume on Day 3 was 92±8% of that on Day 0 (Fig 7C). Therefore, fentanyl neither decreased NeuroD activity nor reduced spine stability.
If the NeuroD activity mediated the effects of OPRM1 agonists on spine stability, decreasing NeuroD activity during fentanyl treatment should enable fentanyl to induce spine collapse. Thus 190-vir and KN93 were used along with fentanyl to further explore the relationship between NeuroD activity and dendritic spine stability. When primary hippocampal neuron cultures were infected with 190-vir at the initiation of three-day fentanyl treatment, fentanyl-induced increase in NeuroD cellular level was blocked (Fig 6A and B). In addition, phosphorylated NeuroD (Fig. 6A) and mRNAs of the four NeuroD targets were reduced. In fentanyl & 190-vir-treated primary cultures, spine densities were 41±3.5 spine/0.1mm (n=12) and 31±5.5 spine/0.1mm (n=12) on Day 0 and Day 3, respectively (Fig 7B), and spine volume on Day 3 was 56±12% of that on Day 0 (Fig 7C).
CaMKIIα activity in primary cultures treated with both fentanyl and KN93 was lower than that in primary cultures treated with fentanyl alone (Fig 6A), although KN93 did not alter miR-190 or NeuroD cellular level. The inclusion of this CaMKIIα inhibitor during fentanyl treatment reduced the amount of phosphorylated NeuroD and mRNA levels of the four NeuroD targets (Fig 6C). In primary cultures treated with both fentanyl and KN93, spine densities were 40±3.3 spine/0.1mm (n=12) and 29±4.3 spine/0.1mm (n=12) on Day 0 and Day 3, respectively (Fig 7B), and spine volume on Day 3 was 66±9% of that on Day 0 (Fig 7C). Therefore, decreasing NeuroD activity during fentanyl treatment leads to spine collapse.
Both KN92 and KN93 were dissolved in DMSO. However, the observations with KN93 were not due to vehicle effects, because KN92 which is also dissolved in DMSO did not affect the NeuroD phosphorylation (Fig. 3) and dendritic spine stability (Fig. 5). To assure there is no influence from DMSO, primary cultures were treated with DMSO (0.1% v/v, because KN93 and KN92 used as 1000 ×) for three days. As indicated in Fig. 7, DMSO did not induce significant change in dendritic spine stability or apoptosis. Thus the decrease in spine stability was due to the KN93 inhibition on CaMKIIα activity.
Spine stability is required for OPRM1 signaling
Chronic morphine, but not fentanyl, induces spine collapse (Liao et al., 2005). Morphine also has a higher ability than fentanyl to induce tolerance (Duttaroy and Yoburn, 1995). Thus, we examined whether morphine-induced spine collapse contributes to OPRM1 signaling. In order to minimize the influence of receptor desensitization during agonist treatment, miR-190 and nd-vir were used to mimic the effects of morphine and fentanyl on spine stability.
190-vir and nd-vir were first used to infect primary neurons for three days in order to alter NeuroD activity and dendritic spine stability. Morphine or fentanyl was then added to the cells to determine the signaling capability of OPRM1 by measuring ERK phosphorylation and adenylyl cyclase inhibition (Table 1). Morphine and fentanyl increased ERK phosphorylation to 175±15% and 178±8% respectively of the basal level in control primary cultures. The maximum inhibition of adenylyl cyclase induced by morphine and fentanyl was 30±2.7% and 29±5.1%. When con-vir was used to infect the primary cultures, no significant difference was observed in the signaling capability of OPRM1 (Table 1). However, if NeuroD activity and spine stability were reduced by 190-vir infection, the signaling capability of OPRM1 decreased significantly. Morphine and fentanyl only induced ERK phosphorylation to 125±8% and 128±4% of basal level respectively. The maximum inhibition of adenylyl cyclase was also attenuated by morphine (10±3.1%) and fentanyl (7.7 ± 2.8%). The decreased signaling capability of OPRM1 can be rescued by simultaneously infecting the primary cultures with nd-vir and 190-vir. In these primary cultures, not only the NeuroD activity and spine stability, but also the OPRM1 signaling capability, were close to the control level (Table 1). Therefore, NeuroD activity or spine stability is required for the normal function of OPRM1. By decreasing the activity of NeuroD, chronic morphine treatment may decrease the signaling capability of OPRM1.
Discussion
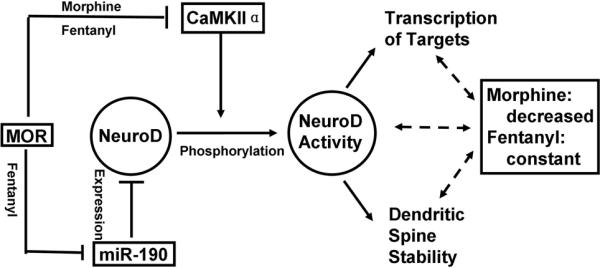
This current study clearly indicates that these two agonists can induce different overall cellular responses by activating the same signaling molecules. As summarized in Fig. 8, both fentanyl and morphine decrease NeuroD phosphorylation by inhibiting CaMKIIα activity. However, fentanyl, but not morphine, increases the cellular NeuroD content by decreasing miR-190 level. These two effects cross-talk with each other and result in the different modulations on NeuroD activity. Therefore morphine decreases NeuroD activity, while fentanyl maintains NeuroD activity. Since NeuroD activity appears to be required for the maintenance of dendritic spine stability by decreasing NeuroD activity, morphine reduces spine stability while fentanyl does not.
Fig. 8. Schematic summary of agonist-dependent regulation on NeuroD activity.
To achieve maximum effect, the concentrations (1 μM morphine and 10 nM fentanyl) and treatment time (three-day treatment) used in the current study were determined based on the previous reports (Liao et al., 2005; Zheng et al., 2010b). Therefore, although only one concentration for each agonist and one treatment time were tested, current observations still reflect the effects of OPRM1 agonists on NeuroD activity and spine stability.
Both miR-190 and CaMKIIα have other targets in addition to NeuroD. However, their abilities to influence dendritic spine stability are primarily mediated by NeuroD, since over-expressing NeuroD in primary hippocampal neuron cultures by nd-vir infection attenuated the inhibitory effects of miR-190 and KN93 on spine stability (Fig. 2–4). These abilities of CaMKIIα and NeuroD to regulate spine stability correlate with their reported functions. CaMKIIα is essential for synaptic transmission and dendritic morphology (Colbran and Brown, 2004), and its phosphorylation is associated with microtubule stabilization and dendrite formation (Vaillant et al., 2002). NeuroD is also implicated in the control of dendritic morphology (Gaudilliere et al., 2004), and it regulates a vast number of genes, some of which play critical roles in the CNS (Seo et al., 2007). Although the mechanism of how NeuroD activity contributes to the maintenance of spine stability requires further investigation, the ability of NeuroD to function as transcription activator is clearly critical. Two of the four NeuroD targets investigated in the current studies, DCX and Notch1, may control adult neurogenesis. DCX is an important transcription factor involved in the migration and differentiation processes during adult neurogenesis (von Bohlen Und Halbach, 2007). Notch1 signaling is critical for dendrite morphology of newborn neurons in the postnatal dentate gyrus (Breunig et al., 2007). Since formation of functional dendritic spine contributes to adult neurogenesis, NeuroD may regulate dendritic spine stability via these two factors. NeuroD also controls the transcription of postsynaptic EPH receptor B1 and B2 (Seo et al., 2007), whose interactions with presynaptic ephrins are critical for the formation and stabilization of dendritic spines (Kayser et al., 2008). In addition, NeuroD controls the formation of the endocrine system (Chae et al., 2004), which is another possible route for NeuroD to affect spine stability.
Fentanyl decreases the level of miR-190, which depends on β-arrestin-mediated ERK phosphorylation and nucleus translocation of the phosphorylated ERK. Because morphine uses the PKC-pathway for ERK phosphorylation and retains phosphorylated ERK in the cytosol, it does not regulate miR-190 level (Zheng et al., 2008b; Zheng et al., 2008a; Zheng et al., 2010b). This current study provides more information on agonist-dependent signaling. Both morphine and fentanyl decrease CaMKIIα activity, but they regulate NeuroD activity differentially (Fig. 8). This interaction among multiple signaling events constitutes a complex network of agonist-dependent signaling. These observations further support our hypothesis that agonist-dependent regulation of gene expression (e.g. miR-190) links agonists-dependent signaling (e.g. ERK phosphorylation) to the agonist-dependent response (e.g. changes in NeuroD activity and spine stability) (Zheng et al., 2008a, , 2010a).
The different abilities of agonists to influence spine stability have been attributed to the different levels of receptor internalization induced by agonists, because blocking OPRM1 internalization with a dominant-negative Dynamin I (K44E) enables fentanyl to decrease the stability of dendritic spines (Lin et al., 2009). How OPRM1 internalization contributes to spine stability is uncertain, but this study provides a probable explanation. Blocking receptor internalization with K44E maintains β-arrestin on the cell surface membrane (Gaborik et al., 2001; Schafer, 2004). Fentanyl-induced decreases in miR-190 level are dependent on β-arrestin-mediated ERK phosphorylation and the nucleus translocation of phosphorylated ERK (Zheng et al., 2008a; Zheng et al., 2010b). Because of the ability of β-arrestin to scaffold ERK, to translocate into nucleus, and to activate transcription (Ma and Pei, 2007; Violin and Lefkowitz, 2007), β-arrestin retained at the cell surface membrane could impair the ability of fentanyl to decrease miR-190 expression. Consequently, without the observed increase in the NeuroD level, CaMKIIα inhibition by fentanyl will decrease NeuroD activity. Hence, when receptor internalization is blocked, fentanyl may function like morphine to decreases NeuroD activity and subsequent spine stability.
Morphine, but not fentanyl, decreased NeuroD activity and spine stability. If the decreased NeuroD activity and spine stability was mimicked by 190-vir infection, a significant decrease in OPRM1 signaling capability was observed (Table 1). These data imply that chronic morphine, but not fentanyl, treatment can decrease the signaling capability or responsibility of OPRM1, which may explain why morphine induces higher tolerance than does fentanyl.
We have demonstrated the abilities of OPRM1 agonists to regulate NeuroD activity and subsequent dendritic spine stability. Morphine treatment delays the growth of cortical dendrites (Ricalde and Hammer, 1990; Mei et al., 2009). Morphine injection decreases the dendritic spine density in the hippocampus and nucleus accumbens (Robinson et al., 2002; Diana et al., 2006). Although the effects of other opioids on spine stability have not been reported in vivo, it is still reasonable to suggest that the signaling cascade identified in the current study also has similar functions in vivo and may contribute to regulatory effects of opioids on dendrite morphology. Since NeuroD plays critical roles in regulating adult neurogenesis (von Bohlen Und Halbach, 2007), OPRM1-mediated regulation of NeuroD activity may also contribute to the adult neurogenesis. Chronic morphine has been reported to decrease the rate of adult neurogenesis in dentate gyrus (Eisch et al., 2000). In addition, the hippocampus is highly related to learning and memory processes. By targeting NeuroD activity and spine stability, OPRM1 agonists may regulate the functions of the hippocampus in learning and memory that have been reported previously (Pu et al., 2002; Bao et al., 2007).
Acknowledgement
We thank Dr. Liao Dezhi (University of Minnesota) for advice on preparing primary cultures, and Dr. David L. Turner (University of Michigan) for NeuroD cDNA. The research was supported by National Institutes of Health grants DA007339, DA016674, DA000564 and DA011806. H.H.L. and P.Y.L. are recipients of K05-DA70544 and K05-DA00513, respectively.
References
- Bao G, Kang L, Li H, Li Y, Pu L, Xia P, Ma L, Pei G. Morphine and heroin differentially modulate in vivo hippocampal LTP in opiate-dependent rat. Neuropsychopharmacology. 2007;32:1738–1749. doi: 10.1038/sj.npp.1301308. [DOI] [PubMed] [Google Scholar]
- Breunig JJ, Silbereis J, Vaccarino FM, Sestan N, Rakic P. Notch regulates cell fate and dendrite morphology of newborn neurons in the postnatal dentate gyrus. Proc Natl Acad Sci U S A. 2007;104:20558–20563. doi: 10.1073/pnas.0710156104. [DOI] [PMC free article] [PubMed] [Google Scholar]
- Chae JH, Stein GH, Lee JE. NeuroD: the predicted and the surprising. Mol Cells. 2004;18:271–288. [PubMed] [Google Scholar]
- Chen Y, Mestek A, Liu J, Yu L. Molecular cloning of a rat kappa opioid receptor reveals sequence similarities to the mu and delta opioid receptors. Biochem J. 1993;295(Pt 3):625–628. doi: 10.1042/bj2950625. [DOI] [PMC free article] [PubMed] [Google Scholar]
- Cho JH, Tsai MJ. The role of BETA2/NeuroD1 in the development of the nervous system. Mol Neurobiol. 2004;30:35–47. doi: 10.1385/MN:30:1:035. [DOI] [PubMed] [Google Scholar]
- Colbran RJ, Brown AM. Calcium/calmodulin-dependent protein kinase II and synaptic plasticity. Curr Opin Neurobiol. 2004;14:318–327. doi: 10.1016/j.conb.2004.05.008. [DOI] [PubMed] [Google Scholar]
- Diana M, Spiga S, Acquas E. Persistent and reversible morphine withdrawal-induced morphological changes in the nucleus accumbens. Ann N Y Acad Sci. 2006;1074:446–457. doi: 10.1196/annals.1369.045. [DOI] [PubMed] [Google Scholar]
- Duttaroy A, Yoburn BC. The effect of intrinsic efficacy on opioid tolerance. Anesthesiology. 1995;82:1226–1236. doi: 10.1097/00000542-199505000-00018. [DOI] [PubMed] [Google Scholar]
- Eisch AJ, Barrot M, Schad CA, Self DW, Nestler EJ. Opiates inhibit neurogenesis in the adult rat hippocampus. Proc Natl Acad Sci U S A. 2000;97:7579–7584. doi: 10.1073/pnas.120552597. [DOI] [PMC free article] [PubMed] [Google Scholar]
- Gaborik Z, Szaszak M, Szidonya L, Balla B, Paku S, Catt KJ, Clark AJ, Hunyady L. Beta-arrestin- and dynamin-dependent endocytosis of the AT1 angiotensin receptor. Mol Pharmacol. 2001;59:239–247. doi: 10.1124/mol.59.2.239. [DOI] [PubMed] [Google Scholar]
- Gaudilliere B, Konishi Y, de la Iglesia N, Yao G, Bonni A. A CaMKII-NeuroD signaling pathway specifies dendritic morphogenesis. Neuron. 2004;41:229–241. doi: 10.1016/s0896-6273(03)00841-9. [DOI] [PubMed] [Google Scholar]
- Kayser MS, Nolt MJ, Dalva MB. EphB receptors couple dendritic filopodia motility to synapse formation. Neuron. 2008;59:56–69. doi: 10.1016/j.neuron.2008.05.007. [DOI] [PMC free article] [PubMed] [Google Scholar]
- Liao D, Lin H, Law PY, Loh HH. Mu-opioid receptors modulate the stability of dendritic spines. Proc Natl Acad Sci U S A. 2005;102:1725–1730. doi: 10.1073/pnas.0406797102. [DOI] [PMC free article] [PubMed] [Google Scholar]
- Liao D, Grigoriants OO, Loh HH, Law PY. Agonist-dependent postsynaptic effects of opioids on miniature excitatory postsynaptic currents in cultured hippocampal neurons. J Neurophysiol. 2007a;97:1485–1494. doi: 10.1152/jn.00790.2006. [DOI] [PMC free article] [PubMed] [Google Scholar]
- Liao D, Grigoriants OO, Wang W, Wiens K, Loh HH, Law PY. Distinct effects of individual opioids on the morphology of spines depend upon the internalization of mu opioid receptors. Mol Cell Neurosci. 2007b;35:456–469. doi: 10.1016/j.mcn.2007.04.007. [DOI] [PMC free article] [PubMed] [Google Scholar]
- Lin H, Higgins P, Loh HH, Law PY, Liao D. Bidirectional Effects of Fentanyl on Dendritic Spines and AMPA Receptors Depend Upon the Internalization of Mu Opioid Receptors. Neuropsychopharmacology. 2009 doi: 10.1038/npp.2009.34. [DOI] [PMC free article] [PubMed] [Google Scholar]
- Lou L, Zhou T, Wang P, Pei G. Modulation of Ca2+/calmodulin-dependent protein kinase II activity by acute and chronic morphine administration in rat hippocampus: differential regulation of alpha and beta isoforms. Mol Pharmacol. 1999;55:557–563. [PubMed] [Google Scholar]
- Ma L, Pei G. beta-arrestin signaling and regulation of transcription. J Cell Sci. 2007;120:213–218. doi: 10.1242/jcs.03338. [DOI] [PubMed] [Google Scholar]
- Mei B, Niu L, Cao B, Huang D, Zhou Y. Prenatal morphine exposure alters the layer II/III pyramidal neurons morphology in lateral secondary visual cortex of juvenile rats. Synapse. 2009;63:1154–1161. doi: 10.1002/syn.20694. [DOI] [PubMed] [Google Scholar]
- Pratt KG, Watt AJ, Griffith LC, Nelson SB, Turrigiano GG. Activity-dependent remodeling of presynaptic inputs by postsynaptic expression of activated CaMKII. Neuron. 2003;39:269–281. doi: 10.1016/s0896-6273(03)00422-7. [DOI] [PubMed] [Google Scholar]
- Pu L, Bao GB, Xu NJ, Ma L, Pei G. Hippocampal long-term potentiation is reduced by chronic opiate treatment and can be restored by re-exposure to opiates. J Neurosci. 2002;22:1914–1921. doi: 10.1523/JNEUROSCI.22-05-01914.2002. [DOI] [PMC free article] [PubMed] [Google Scholar]
- Ricalde AA, Hammer RP., Jr. Perinatal opiate treatment delays growth of cortical dendrites. Neurosci Lett. 1990;115:137–143. doi: 10.1016/0304-3940(90)90444-e. [DOI] [PubMed] [Google Scholar]
- Robinson TE, Gorny G, Savage VR, Kolb B. Widespread but regionally specific effects of experimenter- versus self-administered morphine on dendritic spines in the nucleus accumbens, hippocampus, and neocortex of adult rats. Synapse. 2002;46:271–279. doi: 10.1002/syn.10146. [DOI] [PubMed] [Google Scholar]
- Schafer DA. Regulating actin dynamics at membranes: a focus on dynamin. Traffic. 2004;5:463–469. doi: 10.1111/j.1600-0854.2004.00199.x. [DOI] [PubMed] [Google Scholar]
- Seo S, Lim JW, Yellajoshyula D, Chang LW, Kroll KL. Neurogenin and NeuroD direct transcriptional targets and their regulatory enhancers. Embo J. 2007;26:5093–5108. doi: 10.1038/sj.emboj.7601923. [DOI] [PMC free article] [PubMed] [Google Scholar]
- Sumi M, Kiuchi K, Ishikawa T, Ishii A, Hagiwara M, Nagatsu T, Hidaka H. The newly synthesized selective Ca2+/calmodulin dependent protein kinase II inhibitor KN-93 reduces dopamine contents in PC12h cells. Biochem Biophys Res Commun. 1991;181:968–975. doi: 10.1016/0006-291x(91)92031-e. [DOI] [PubMed] [Google Scholar]
- Vaillant AR, Zanassi P, Walsh GS, Aumont A, Alonso A, Miller FD. Signaling mechanisms underlying reversible, activity-dependent dendrite formation. Neuron. 2002;34:985–998. doi: 10.1016/s0896-6273(02)00717-1. [DOI] [PubMed] [Google Scholar]
- Violin JD, Lefkowitz RJ. Beta-arrestin-biased ligands at seven-transmembrane receptors. Trends Pharmacol Sci. 2007;28:416–422. doi: 10.1016/j.tips.2007.06.006. [DOI] [PubMed] [Google Scholar]
- von Bohlen Und Halbach O. Immunohistological markers for staging neurogenesis in adult hippocampus. Cell Tissue Res. 2007;329:409–420. doi: 10.1007/s00441-007-0432-4. [DOI] [PubMed] [Google Scholar]
- Wayman GA, Lee YS, Tokumitsu H, Silva A, Soderling TR. Calmodulin-kinases: modulators of neuronal development and plasticity. Neuron. 2008;59:914–931. doi: 10.1016/j.neuron.2008.08.021. [DOI] [PMC free article] [PubMed] [Google Scholar]
- Zhao H, Loh HH, Law PY. Adenylyl cyclase superactivation induced by long-term treatment with opioid agonist is dependent on receptor localized within lipid rafts and is independent of receptor internalization. Mol Pharmacol. 2006;69:1421–1432. doi: 10.1124/mol.105.020024. [DOI] [PubMed] [Google Scholar]
- Zheng H, Loh HH, Law PY. {beta}-Arrestin-Dependent {micro}-Opioid Receptor-Activated Extracellular Signal-Regulated Kinases (ERKs) Translocate to Nucleus in Contrast to G Protein-Dependent ERK Activation. Mol Pharmacol. 2008a;73:178–190. doi: 10.1124/mol.107.039842. [DOI] [PMC free article] [PubMed] [Google Scholar]
- Zheng H, Loh HH, Law PY. Agonist-selective signaling of G protein-coupled receptor: Mechanisms and implications. IUBMB Life. 2010a;62:112–119. doi: 10.1002/iub.293. [DOI] [PMC free article] [PubMed] [Google Scholar]
- Zheng H, Chu J, Qiu Y, Loh HH, Law PY. Agonist-selective signaling is determined by the receptor location within the membrane domains. Proc Natl Acad Sci U S A. 2008b;105:9421–9426. doi: 10.1073/pnas.0802253105. [DOI] [PMC free article] [PubMed] [Google Scholar]
- Zheng H, Zeng Y, Zhang X, Chu J, Loh HH, Law PY. {micro}-Opioid Receptor Agonists Differentially Regulate the Expression of miR-190 and NeuroD. Mol Pharmacol. 2010b;77:102–109. doi: 10.1124/mol.109.060848. [DOI] [PMC free article] [PubMed] [Google Scholar]