

Abstract
Right ventricular (RV) failure is associated with poor outcomes in pulmonary hypertension (PH). We sought to phenotype the RV in PH patients with compensated and decompensated RV function by quantifying regional and global RV structural and functional changes. Twenty-two patients (age 51 ± 11, 14 females, mean pulmonary artery (PA) pressure range 13–79 mmHg) underwent right heart catheterization, echocardiography, and ECG-gated multislice computed tomography of the chest. Patients were divided into three groups: Normal, PH with hemodynamically compensated, and decompensated RV function (PH-C and PH-D, respectively). RV wall thickness (WT) was measured at end-diastole (ED) and end-systole (ES) in three regions: infundibulum, lateral free wall, and inferior free wall. Globally, RV volumes progressively increased from Normal to PH-C to PH-D and RV ejection fraction decreased. Regionally, WT increased and fractional wall thickening (FWT) decreased in a spatially heterogeneous manner. Infundibular wall stress was elevated and FWT was lower regardless of the status of global RV function. In PH, there are significant phenotypic abnormalities in the RV even in the absence of overt hemodynamic RV decompensation. Regional changes in RV structure and function may be early markers of patients at risk for developing RV failure.
Keywords: heart failure, pulmonary hypertension, pulmonary heart disease, remodeling
Introduction
Characterization of right ventricular (RV) function is essential for assessing prognosis and in the selection and monitoring of therapeutic intervention in pulmonary hypertension (PH).1 However, current markers of RV failure that have been associated with poor outcomes only recognize end-stage disease. The RV remodeling process preceding ventricular failure in PH has yet to be phenotyped, due to limitations of current methods of evaluating RV function. Given the unique 3D structure of the RV, regional assessment may be of value in understanding the mechanics of response to chronic pressure overload.
We evaluated RV structure and function with a novel method, electrocardiogram (ECG)-gated multislice computed tomography (MSCT), which is of sufficient spatial resolution to image the normally thin RV wall2–4 while also taking into account the complex 3D structure, with the goal of providing insight into the phenotype of RV adaptation to pressure overload. Regional RV structure and function were quantified in three groups of patients: Normal, PH with hemodynamically compensated, or decompensated RV function (PH-C and PH-D, respectively).
Methods
Study setting
Patients referred to the University of Pittsburgh Pulmonary Hypertension Program and undergoing right heart catheterization for evaluation of PH were eligible for enrollment in this prospective study. The protocol was approved by the University of Pittsburgh Institutional Review Board and all patients signed written informed consent. Inclusion criteria were: (1) age ≥18 years; (2) clinically indicated right heart catheterization, transthoracic echocardiogram, and MSCT of the chest for the evaluation of known or suspected PH as is standard of care at our institution. Exclusion criteria were: (1) international normalized ratio >1.6; (2) platelet count <50,000; (3) unable to lay flat for procedures; (4) known allergy to intravenous contrast; (5) serum creatinine greater than 2.0; and (6) known arrhythmia precluding adequate gating for MSCT.
At the time of study enrollment, patients were divided into one of three groups based upon hemodynamic parameters: Normal (normal pulmonary artery [PA] pressure, defined as mean PA pressure ≤25 mmHg), PH-C (PH with hemodynamically compensated RV function, defined as mean PA pressure >25 mmHg and right atrial [RA] pressure <10 mmHg), PH-D (PH with hemodynamically decompensated RV function, defined as mean PA pressure ≥25 mmHg, and RA pressure ≥10 mmHg5). There were no patients with mean PA pressure ≤25 mmHg and RA pressure ≥10 mmHg.
Gated cardiac MSCT
Image acquisition was supervised by any of three experienced cardiac radiologists (JL, CD, and OG) blinded to the patients’ other data. The majority of patients were scanned on a GE Lightspeed 16-slice scanner (n = 13); however, as scanner technology evolved, the remainder (n = 9) were scanned on a GE VCT 64-slice scanner (General Electric Healthcare; Milwaukee, WI, USA).
β-Blockade for MSCT imaging
Patients were given β-blockers to achieve an optimal scanning heart rate of less than 70 bpm (50 mg metoprolol 30 min prior to scanning). MSCT imaging was performed regardless of whether or not β-blockers were given. β-blockers were withheld for any of the following: prior adverse reaction to β-blocker, bronchospastic disease, or high degree atrioventricular block. Additionally, hemodynamic criteria were developed for the administration of β-blockers to PH patients: RA pressure ≤12 mmHg, cardiac index ≥2.0 L/min/m2, PA systolic pressure <120 mmHg or mean PA pressure <80 mmHg.
MSCT scanning protocol
Intravenous contrast was timed for the main PA utilizing test bolus technique and a dual barrel power injector (Stellant-D, MEDRAD Inc, Pittsburgh, PA, USA). A test bolus (15 cc Visipaque 320 [Iodixanol, GE Healthcare, Milwaukee, WI, USA], 30 cc saline flush at 4–5 cc/sec) was followed by the scanning bolus (50–60 cc Visipaque, 50 cc mix of 30% Visipaque/70% saline, 50 cc saline flush at 4–5 cc/sec). Helical, retrospective ECG-gated images were obtained through the chest from diaphragm to lung apices during a single breath hold. Scan parameters were: kV 120; mA approximately 400 without ECG-dose modulation; rotation time 350 msec; pitch dependent on heart rate; 1.25 mm slice thickness (for 16 detector scanner); kV 120, mA approximately 500 with ECG-dose modulation adjusted to peak at 65–80% R-R interval; rotation time 350 msec; pitch dependent on heart rate; 0.625 mm slice thickness (for 64 detector scanner).
MSCT post-processing
Axial source images were reconstructed on a GE ADW workstation with version 4.3 software (General Electric Healthcare, Milwaukee, WI, USA) in 1.25 mm thick slices from 5% to 95% of the ECG R-R interval in 10% increments. RV function was measured utilizing standard summation of slab volume technique as has been used in evaluating left ventricular volumes. The endoluminal borders of the RV in each slice were manually traced from apex to the tricuspid valve plane in both end-systole (ES) and end-diastole (ED). The RV outflow tract region was included to the level of the pulmonic valve. Wall thicknesses were measured in the short axis modified to view the RV outflow tract (infundibulum) in ES and ED. Regional wall thicknesses were measured at the infundibulum, lateral RV free wall, and inferior free wall. Regional wall fractional thickening was calculated as the difference between end-systolic and end-diastolic wall thicknesses divided by the end-diastolic wall thickness (WT).
Transthoracic echocardiography
Echocardiography was performed with a GE-Vingmed Vivid 7 system (GE Vingmed Ultrasound, Horten, Norway). Standard 2D views, pulsed and continuous wave Doppler measurements were obtained as per current recommendations.6,7 RV end-diastolic area (RVEDA) and RV end-systolic area (RVEDA) were measured from the apical 4-chamber view to calculate RV fractional area change [RVFAC = (RVEDA − RVESA)/RVEDA) × 100].8
Infundibular wall stress
Infundibular end-systolic wall stress was calculated according to the law of LaPlace, assuming the geometry of the RV outflow tract to be a thin-walled tube to yield the equation: σ = Pr/h, where P is the RV systolic pressure, r is the radius of the RV outflow tract, and h is the end-systolic WT of the infundibulum.
Statistics
Correlation coefficients between various parameters from MSCT, echocardiography, and right heart catheterization were calculated. Between group differences were calculated using one-way ANOVA with a Tukey post hoc analysis for normally distributed variables and the Kruskall–Wallis nonparametric test for independent samples with a Dunn post hoc analysis for non-normally distributed variables. All statistical calculations were made using SPSS for Windows, version 14 (SPSS, Inc., Chicago, IL, USA).
Results
Patient characteristics
Six patients had normal PA pressures. Etiology of PH in the remaining 16 patients was idiopathic pulmonary fibrosis (n = 5), sarcoidosis (n = 3), connective tissue disease (n = 3), familial (n = 1), thromboembolic disease (n = 2), portopulmonary hypertension (n = 1), and idiopathic (n = 1). Patients with PH had greater mean PA pressure, transpulmonary gradient, and pulmonary vascular resistance (48 ± 18 vs. 19 ± 4 mmHg; 38 ± 19 vs. 8 ± 3 mmHg; 10.8 ± 7.4 vs. 1.4 ± 0.5 Woods units; respectively, all p < 0.001). Characteristics of the three groups as defined by mean PA pressure and RA pressure at study entry (Normal, PH-C, and PH-D, as defined above) are presented in Table 1. There was a stepwise decrease in functional status, as measured by 6-minute walking distance or WHO classification, and hemodynamics over the three groups. PH-D subjects had a significantly longer duration of disease and higher PA pressures indicative of more severe PH than PH-C subjects.
Table 1.
Patient characteristics of the three groups.
| Normal | PH-C | PH-D | p | |
|---|---|---|---|---|
| N | 6 | 8 | 8 | |
| Demographics | ||||
| Age (years) | 46 ± 8 | 54 ± 11 | 51 ± 12 | NS |
| Female gender | 5 (83%) | 4 (50%) | 5 (63%) | NS |
| Length of disease (months) | NA | 6 ± 8 | 22 ± 25 | 0.04 |
| WHO class | 1.8 ± 0.8 | 2.3 ± 0.9 | 3.1 ± 0.8* | 0.03 |
| 6-min walking distance (meters) | 413 ± 56 | 333 ± 87 | 196 ± 118*† | 0.004 |
| Hemodynamics | ||||
| Heart rate (bpm) | 68 ± 7 | 71 ± 13 | 88 ± 10*† | 0.01 |
| RA pressure (mmHg) | 7 ± 2 | 5 ± 3 | 15 ± 3*† | <0.001 |
| RV systolic pressure (mmHg) | 28 ± 4 | 57 ± 20* | 94 ± 22*† | <0.001 |
| Mean PA pressure (mmHg) | 19 ± 4 | 34 ± 11* | 62 ± 12*† | <0.001 |
| PCWP (mmHg) | 11 ± 3 | 9 ± 4 | 10 ± 3 | NS |
| TPG (mmHg) | 9 ± 4 | 26 ± 15* | 52 ± 15*† | <0.001 |
| PVR (Wood units) | 1.4 ± 0.5 | 5.8 ± 4.4* | 15.8 ± 6.4*† | <0.001 |
| PA saturation (%) | 75 ± 5 | 70 ± 7 | 57 ± 7*† | <0.001 |
| Cardiac Index (L/min/m2) | 3.5 ± 1.1 | 2.7 ± 0.5 | 1.8 ± 0.2*† | <0.001 |
| RVSWI (g-m/m2) | 8.5 ± 2.5 | 14.5 ± 5.3* | 12.8 ± 2.5* | 0.03 |
| Echocardiography measures | ||||
| Estimated LVEF (%) | 60 ± 0 | 60 ± 3 | 59 ± 7 | NS |
| Estimated TR severity | 1.5 ± 1.3 | 1.4 ± 0.8 | 2.1 ± 1.0 | NS |
| RV FAC | 0.52 ± 0.12 | 0.31 ± 0.08 | 0.19 ± 0.04*† | <0.001 |
| Blood chemistry | ||||
| Serum sodium (mEq/L) | 141 ± 2 | 141 ± 2 | 141 ± 2 | NS |
| BUN (mg/dL) | 13 ± 2 | 16 ± 6 | 23 ± 10* | 0.03 |
| Serum creatinine (mg/dL) | 0.7 ± 0.1 | 1.0 ± 0.4 | 1.2 ± 0.2* | 0.01 |
| BNP (pg/mL) | 17 ± 15 | 169 ± 249 | 1012 ± 1228* | 0.01 |
WHO, World Health Organization; PH, pulmonary hypertension; RA, right atrial; PA, pulmonary artery; PCWP, pulmonary capillary wedge pressure; TPG, transpulmonary gradient; PVR, pulmonary vascular resistance; RVSWI, right ventricular stroke work index; LVEF, left ventricular ejection fraction; TR, tricuspid regurgitation; RV FAC, right ventricular fractional area change; BUN, blood urea nitrogen; BNP, brain naturetic peptide; and NS, not significant. Data are mean ± standard deviation.
p < 0.05 PH-C versus Normal or PH-D versus Normal;
p< 0.05 PH-D versus PH-C.
Many patients were not given β-blockers (n = 7) based upon the hemodynamic criteria we established. Despite this, average resting heart rate for MSCT scanning was 76 ± 14 bpm (range 53–98 bpm) and the RV MSCT protocol yielded images capable of being analyzed for RV function in all subjects, regardless of heart rate. Representative multiplanar reformatted images are shown in Figure 1. RV ejection fraction (EF) calculated by MSCT correlated well with RV FAC calculated by 2D echo (R2 = 0.66, p < 0.001).
Figure 1. Representative RV short axis reformatted views in end-diastole (A and C) and end-systole (B and D) from the RV MSCT protocol comparing a patient with normal PA pressure (A and B) and a patient with PH (C and D).
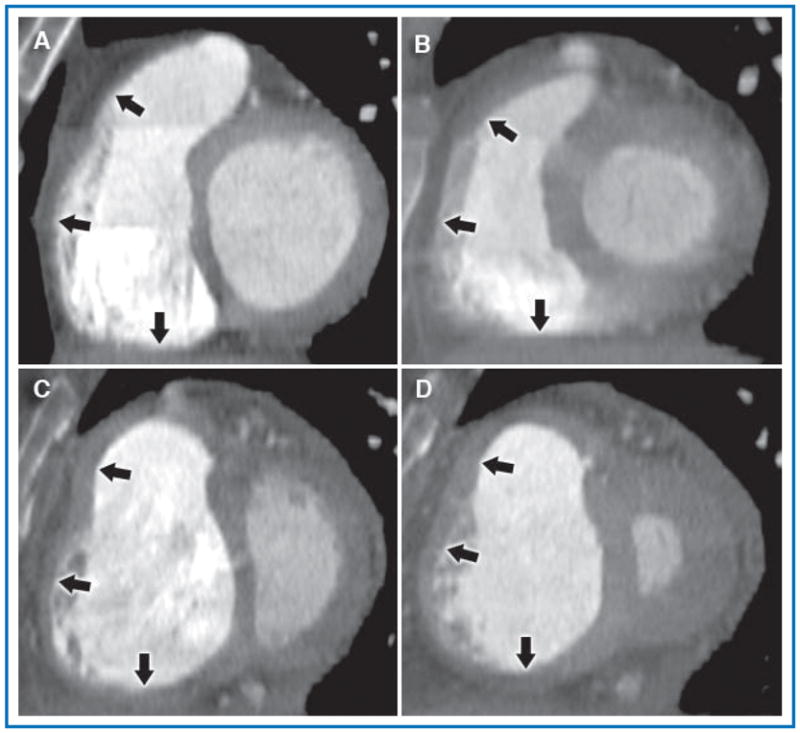
The normal patient had a calculated RV FAC = 0.72, RA pressure 4 mmHg, mean PA pressure 17 mmHg, and cardiac index 4.9 L/min. The patient depicted in the lower panels had severe idiopathic pulmonary arterial hypertension and had a calculated RV FAC = 0.18, RA pressure 10 mmHg, mean PA pressure 75 mmHg, and cardiac index 1.8 L/min. In both patients, the RV cavity is well opacified and borders are easily defined. In the PH patient, also note septal flattening and the dilated RV with hypertrophied free wall and prominent trabeculations, findings not seen in the normal patient. Arrows, top to bottom, indicate the three measured regions of the RV wall (infundibulum, free wall, and inferior wall, respectively).
Global RV and LV function
MSCT data across the three groups (Table 2) showed a stepwise increase in RV end-systolic volume and decrease in RV EF and RV stroke volume. LV volumes decreased across groups with preserved LV EF. The ratio of RV end-diastolic volume to LV end-diastolic volume increased across groups and negatively correlated with RV FAC (R2 = 0.57, p = 0.0002). Inferior vena cava cross-sectional area increased only in PH-D (526 ± 105, 526 ± 165, 799 ± 170 mm2 for Normal, PH-C, and PH-D, respectively; p < 0.05 for PH-C vs. PH-D), consistent with an increased right-sided filling pressure. Thus, these patients have isolated RV dilation and dysfunction causing impaired LV filling via ventricular interdependence.
Table 2.
MSCT-derived global right and left ventricular measurements for the three groups.
| Normal | PH-C | PH-D | p | |
|---|---|---|---|---|
| N | 6 | 8 | 8 | |
| RV ESV (mL) | 101 ± 49 | 158 ± 54 | 208 ± 79* | 0.02 |
| RV EDV (mL) | 184 ± 65 | 226 ± 63 | 251 ± 82 | NS |
| RV Stroke volume (mL) | 84 ± 30 | 68 ± 27 | 43 ± 15* | 0.02 |
| RV Cardiac output (L/min) | 4.9 ± 2.2 | 4.2 ± 1.5 | 3.6 ± 1.3 | NS |
| RV Ejection fraction (%) | 46 ± 9 | 30 ± 13* | 18 ± 5*† | <0.001 |
| LV EDV (mL) | 141 ± 50 | 112 ± 29 | 74 ± 23*† | 0.007 |
| LV Ejection fraction (%) | 66 ± 6 | 54 ± 15 | 65 ± 13 | NS |
| RVEDV/LVEDV | 1.3 ± 0.2 | 2.1 ± 0.6 | 3.5 ± 1.1*† | 0.001 |
LV, left ventricle; RV, right ventricle; PH, pulmonary hypertension; ESV, end-systolic volume; EDV, end-diastolic volume; ES, end-systolic; ED, end-diastolic; and NS, not significant. Data are mean ± standard deviation.
p < 0.05 PH-C versus Normal or PH-D versus Normal;
p< 0.05 PH-D versus PH-C.
Regional RV structure and function
End-diastolic WT at the infundibulum increased across groups, with a statistically significant difference between Normal and PH-D groups (Figure 2). This was associated with a significant decrease in infundibular wall fractional thickening in PH-C compared to Normal, with no further difference between PH-C and PH-D. Thus, regional RV function at the infundibulum decreased to the same extent in both PH groups, regardless of hemodynamically defined RV function. The lateral RV free wall followed the same trend as the infundibulum. The inferior RV wall had a slightly different pattern of remodeling in which WT was markedly increased in PH-D compared with both PH-C and Normal as opposed to a gradual increase across the three groups. However, this was not associated with any significant changes in fractional wall thickening (FWT).
Figure 2.

(A) Regional RV wall thickness in end-diastole (ED, filled symbols) and end-systole (ES, open symbols). (B) Corresponding fractional wall thickening. *p < 0.05 PH-C versus Normal or PH-D versus Normal; †p < 0.05 PH-D versus PH-C.
Infundibular end-systolic wall stress increased in PH-C compared to Normal (p = 0.02) without change in WT (Figure 3). End-systolic wall stress remained at this elevated level in PH-D in spite of a significant increase in WT. The increased wall stress was a result of increased pressure (Table 1) and infundibular diameter (20 ± 3, 26 ± 5, 29 ± 7 mm, respectively for Normal, PH-C, and PH-D; p = 0.02), although proportionally pressure increased much more than diameter (PH-D RV systolic pressure 236% above Normal compared with 45% for infundibular diameter). Although hypertrophy in PH-D prevented further increase in wall stress, this was not sufficient to normalize it. A cutoff of 11 kPa for wall stress and 6.5 mm for end-systolic WT, as determined by ROC analysis, defined progression of disease in the three cohorts (Figure 3).
Figure 3. Infundibular wall stress versus wall thickness.

Open symbols represent individual patients; filled symbols represent group means with standard error bars. Normal indicates patients with normal pulmonary artery pressure; PH-C, pulmonary hypertension patients with hemodynamically compensated right ventricular function; PH-D, pulmonary hypertension patients with hemodynamically decompensated right ventricular function.
Association between regional and global RV measures of disease progression in PH
Progression of disease from Normal to PH-C to PH-D may be better understood by simultaneously evaluating changes in regional and global indices of RV function. For example, the three groups could be separated on the basis of infundibular wall fractional thickening and RA pressure or cardiac index (Figure 4). While infundibular wall fractional thickening (a regional measure) of 54% distinguished Normal from PH patients (PH-C and PH-D) as determined by ROC analysis (sensitivity 83%, specificity of 81%, AUC = 0.93), the global indices (RA pressure or cardiac index) were abnormal only in more advanced disease (PH-D). Thus, regional RV dysfunction appears to precede hemodynamic decompensation. This finding is paralleled by noninvasively derived measures, such as RV stroke volume index calculated from MSCT, and a cutoff of 35 mL/m2 distinguished advanced disease.
Figure 4. Infundibular wall fractional thickening plotted against hemodynamic measures of right ventricular function.

Open symbols represent individual patients; filled symbols represent group means with standard error bars. (A) Right atrial pressure versus infundibular wall fractional thickening. Right atrial pressure ≥10 mmHg was used to define hemodynamic right ventricular decompensation. Infundibular wall fractional thickening of 54% distinguished patients with normal PA pressure from PH patients (PH-C and PH-D). (B) Cardiac index versus infundibular wall fractional thickening. A cardiac index of 2.0 L/min/m2 distinguished hemodynamically compensated RV function (PH-C) from hemodynamically decompensated RV function (PH-D).
Discussion
There are three main findings of our study. First, there are phenotypic differences in regional RV structure and function occurring in PH even in the absence of hemodynamic RV decompensation. Second, regional RV structural and functional alterations occur heterogeneously and were most pronounced in the infundibulum. Third, as PH progressed and global RV function decompensated, further regional wall hypertrophy was evident throughout the RV that stabilized, but did not normalize, wall stress. The ability to distinguish RV dysfunction prior to frank hemodynamic decompensation would be very useful for therapeutic decision making. These findings are novel and to our knowledge have never been previously reported.
The regional variability in hypertrophy and dysfunction suggests that differential remodeling is most prominent in the infundibulum. Regional differences in RV wall deformation have been reported in a canine study, in which acute occlusion of the PA altered only infundibular deformation.9 Our findings also are consistent with other studies that have demonstrated regional differences in RV function, showing a peristaltoid-like contraction in which the infundibulum contracts last.10,11 Late infundibular activation would expose this segment to higher afterload (wall stress) during active contraction, which might be the mechanism leading to preferentially reduced infundibular regional function regardless of RV filling pressure and global function. Regional wall fractional shortening of the infundibulum may represent an early measure of RV myocardial dysfunction in response to chronic pressure overload prior to hemodynamic compromise.
The degree of elevated infundibular wall stress was maintained constant between PH with compensated and decompensated RV function due to progressive wall remodeling. The longer length of disease in PH-D than PH-C suggests that remodeling is taking place over prolonged exposure to chronically elevated PA pressures. Thus, infundibular wall stress increases prior to wall remodeling, consistent with the concept that wall stress triggers remodeling.12 Our findings further suggest that wall remodeling, though preventing further wall stress increases, is not enough to prevent hemodynamic compromise. Quaife et al. reported elevated wall stress in the mid RV free wall of PH patients compared with normal patients along with elevated RV end-diastolic WT.13 Our findings in the infundibulum generally agree with those of the latter study, however, the PH patients they reported had a mean RA pressure of 8 mmHg and so would largely have fallen into the PH-C group in the present study. Thus, our study adds to these findings by documenting wall stress in PH patients with and without hemodynamically defined RV decompensation. Similarly there is evidence that a reduction in RV wall stress results in a regression of hypertrophy. For example, Moulton et al. showed that RV wall stress and WT decreased in PH patients after lung transplantation.14 More recently, Reesink et al. showed similar results after pulmonary endarterectomy.15
Based on these findings, we propose the following temporal pattern of progressive RV dysfunction due to chronic pressure overload: increased wall stress and decreased FWT associated with regional remodeling occurs before hemodynamic compromise of the RV; the subsequent response to elevated wall stress is hypertrophy which prohibits further increases in wall stress despite a rise in chamber pressure; this response is not enough to prevent eventual hemodynamic compromise of the RV.
Methodological considerations
The small sample size and the experimental design of single point in time measures, in which PH-D is a surrogate for a later time point of disease, limit interpretation. Specifically, PH-D patients were not a subgroup of PH-C patients at a later time point but were entered into their respective study cohort based upon hemodynamic measurements at the time of study enrollment. Sequential imaging of patients is needed to confirm these results. Given that the etiology of PH in the present study was diverse, our findings are likely to be broadly applicable. The relatively small number of patients in this study does not allow separate subgroup analyses. MSCT is limited by radiation exposure, the need for intravenous contrast, and in some cases, β-blockers. Although we used MSCT, any high fidelity RV images would suffice such as the emerging role of magnetic resonance imaging.16 Trabeculated myocardium is more technically difficult to measure and could be a source of error. Acute administration of β-blockers may affect the estimation of ventricle volumes, pressures, and cardiac output.
Conclusions
Patients with different pulmonary and RV filling pressures display significantly different phenotypes. Regional RV remodeling and dysfunction are observable even in the absence of frank hemodynamic RV decompensation, particularly of the infundibulum. Characterization of regional RV remodeling and function in PH may prove useful in therapeutic decision making early in the disease process.
Acknowledgments
We thank James Bost, Ph.D. for statistical advice, Emily Gruendler, RN, BSN for assistance in coordinating the protocol, and Shobhit Madan, M.D. for technical assistance.
Sources of Funding
This work supported in part by the NIH Roadmap Multidisciplinary Clinical Research Career Development Award (KL2 RR024154), NIH grants (HL067181, HL07820), and McGinnis Chair endowment funds.
Footnotes
Disclosures
Dr. Simon reports receiving consulting fees or serving on paid advisory boards for Actelion and Gilead and receiving lecture fees from Actelion and Gilead. Dr. Mathier reports receiving research funding from Actelion, consulting fees or serving on paid advisory boards for Gilead, United Therapeutics and Actelion and receiving lecture fees from United Therapeutics, Actelion, Encysive, and GlaxoSmithKline. Drs. Lacomis and Deible report receiving research funding from MEDRAD Inc. Drs. Shroff, Pinsky, and Goitein have no conflicts of interest to disclose.
References
- 1.D’Alonzo GE, Barst RJ, Ayres SM, Bergofsky EH, Brundage BH, Detre KM, Fishman AP, Goldring RM, Groves BM, Kernis JT, Levy PS, Pietra GG, Reid LM, Reeves JT, Rich S, Vreim CE, Williams GW, Wu M. Survival in patients with primary pulmonary hypertension: results from a national prospective registry. Ann Intern Med. 1991;115:343–349. doi: 10.7326/0003-4819-115-5-343. [DOI] [PubMed] [Google Scholar]
- 2.Carrascosa PM, Capunay CM, Parodi JC, Padilla LT, Johnson P, Carrascosa JM, Chandra S, Smith D, Belardi J. General utilities of multislice tomography in the cardiac field. Herz. 2003;28(1):44–51. doi: 10.1007/s00059-003-2443-6. [DOI] [PubMed] [Google Scholar]
- 3.Dogan H, Kroft LJ, Bax JJ, Schuijf JD, van der Geest RJ, Doornbos J, de Roos A. MDCT assessment of right ventricular systolic function. AJR Am J Roentgenol. 2006;186:S366–S370. doi: 10.2214/AJR.05.0639. [DOI] [PubMed] [Google Scholar]
- 4.Naito H, Kimura M, Ohta M, Kimura K, Takamiya M, Kozuka T. Evaluation of right ventricular wall contractility in ischemic heart disease by cardiac computed tomography. J Cardiogr. 1984;14:15–28. [PubMed] [Google Scholar]
- 5.Sitbon O, Humbert M, Nunes H, Parent F, Garcia G, Herve P, Rainisio M, Simonneau G. Long-term intravenous epoprostenol infusion in primary pulmonary hypertension: prognostic factors and survival. J Am Coll Cardiol. 2002;40:780–788. doi: 10.1016/s0735-1097(02)02012-0. [DOI] [PubMed] [Google Scholar]
- 6.Henry WL, DeMaria A, Gramiak R, King DL, Kisslo JA, Popp RL, Sahn DJ, Schiller NB, Tajik A, Teichholz LE, Weyman AE. Report of the American Society of Echocardiography committee on nomenclature and standards in two-dimensional echocardiography. Circulation. 1980;62(2):212–217. doi: 10.1161/01.cir.62.2.212. [DOI] [PubMed] [Google Scholar]
- 7.Quiñones MA, Otto CM, Stoddard M, Waggoner A, Zoghbi WA. Recommendations for quantification of Doppler echocardiography: a report from the Doppler Quantification Task Force of the Nomenclature and Standards Committee of the American Society of Echocardiography. J Am Soc Echocardiogr. 2002;15(2):167–184. doi: 10.1067/mje.2002.120202. [DOI] [PubMed] [Google Scholar]
- 8.Schenk P, Globits S, Koller J, Brunner C, Artemiou O, Klepetko W, Burghuber OC. Accuracy of echocardiographic right ventricular parameters in patients with different end-stage lung diseases prior to lung transplantation. J Heart Lung Transplant. 2000;19:145–154. doi: 10.1016/s1053-2498(99)00121-7. [DOI] [PubMed] [Google Scholar]
- 9.Chuong CJ, Sacks MS, Templeton G, Schwiep F, Johnson RL. Regional deformation and contractile function in canine right ventricular free wall. Am J Physiol. 1991;260:H1224–H1235. doi: 10.1152/ajpheart.1991.260.4.H1224. [DOI] [PubMed] [Google Scholar]
- 10.Armour JA, Pace JB, Randall WC. Interrelationship of architecture and function of the right ventricle. Am J Physiol. 1970;218:174–179. doi: 10.1152/ajplegacy.1970.218.1.174. [DOI] [PubMed] [Google Scholar]
- 11.Meier GW, Bove AA, Santamore WP, Lynch PR. Contractile function in canine right ventricle. Am J Physiol. 1980;239:H794–H804. doi: 10.1152/ajpheart.1980.239.6.H794. [DOI] [PubMed] [Google Scholar]
- 12.Oparil S. Pathogenesis of ventricular hypertrophy. J Am Coll Cardiol. 1985;5(6 Suppl):57B–65B. doi: 10.1016/s0735-1097(85)80528-3. [DOI] [PubMed] [Google Scholar]
- 13.Quaife RA, Chen MY, Lynch D, Badesch DB, Groves BM, Wolfel E, Robertson AD, Bristow MR, Voelkel NF. Importance of right ventricular end-systolic regional wall stress in idiopathic pulmonary arterial hypertension: a new method for estimation of right ventricular wall stress. Eur J Med Res. 2006;11:214–220. [PubMed] [Google Scholar]
- 14.Moulton MJ, Creswell LL, Ungacta FF, Downing SW, Szabo BA, Pasque MK. Magnetic resonance imaging provides evidence for remodeling of the right ventricle after single-lung transplantation for pulmonary hypertension. Circulation. 1996;94:II312–II319. [PubMed] [Google Scholar]
- 15.Reesink HJ, Marcus JT, Tulevski II, Jamieson S, Kloek JJ, Vonk Noordegraaf A, Bresser P. Reverse right ventricular remodeling after pulmonary endarterectomy in patients with chronic thromboembolic pulonary hypertension: utility of magnetic resonance imaging to demonstrate restoration of the right ventricle. J Thorac Cardiovasc Surg. 2007;133:58–64. doi: 10.1016/j.jtcvs.2006.09.032. [DOI] [PubMed] [Google Scholar]
- 16.Benza R, Biederman R, Murali S, Gupta H. Role of cardiac magnetic resonance imaging in the management of patients with pulmonary arterial hypertension. J Am Coll Cardiol. 2008;52:1683–1692. doi: 10.1016/j.jacc.2008.08.033. [DOI] [PubMed] [Google Scholar]