

Abstract
Chemotaxis during sinusoidal locomotion in nematodes captures in simplified form the general problem of how dynamical interactions between the nervous system, body, and environment are exploited in the generation of adaptive behavior. We used an evolutionary algorithm to generate neural networks that exhibit klinotaxis, a common form of chemotaxis in which the direction of locomotion in a chemical gradient closely follows the line of steepest ascent. Sensory inputs and motor outputs of the model networks were constrained to match the inputs and outputs of the Caenorhabditis elegans klinotaxis network. We found that a minimalistic neural network, comprised of an ON-OFF pair of chemosensory neurons and a pair of neck muscle motor neurons, is sufficient to generate realistic klinotaxis behavior. Importantly, emergent properties of model networks reproduced two key experimental observations that they were not designed to fit, suggesting that the model may be operating according to principles similar to those of the biological network. A dynamical systems analysis of 77 evolved networks revealed a novel neural mechanism for spatial orientation behavior. This mechanism provides a testable hypothesis that is likely to accelerate the discovery and analysis of the biological circuitry for chemotaxis in C. elegans.
Introduction
Spatial orientation is a fundamental adaptive behavior, but a unified understanding of how it is generated by the interplay of neuronal activity, the organism’s body, and its environment remains elusive. The nematode worm Caenorhabditis elegans is an advantageous organism in which to address this problem because it exhibits a robust form of spatial orientation known as chemotaxis (Ward, 1973) yet its nervous system is compact and amenable to genetic manipulations and electrophysiological analysis (Brenner, 1974; White et al., 1986; Goodman et al., 1998).
C. elegans performs chemotaxis using two distinct strategies: klinokinesis, in which the direction of movement is governed by a biased random walk (Pierce-Shimomura et al., 1999), and klinotaxis, in which the direction of movement is under continuous adjustment toward the line of steepest ascent (Iino and Yoshida, 2009). Klinotaxis differs from klinokinesis in two important respects. First, turning in klinokinesis involves large turns that are randomly oriented and sporadic, whereas turning in klinotaxis involves small turns that are directed and continual. Second, as we show below, klinotaxis inherently involves reactions to sensory input that depend on the worm’s internal state at the time of the stimulus. Together, these two differences imply a distinctive neural circuit for which there appear to be no precedents in the literature. Neural network models of C. elegans chemotaxis have focused almost exclusively on klinokinesis (Ferree et al., 1997; Ferrée and Lockery, 1999; Dunn et al., 2004, 2007).
Previous observations indicate that the C. elegans klinotaxis circuit operates under two principal constraints. First, sensory input is limited to two distinct types of salt chemosensory neurons that together report an approximation of the time derivative of salt concentration. The first type are chemosensory ON cells that are transiently activated by increases in salt concentration, whereas the second type are chemosensory OFF cells that are transiently activated by decreases in salt concentration (Suzuki et al., 2008; Thiele et al., 2009). Second, changes in direction are initiated by movements of the worm’s head, a fact that follows from the mechanics of nematode locomotion (Gray, 1953; Gray and Lissmann, 1964).
In this paper we used an evolutionary algorithm to generate neural networks that exhibit klinotaxis under the principal constraints of the biological system. We found that it is possible to achieve realistic klinotaxis behavior using a minimalistic neural network comprising only chemosensory ON cells and OFF cells, and a pair of neck muscle motor neurons. Though simple, the evolved networks reproduced two key experimental observations that they were neither designed nor evolved to fit. Further, a functional analysis using dynamical systems theory revealed a novel neural mechanism for spatial orientation behavior. This mechanism provides a testable hypothesis that is likely to accelerate the discovery and analysis of the klinotaxis circuit in nematodes.
Materials and Methods
The goal of this study was to generate and analyze minimal neural network models for klinotaxis in response to salt gradients. This study operated under two key empirically motivated constraints. First, changes in salt concentration were encoded by ON and OFF chemosensory neurons (Suzuki et al., 2008; Thiele et al., 2009). Second, the state of each type of sensory neuron was communicated synaptically to motor systems on both sides of the animal’s head and neck (White et al., 1986). In addition, we made the following three simplifying assumptions: (1) Neurons in the biological klinotaxis circuit act mainly as graded processing elements. (2) The several layers of interneurons interposed between sensory neurons and neck muscle motor neurons (White et al., 1986) function mainly as conduits of sensory signals; little or no processing is done by these neurons. (3) Klinotaxis circuitry acts to bias the constitutive oscillations of the motor systems; it does not participate directly in the production of the oscillations themselves. Assumption 1 is justified by the apparent absence of classical all-or-none action potentials in C. elegans neurons (Lockery and Goodman, 2009), together with the evidence that some C. elegans neurons, including chemosensory neurons, release neurotransmitter tonically (Chalasani et al., 2007; Thiele et al., 2009). Assumptions 2 and 3 are justified on the grounds of parsimony in that we wished to identify the simplest possible circuit motifs for klinotaxis.
Network architecture
Model networks had four fundamental components (Fig. 1): (1) a pair of chemosensory neurons—one representing a single class of previously identified ON cells, and one representing the two previously identified classes of OFF cells; (2) two motor neurons representing, respectively, the several classes of dorsal and ventral neck muscle motor neurons (White et al., 1986); (3) a pair of dorsal and ventral neck muscles; (4) an oscillatory element that drives the sinusoidal body waves that are characteristic of undulatory locomotion in nematodes. Connections from sensory neurons to motor neurons represented the polysynaptic interneuronal pathways between these neurons in the biological network (see assumption 2). Motor neuron self-connections were included to allow for the functional equivalent of active membrane conductances which have been reported for C. elegans neck muscle motor neurons (Mellem et al., 2008). Connections between dorsal and ventral neck muscle motor neurons were excluded on the grounds that the coordinating function of these connections is subsumed by the oscillatory element. The quantities designating the sign and amplitude of synaptic connections in the model are termed “weights.” To reduce the number of parameters in the model weights, biases, and time-constants were constrained to be symmetrical across the dorsoventral midline, with the exception that the weights from the oscillatory component to the motor neurons were opposite in sign (to ensure alternating dorsoventral head sweeps).
Figure 1. Architecture of model networks.
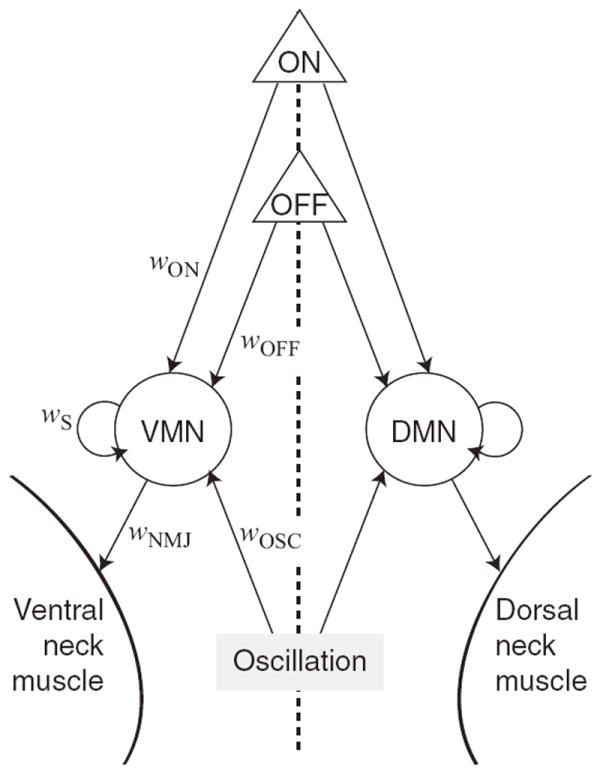
Triangles represent ON and OFF chemosensory neurons, circles represent the dorsal and ventral neck muscle motor neurons, DMN and VMN, respectively, and the shaded rectangle represents the source of sinusoidal inputs to the motor neurons; these inputs produce the side-to-side head sweeps characteristic of nematode locomotion. Arrows indicate synaptic connections with their associated weights (w). All network parameters are symmetrical across the dorsoventral midline (dashed line), with the exception of dorsal and ventral wOSC, which have opposite signs.
Sensory neurons
For simplicity, the activation of sensory neurons was modeled as an instantaneous function of a derivative operator D(t) applied to the recent history of attractant concentration (Schnitzer et al., 1990). This operator was defined as D(t) = cN(t) − cM(t), where cN(t) is the average concentration over the interval [t − N,t], cM(t) is the average concentration over the contiguous interval [t − (N + M), t − N], and N and M are the durations of the two intervals. In response to a concentration step of infinite duration at t = 0, D(t) yields a linear rise to a peak at t = N, and a linear decay to baseline at t = N + M; accordingly, N and M are referred to as the “rise time” and the “decay time” of the sensory neurons. In the case of the OFF cell, the sign of D(t) was inverted so that decreases in concentration yielded positive activations. For both ON cells and OFF cells, negative activations were set to zero.
Motor neurons
Motor neurons were modeled as nodes with simple first order nonlinear dynamics (Beer, 1995),
| (1) |
where y is the motor neuron activation, τ is the time constant (τ = 0.1 s), and wS is the value of the self-connection. The physical equivalent of y is change in membrane potential relative to the resting potential; thus y can assume positive and negative values. Graded synaptic output was modeled as a sigmoidal function σ(·) of presynaptic activation with:
| (2) |
Synaptic input from the sensory neurons and the oscillatory component, I(t), was the weighted sum of the activation of the sensory neurons and the oscillatory input,
| (3) |
where w is a synaptic weight and subscripts indicate the network components that synapse on the motor neurons.
The quantity θ is a bias term that determines the percent maximum synaptic output when the motor neuron is at rest, that is, when it reaches steady-state at I = 0. As θ is made large and positive, resting synaptic output approaches unity; as θ is made large and negative, resting synaptic output approaches zero.
Oscillatory input to the neck motor neurons
Because the cellular mechanism by which oscillations are generated during locomotion in C. elegans is unclear, we did not explicitly model this mechanism; instead, we represented its effect as a sine wave, yOSC(t) = sin(2πt/T) with T = 4.2 s, the duration of a one cycle of locomotion on agar (Ferrée and Lockery, 1999).
Body and behavior
In sinusoidal locomotion (without slip), each body segment follows the one anterior to it (Fig. 2). The worm was therefore represented as a single point (x, y) with instantaneous velocity v. The angular direction of movement μ was measured relative to the positive x-axis (Fig. 2A). The biomechanics of locomotion were represented in idealized fashion, with two main assumptions. (1) Neck muscle length was proportional to motor neuron output. (2) The turning angle φ (Fig. 2 B) was proportional to the difference in muscle length. After combining constants of proportionality, this gives:
| (4) |
where, yD and yV are activations of the dorsal and ventral neck muscle motor neurons, wNMJ is the strength of the connection from motor neurons to muscles, and ζ is Gaussian noise (mean 0, SD 0.05). It follows that the model worm’s position is updated as follows:
| (5) |
where v is a constant speed of 0.022 cm/s (Ferrée and Lockery, 1999). To include pirouettes, the model worm’s orientation was randomized with an average frequency of 0.033 Hz, which matches the baseline frequency of pirouettes in real worms (Pierce-Shimomura et al., 1999). In the simulations of Figures 4A and 11 (see below), pirouette frequency was set to zero for purposes of illustration.
Figure 2. Locomotion model.
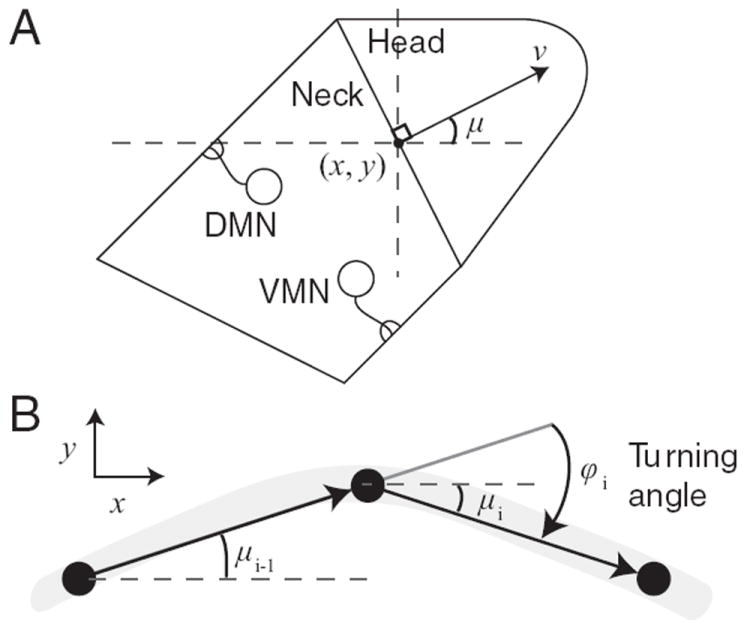
A, Idealized body. The model worm was represented as a point (x, y) located at the center of the border between idealized head and neck regions of the model. The quantity μ is the angle between the instantaneous velocity vector v and the positive x-axis. B, Changes in orientation. Between time steps i − 1 and i, the orientation of the velocity vector changes by the turning angle φ. The gray arc is the model worm’s path.
Figure 4. Analysis of simulated klinotaxis behavior.
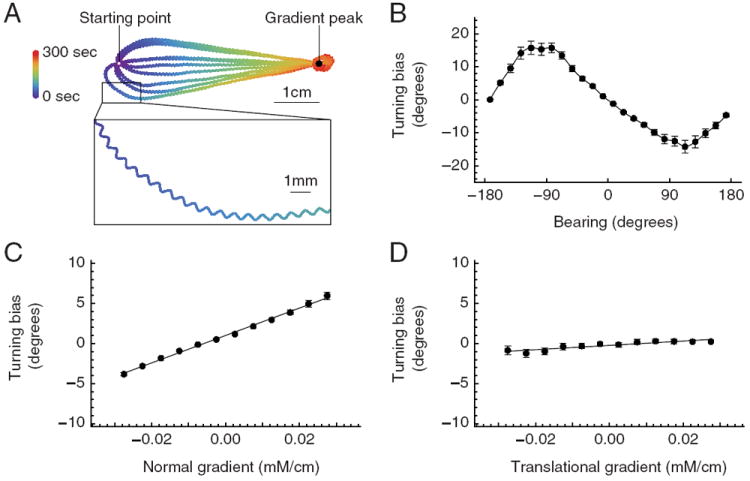
A, Behavioral traces. Model worms are placed at random orientations 4.5 cm from the gradient peak and allowed to move for 300 s. Trace color represents time. Inset: Enlargement of a gradual turn. B, Average turning bias vs bearing. C, Average turning bias vs the component of the gradient in the normal direction. D, Average turning bias vs the component of the gradient in the translational direction. Error bars are SD.
In pilot simulations, we found that although the model motor neurons receive oscillatory input, some combinations of network parameters encountered during evolution failed to produce undulatory locomotion. This occurred, for example, when connections between the oscillator and the motor neurons were weak, or when motor neurons were biased by extreme values of θ. Movement in real worms cannot occur without the thrust generated by undulations (Gray and Lissmann, 1964); to implement this constraint, the velocity of the model worm was set to zero unless undulations were present.
Numerical integration
Equations 1-5 were solved simultaneously using Euler integration with a time step of 0.01 s. After evolution, solutions were validated using a time step of 0.001 s.
Gradients
The gradient during a typical chemotaxis assay has a Gaussian shape. In the context of network evolution, however, Gaussian gradients are problematic because local steepness is systematically related to distance from the gradient peak. This relationship can lead to unrealistic behavioral strategies in which track curvature is inversely related to gradient steepness (Ferrée and Lockery, 1999). To avoid this problem, we used conical gradients during evolution. Accordingly, attractant concentration c(t) was proportional to the Euclidean distance from the gradient peak,
| (6) |
where α determines the steepness of the gradient.
Evolution of network parameters
The parameters of the model were optimized (henceforth, evolved) by applying a genetic algorithm (Bäck, 1996) to a population of 10 individuals, i.e., 10 independent parameter sets. We evolved the following parameters (ranges are shown in brackets): wNMJ [1, 3]; θ, wON, wOFF, and wS [−15, 15]; wOSC [0, 15], N and M [0.1, 4.2]. Parameters were encoded in an 8-element vector of real-values between [−1, 1]; when needed, parameters were linearly mapped to their corresponding ranges. Each time the algorithm was run, individuals were initialized by random selection from the range of each parameter. During evolution, fitness was evaluated for two randomly selected individuals, called “parents.” A new individual, called a “child,” was created by two-point recombination between parental vectors. The child was then mutated by addition of Gaussian noise to each parameter (mean 0, SD 0.05; Beer, 1996) and substituted for the parent with the lower fitness. The creation of 10 children constituted the passage of one generation. Populations were evolved for 100 generations. At the end of a run, the parameters of the best performing individual were stored for later analysis. The algorithm was run 100 times (using different random seeds), yielding 100 distinct networks.
Evaluation of network fitness
Fitness was evaluated in simulated chemotaxis assays. At the start of each assay, the model worm was placed with a random orientation at a point 4.5 cm from the peak of the gradient and motor neuron activations were randomized over the range [0, 1]. Gradient steepness α was randomized over the range [−1.0, −0.1]. Negative values of α were used to create a conical gradient. Note that as a consequence, c(t) < 0. Chemotaxis performance was quantified in terms of a chemotaxis index CI defined as the time average of the distance to the peak of the gradient,
| (7) |
where h(t) is the Euclidean distance to the peak, h(0) is the model worm’s initial distance from the peak (4.5 cm), and T is the total simulated assay time (500 s). For simplicity, negative CI values were set to zero. The fitness of an individual was defined as the average CI over 50 assays.
Chemotaxis reliability
A common measure of chemotaxis performance in real assays is the proportion of worms that reach the gradient peak (Bargmann et al., 1993), which we will refer to as “reliability.” In our simulations, we defined the peak to be a region enclosed by a circle with a radius of 0.1 cm centered on the peak.
Measures of orientation
The principal orientation vector used was the direction of translation, defined by any pair of points on a trajectory separated by a phase difference of 2π, i.e., one cycle of locomotion (Fig. 3A). The vector 90° counterclockwise from the direction of translation is the normal direction, which was used to quantify the gradient as sensed by the model worm. The angle between the line of steepest ascent and the direction of translation is the model worm’s bearing. The turning bias was defined as the sum of the turning angle φ over one cycle of locomotion.
Figure 3. Terminology.
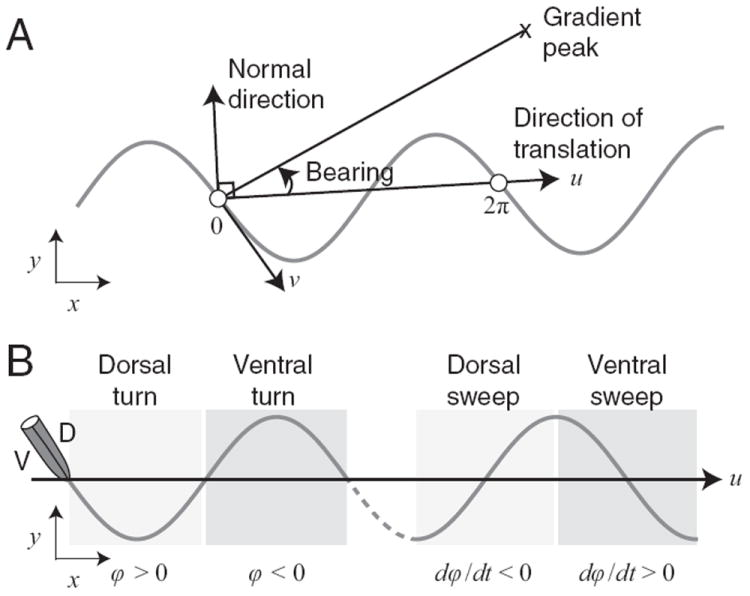
A, Orientation vectors used in the analysis of sinusoidal locomotion. Undulations occur in the x-y plane. The white circles represent the start and end of one locomotion cycle. B, Definitions of turns and head sweeps. Undulations involve dorsoventral flexions of the body. Dorsal and ventral turns are defined in terms of the sign of the turning angle φ. Dorsal and ventral head sweeps are defined in terms the sign of dφ/dt.
Terminology
Turns
Dorsal and ventral turns were defined as regions of the model worm’s path in which turning angle φ was positive and negative, respectively (Fig. 3B).
Head sweeps
Dorsal and ventral head sweeps were defined as regions of the worm’s path in which the derivative of the turning angle dφ/dt was negative and positive, respectively. The duration of a head sweep is one half the duration of a cycle of locomotion.
Results
Klinotaxis from evolved neural networks
To identify simple neural networks for klinotaxis in C. elegans, we generated a population of 100 different networks using a genetic algorithm. Fitness scores in this population ranged from 0.41 to 0.77. Because our main interest was to identify networks capable of robust chemotaxis behavior, we focused on a high-performance subpopulation, namely those networks having a fitness score of at least 0.75 (n = 77). This subpopulation had an average chemotaxis index CI of 0.88, and an average reliability score of 99.9 (see Materials and Methods), indicating that performance was indeed robust (Table 1). All further analysis was limited to this high-performance subpopulation.
Table 1.
Chemotaxis efficiency of the high-performance subpopulation in conical and gaussian gradients
| Gradient shape
|
||
|---|---|---|
| Conical | Gaussian | |
| Chemotaxis index (CI) | 0.88 ± 0.005 | 0.87 ± 0.007 |
| Reliability (%) | 99.99 ± 0.01 | 99.94 ± 0.25 |
An important test of evolved networks is whether performance generalizes to situations not presented during evolution. To test for generalization in networks evolved on a conical gradient, we measured chemotaxis index and reliability when networks were tested in a Gaussian gradient. This gradient shape was chosen because it closely resembles the gradients used in laboratory tests of chemotaxis in C. elegans (Ward, 1973). Model worms were placed 4.5 cm from the gradient peak. Both measures closely matched the values obtained in the conical gradient (Table 1), indicating that the networks were capable of generalizing to a novel gradient. We draw two conclusions from this experiment. First, the evolved networks are capable of reaching the gradient peak in realistic gradients. Second, these networks are not specialized for the shape of the gradient; instead, they embody a more general solution to the task of klinotaxis, making them appropriate for further study.
As a first step in determining the mechanism by which model worms reached the peak of the gradient, we asked how the trajectory of virtual worm tracks varied as a function of the model worm’s random initial bearing (Fig. 4A). We observed that model worms made a smooth turn until they were oriented in the direction of steepest ascent. Thus the output of the model was consistent with real worm tracks during klinotaxis (Iino and Yoshida, 2009).
We next asked whether model worms reached the gradient peak via klinotaxis per se. As we understand the term, klinotaxis has two necessary conditions. (C1) The organism continuously adjusts its orientation toward the line of steepest ascent. (C2) Adjustments in orientation are made on the basis of comparisons of the amplitude of the stimulus at a single point on the body as this point is swept from side to side over time.
To ascertain whether the networks met C1, we plotted track-curvature, quantified in terms of turning bias (see Materials and Methods), as a function of instantaneous bearing relative to the gradient peak (Fig. 4B). According to C1, the algebraic sign of the turning bias should always be opposite to the sign of bearing. Figure 4B shows that this was indeed the case, providing evidence that the model satisfies this condition.
To ascertain whether the optimized networks met C2, we first examined the shape of the function relating turning bias to bearing (Fig. 4B). We noted that this function was approximately sinusoidal, with extrema near bearings of ±90° and zero crossings near 0 and ±180°. Thus, turning bias was greatest when the side-to-side component of head sweeps was aligned with, or opposite to, the line of steepest ascent, i.e., when concentration differences at extreme head positions were maximal. Conversely, the magnitude of the turning bias was least when head sweeps were approximately perpendicular to the line of steepest ascent, i.e., when concentration differences at extreme head positions was minimal. This finding suggests that turning bias in the model is controlled by changes in concentration sensed during the side-to-side head sweeps, as required by C2. As further evidence, we plotted turning bias as a function of the amplitude of the gradient in the direction normal to the worm’s translational movement. This plot revealed that turning bias increased linearly with the amplitude of the gradient normal to the worm, as expected for a simple causal relationship between the concentration differences during head sweeps and turning bias (Fig. 4C, r = 0.978). Furthermore, turning bias was only modestly affected by the model worm’s movement in the translational direction (Fig. 4D). Overall, we conclude that the model networks reached the gradient peak by klinotaxis.
The sinusoidal relationship between turning bias and bearing, together with the linear relationship between turning bias and the normal component of the gradient, are qualitatively similar to the relationships observed in studies of klinotaxis in real worms (Iino and Yoshida, 2009). This similarity is significant for two main reasons. First, as we did not explicitly include selection criteria in the evolutionary algorithm to approximate the experimental evidence, this similarity is an emergent property of the evolved networks. Second, the resemblance suggests that the model employs a klinotaxis strategy similar to the one used by real worms, making the model presented here especially appropriate for the generation of testable predictions concerning how the biological network functions.
Network motifs
To understand how the model networks functioned to produce klinotaxis behavior, we sought clusters in the model’s 8-dimensional parameter space that might reveal distinct circuit motifs. This was done by making scatter plots of all unique pairs of parameters (supplemental Fig. S1, available at www.jneurosci.org as supplemental material). The strongest clustering was found in plots associated with a single parameter, the synaptic weight from OFF cells to motor neurons wOFF, which exhibited two well separated clusters. We then coded all plotted points according to membership in one or the other wOFF cluster, which revealed the presence of the same two clusters in only two other parameters—the synaptic weight from ON cells to motor neurons wON, and the motor neuron bias θ. The clustering is evident in the subspace defined by these three parameters, as shown in Figure 5A. Each point in the figure represents one network in the high-performance subpopulation. One cluster was centered in the region of parameter space where wON is positive, wOFF is negative, and θ is positive (black points); the other cluster was centered in the region where the signs of these parameters are reversed. As there was no region of overlap between clusters, we conclude that within our data set there are two distinct circuit motifs for klinotaxis (Fig. 5B). Though distinct, these motifs had two features in common. First, the signs of wON and wOFF were always opposite, indicating that model sensory neurons with opposing sensitivities always had antagonistic synaptic effects. Second, the magnitude of wOFF was, on average, greater than the magnitude of wON (mean |wOFF|/|wON| =3.39), which may indicate the relative importance of the ON and OFF neurons to network fitness.
Figure 5. Klinotaxis networks motifs.
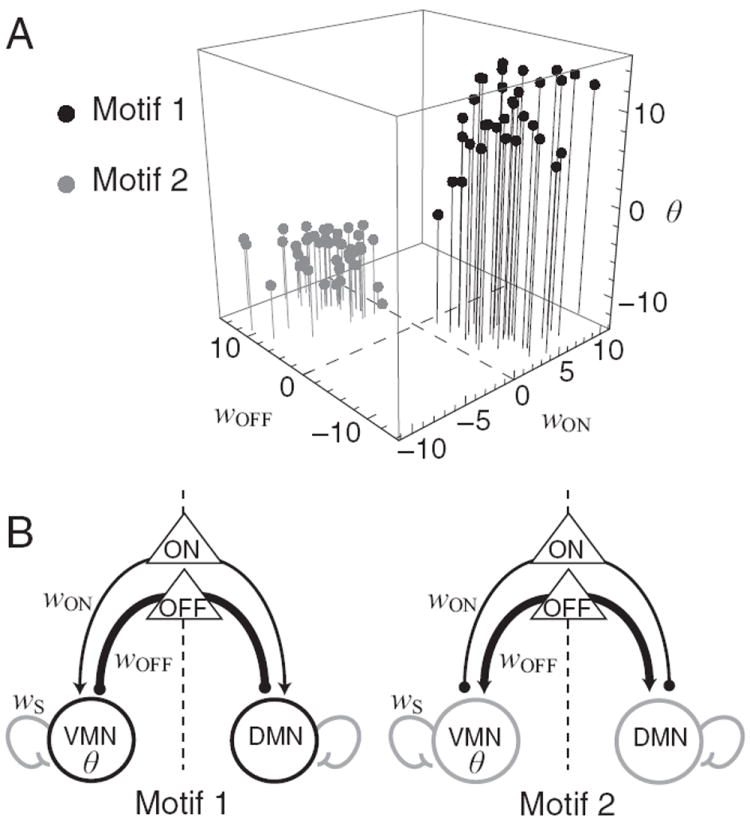
A, Location of networks in the parameter space defined by wON, wOFF, and θ. Black dots, networks in which wON is positive and wOFF is negative (motif 1); gray dots, networks in which wON is negative and wOFF is positive (motif 2).B, Circuitry of motifs. Arrowheads, excitatory connections; filled circles, inhibitory connections. Line thickness shows relative connection strength. Self-connections wS in both motifs are <4. Motor neuron color gives the sign of the bias term θ (black, positive; gray, negative). All parameters were symmetrical across the dorsoventral midline (dashed line).
In the model, the strength of the self-connection wS determines whether the neuron is unistable (wS <4) or bistable (wS >4) (Beer, 1995). We found that wS <4 for all networks in the high-performance subpopulation; thus, the dynamics of the neck motor neurons are unistable.
Sensory dynamics
The relationship between the timescale of sensory responses and the timescale of behavioral responses can provide additional clues as to network function. For example, turning bias could be modulated by sensory input arriving during an individual head sweep; alternatively, several head sweeps might be required for a significant effect to arise. The question of relative timescales was addressed by examining the distribution of the parameters that together define the dynamics of sensory responses in the model networks. As described in Materials and Methods, the parameters N and M specify the rise time and decay time of chemosensory responses, respectively. During evolution, N and M were constrained to be <4.2 s. However, a scatter plot of decay time vs rise time (Fig. 6A) showed that rise times were <1.7 s. Thus, the characteristic reaction to a change in concentration rises and falls on the timescale of a single head sweep (Fig. 6 B,C). This finding favors the hypothesis in which turning bias is modulated during individual head sweeps.
Figure 6. Dynamics of chemosensory neurons in the model.
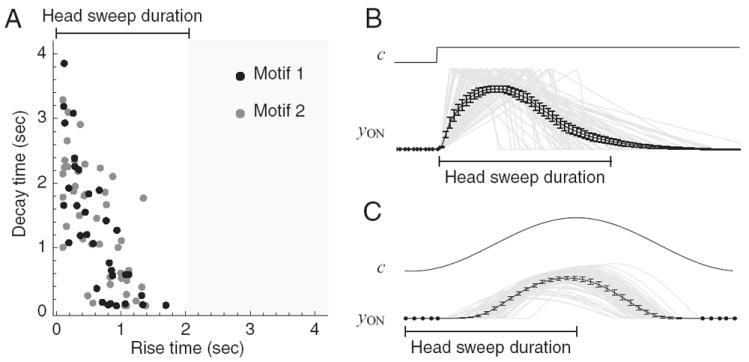
A, Scatter plot of decay time vs rise time. Black dots correspond to networks in motif 1; gray dots correspond to networks in motif 2. B, C, Simulated response of chemosensory neurons to a step in concentration (B) and to sinusoidal input as would be generated by the head sweep oscillation (C). Top, Concentration. Bottom, black, ensemble average of chemosensory neuron activation across the population of networks; gray, responses of individual chemosensory neurons. Head sweep duration is shown for comparison. Error bars are SEM.
The scatter plot reveals two other aspects of sensory processing in the model networks. First, decay times, unlike the rise times, were not further restricted within the allowable range, that is, klinotaxis performance appears to be more sensitive to rise time than to decay time. Second, the two motifs, indicated by dot color, were intermingled with respect to relative values of rise times and decay times, that is, there appeared to be no systematic relationship between sensory dynamics and network motifs.
Thus far, we have shown that the networks in the high performance subpopulation embody a general solution to the task of klinotaxis and that these networks perform in a way that is qualitatively similar to the behavior of real worms. Furthermore, this subpopulation contains two distinct circuit motifs. In the next three sections, we address the question of the neuronal mechanism of klinotaxis: how do individual neurons in these motifs interact to regulate the direction of locomotion?
Asymmetrical sensory effects and motor neuron bias
In the model networks, identical chemosensory signals are sent simultaneously to both the dorsal and the ventral motor neurons, and yet these signals have asymmetrical effects that allow the model worm to undergo either a dorsal or ventral turning bias, as appropriate for orienting correctly to the gradient. To understand how identical sensory inputs lead to asymmetrical effects on motor neuron output, we plotted the steady-state input–output curve of the motor neurons, beginning with motif 1 (Fig. 7A2,B2, gray curves). The equation for this curve was obtained by transforming equation 1 to the output space defined by o = σ(y + θ), yielding I + θ = σ−1(o) − wS o, where o is motor neuron output and I is net synaptic input (Beer, 2006). The input–output curves trace the equilibrium values of o as a function of I. Note that these curves partition the neuron’s input into three domains: a central region where the motor neuron is sensitive to changes in input (shaded), and two flanking regions where it is not (unshaded).
Figure 7. Dynamics of the neck muscle motor neurons for motif 1 and motif 2.
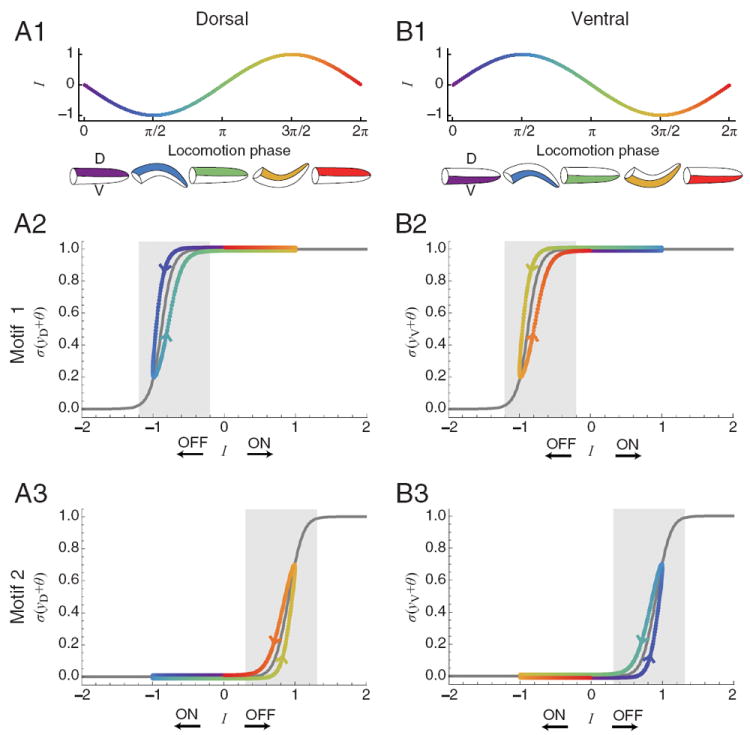
A1, B1, Motor neuron input vs phase. Icons beneath graphs show curvature of the head region (color matches phase). A2, B2, Input–output diagrams for dorsal and ventral motor neurons in motif 1. A3, B3, Input–output diagrams for dorsal and ventral motor neurons in motif 2. In A2–B3, Gray trace, steady-state input–output function when the head sweep oscillation is absent; colored trace, instantaneous input–output function when the head sweep oscillation is present (color matches phase in A1, B1); arrows show the effects of activation of the indicated chemosensory neuron on motor neuron input I; shaded areas show the sensitive regions of the input–output function.
The colored traces in Figure 7, A2 and B2, show the instantaneous value of o when the oscillatory input (Fig. 7A1,B1) alone drives the motor neurons (i.e., when sensory input is eliminated). The phase difference between motor neurons is π. Motor neuron state circulates counterclockwise along the trajectories. The traces deviate from steady-state, but the deviation is modest because the period of locomotion (T = 4.2 s) is long relative to the time constant of the motor neurons (τ = 0.1 s).
Note that the input–output curves for motif 1 are not centered at I = 0, but shifted to the left (Fig. 7A2,B2) as a result of the positive values of motor neuron bias θ in this motif. Consequently, when the dorsal motor neuron is in the sensitive region of its input–output curve (Fig. 7A2, blue-green), the ventral motor neuron is in the insensitive region of its input–output curve (Fig. 7B2, blue-green); the converse is true when the ventral motor neuron is in the sensitive region (Fig. 7A2,B2, yellow-orange). Because the dorsal and ventral neurons never occupy the sensitive region at the same time, sensory input can alter the activation of one motor neuron and not the other, leading to the possibility of asymmetrical sensory effects on motor neuron output.
Similar plots show that motif 2 is the complement of motif 1 (Fig. 7A3,B3). Here the steady-state input–output curves are biased to the right, but again, the dorsal and ventral motor neurons never occupy the sensitive region of the curve at the same time. Together, the analyses of motifs 1 and 2 indicate that the asymmetrical effects of the sensory neurons on the motor neurons, upon which klinotaxis depends, result from shifts in the location of the sensitive region of the input–output curve relative to the range of the oscillatory input that drives head sweeps.
Asymmetrical turning from motor neuron state dependence
The next issue concerning the neuronal mechanism of klinotaxis is how the asymmetrical effects on motor neurons described above modulate turning angle. Again, we first consider motif 1. In this motif, the weights from the ON cells to the motor neurons are positive and the weights from the OFF cells to the motor neurons are negative. Thus, ON cell activation increases the net input to the motor neuron, whereas OFF cell activation decreases it (Figs. 7A2,B2, black arrows). Accordingly, when a motor neuron is in the sensitive region of its input–output curve, where the slope is positive, activation of the ON cell increases motor neuron output, whereas activation of the OFF cell decreases it. As noted in the previous section, when one motor neuron is in the sensitive region, the other is not. Therefore, when the ON cell is activated under these conditions, the output of the sensitive motor neuron rises, whereas the output of the insensitive motor neuron does not change, and the net effect is to reduce the difference in motor neuron output. Given that turning angle is proportional to the difference in motor neuron output (Eq. 4), we arrive at a simple rule (R1): ON cell activation reduces turning angle. By similar logic, when the OFF cell is activated, the output of the sensitive motor neuron decreases, whereas the output of the insensitive motor neuron does not change, and the net effect is to increase the difference in motor neuron output. In this case, we arrive at the complementary rule (R2): OFF cell activation increases turning angle. The same simple rules apply to motif 2.
The mechanism of orientation responses
The final issue in analyzing the neuronal mechanism of klinotaxis is the question of how rules R1 and R2 lead to correct orientation responses. For clarity, we analyze the orientation responses produced by single stepwise changes in concentration; concentration increases (Fig. 8A, upsteps) are considered separately from concentration decreases (Fig. 8B, downsteps).
Figure 8. Orientation responses elicited by stepwise changes in concentration.
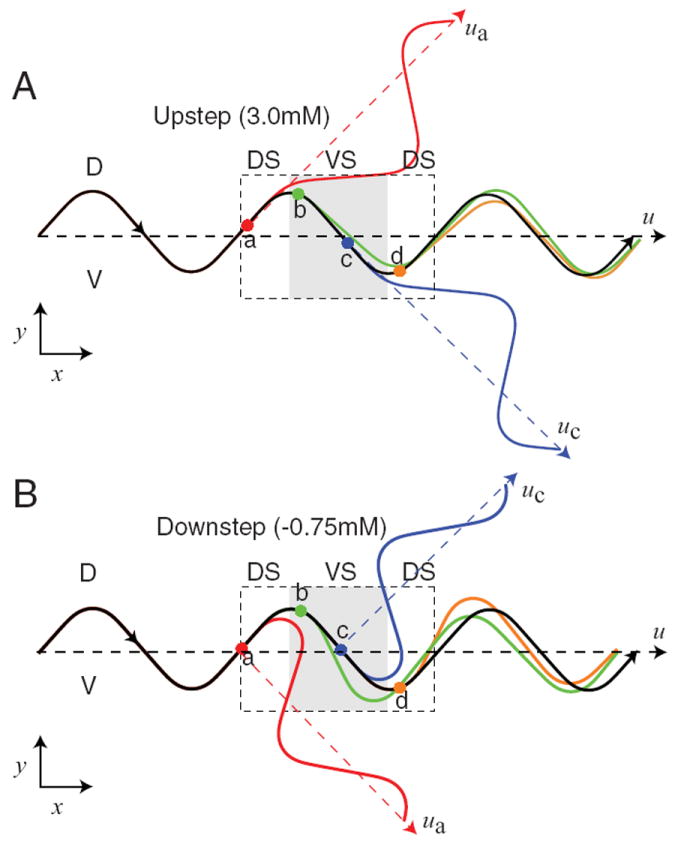
A, Response to upsteps. B, Response to downsteps. In A and B, the black trace shows the trajectory in the absence of a concentration step. The colored traces show the trajectories obtained in response to concentration steps placed at the locations indicated by dots of matching color. The four locations chosen cover a complete cycle of locomotion (dashed box). Vectors indicating the direction of translation (dashed lines) are shown for no concentration step (u), and steps at locations a and c (ua, and uc). DS, Dorsal head sweep; VS, ventral head sweep (shaded region).
Upsteps
Upsteps activate the ON cell, which generally reduces turning angle (R1). However, the direction of the orientation response produced by a concentration step should depend upon the locomotion phase at which the concentration change occurs. We consider four representative phases. (1) An upstep at the midpoint of a dorsal head sweep (Fig. 8A, point a): turning angle is decreased for approximately the duration of a head sweep (compare Fig. 6B). This persistent reduction in turning angle attenuates the ensuing ventral turn, with the result that the worm’s translational velocity vector rotates dorsally (red trajectory, vector ua vs u). (2) An upstep at the midpoint of a ventral head sweep (point c): a ventral rotation occurs (blue trajectory, vector uc vs u) because now the ensuing dorsal turn is attenuated. Note that both the dorsal rotation at point a and the ventral rotation at point c are appropriate orientation responses because the model worm turns in the direction of its instantaneous velocity vector at the time of the increase in concentration. (3) An upstep at the dorsal maximum (point b): no rotation occurs because the decrease in turning angle attenuates parts of the dorsal and ventral turns almost equally (green trajectory). (4) An upstep at the ventral maximum (point d): the response is analogous to the response at point b (orange trajectory). Finally, note that the absence of rotation at points b and d is appropriate because the model worm’s instantaneous velocity vector at the time of the increase in concentration was the same as its translational direction.
Downsteps
Downsteps activate the OFF cell, which increases turning angle (R2). As with upsteps, we consider four representative phases. (1) A downstep at the midpoint of a dorsal head sweep (Fig. 8B, point a): turning angle is increased for approximately the duration of a head sweep. This persistent increase in turning angle accentuates the ensuing ventral turn, with the result that the worm’s translational velocity vector rotates ventrally (red trajectory, vector ua vs u). (2) A downstep at the midpoint of a ventral head sweep (point c): a dorsal rotation occurs (blue trajectory, vector uc vs u) because now the ensuing dorsal turn is accentuated. Note that both the ventral rotation at point a and the dorsal rotation at point c are appropriate orientation responses because the model worm turns away from the direction of its instantaneous velocity vector at the time of the decrease in concentration. (3) A downstep at the dorsal maximum (point b): no rotation occurs because the increase in turning angle accentuates parts of the dorsal and ventral turns almost equally (green trajectory). (4) A downstep at the ventral maximum (point d): the response is analogous to the response at point b (orange trajectory).
The above analysis indicates that the model networks use a novel and elegant mechanism at the neuronal level. This mechanism depends on three basic principles. (1) The two motor neurons are biased such that when one motor neuron is sensitive to sensory input, the other is not. (2) The signs of synaptic connections from sensory neurons to motor neurons are adjusted with respect to motor neuron bias such that ON cell activation reduces the curvature of the worm’s path, whereas OFF cell activation increases the curvature of the worm’s path. (3) The dynamics of sensory responses are adjusted so that changes in curvature are transient, lasting for approximately the duration of a head sweep. As a result, changes in curvature cause the worm’s path to veer toward concentration increases and away from concentration decreases, unless the worm’s head is moving in the direction of the gradient peak at the time the concentration change is encountered.
To obtain a more complete understanding of how the simple rules for predicting changes in turning angle lead to correct orientation responses, we expanded the analysis of Figure 8 to include steps in concentration not only at points a–d, but also at the points in between (Fig. 9). Orientation responses were expressed in terms of turning bias, which is computed over a complete cycle of locomotion following the concentration step. We observed that turning bias varied as a sinusoidal function of the phase of locomotion at which the concentration change occurred (Fig. 9A,B). This function had extrema near phases 0 and π, where the instantaneous velocity vector diverges most from the unbiased translational vector (Fig. 8, points a and c), and minima near phases of π/2 and 3π/2 (Fig. 8, points b and d), where the instantaneous velocity vector diverges least from the unbiased translational vector. In the context of klinotaxis on a gradient, the instantaneous velocity vector at the time of an upstep signals the direction of the peak implied by such a step, whereas the instantaneous velocity vector at the time of a downstep signals the direction opposite to the peak. Thus, the model worm corrects its orientation relative to discrepancies between its velocity vector and the direction of the peak not only at points a–d, but also at all appropriate points in between.
Figure 9. Phase sensitivity of orientation responses.
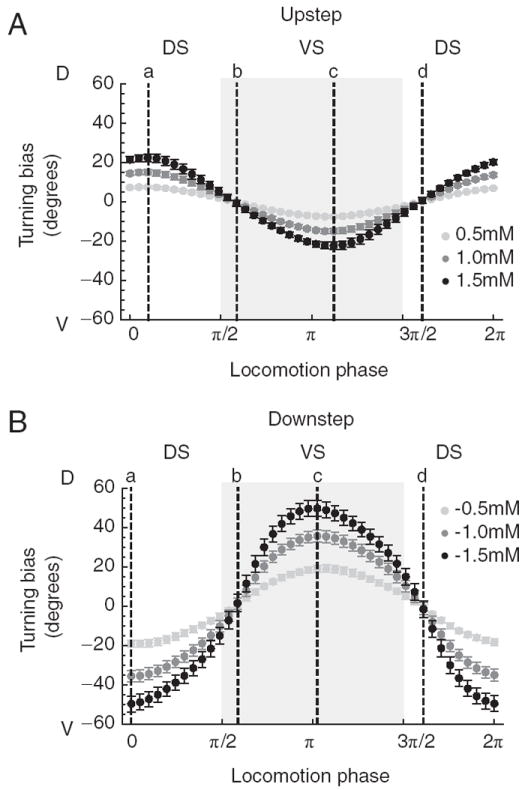
A, Response to upsteps. B, Response to downsteps. Plots show turning bias vs the phase of locomotion at which the concentration step occurred. Each point represents the average across all networks; error bars are SD. Shades of gray indicate the magnitude of the concentration step as shown in the key. Positive and negative values of turning bias result, respectively, in counterclockwise and clockwise rotations of the translational vector. Dashed lines mark the phases (a– d) shown in Figure 8. DS, Dorsal head sweep; VS, ventral head sweep (shaded region). Error bars are SEM.
The foregoing analysis also revealed that the amplitude of the orientation response was proportional to the amplitude of the concentration step (Fig. 9). This proportionality is significant because, for efficient klinotaxis, orientation responses should occur not only when concentration increases during head sweeps to one side of the animal and decreases during head sweeps to the other side, but also when concentration increases (or decreases) during head sweeps to both sides of the animal. The latter situation occurs when the worm’s translational vector points obliquely up or down the gradient, and produces concentration changes of the same sign but different magnitudes. The observed proportionality ensures that orientation responses will be correct during oblique trajectories, which occur frequently during chemotaxis in real worms (Iino and Yoshida, 2009).
Finally, the model worm’s average response to a downstep of a given size is greater than the response to an upstep of the same size (Fig. 9). This difference is attributable to the fact that in all of the networks, |wOFF| > |wON|. Comparatively larger orientation responses to downsteps than to upsteps makes functional sense because the worm is further off course when it is heading generally away from the peak than when it is heading generally toward it; analogously, smaller orientation responses to upsteps prevent oversteering.
The role of the ON and OFF cells, and the geometry of the environment in klinotaxis
For real worms tested in a Gaussian (radial) gradient, OFF cells appear to be more important for klinotaxis than ON cells. This was shown by measuring the efficiency of klinotaxis following ablation of ASE neurons (Iino and Yoshida, 2009). Ablation of the OFF cell ASER produced a significant deficit in klinotaxis efficiency, whereas ablation of the ON cell ASEL had little or no effect unless combined with ablation of ASER, in which case klinotaxis was completely eliminated. The simplest interpretation of these results is that the OFF cell acting alone (ASEL ablation) is sufficient for normal levels of klinotaxis, whereas the ON cell acting alone (ASER ablation) is sufficient only for klinotaxis at a reduced level of efficiency. Remarkably, simulated ablations of the ON cell and the OFF cells in the model precisely recapitulated these results (Fig. 10A). This finding is significant for two reasons. First, it indicates that the model and biological networks might be operating according to similar principles despite the fact that the model was not evolved to reproduce the effects of ablations. Second, it suggests that the model can be used to investigate the reasons for differential effects of ON cells and OFF cells in klinotaxis.
Figure 10. Effects of simulated chemosensory neuron ablations on klinotaxis reliability.
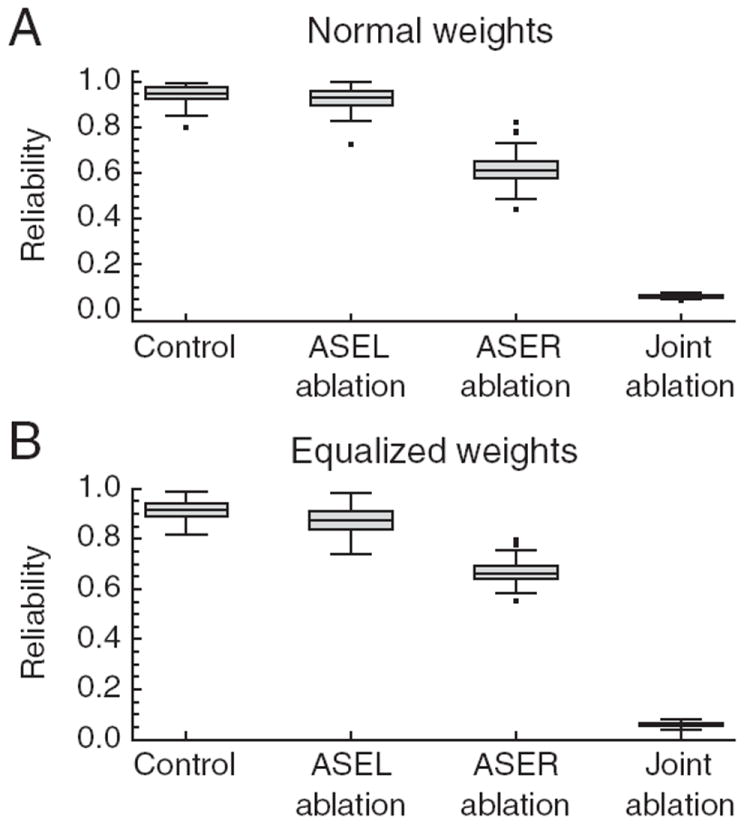
A, Ablations in networks with the original values of wON and wOFF. B, Ablations in networks in which |wON| and |wOFF|were equalized to test the hypothesis that differential effects of ablations are the result of unequal values of |wON| and |wOFF|. The middle bar inside the box is the statistical median. The outer edges of the box represent the 0.25 and 0.75 quantiles. The lines that extend out of the box span the full dataset, excluding the outliers (individual points).
An obvious explanation for the differential effects of ASE ablations in the model is that |wOFF| is greater than |wON| (Fig. 5A). However, when we equalized |wOFF| and |wON|, we observed that differential ablation effects were still present (Fig. 10B). This finding suggests that the OFF cell mechanism for detection and correction of movement down the gradient is inherently more effective in producing klinotaxis than the ON cell mechanism for detection and correction of movement up the gradient.
A simple geometrical argument is sufficient to account for the difference in the effectiveness of the ON cell and OFF cell mechanisms. Consider the case of a point worm orienting in a radial gradient using the OFF cell mechanism alone. At any location in the gradient, half of all translational vectors point up the gradient and half point down the gradient. Downward vectors are immediately corrected, at least partially, by the OFF cell mechanism, redirecting the worm in the general direction of the peak. Upward vectors, in contrast, are not corrected. However, in a radial gradient, any linear trajectory that initially points up the gradient is guaranteed to eventually point down the gradient, at which point the OFF cell mechanism becomes effective once again, redirecting the worm toward the gradient peak. Thus, regardless of its initial orientation, a worm operating with the OFF cell mechanism alone always reaches peak (although several corrective turns may be required). In case of a worm operating with only the ON cell mechanism, however, upward trajectories are subject to correction whereas downward trajectories are not. Consequently, such a worm will reach the gradient peak from some but not all initial orientations, which explains the fact that the ON cell is only partially sufficient for normal klinotaxis reliability.
The geometrical argument above is consistent with the trajectories of model worms when the ON cell or OFF cell have been ablated. Figure 11A shows the trajectories of model worms using only the OFF cell for orientation. As expected, all initial orientations result in trajectories that reach the gradient peak. Figure 11B shows the trajectories of model worms using only the ON cell for orientation. Trajectories that initially point up the gradient reach the peak, whereas most trajectories that initially point down the gradient do not. The exceptions are trajectories that point only slightly downward; these reach the peak because the span of the head sweep is sufficient to generate positive derivative signals.
Figure 11. Chemotaxis tracks of model worms having only one chemosensory neuron.
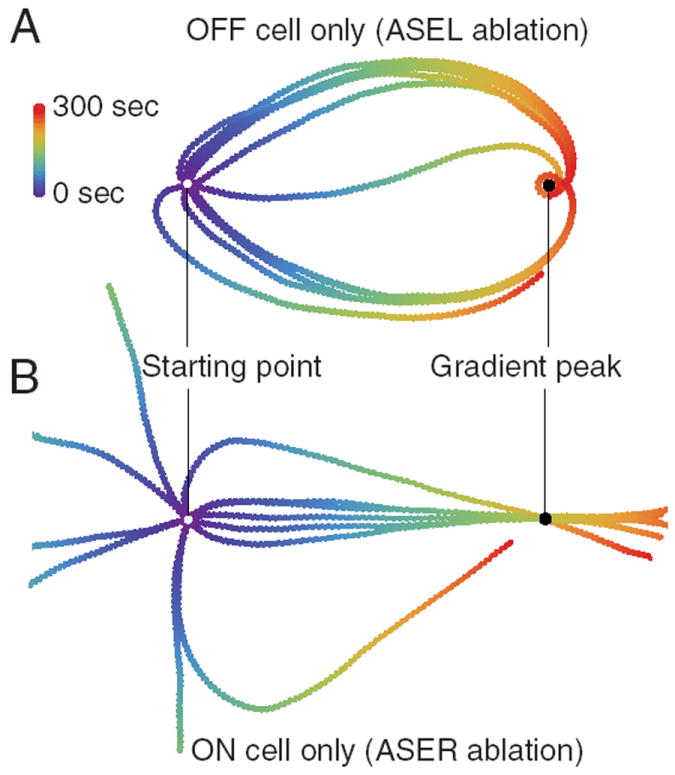
A, OFF cell only. B, ON cell only. In A and B, white dots represent starting location and black dots, gradient peak. Tracks were simulated for 300 s; color represents time as shown in the key.
Overall, we conclude that the differential effects of ASE ablations in the model probably arise from the interaction between their respective ON-OFF sensitivities and gradient geometry, rather than differences in connectivity. Thus, the model demonstrates that gradient shape should be taken into account when designing and interpreting ablation experiments to assess functional connectivity in neural networks for spatial orientation in C. elegans and other organisms.
Discussion
Klinotaxis during sinusoidal locomotion in nematodes captures in simplified form the general problem of how adaptive behaviors exploit dynamical interactions between the nervous system, body, and environment. Using an evolutionary algorithm to search an 8-dimensional parameter space, we showed that a minimalistic neural network—containing only a single pair of ON and OFF cell chemosensory neurons and a single pair of neck muscle motor neurons that receive antiphasic sinusoidal inputs—is sufficient for realistic klinotaxis. Importantly, the model networks reproduced two key experimental observations that they were neither designed nor evolved to fit: the sinusoidal relationship between turning bias and bearing (Fig. 4B), and the differential effects of ON and OFF cell ablations on chemotaxis performance (Fig. 10A). Together, these two emergent properties suggest that the model may be operating according to principles similar to those of the biological network.
The model provides a new hypothesis as to the neural mechanism of klinotaxis in C. elegans that could accelerate the discovery and analysis of the biological circuitry. For efficient klinotaxis, the state of the sensory neurons should be communicated bilaterally—to motor systems on both sides of the animal—so that it can turn in either direction as appropriate. However, bilaterality of sensory input raises the question of how asymmetrical turning arises. The model networks evolved here demonstrate the plausibility of a remarkably parsimonious mechanism in which this asymmetry is achieved simply by shifting the sigmoidal input–output function of the motor neurons relative to the dynamic range of the oscillatory input driving head sweeps. As a result, when one motor neuron is sensitive to sensory perturbations, the other is not. However, for this mechanism to be effective, two additional features of the circuit are required. First, the rise and decay times of chemosensory responses must be such that changes to the turning angle occur on the time scale of individual head sweeps. Thus, the model operates in the absence of sensory integration, indicating that this processes is not an absolute requirement for klinotaxis in C. elegans. Second, effects of ON and OFF chemosensory neurons on motor neurons must be antagonistic so that ON cell activation reduces the curvature of the worm’s path and OFF cell activation increases it. Although the present model is limited to neural circuits in which all three features are present, networks that operate under entirely different principles almost certainly exist. Whether or not the biological network functions as proposed can now be tested experimentally.
In contrast to chemotaxis to tastants, chemotaxis to odorants in C. elegans appears to involve OFF cells but not ON cells (Chalasani et al., 2007). However, the demonstration that chemotaxis in the model is almost 100% reliable in the case of OFF-cell-only networks (Fig. 10A) indicates that the mechanism described above is also sufficient in principle for klinotaxis to odorants. Indeed, the model predicts that in ecological situations where the number of available chemosensory neurons is limited by other costs, such as the need to respond to many different types of odors (Bargmann et al., 1993), OFF cells should be favored over ON cells.
The central role played by the sigmoidal input–output function in the proposed klinotaxis mechanism raises the question of how this nonlinearity might be interpreted biophysically. The model of the motor neurons used here supports at least two distinct but compatible interpretations. One interpretation is that the sigmoid represents the synaptic transfer function, which relates presynaptic voltage in motor neurons to postsynaptic effects on muscle. Electrophysiological measurements of synaptic transfer at the neuromuscular junction in nematodes suggest that it is approximately sigmoidal as the model requires (Davis and Stretton, 1989). A second interpretation is that the sigmoid represents the voltage dependence of inward currents underlying the graded regenerative potentials that are characteristic of several C. elegans neurons, including chemosensory neurons and neck muscle motor neurons (Goodman et al., 1998; Mellem et al., 2008). Other interpretations, for which there may be less evidence, are possible, including voltage-dependent ligand-gated currents in motor neurons. Under either interpretation, however, energetic considerations favor motif 2 in which the synapse, or regenerative current, is activated only when the output of the neuron should be sensitive to its inputs. Although in the context of our model the mechanism described is located in the neck motor neurons, the mechanism would be equally effective by the neck muscles themselves. In this case, the nonlinearity could be instantiated by the muscle’s excitation-contraction function.
Chemosensory neurons in C. elegans do not synapse directly on neck muscle motor neurons nor on the neck muscles themselves; rather, these connections are mediated by one or more layers of interneurons (White et al., 1986). The model networks analyzed here demonstrate that the dynamical constraints inherent in klinotaxis do not require additional processing by interneurons. In the biological network, therefore, the interneurons could be acting mainly as conduits of activity. Such a role would not, of course, exclude their function as sites of polymodal integration (Adachi et al., 2008).
Finally, a strength of the model presented here is that it can be validated by testing two predictions. First, ON or OFF cell activation during forward locomotion should, respectively, reduce or increase curvature. This prediction has two corollaries regarding the magnitude of the change in curvature (as suggested by Fig. 9): (1) it should be a function of the head sweep phase at which activation occurs, and (2) it should be bigger for OFF cell activation than for ON cell activation. These predictions could be tested by transiently photoactivating ON cells and OFF cells and measuring curvature in freely moving worms (Liewald et al., 2008). Second, in ablation experiments such as those of Iino and Yoshida (2009), worms without ON cells should reach the gradient peak reliably, and do so in long, spiral shaped trajectories, whereas worms without OFF cells should reach the peak infrequently, and do so with short, relatively straight, trajectories.
Supplementary Material
Acknowledgments
This work was supported by the National Institutes of Health (MH051383) and the National Science Foundation (IOB-0543643).
References
- Adachi R, Osada H, Shingai R. Phase-dependent preference of thermosensation and chemosensation during simultaneous presentation assay in Caenorhabditis elegans. BMC Neurosci. 2008;9:106. doi: 10.1186/1471-2202-9-106. [DOI] [PMC free article] [PubMed] [Google Scholar]
- Bäck T. Evolutionary algorithms in theory and practice: evolution strategies, evolutionary programming, genetic algorithms. Oxford: Oxford UP; 1996. [Google Scholar]
- Bargmann CI, Hartwieg E, Horvitz HR. Odorant-selective genes and neurons mediate olfaction in C. elegans. Cell. 1993;74:515–527. doi: 10.1016/0092-8674(93)80053-h. [DOI] [PubMed] [Google Scholar]
- Beer RD. On the dynamics of small continuous-time recurrent neural networks. Adapt Behav. 1995;3:469–509. [Google Scholar]
- Beer RD. Toward the evolution of dynamical neural networks for minimally cognitive behaviors. In: Maes P, Mataric M, Meyer J, Pollack J, Wilson S, editors. From animals to animats 4: proceedings of the fourth international conference on simulation of adaptive behavior; Cambridge, MA: MIT; 1996. pp. 421–429. [Google Scholar]
- Beer RD. Parameter space structure of continuous-time recurrent neural networks. Neural Comput. 2006;18:3009–3051. doi: 10.1162/neco.2006.18.12.3009. [DOI] [PubMed] [Google Scholar]
- Brenner S. The genetics of Caenorhabditis elegans. Genetics. 1974;77:71–94. doi: 10.1093/genetics/77.1.71. [DOI] [PMC free article] [PubMed] [Google Scholar]
- Chalasani SH, Chronis N, Tsunozaki M, Gray JM, Ramot D, Goodman MB, Bargmann CI. Dissecting a circuit for olfactory behaviour in Caenorhabditis elegans. Nature. 2007;450:63–70. doi: 10.1038/nature06292. [DOI] [PubMed] [Google Scholar]
- Davis RE, Stretton AO. Signaling properties of Ascaris motorneurons: graded active response, graded synaptic transmission, and tonic transmitter release. J Neurosci. 1989;9:415–425. doi: 10.1523/JNEUROSCI.09-02-00415.1989. [DOI] [PMC free article] [PubMed] [Google Scholar]
- Dunn NA, Lockery SR, Pierce-Shimomura JT, Conery JS. A neural network model of chemotaxis predicts functions of synaptic connections in the nematode Caenorhabditis elegans. J Comput Neurosci. 2004;17:137–147. doi: 10.1023/B:JCNS.0000037679.42570.d5. [DOI] [PubMed] [Google Scholar]
- Dunn NA, Conery JS, Lockery SR. Circuit motifs for spatial orientation behaviors identified by neural network optimization. J Neurophysiol. 2007;98:888–897. doi: 10.1152/jn.00074.2007. [DOI] [PubMed] [Google Scholar]
- Ferrée TC, Lockery SR. Computational rules for chemotaxis in the nematode C. elegans. J Comput Neurosci. 1999;6:263–277. doi: 10.1023/a:1008857906763. [DOI] [PubMed] [Google Scholar]
- Ferree TC, Marcotte BA, Lockery SR. Neural network models of chemotaxis in the nematode Caenorhabditis elegans. In: Touretzky DS, Mozer MC, Hasselmo ME, editors. Neural information processing systems. San Mateo, CA: Morgan Kaufmann; 1997. pp. 55–61. [Google Scholar]
- Goodman MB, Hall DH, Avery L, Lockery SR. Active currents regulate sensitivity and dynamic range in C. elegans neurons. Neuron. 1998;20:763–772. doi: 10.1016/s0896-6273(00)81014-4. [DOI] [PMC free article] [PubMed] [Google Scholar]
- Gray J. Undulatory propulsion. Q J Microsc Sci. 1953;94:551–578. [Google Scholar]
- Gray J, Lissmann HW. The locomotion of nematodes. J Exp Biol. 1964;41:135–154. doi: 10.1242/jeb.41.1.135. [DOI] [PubMed] [Google Scholar]
- Iino Y, Yoshida K. Parallel use of two behavioral mechanisms for chemotaxis in Caenorhabditis elegans. J Neurosci. 2009;29:5370–5380. doi: 10.1523/JNEUROSCI.3633-08.2009. [DOI] [PMC free article] [PubMed] [Google Scholar]
- Liewald JF, Brauner M, Stephens GJ, Bouhours M, Schultheis C, Zhen M, Gottschalk A. Optogenetic analysis of synaptic function. Nat Methods. 2008;5:895–902. doi: 10.1038/nmeth.1252. [DOI] [PubMed] [Google Scholar]
- Lockery SR, Goodman MB. The quest for action potentials in C. elegans neurons hits a plateau. Nat Neurosci. 2009;12:377–378. doi: 10.1038/nn0409-377. [DOI] [PMC free article] [PubMed] [Google Scholar]
- Mellem JE, Brockie PJ, Madsen DM, Maricq AV. Action potentials contribute to neuronal signaling in C. elegans. Nat Neurosci. 2008;11:865–867. doi: 10.1038/nn.2131. [DOI] [PMC free article] [PubMed] [Google Scholar]
- Pierce-Shimomura JT, Morse TM, Lockery SR. The fundamental role of pirouettes in Caenorhabditis elegans chemotaxis. J Neurosci. 1999;19:9557–9569. doi: 10.1523/JNEUROSCI.19-21-09557.1999. [DOI] [PMC free article] [PubMed] [Google Scholar]
- Schnitzer MJ, Block SM, Berg HC, Purcell EM. Strategies for chemotaxis. In: Armitage JP, Lackie JM, editors. Biology of the chemotactic response. Cambridge, UK: Cambridge UP; 1990. pp. 15–34. [Google Scholar]
- Suzuki H, Thiele TR, Faumont S, Ezcurra M, Lockery SR, Schafer WR. Functional asymmetry in Caenorhabditis elegans taste neurons and its computational role in chemotaxis. Nature. 2008;454:114–117. doi: 10.1038/nature06927. [DOI] [PMC free article] [PubMed] [Google Scholar]
- Thiele TR, Faumont S, Lockery SR. The neural network for chemotaxis to tastants in Caenorhabditis elegans is specialized for temporal differentiation. J Neurosci. 2009;29:11904–11911. doi: 10.1523/JNEUROSCI.0594-09.2009. [DOI] [PMC free article] [PubMed] [Google Scholar]
- Ward S. Chemotaxis by the nematode Caenorhabditis elegans: identification of attractants and analysis of the response by use of mutants. Proc Natl Acad Sci U S A. 1973;70:817–821. doi: 10.1073/pnas.70.3.817. [DOI] [PMC free article] [PubMed] [Google Scholar]
- White JG, Southgate E, Thomson JN, Brenner S. The structure of the nervous system of the nematode Caenorhabditis elegans. Philos Trans R Soc Lond B Biol Sci. 1986;314:1–340. doi: 10.1098/rstb.1986.0056. [DOI] [PubMed] [Google Scholar]
Associated Data
This section collects any data citations, data availability statements, or supplementary materials included in this article.