Abstract
In models of temporal processing, time delays incurred by axonal propagation of action potentials play a prominent role. A preeminent model of temporal processing in audition is the binaural model of Jeffress (1948), which has dominated theories regarding our acute sensitivity to interaural time differences (ITDs). In Jeffress’ model a binaural cell is maximally active when the ITD is compensated by an internal delay, which brings the inputs from left and right ears in coincidence, and which would arise from axonal branching patterns of monaural input fibers. By arranging these patterns in systematic and opposite ways for the ipsi- and contralateral inputs, a range of length differences, and thereby of internal delays, is created so that ITD is transformed into a spatial activation pattern along the binaural nucleus. We reanalyze single, labeled and physiologically characterized, axons of spherical bushy cells of the cat anteroventral cochlear nucleus (AVCN) which project to binaural coincidence detectors in the medial superior olive (MSO). The reconstructions largely confirm the observations of two previous reports, but several features are observed which are inconsistent with Jeffress’ model. We found that ipsilateral projections can also form a caudally-directed delay line pattern, which would counteract delays incurred by caudally-directed contralateral projections. Comparisons of estimated axonal delays with binaural physiological data indicate that the suggestive anatomical patterns cannot account for the frequency-dependent distribution of best delays in the cat. Surprisingly, the tonotopic distribution of the afferents endings indicate that low CFs are under- rather than overrepresented in the MSO.
INTRODUCTION
Coincidence detectors and time delays are common ingredients in models of temporal processing. In such models, neural equivalents of cross- or autocorrelation are implemented by comparing spike trains with delayed versions of themselves or with other spike trains. A preeminent example is in binaural hearing, which affords the detection of minute time differences in the sound signals to the two ears (interaural time differences or ITDs) that contain information about the spatial properties of sound sources. Neuronal ITD-sensitivity in mammals originates in the medial superior olive (MSO). For over 50 years, one model (Jeffress, 1948) has dominated the discussion of neural mechanisms of ITD discrimination and its relationship to MSO activity. In this model a binaural cell shows a “best delay”: it is maximally active when the external acoustic delay (the ITD) is compensated by an internal delay, so that the inputs from left and right ear to the cell are coincident. Classical studies of ITD-sensitivity (Rose et al., 1966; Goldberg and Brown, 1969; Yin and Chan, 1990) provided evidence for coincidence in accord with the Jeffress model (Joris et al., 1998; Joris, 2006). Jeffress hypothesized the source of internal delays as axonal length differences. He proposed that afferent axons are systematically arranged with length gradients in opposite directions for ipsi- and contralateral inputs to an array of coincidence detectors. The result would be a systematic gradation in best delay along the binaural nucleus, and the conversion of ITDs into a spatial activation pattern along the array.
In mammals, only two studies examined the existence of delay lines anatomically. Smith et al. (1993) physiologically characterized and then labeled single afferent axons to the MSO from spherical bushy cells of the anteroventral cochlear nucleus (AVCN). They concluded that the projections to the contralateral, but not the ipsilateral MSO, display a rostrocaudal delay line configuration. Beckius et al. (1999) labeled small populations of AVCN neurons with an extracellular deposit and selected and reconstructed individual axons. Their results were similar to those of Smith et al. (1993) with the additional finding of a length gradient running in the opposite (caudorostral) direction in some ipsilateral projections. Physiologically, MSO neurons show a rostrocaudal gradient in ITD-tuning consistent with the anatomical predictions (Yin and Chan, 1990).
Despite the anatomical and physiological support, the Jeffress model is no longer universally accepted for mammals (Palmer, 2004; McAlpine, 2005; Palmer and Kuwada, 2005; Joris and Yin, 2007), while it remains unchallenged in the barn owl (Wagner et al., 2007). McAlpine et al. (1996, 2001) discovered a relationship between best delay and frequency tuning in binaural neurons, which is not necessarily contradictory to the Jeffress model but which certainly is not predicted by it. Moreover, the anatomical evidence for delay lines in the mammal has been questioned (Grothe, 2003). Our purpose here is to reexamine the data of Smith et al. (1993) quantitatively and to examine the anatomical data in the light of the more recently discovered relationship between ITD-tuning and frequency tuning.
METHODS
Material
The surgical procedure, stimulus delivery, and physiological and histological methods are described in the original study (Smith et al., 1993) and are only briefly outlined here. We will focus on the quantitative, computerized processing of the fibers labeled.
The ventral brainstem was exposed in cats anesthetized with sodium pentobarbital. Sharp electrodes filled with either a 5% horseradish peroxidase (Sigma, type VI) or 2% neurobiotin (Vector Labs, Burlingame, CA) solution in 0.5 M KC1 were advanced into the trapezoid body (TB) while presenting calibrated search tones. When a fiber was isolated, the excitatory ear, the characteristic frequency (CF), spontaneous activity, and threshold at CF were determined by an automated threshold tracking program. Post-stimulus time (PST) histograms for short (25 ms) tones at CF were then obtained at different SPLs (in 10 or 20 dB steps) usually up to 50–60 dB above threshold. Intraaxonal impalement was achieved with current pulses or electrode advancement, followed by confirmation of the physiological responses. HRP or neurobiotin were then injected by iontophoresis. After 24–36 hours, a lethal dose of sodium pentobarbital was given and the animal was perfused transcardially with phosphate-buffered gluteraldehyde/paraformaldehyde fixative.
For preparation of HRP-filled axons, frozen or vibratomed 60 or 70 μm sections of the brainstem were processed using the DAB nickel-cobalt intensification method (Adams, 1981). For preparation of neurobiotin-filled cells, the sections were washed in 0.1 M phosphate buffer, incubated for 20 minutes in 0.5% H2O2, rinsed in phosphate-buffered saline, and left overnight in phosphate buffer containing avidin-biotin-HRP reagent (ABC kit, Vector Labs). The sections were then rinsed in buffer; treated with DAB (as above), mounted on glass slides, counterstained with cresyl violet and coverslipped.
Reconstructions and Analysis
Because the axons typically extended over many coronal sections, detailed analysis and 3D reconstructions required computer reconstruction. We used a Neurolucida system (Microbrightfield, Inc., Colchester, VT) that included an Olympus BX61 light microscope, a video camera (MBF-CX9000; Microbrightfield, Inc., Colchester, VT), a motorized stage controller (MAC5000; Ludl Electronic Products Ltd., Hawthorne, NY), and a personal computer. Axons were traced and digitized directly on the microscope using a UPlanFLN 40× objective. The (x,y,z) positions accompanied with axon diameter were collected every 1.9 μm on average (538 points/mm). Section thickness measured with the microscope z-axis ranged from 20 to 25 μm. Corrections were made for shrinkage along this axis (i.e. the rostrocaudal direction) according to the section thickness specified during cutting and the thickness measured in the microscope. Estimates of axon diameter were made by adjusting the diameter of a circular cursor to the width of the labeled axon, and do not include the myelin sheath. For several reasons, stated in Smith et al. (1993), these measurements should be regarded as coarse estimates.
The furthest distal points that could be traced were defined as endpoints (EPs; for ease of reading we use the full words in the text and the abbreviations in Figures). These points are not identical to terminals: the darkness of the label typically decreased with distance from the injection site and towards the middle of the sections, so that the finest processes could not always be followed to unambiguous terminations. Moreover, all of the reconstructions analyzed here were done with the light microscope so we cannot be sure that the afferent end points terminate at a synapse. However, we have analyzed a small number of the labeled axons with the electron microscope and the afferent terminals were confirmed to be presynaptic (Smith et al., 1991; Smith et al., 1993). Also, comparison with Beckius et al. (1999) (see RESULTS) suggests that our tracings must have covered the axons almost in their entirety in many cases. Importantly, the sheet-like mammalian MSO has limited thickness and the delay line configuration is thought to span the rostrocaudal dimension: the main contributors to differential length are not the terminal axonal segments but rather the more proximal main stem of the axon which gives off branches at different rostrocaudal positions (e.g. Figs. 2C,3). Assessment of collateral length differences along the rostrocaudal axis thus does not hinge on complete filling to the axon terminals.
Fig. 2.
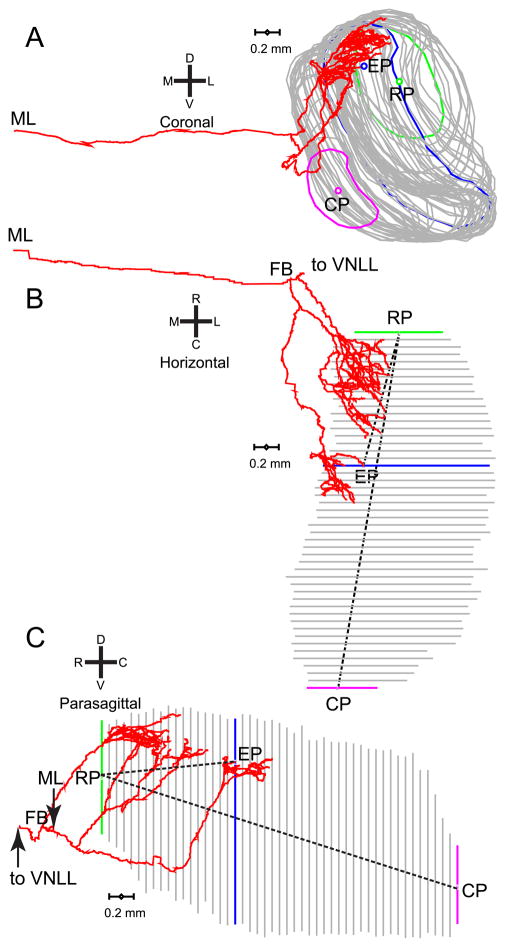
Example of the contralateral MSO innervation by one axon (same axon as in Fig. 1). Coronal (A), horizontal (B), and parasagittal (C) views are shown. The rostral pole (RP) and caudal pole (CP) were defined as the geometrical center of the most rostral (green line) and most caudal (magenta line) section, respectively. The rostrocaudal position of endpoints was quantified by measuring the Euclidian distance (dashed line) between RP and EP, and was normalized to the distance between RP and CP. The endpoint illustrated is the same one as in Fig. 1; the MSO contour outlined in that figure is shown in blue here. ML indicates the point at which the axon crosses the midline. FB is the first branchpoint, i.e. the last common point for all collateral branches innervating the MSO. CF of this fiber was 1345 Hz. A computer reconstruction of this fiber was also shown in Smith et al. (1993), Fig. 4.
Fig. 3.
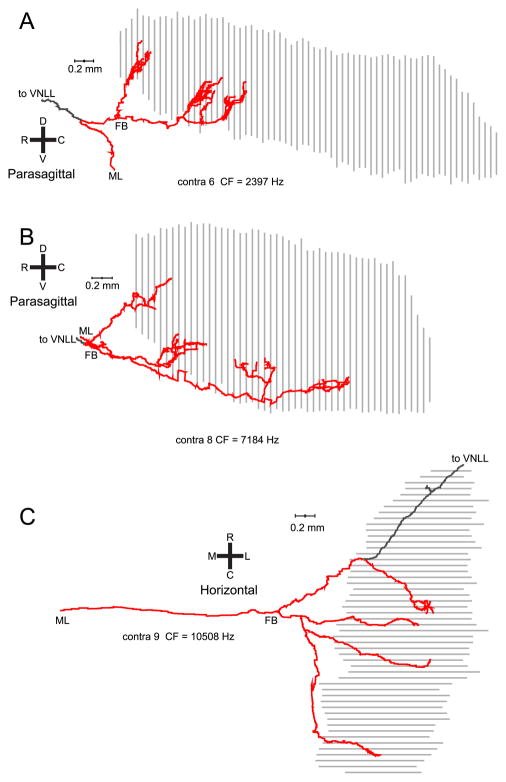
Delay line configuration in 3 contralaterally projecting fibers. Panels A and B are projections on a parasagittal plane; panel C on a horizontal plane. CFs are indicated. Branches that end within the MSO are indicated in red.
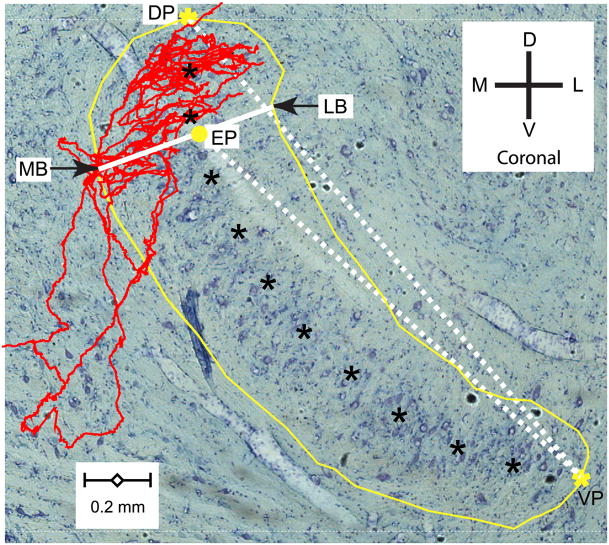
We defined several markers to take measurements for numerical analysis. Figure 1 illustrates markers defined within single sections. The yellow line traces the MSO contour and the black asterisks its long axis within the section. The yellow asterisks indicate the dorsal pole (DP) and ventral pole (VP). These are not necessarily literally the extreme dorsal and ventral points of the MSO outline in that section. For example, the ventral pole in Fig. 1 is not the most ventral point of the MSO. Rather, dorsal pole and ventral pole are the extreme ends of the – often curved – long axis of the MSO within the section. The yellow disk marks one endpoint. To express the dorsoventral location of an endpoint within the MSO, we measured its Euclidian distance to the ventral pole, which we normalized to the Euclidian distance between dorsal pole and ventral pole (dotted white lines in Fig. 1). Normalization facilitates comparison across animals as it reduces variance resulting from differences in absolute dimensions of the MSO. Values close to 1 indicate an endpoint located close to the dorsal pole; values close to 0 indicate a position close to the ventral pole. We also measured the mediolateral location of endpoints based on their distance to the edge of the MSO outline, taken at the intersection of the outline with a line (solid white line in Fig. 1) that is approximately orthogonal to its long axis. These intersections give 2 measurements for each endpoint: the medial border (MB) and the lateral border (LB). These latter measurements are inherently coarse, particularly for endpoints close to the dorsal or ventral pole of the MSO. Again we normalized the ML position as the (Euclidian distance between endpoint and medial border)/( Euclidian distance between lateral border and medial border). When this value is close to 1, the endpoint is located close to the lateral border.
Fig. 1.
Illustration of measurements taken within sections. Coronal view of the contralateral projection of a traced fiber (characteristic frequency, CF = 1345 Hz) superimposed on a Nissl-stained single section, taken at the coronal level of the branch endpoint (EP) indicated with the yellow dot. Yellow line: contour of MSO on the section. Yellow asterisks: most dorsal point (dorsal pole: DP) and most ventral point (ventral pole: VP) along the long axis of the MSO within the section, which is indicated with black asterisks. Drawing a line through EP which is approximately perpendicular to the long axis of the MSO, the arrows show the most medial and lateral points (MB and LB) of the MSO contour on this line. The two other lines (dotted white) indicate the Euclidian distances between EP and VP, and between VP and the DP of this section. The scalebar on the bottom shows 200 μm. Dorsal (D), ventral (V), medial (M), and lateral (L) directions are indicated by the cross.
Measurements taken across sections are illustrated in Fig. 2 in the coronal (A), horizontal (B), and parasagittal (C) plane, for the same fiber used in Fig. 1. First, the most rostral and most caudal sections where the MSO could be discerned are identified. The geometrical centers of the MSO outlines in these sections (green and magenta in Fig. 2A) were designated as the rostral pole (RP) and caudal pole (CP). The normalized rostrocaudal (RC) distance of an endpoint relative to these poles was measured as (Euclidian distance between endpoint and rostral pole)/( Euclidian distance between caudal pole and rostral pole), illustrated with the dotted lines (Fig. 2B,C). An endpoint close to the caudal pole thus gives an RC value close to 1. For contralateral projections, we also marked the point where the axon crossed the midline (ML). Finally, for both ipsi- and contralateral projections we marked the first branchpoint (FB), i.e. the last point of the axon that is common for all branches to the ipsi- or contralateral MSO (Fig. 2B,C). The axonal length from midline or first branchpoint to each endpoint was calculated as the sum of the distances between adjacent (x,y,z) coordinates in the course of the axon to that endpoint.
For the sake of brevity, we use the shorthand “delay line” to refer to a morphological pattern of systematic length differences in axon collaterals. We caution that the term inherently refers to a functional concept which can only be validated with physiological measurements – a point to which we will return in DISCUSSION.
RESULTS
The material we analyzed here consists of 14 labeled fibers, obtained from 12 animals. We reconstructed the 16 projections (9 contralateral, 7 ipsilateral) reported in Smith et al. (1993). For only 2 fibers (with CFs of 1498 Hz and 2470 Hz) were both contra- and ipsilateral projections sufficiently labeled for reconstruction. A qualitative description of the course and projections of the fibers is provided in Smith et al. (1993) and is summarily illustrated here for several fibers. We identify projections with the same number, symbol and color scheme in all figures, where relevant.
Contralateral projections
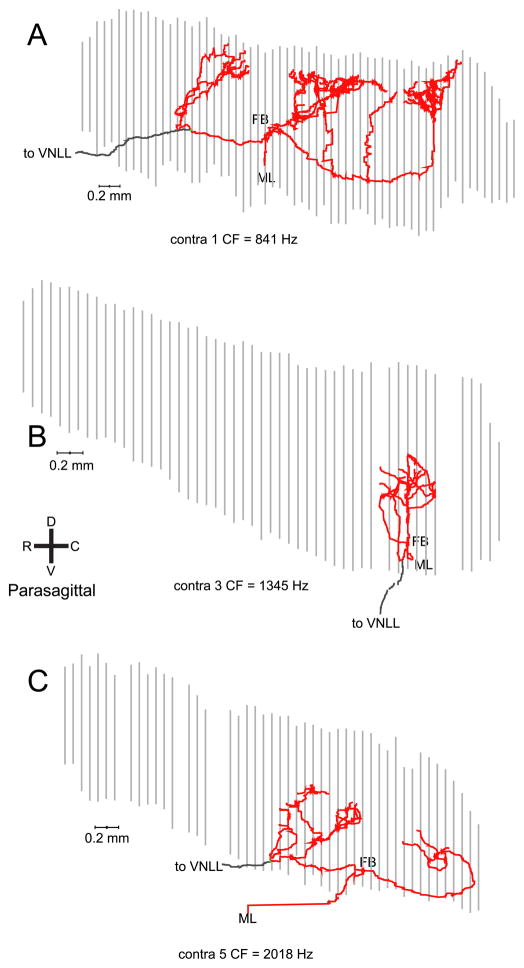
Nine contralaterally-injected fibers were well labeled and used for the analyses. The axon in Fig. 2 crossed the midline at a level rostral to the MSO, and projected multiple collateral branches caudally before heading rostrally towards the ventral nucleus of the lateral lemniscus (VNLL). The collateral projections span approximately half of the rostral-caudal extent of the MSO nucleus with a ladder-like branching pattern that is particularly clear in the parasagittal view (Fig. 2C). Similar innervation patterns are shown for 3 fibers in Fig. 3. The axons in Fig. 3A,B also cross the midline in a rostral position and give caudally directed branches over a more restricted (A) or less restricted (B) rostrocaudal distance than in Fig. 2. The axon in Fig. 3C, shown in horizontal view, crosses the midline at a more caudal level. It shows 3 branches that are directed to the central and caudal MSO, as well as one branch that is directed rostrally and which does not seem to fit the caudally directed delay line patterns of the fibers discussed so far. A similar case is shown in parasagittal view in Fig. 4A. The axon also crosses the midline at a rostrocaudal position which bisects the MSO in approximately equal halves. It shows a number of caudally directed collateral branches with increasing length, but also a branch which innervates the rostral half of the MSO and which continues on toward the VNLL. Fibers that reach the MSO at an even more caudal position are shown in Fig. 4B,C. The fiber in panel B has a rostrocaudally restricted field. The axon in panel C shows no obvious bias toward increasing length for more caudally projecting collaterals.
Fig. 4.
Parasagittal view of 3 more contralateral projections with a less clear cut delay line configuration. In all cases, the first branchpoint (FB) is located near the center of the rostrocaudal range of EPs. The orientation shown in panel B applies to all panels. The color convention is as in Fig. 3.
Ipsilateral projections
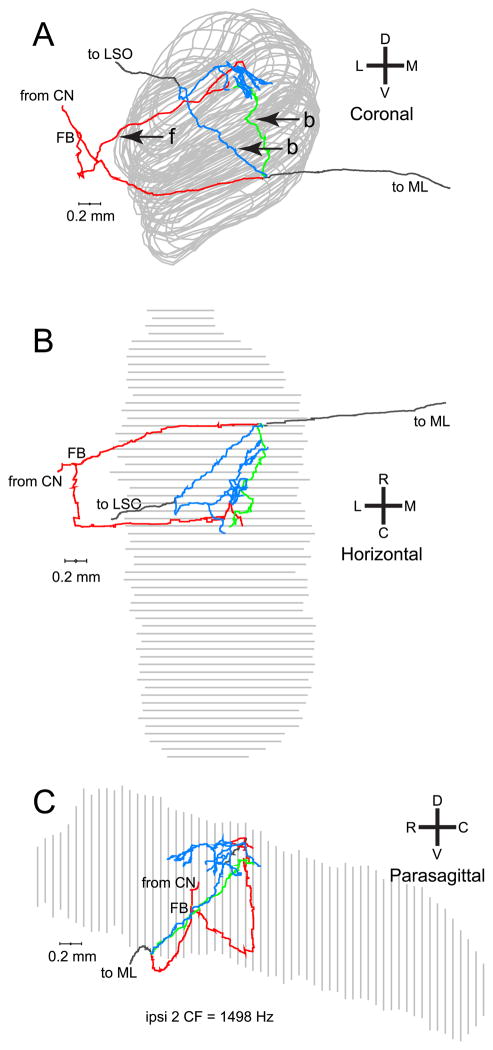
Seven ipsilaterally-injected fibers were adequately labeled for our analyses. Because the pattern of the ipsilateral projections is more complicated than that of the contralateral projections described above, we show the projections in different views. The fiber illustrated in Fig. 5 had several collaterals without an obvious delay line pattern. Two types of collateral projections can be distinguished: forward and backward. The coronal view (Fig. 5A) shows one branch coursing along the lateral aspect of the MSO (forward innervation, f), consistent with the known segregation of ipsi- and contralateral inputs to the lateral and medial dendrites of MSO neurons, respectively (Stotler, 1953). Two more collaterals only branch off from the main axon after it has crossed underneath the MSO, to then loop back through the MSO to innervate the same region (backward innervations, b). These branches have their origins medial to the ipsilateral MSO. All of the seven ipsilateral projections had “backward” components; four of the seven ipsilateral projections had “forward” components (see summary in Fig. 10B).
Fig. 5.
Coronal (A), horizontal (B), and parasagittal (C) views of a reconstructed projection of one fiber to the ipsilateral MSO. The coronal (A) and horizontal (B) views clearly show the two kinds of ipsilateral branches. One branch originates lateral to the MSO and projects “forward” to it (label “f”, red). Two branches originate after the axon has crossed the plane of the MSO and looped “back” (label “b”, blue and green) to innervate the same region.
Fig. 10.
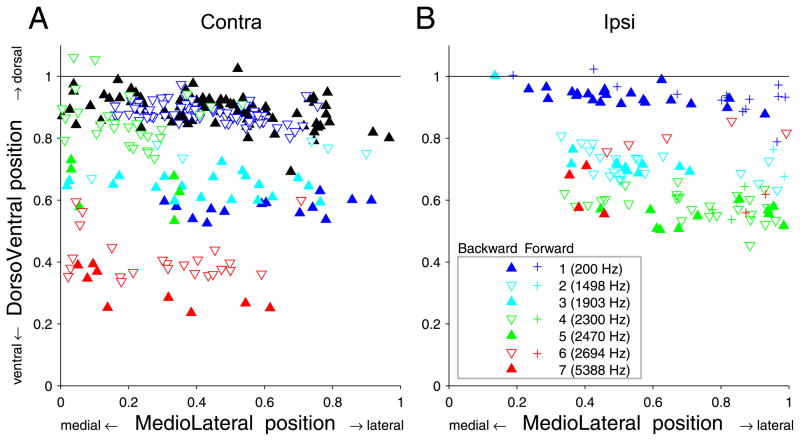
Distribution of endpoints in the coronal plane, for contra- (A) and ipsilateral (B) projections. Symbol use for (A) is as in Fig. 8. The “Backward” and “Forward” in the legend for (B) refer to backward and forward branches, as illustrated in Figs. 5,6.
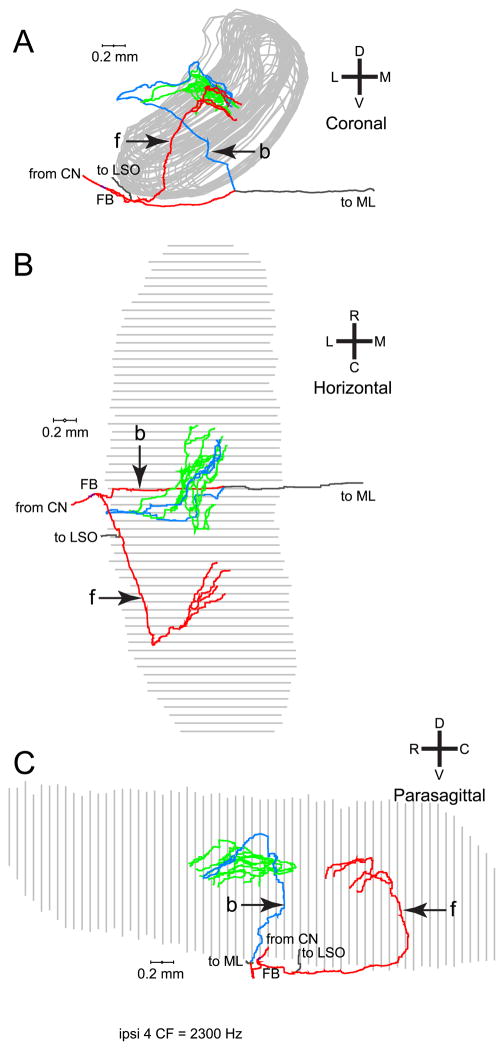
Figure 6 shows another example of an ipsilateral projection. In this case, the forward and backward innervation contribute endpoints that are located at different rostrocaudal positions (Fig. 6B,C), where the backward branches innervate a more rostral part of the MSO than the forward branches. The horizontal and parasagittal views suggest that this fiber has greater length in its caudal than in its rostral innervation, but the complex course of the branches in the 3 dimensions precludes a simple visual assessment. In fact, length measurements reveal greater length in the rostral than in the caudal innervation (Fig. 8D, green inverted triangles).
Fig. 6.
Another example of an ipsilateral MSO projections of one fiber. This fiber ran underneath the MSO (A, coronal view) and also formed forward (f) and backward (b) projecting branches. The horizontal (B) and parasagittal (C) views reveal that the branches innervate different rostrocaudal portions of the MSO. The backward branches (green and blue) innervated a more rostral portion of the MSO and covered more length of axon from FB than the forward branches.
Fig. 8.
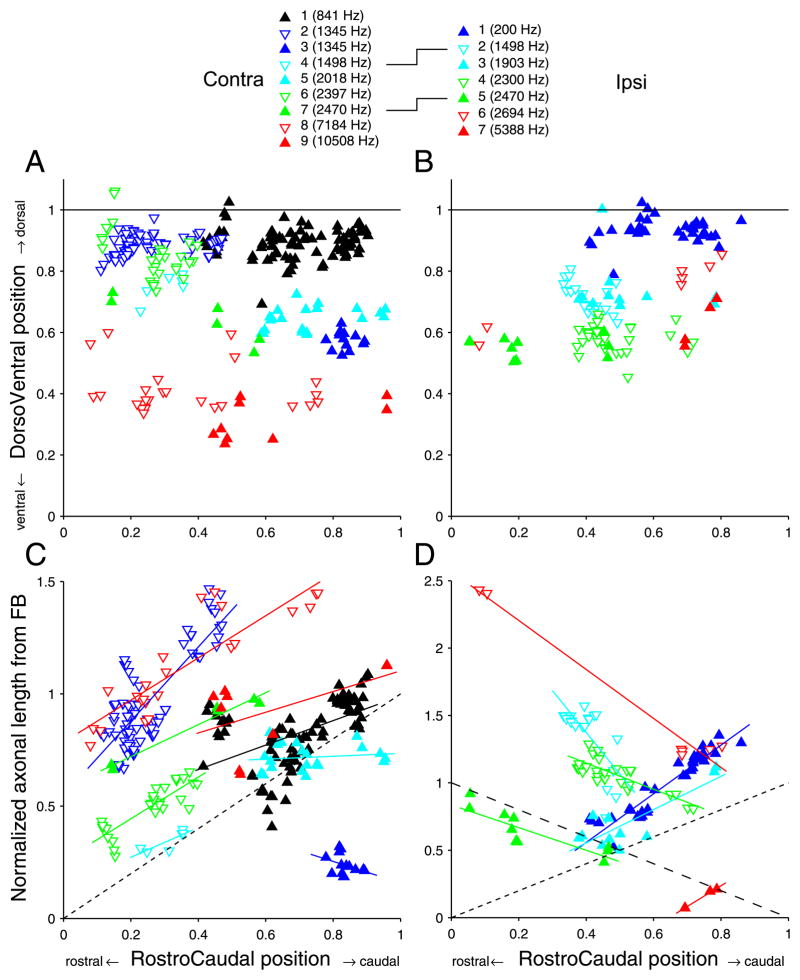
Length gradients along the rostrocaudal axis of the MSO. A,B: Distribution of endpoints of contra- (A) and ipsilateral (B) projections on normalized MSO axes. C,D: Axonal length from FB to the different endpoints. Solid lines are linear regressions. The diagonals with short dashed lines indicate the diagonal of equality; the diagonal with the long dashed lines indicates the slope expected for an opposite length gradient. The caption shows the symbols and color used for the endpoints originating from the different fibers, numbered for increasing CF and reused in subsequent figures. The lines between left and right symbol captions indicate the two fibers for which both the contra- and ipsilateral projections were reconstructed.
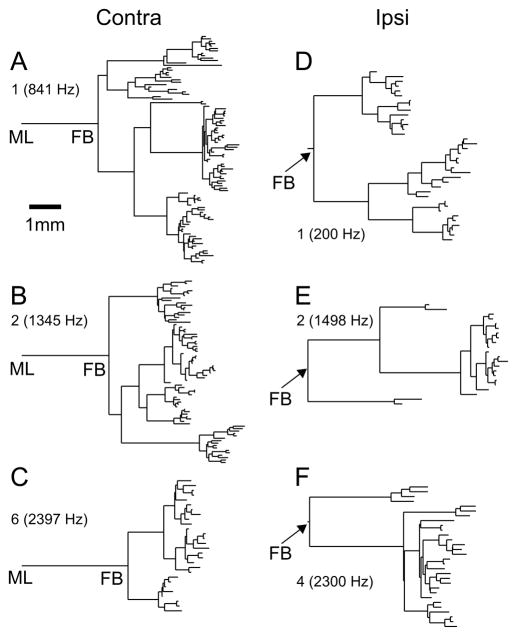
Dendrograms
Because branches often extensively overlap in the projections of the computer reconstructions in Figs. 1–6, these views do not give an adequate representation of the complexity of branching. Fig. 7 gives an overview, for the most completely filled fibers, of the sequence of branchings in contra- (left column) and ipsilateral (right column) projections. The horizontal axis indicates the length of segments bordered by midline, branchpoints, or endpoints. The vertical axis only serves to offset the different segments after branching: it does not have the physical meaning of length, and there is no vertical sorting according to position in the MSO. The dendrograms therefore provide information qua branch sequence and length (abscissa), but they contain no anatomical directional information (such as lateral vs. medial, dorsal vs. ventral, rostral vs. caudal). There is obviously profuse branching in both contra- and ipsilateral projections. Considering the branching after the first branchpoint, the ipsilateral projections show longer (> 1 mm, see scale bar in Fig. 7A) segments than the contralateral projections before further branching. These long segments are the stems of the forward and backward branches, e.g. in Figs. 5,6. As a result, the longest distances between first branchpoint and endpoint are found in ipsi- rather than in contralateral projections. Comparison of the horizontal location of the endpoints within each dendrogram indicates the range of overall length differences within projections. It is of note that this range is a few mm for most projections (Fig. 7A,B,C,F), and that the largest ranges occur in ipsilateral projections (Fig. 7D,E).
Fig. 7.
Dendrograms showing the branching pattern and length of axonal segments for 3 contralateral (A) and 3 ipsilateral projections (B). The scale bar in A applies to panels A–F. The horizontal dimension represents the axonal length of branch segments; the vertical dimension is only used to offset these segments and has no meaning qua length or order. Fiber number and CF are indicated for each projection. Cross linking to previous figures with computerized reconstructions is as follows: A = Fig. 4A; B = Fig. 1 and 2; C = Fig. 3A; D = Fig. 5 of Smith et al. (1993); E = Fig. 5; F = Fig. 6.
Distribution of endpoints in the parasagittal plane
Fig. 8 shows the distributions of endpoints for contralateral (left column) and ipsilateral (right column) projections. Endpoints from one fiber are identified with the same colored symbol. The figure caption ranks the fibers by increasing CF. The two fibers for which both contra-and ipsilateral projections were reconstructed are represented by the same symbols in left and right column: projections contra 4 and ipsi 2 (light blue inverted triangle, CF=1498 Hz) and projections contra 7 and ipsi 5 (solid green triangle, CF=2470 Hz). In all panels, the abscissa is the normalized rostrocaudal position of the endpoints, measured as illustrated in Fig. 2 (virtually identical results are obtained if the distance along the z-axis, i.e. the distance between coronal sections, is used). The ordinate of the top two panels is the normalized dorsoventral position of the endpoints, measured as illustrated in Fig. 1. These two panels therefore represent a standardized sideview of the MSO. As expected, the endpoint positions are orderly arranged with low CF fibers most dorsal and high CF fibers most ventral (this is further analysed in Fig. 9). The endpoints of a given fiber tend to be distributed in an elongated rostrocaudal strip. This is particularly the case in contralateral projections (A) and less so in ipsilateral (B) projections, which can be elongated (projection 1), restricted (projection 7), or patchy (projection 6). In contralateral fibers, seven of the nine fibers showed a broad rostrocaudal extent, spanning 40 to 60% of the nucleus, but importantly none of the fibers spans the entire nucleus.
Fig. 9.
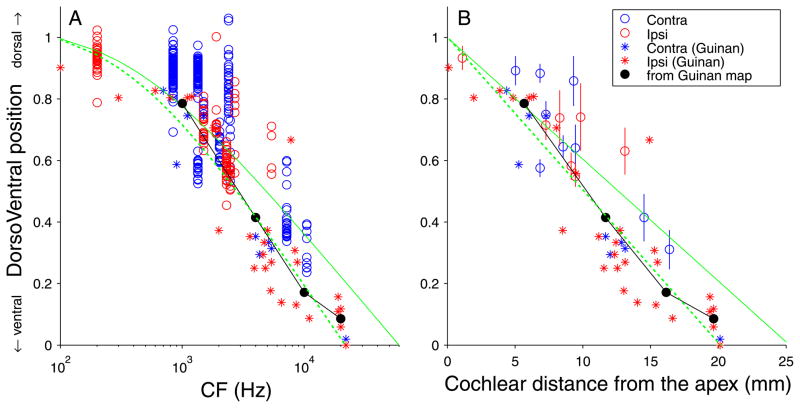
Tonotopic compression of low frequencies in MSO. The dorsoventral (DV) location, normalized to the dorsoventral extent of the MSO, is shown for all endpoints (A) of all reconstructed fibers on a logarithmic CF abscissa, and (B) for their mean and standard deviation on a cochlear distance abscissa. Each circle in A indicates a single endpoint (blue: contralateral fiber, red: ipsilateral fiber). The asterisks and the black circles and line show extracellular and summary data from Guinan et al. (1972) (see main text). The green lines are predicted relationships based on the cochlear tonotopic map, based on Greenwood’s formula. The solid green line is the prediction for a full representation of all CFs; the dashed line is for a representation limited to 22 kHz and below. The endpoints at low CFs cluster above the green lines. If low CFs were overrepresented in MSO, those endpoints would be expected to cluster below rather than above the green lines.
The bottom panels show the key measurement: the axonal length accumulated between the first branchpoint for the projection from that side, and the endpoints. For contralateral projections (Fig. 8C), this length tends to increase for endpoints positioned more caudally in the nucleus. The solid lines are linear regressions; the dashed (black) line is the diagonal of equality. A “perfect” Jeffress delay line configuration would generate an endpoint distribution parallel to this line: the extra length incurred (ordinate) would equal the distance travelled rostrocaudally (abscissa). For six of nine contralateral fibers, the linear regression was significant (p < 0.05), with a correlation coefficient > 0.80 in four of these six cases. The mean slope for the six cases was 0.91 (range: 0.54 – 1.65). The slope of the regression line was negative in one fiber (# 3), for which the endpoints were distributed over a narrow rostrocaudal range. In two fibers (#1 and 9), the relationship was nonmonotonic, with a rostral patch of endpoints of larger length than the endpoints just caudal to it. These are fibers whose axon crosses the midline at a rather caudal position as illustrated in Fig. 3C (# 9, CF = 10508 Hz) and Fig. 4A (#1, CF = 841 Hz).
The topography of the length distributions of ipsilateral projections (Fig. 8D) is strikingly inhomogeneous and different from the contralateral ones. The length gradient is mostly negative, i.e. in the opposite direction than the contrateral gradient (note the difference in ordinate scale between Fig. 8C and D). For comparison, the negatively sloped diagonal (large dashes) is shown, which shows the slope of a “perfect” Jeffress delay line configuration in the direction opposite to the one dominant in contralateral fibers. Linear regressions were significant for all seven fibers (p < 0.01). For two fibers (# 6 and 7) the number of endpoints is small. Surprisingly, the slope is positive in 3 fibers.
Particularly for cases where the distribution of endpoints is restricted rostrocaudally (# 7 in Fig. 8D, as well as # 3 and 4 in Fig. 8C), it is questionable that the presence of a slope in the linear regressions is of functional significance. Nevertheless, overall the length gradients are in accordance with the scheme proposed by Jeffress (1948), with a majority of contralateral projections showing a rostrocaudal increase in collateral length, and a majority of ipsilateral projections showing an inverse gradient.
Interestingly, fibers tend to project to either the rostral or caudal half of the MSO, particularly on the contralateral side (Fig. 8A,B, with the exception of the fibers indicated by the empty red triangles). Moreover, the length gradients most consistent with a Jeffress delay configuration are found in the rostral half, both in the contra- and in the ipsilateral branches.
Note that only the slope of the regressions is relevant to the issue of delay lines, not the vertical offset on the ordinate. This offset reflects our (arbitrary) choice of the first branchpoint as the point of reference for the length measurement, and is affected by the absolute length of the collateral branches. A branch that is longer than the rostrocaudal MSO dimension has endpoints with ordinate values > 1, as is the case for several contralateral and many ipsilateral projections. However, addition of an identical length of axon to all collateral branches (see below on calculation of differences in path length between ipsi- and contralateral projections) moves all datapoints of a projection up along the ordinate without affecting the presence or absence of a rostrocaudal delay.
Tonotopic distribution along the dorsoventral axis
The rostrocaudal clustering of endpoints (Fig. 8A,B) allows us to project a map of input CFs onto the MSO. Fig. 9 shows the relationship between fiber CF and the normalized dorsoventral position of all endpoints. The endpoints contributed by one fiber are shown as a column of circles in Fig. 9A, color-coded for laterality. The asterisks show datapoints taken from the physiological data of Guinan et al. (1972, their Fig. 17). The solid circles and line show the position of the borders drawn in the summary tonotopic map of that paper (their Fig. 21), at CFs of 1000, 4000, 10000, and 20000 Hz. There is a reasonable agreement between our data and those of Guinan et al. (1972). Much to our surprise however, there is an upward convexity in the CF – position relationship. If low CFs were to take up a disproportionate amount of space of the MSO, relative to a logarithmic CF distribution, the relationship should be concave rather than convex: if one were to progress from dorsal MSO in a ventral direction and plot CF, there would initially be “slow” progression in CF, which would accelerate as one comes closer to the ventral pole. This is clearly not the case.
Because the cochlear map deviates from a logarithmic relationship at low CFs, we incorporate the CF – position relationship for the cochlea in the abscissa of Fig. 8B, using Greenwood’s equation (Liberman, 1982; Greenwood, 1990). The means and standard deviations of endpoint positions and the datapoints of Guinan et al. (1972) are replotted directly on a cochlear distance scale in Fig. 9B. The datapoints again show an upward convexity. Predictions of the MSO CF – position relationship are now straight lines (green). The solid green line shows the relationship expected if all cochlear CFs were represented proportionally in the MSO: at low CFs, the datapoints tend to lie above this line. Another factor to take into account is that not all cochlear CFs appear to be represented in the MSO: the highest CF reported by Guinan et al. was 22 kHz. The dashed green line in Fig. 8 shows the CF – position relationship expected if the cochlea were proportionally represented in the MSO except for its base, so that CFs > 22 kHz are absent (~ 5 mm of the extreme base). Clearly, consideration of a limited CF representation does not alleviate the upward convexity. The prediction based on a limited CF range follows the slope of the map Guinan et al. reasonably well, but again the representation of the cochlear apex is compressed for our data, with the majority of low-CF datapoints lying above the dashed line.
The MSO tends to show curvature in the coronal plane (Figs. 1,2,6), and this curvature can be more pronounced at the dorsal pole (Fig. 1). Because our measure of dorsoventral location does not take curvature into account, we recalculated the dorsoventral positions in Figs. 8,9,10 taking the Euclidean distance of the endpoint to the ventral pole (as before), but now normalized to the sum of the distance of the endpoint to the ventral and dorsal pole (i.e. the normalization was now to the sum of the line segments EP-VP and EP-DP). This recalculation caused only minor shifts in ordinate position and did not remove the bias of low-CF datapoints above the green lines in Fig. 9A,B.
Distribution of endpoints in the mediolateral dimension
Fig. 10 shows the normalized mediolateral vs. dorsoventral distribution of endpoints. As commented in METHODS, determination of the mediolateral endpoint position is inherently inaccurate. Relative to its small width, the medial and lateral border of the MSO can not be determined with much precision (note that, on the square axes of Fig. 10, the mediolateral dimension is much magnified relative to the dorsoventral dimension, roughly by a factor 3.6). The uncertainty becomes particularly large for endpoints located close to the dorsal or ventral pole. This is visible in Fig. 10: the mediolateral spread of points increases towards the dorsal pole. Nevertheless, as expected (Stotler, 1953), the contralateral endpoints occupy dominantly a medial position, and the ipsilateral endpoints a lateral position. Of interest is that the “forward” and “backward” branches of the ipsilateral projection seem to occupy the same dorsoventral (tonotopic) but not mediolateral position. For the 4 fibers showing forward branches (see legend: + symbols), these branches give endpoints located more lateral than the backward branches (projections 2,4,6).
Axon diameter and conduction velocity
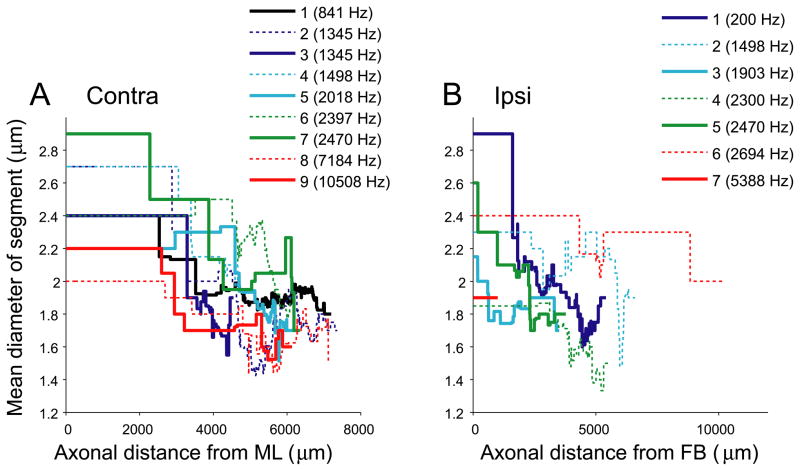
The analysis so far concerned branching patterns, endpoint position, and axon length. Other factors than axonal length contribute to the time delay in action potential propagation; most importantly myelination, axon diameter, and internodal distance. The only additional factor we can assess in our material is axon diameter, be it only crudely for the various reasons pointed out in Smith et al. (1993). Diameters were measured at each axonal (x,y,z) position entered. Using these measurements, we calculated the mean diameter of each “segment”, which is the part of an axon between neighboring branchpoints; branchpoints and endpoints; or midline and branchpoint. Fig. 11 shows the mean diameter as a function of distance from the midline (A) for contralateral projections, and from the first branchpoint (B) for ipsilateral projections. These graphs are obtained by moving from left to right across the dendrograms (Fig. 7) and tallying and averaging all the segment diameters that are present for a given length from the starting point (ML as in Figs. 2–4; or FB as in Figs. 5–6). Close to the starting points, the mean diameter jumps in large steps because few branches are present, but the trace becomes smoother as more branching occurs. There is a general decrease in axon diameter towards the endpoints.
Fig. 11.
Average axon diameters decrease as a function of distance from the midline (A: contralateral projections) or from the first branchpoint (B: ipsilateral projections).
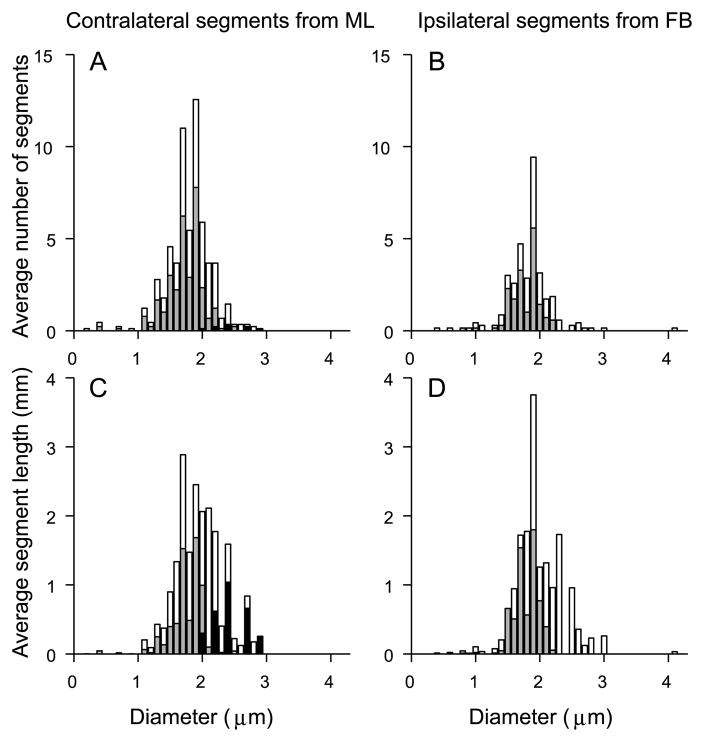
To compare diameters of contra- and ipsilateral branches, we first determined the number of segments of a given diameter (binsize 0.1 μm). Divided by the number of contributing fibers (9 for contra- and 7 for ipsilateral projections), we obtain the average numbers shown in Fig. 12A,B. The diameters are largely between 1 and 3 μm; the mean is 1.8 μm for both distributions (t-test, p = 0.27). For the contralateral projections, the axonal segments include all segments of projections into the contralateral MSO arising after the midline crossing, while for the ipsilateral projections they include all segments projecting into the ipsilateral MSO after the first branchpoint. The reason that we included the “extra” segment between midline and first branchpoint in the contralateral projections is that the midline gives an “absolute” reference that can be identified in each animal and which allows an estimate of path length for the axon in the contralateral hemibrain. These proximal segments are shown in black in Fig. 12A,C. Removal of these segments did not affect the lack of statistical significance between the diameter distributions of contra- and ipsilateral projections (p = 0.13).
Fig. 12.
Distribution of axon diameters does not differ between contralateral (A,C) and ipsilateral (B,D) projections. The top histograms show the average number of segments with a given diameter (0.1 μm bins); the bottom histograms show the corresponding average length (mm) at that diameter. All histograms are averages calculated for the entire population of contra- and ipsilateral fibers, normalized to the total number of fibers included. The starting segment were ML (contralateral fibers) and FB (ipsilateral fibers). White bars include all the segments from starting segment to endpoints. Gray bars show length of most distal segments, terminated by endpoints. Black bars show length of most proximal segments which contain ML (contralateral fibers only).
Numerically, the final segments, shown in grey in Fig. 12, dominate the histograms, due to the profuse branching once the collaterals reach the tonotopic layers where they form their endpoints. Because the axons progressively taper (Fig. 11) and much of the delay must accrue at the distal branches, it is of interest to compare contra- and ipsilateral distributions for the final segments. Again there is no difference in the distributions for contra- and ipsilateral fibers (p = 0.26).
Next, to visualize the relationship between diameter and length of segments, we summed the lengths for all segments with a given diameter for all fibers (binsize 0.1 μm), and normalized to the number of contributing fibers (9 for contra- and 7 for ipsilateral projections). Thus, Fig. 12C, D show average segment length of a given diameter for contralateral and ipsilateral projections, respectively. Statistical comparison shows that at none of the bins for which both contralateral and ipsilateral values are present is there a significant difference in segment length (t-test, p > 0.05).
From the axon diameter and length, estimates for conduction speed and time can be calculated. We followed the method of Beckius et al. (1999) to estimate conduction time as
| (1) |
with L being the length (mm) of axon between two branchpoints, d being the average diameter (μm) of that segment, and RV being an experimentally derived constant (9.167 mm·ms−1·μm−1)(Waxman and Bennett, 1972). For each endpoint, the conduction times of all segments interposed between that endpoint and a fixed starting point were added.
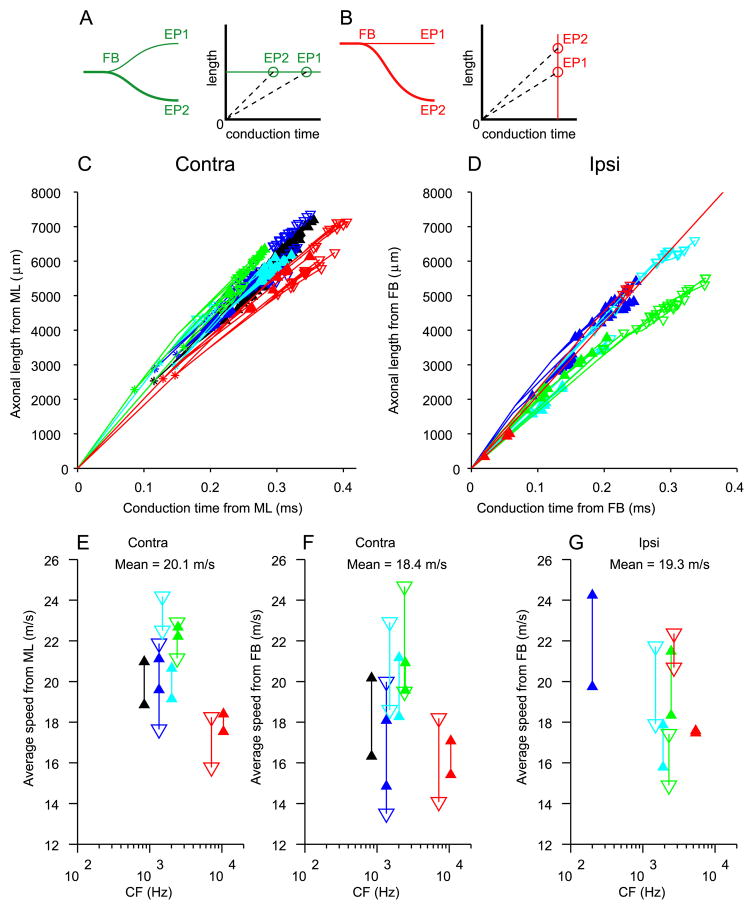
In Fig. 13 we show the estimated conduction times for all endpoints using as starting points the midline (panel C, contralateral projections) or the first branchpoint (panel D, ipsilateral projections), against the length of axon traversed to reach these endpoints. The relationship is very orderly: in all fibers, linear regression (not shown) of length on conduction time was significant (p < 0.001; p < .01 in one fiber). This result is not surprising and may seem trivial because of the proportionality of estimated conduction time to length in Eq. 1. However, if the average diameter to reach one endpoint were larger than that to reach another endpoint of the same tree, the conduction time would be shorter even if the average length were the same (Fig. 13A). Likewise, there could be a length difference that is compensated by a difference in axon diameter (Fig. 13B). The linear distributions of endpoints in Fig. 13C,D show that d (Eq. 1) is “well-behaved” in the sense that diameter decreases similarly with distance in all branches and that there is no systematic effect of diameter which offsets or enhances the “delay line effect” of the branching pattern. The slope of the linear regressions (not shown) was on average 19.3 m/s for the contralateral and 17.9 m/s for the ipsilateral projections (ranges: 14 – 26 m/s for contra, 13 – 21 m/s for ipsi). Note that these slopes do not give conduction speeds, but rather the speed at which excitation would “sweep” through the endpoints. If all endpoints were arranged in an orderly fashion as in Jeffress’ model, so that the endpoints with the shortest axonal length were located e.g. most rostrally and those with the longest length most caudally, the range of conduction times spanned by the endpoints of one axon would equal the range of its x-values in Fig. 13C,D (e.g. 220 to 350 μs for the contralateral projection (#1) represented by the black triangles in panel C, i.e. a range of 130 μs). However, as already shown in Fig. 8C,D, the arrangement of endpoints is not that orderly. Again taking projection #1 as an example, it can be seen in Fig. 8C that endpoints with similar axonal length occur over a significant rostrocaudal range. We return to this point below (Fig. 14).
Fig. 13.
Axonal length is linearly related to estimated conduction time. Axonal lengths are measured as in Figs. 7 and 11. Conduction time for each endpoint is the sum of conduction times of all segments leading up to that endpoint, calculated from segment length and diameter (see text). Cartoons in A and B illustrate configurations that would result in non-sloping relationships. C: length and time for contralateral projections, using midline (ML) as reference point. D: length and time for ipsilateral projections, using FB as reference point. One outlying endpoint is clipped off. E–F: estimated average conduction speeds for all endpoints. This is the slope of the lines connecting the endpoints in C,D with the origin at (0,0), as illustrated with the dashed lines in A,B. Reference point at (0,0) was ML (E) or FB (F,G). Color code and symbols are identical to Figs. 8 and 10. The symbols indicate the lowest and highest speed for the endpoints of a given fiber.
Fig. 14.
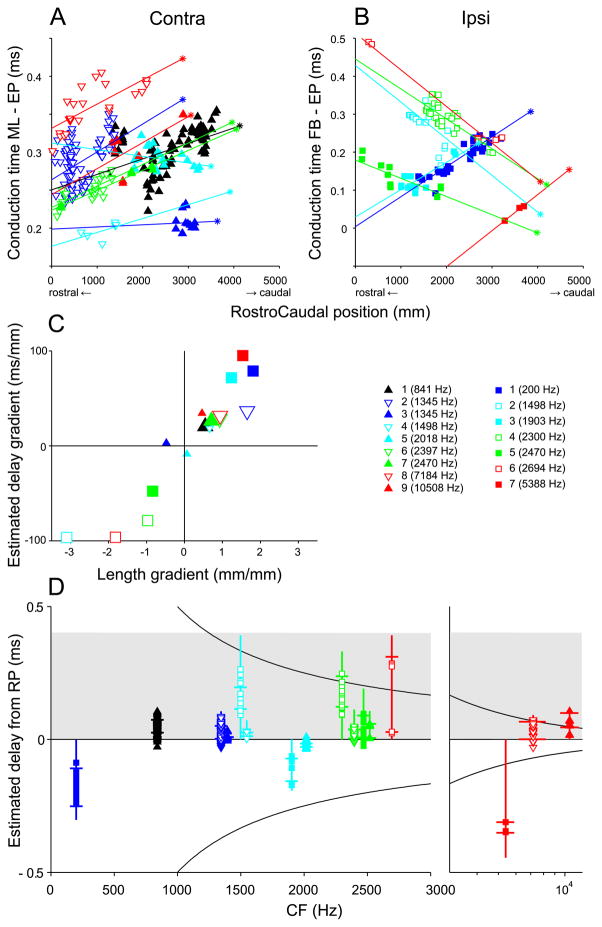
Rostrocaudal gradients of conduction time. A,B: Relationship between estimated conduction time and location of EP in rostro-caudal dimension in contralateral (A) and ipsilateral (B) fibers. The abscissa is zeroed to the position of the most rostral section in which MSO could be identified and abscissa values are the distance of endpoints to that most rostral section. Ordinate values are the estimated conduction times from the midline (A, contralateral projections) or first branchpoint (B, ipsilateral projections). Solid lines are linear regressions. The asterisks at the end of each line indicate the most caudal MSO section. Note that the ordinate in B has a wider range than in A. C: Summary of regression slopes of Fig. 8A,B (abscissa) and of panels A,B (ordinate). Large symbols indicate values that are significant for both abscissa and ordinate. Contra #4 showed significance (p < 0.05) for length but not for delay; and vice versa for contra #9. D: Relationship between estimated delay and CF. The anchorpoint of each colored vertical line at 0 delay represents the RP of the MSO. The opposite end shows the extrapolated delay at the CP (corresponding to the delay accumulated between RP and the asterisk in panels A,B). The small horizontal bars show the range of delays of the linear regression over which endpoints are present. Symbols and lines at positive delays, in the shaded region, are for fibers with a pattern consistent with the trend observed by Yin and Chan (1990): these are the fibers with positive slope in panel A or negative slope in panel B. Symbols and lines at negative delays are for fibers with an opposite branching pattern (negative slope in A or positive slope in B). Hyperbolic curves indicate the π-limit, i.e. the extent of one period equalling CF−1. The scale of the abscissa is linear in the left panel and logarithmic in the right panel.
The lines in Fig. 13C,D connect starting points, branchpoints and endpoints of each projection. The slope of each line equals the speed of the corresponding segment. This slope decreases with increasing distance from the starting point due to the gradual decrease in axon diameter, and gives rise to the general curvature in the data. For each endpoint, the length traversed divided by the estimated conduction time gives an estimate of the average speed from starting point to each endpoint (this speed equals the slope of a line connecting the endpoint to the origin in panels C and D, illustrated for the cartoons in Fig. 13A,B with dashed lines). The ranges of estimated speeds are shown in panels E–G. They are similar across endpoints and CFs and are also very similar for contra- and ipsilateral fibers (means are 20.1 and 19.3 m/s, respectively), when taking midline (Fig. 13E) and first branchpoint (Fig. 13G), respectively, as starting point. When the contralateral side is also referenced to the first branchpoint rather than to the midline (Fig. 13F), the estimated conduction speed drops to 18.4 ms/s on average. This reflects the long distance (several mm) of the segment from midline to first branchpoint in contralateral fibers (Figs. 7A–C, 11A) and the large diameter of that segment (Fig. 11A), while the ipsilateral projection tends to sustain long (Fig. 7E,F) and large diameter (Fig. 11B) “forward” and “backward” segments after the first branchpoint. In summary, the overall distribution of axon diameter and its progression along the axon is similar in contra- and ipsilateral projections.
Estimates of rostrocaudal axonal delay
The main quantitative check so far regarding Jeffress’ hypothesized axonal delay lines was in Fig. 8C,D, which examined length as a function of rostrocaudal position. In a similar format, Fig. 14A,B replots the data directly in dimensions of time and space: estimated conduction time, calculated from both diameter and length, versus rostrocaudal position in μm from the most rostral MSO section. The abscissa origin coincides with the section containing the rostral pole, while the location of the section of the caudal pole is indicated by an asterisk at the caudal end of a linear regression line drawn through all the endpoints of each projection. As expected from the general trend of a graded decrease in axon diameter (Figs. 11–13), the relationships of Fig. 8C,D are preserved in Fig. 14A,B. Thus, it does not appear to be the case that afferent branch diameter is regulated to fine-tune delay lines based on length, at least not at the level of assessment of diameter that is possible with our material.
To summarize the regression data on estimated conduction times (Fig. 14A,B) and measured length gradients (Fig. 8C,D), Fig. 14C shows the slopes of the linear regressions in these figures. Abscissa values of 1 and −1 indicate “perfect” slopes of delay, where the extra length of axon is identical to the extra distance in rostrocaudal (or caudorostral) direction (cf. diagonals in Fig. 8C,D). All significant (large symbols) contralateral projections, as well as 3 ipsilateral projections, contribute data to the upper right quadrant. The datapoints in the lower left quadrant consist of ipsilateral projections only, which form a length gradient in the caudorostral direction. Note that the most extreme positive and negative values are found in the ipsilateral projections. Also of note are the rather modest values of the estimated delays. To map the physiological range of delays (300 to 400 μs in the cat, (Roth et al., 1980)) on the length of MSO (3 to 4 mm, see Fig. 14A,B), the interaural delay accrued per mm should be ~ 100 μs. The ordinate values in Fig. 14C show that the estimated “monaural” delays fall short for the contralateral projections. The ipsilateral delays come close, but are in the wrong direction for the positive values, and for the negative values some of the projections are limited in spatial extent (Fig. 14B). In Jeffress’ (1948) scheme, it is the combination of ipsi- and contralateral axonal delays that establish the map of interaural delays. Thus, even if insufficient by themselves, a combination of the contralateral delays (triangles in upper right quadrant) and some of the ipsilateral delays (squares in the lower left quadrant) could sum to the needed physiological range of delays. The estimated delays are replotted vs. CF in Fig. 14D. For each fiber, the (extrapolated) delay at the rostral pole of the MSO is anchored to the horizontal line at 0 delay, and a vertical line is drawn to the extrapolated delay at the caudal pole. The line extends to positive delays for nearly all contralateral projections (triangles), and also for the 4 ipsilateral projections (squares) with negative slopes in panel B: these projections could all contribute to the pattern of interaural delays reported by Yin and Chan (1990). The individual datapoints show the estimated delays for individual endpoints, and the short horizontal bars delimit the range of delays of the linear regression over which endpoints are actually found. The grey rectangle approximates the range of physiological delays (400 μs) that is presumed to be represented in the MSO of one side. Again, the range of delays subserved by contralateral projections is small, but could suffice when combined with the ipsilateral delays.
As was first reported in the guinea pig (McAlpine et al., 2001), the distribution of best delays in the inferior colliculus of the cat (Hancock and Delgutte, 2004; Joris et al., 2006) does not follow the shaded grey rectangle, but is largely restricted to the area defined by horizontal line at zero delay and the upper hyperbole at half a characteristic period (CF−1), and this is also the case for recordings of the MSO in rodents (Brand et al., 2002; Pecka et al., 2008). Binaural recordings have shown that best delays have a specific distribution pattern which is constrained by the upper hyperbole and the horizontal. Taken at face value, the axonal delay estimates of the present results are not consistent with the pattern of binaural delays thought to be represented in the MSO. There is no suggestion in the distribution of estimated delays towards larger delays at low than at high CFs.
Fig. 14 focuses on the ranges of estimated delay, taking as anchor points the midline (Fig. 14A), the first branchpoint (Fig. 14B), or the rostral pole (Fig. 14D). The inherent longer path length of contralateral projections combined with the similarity of axon diameter in contra- and ipsilateral projections (Fig. 12) implies a systematic additional delay for the contralateral inputs. Comparison of the entire contra- and ipsilateral delay generated by an axon is difficult because that would require backfilling of the soma and labeling of the entire projection to both contra- and ipsilateral MSO. However, we can make an estimate of the difference in delay between contra- and ipsilateral inputs. Taking into account that individual fibers project both contra- and ipsilaterally, and assuming mirror symmetry between left and right sides of the brainstem, we only need to increase the contralateral delay estimates of Fig. 14A (made w.r.t. the midline) with the delay estimated for the axonal segment between the ipsilateral first branchpoint and the midline (distance FBi to midline in Fig. 15B). We could trace this segment in all ipsilaterally projecting fibers. The average segment length was 4994 μm (range: 3748 to 6106 μm) and the average diameter was 2.6 μm (range: 1.9 to 3.0 μm), yielding an average extra delay (Eq. 1) of 221 μs (range 139 – 351 μm). Thus, on average the endpoint delay estimates in Fig. 14A would need to be increased by 221 μs. The value of 221 μs may be an overestimate because the axon diameters of our small sample seem an underestimate (Eq. 1): larger axon diameters at the midline were reported by Smith et al. (1993: 2.5 – 5 μm) and Brownell (1975: 3 – 5 μm). The values of Beckius et al. (1999) (slightly over 2 μm) are comparable to our own.
Fig. 15.
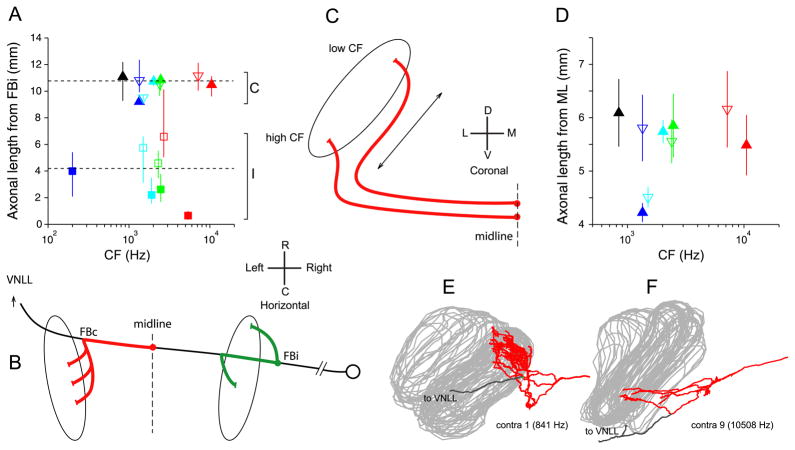
A,B: Differences in path length between ipsi- and contralateral inputs. A: Estimated average and range of lengths for contra- and ipsilateral projections between the first branchpoint (FBi) of the ipsilateral MSO projection and the endpoints. Dashed lines show overall contralateral (C) and ipsilateral (I) mean. B: Schematic of the measurement. The length of the trajectory between midline and contralateral endpoints (red), or between ipsilateral first branchpoint (FBi) and endpoints (green), was measured (same values as in Fig. 13C,D). To estimate the difference in length of contra- and ipsilateral inputs, the red segment needs to be augmented by the distance FBi to midline: we use the average measured on ipsilateral projections (4994 μm, see main text). C–F: Absence of length differences in the innervation from the contralateral ear along the dorsoventral dimension of MSO. C: Hypothetical scheme of innervation by contralateral fibers, suggesting extra length for the most dorsally projecting (low-CF) fibers. If input fibers approach the MSO from ventral, low-CF fibers may have longer axonal length (arrow) to innervate the dorsal part of MSO than high-CF fibers for the ventral part. D: relationship between axonal length from ML to endpoints, and CF. Symbols in A and D indicate average axonal length; lines are range (A) and standard deviation (D) for each projection (symbol color and shape as in Fig. 8). E and F: Coronal view of contralateral projections of fibers with lowest and highest CF (840 and 10508 Hz, respectively).
Note that inclusion of this extra delay does not alleviate the problem pointed out in Fig. 14D, since it adds a constant delay common to all endpoints of a given fiber and does not increase the range of available delays provided by a given fiber. Fig. 15A shows the estimated average (symbols) and range (lines) of path lengths from the last common axonal point (FBi) to all endpoints, as a function of CF, using the average of 4994 μm for the distance FBi to midline calculated above. On average, the contralateral pathway from FBi onward is 10.78 mm and the ipsilateral pathway is 4.21 mm. Incorporating the measured diameters, the average delay from the first ipsilateral branchpoint to MSO is an estimated 511 μs for the contralateral projections and 220 μs for the ipsilateral projections. Thus, the difference in path length is on average 6.57 mm, which generates an extra delay for the contralateral projection of an estimated 290 μs. Notwithstanding the uncertainty of its exact value, this extra delay must contribute to the contralateral bias of best delays seen in all studies of the MSO and IC. It is interesting to observe that this value is similar to the ~ 200 μs extra contralateral delay in the lateral superior olive, estimated with different physiological methods (Joris, 1996; Joris and Yin, 1998; Tollin and Yin, 2005).
Axonal delay in the dorso-ventral dimension
Differences in the CF of contra- and ipsilateral inputs converging on MSO neurons have been proposed as a source of internal delays (Schroeder, 1977; Shamma, 1989; Bonham and Lewis, 1999). Crosscorrelation analysis of responses of auditory nerve fibers revealed that disparities of a fixed distance on the cochlear basilar membrane generate a wider range of internal delays at low than at high CFs, in accord with the pattern of internal delays inferred from recordings in the inferior colliculus (Joris et al., 2006). However, to explain not only the decrease in the range of best delays with CF, but also the decrease in mean best delay with CF, an additional mechanism is needed. Because most contralateral projections approach the MSO from a rostral and ventral position (Figs. 2C and 3A,B), it was hypothesized (Joris et al., 2006) that the longer distance towards the dorsal (low-CF) pole of the MSO compared to the ventral (high-CF) pole perhaps causes a systematically longer delay for low-CF than for high-CF contralateral inputs. This hypothesis is illustrated with the schematic in Fig. 15C. In Fig. 15D, we show the mean and standard deviation of the axonal lengths from midline to endpoint for all contralateral projections as a function of fiber CF (for individual datapoints: see Fig. 13C). There is no hint of a CF dependency showing longer lengths for the most dorsally projecting fibers (lowest CFs). The low-CF (Fig. 15E) and high-CF (Fig. 15F) projections illustrated in coronal view show that the tilting of the dorsal edge of the MSO towards the midline, combined with the angling of the contralateral low-CF fibers, is such that indeed no differential delay would be expected relative to the more ventral, high-CF projections. There is therefore no evidence in our data for a length gradient along the dorsoventral dimension in the excitatory inputs from the contralateral ear.
DISCUSSION
Sensitivity to temporal differences in the sounds to the two ears provide a powerful model system to study neural temporal processing. Putative axonal delay lines have been an important component of models and of theorizing regarding such processing (Jeffress, 1948; Licklider, 1959; McFadden, 1972; Carr and Konishi, 1988; Cariani, 2004). There is general agreement that sensitivity to ITDs involves internal delays causing a temporal shift of inputs from one ear relative to the other. What is increasingly questioned is the proposal (Jeffress, 1948) of a conversion of a temporal code to a place code by virtue of axonal delay lines. We quantitatively reanalyzed projection patterns of spherical bushy cells of the AVCN to MSO (Smith et al., 1993). The main findings of that study hold up, and are consistent with a later study (Beckius et al., 1999): axonal configurations that are qualitatively of the nature surmised by Jeffress are found for contralateral and less clearly for ipsilateral projections. Nonetheless, these configurations are not consistent in a simple form with the binaural data that have become available since.
Previous studies
The two previous reports on anatomical delay lines in cat have complementary virtues. The power of the data of Smith et al. (1993) is that their 18 axons were physiologically characterized and that the labeling was unambiguously from single fibers, but filling was incomplete so that typically projections on only one side could be reconstructed. Their report showed one contra- and one ipsilateral computer reconstruction. Beckius et al. (1999) labeled a large number of axons by injecting the rostral pole of the AVCN, of which 17 well-filled axons (from 2 animals) were quantitatively reconstructed, with 7 reported in detail. Disadvantages of that material are the absence of physiology and the difficulty in connecting pieces across sections. Both studies have few data at very low CFs, where the largest best delays are observed. Best frequencies at the site of injection in Beckius et al. were estimated at ~ 1.5–1.75 kHz, but the tonotopic layering of the projections suggests that the actual range of CFs was much larger. In Smith et al. only 2 fibers had CF < 1 kHz.
Despite differences in technique, the two studies were consistent, finding caudally directed delay line patterns contralaterally and a complex, less systematic pattern ipsilaterally. Quantitative analysis allowed Beckius et al. (1999) to discern a weaker length gradient in ipsilateral branches, in a direction opposite to the contralateral pattern. The quantitative analysis presented here is largely consistent with that of Beckius et al. (1999). The main additional findings concern the ipsilateral projections. We found caudally directed delay lines in 3 (of 7) ipsilateral reconstructions, i.e. where the length gradient was in the same direction as that of contralateral projections. This pattern was particularly convincing in the fiber with the lowest CF (200 Hz). Also, the rostrally directed delay line in the remaining 4 ipsilateral reconstructions was at least as steep (though of opposite sign) as that of the contralateral fibers (Fig. 8B, 14C), while in Beckius et al. the gradients on the ipsilateral side were shallow and constrained in rostrocaudal extent.
Anatomical patterns and best delays
Ultimately, “delay” is a functional concept requiring functional measurements. Particularly appealing in the morphological observations is their apparent consistency with the relationship between binaural tuning and cell location observed by Yin and Chan (1990), both in sign and in size. In that study, small best delays were found rostrally and large delays caudally, consistent with a caudally directed delay line contralaterally and/or a rostrally directed delay line ipsilaterally. Moreover, the range of physiological delays is reasonably in accord with estimated length differences and conduction speeds: a range of ~ 400 μs could be covered by combining “monaural” contra- and ipsilateral delays.
Nevertheless, our quantitative analysis brings out several problems. Most importantly, there is nothing in the pattern of estimated delays observed that would suggest a CF-dependent range of delays (Fig. 14D). The anatomical branching patterns as illustrated in Figs. 2,3 are equally present at high and low CFs. In contrast, the physiological distribution of best delays measured in the MSO and inferior colliculus shows a clear dependence on CF, in cat and in other mammals studied (Brand et al., 2002; McAlpine and Grothe, 2003; Hancock and Delgutte, 2004; Joris et al., 2006; Pecka et al., 2008).
A second problem, of relevance beyond the issue of axonal delay lines, is that of correct concatenation. None of the afferents illustrated here or in Beckius et al. (1999) innervates the entire rostrocaudal extent of the MSO. Thus each tonotopic strip of MSO neurons must be supplied by a patchwork of afferents. This complicates the structural basis for a systematic rostrocaudal gradient, since it requires correct temporal stacking of collaterals. For example, contralateral projections 2 and 3 have the same CF but innervate different portions of the MSO: projection 2 is to the rostral half and shows a positive slope, while projection 3 is restricted towards the caudal pole (Figs. 8C, 14A). Obviously, if these 2 fibers were representative for a single animal, the delay pattern generated by projection 2 would not be complemented by the inputs from projection 3. In other cases, fibers of similar CF appear to concatenate in an orderly manner (e.g. contralateral projections 5,6,7). The fibers labeled here were derived from different animals, and offsets in the ordinate values of Figs. 8C,D and 14A,B could reflect differences in anatomy between animals e.g. in MSO size and location. Within-animal data are reasonably consistent in one animal studied by Beckius et al. (1999, Fig. 11) but not in the other, which showed large offsets among fibers. However, the latter case also showed large variation in dorsoventral location of the projections, so that the labeled population must reflect a wide range of CFs. Taken together, the available material does not allow a prediction of the degree of temporal dispersion that may be present across afferents of equal CF.
A third problem maybe in the range of delays. The estimated contralateral delays are small relative to the values of best delay observed, particularly at low CFs where best delays can be > 1 ms (Fig. 14, upper hyperbole) (Hancock and Delgutte, 2004; Joris et al., 2006). Ipsilateral delays tend to be larger but are also more erratic in sign and rostrocaudal coverage. Combination of contra- and ipsilateral delays can enlarge the net interaural delay (when the slopes are of opposite sign for the contra- and ipsilateral projections), but sources of delay in addition to the delays provided by the within-fiber branching pattern are needed to account for the full range of best delays observed at low CFs. We caution that the diameter measured on our material is necessarily a rough estimate, as is the relationship between fiber diameter and conduction speed (Waxman and Bennett, 1972), and is suited for observing trends rather than absolute values.
Our reanalysis casts doubts on the relevance of the rostrocaudal axonal branching patterns for interaural delay, but does not by itself contradict the evidence for a spatial map of delay in MSO (Yin and Chan, 1990). Nevertheless, taking into account the noise in the relationship observed by Yin and Chan; the absence of a clear relationship in multi-unit recordings (Oliver et al., 2003); and the problems in tying the distribution of best delays to axonal branching patterns (Fig. 14D), it appears increasingly doubtful that these patterns are an essential component of the binaural circuit.
A final qualification is that other features of the branching pattern – different from the simple within-axon delay line configuration – may contribute to internal delay. For example, contralateral/ipsilateral asymmetries in temporal dispersion; in convergence across CFs; in convergence ratio, could all contribute to the pattern of best delays observed. Also, based on our material we can not exclude that patches of contra- and ipsilateral fibers would provide the range of best delays observed (cf. Goldberg and Brown, 1969). It is interesting in this regard that there is more consistency in the pattern of projections to the rostral than to the caudal half of MSO (Fig. 8). Finally, there are other determinants of conduction speed, internodal distance in particular, which may show systematic variations in mammalian binaural circuits, as in birds (Carr and Konishi, 1990; Seidl et al., 2010).
Tonotopy: over- or underrepresentation of low frequencies?
A surprising finding is the tonotopic distribution of afferents. Their layering suggests that low frequencies are under- rather than overrepresented in the MSO. This is puzzling - functionally and anatomically - and is inconsistent with the “duplex” organization of the superior olivary complex (Irvine, 1986) comprising a low-frequency circuit computing ITD and a high-frequency circuit computing interaural level differences (ILD). Taking the limited sample sizes of our data and those of Guinan et al. (1972) into account, a conservative statement is that MSO is tonotopically mapped isomorphic to the cochlea and has a low-frequency bias to the extent that very high CFs are not represented in MSO. The main “duplex” asymmetry is in the ILD (not the ITD) circuit: the lateral superior olive and medial nucleus of the trapezoid body show an apparent overrepresentation of high frequencies (Guinan et al., 1972).
Acknowledgments
Supported by the Fund for Scientific Research – Flanders (G.0392.05 and G.0633.07 to PJ, fellowship GP.037.07N to SK), Research Fund K.U. Leuven (OT/05/57 and OT/09/50 to PJ, and fellowship F/06/085 to SK), the National Institutes of Health (DC00116 to TY), and the National Science Foundation (BNS-8901993 to PS).
Footnotes
No Conflict of interest
References
- Adams JC. Heavy metal intensification of DAB-based HRP reaction product. J Histochem Cytochem. 1981;29:775. doi: 10.1177/29.6.7252134. [DOI] [PubMed] [Google Scholar]
- Beckius GE, Batra R, Oliver DL. Axons from anteroventral cochlear nucleus that terminate in medial superior olive of cat: observations related to delay lines. J Neurosci. 1999;19:3146–3161. doi: 10.1523/JNEUROSCI.19-08-03146.1999. [DOI] [PMC free article] [PubMed] [Google Scholar]
- Bonham BH, Lewis ER. Localization by interaural time difference (ITD): effects of interaural frequency mismatch. J Acoust Soc Am. 1999;106:281–290. doi: 10.1121/1.427056. [DOI] [PubMed] [Google Scholar]
- Brand A, Behrend O, Marquardt T, McAlpine D, Grothe B. Precise inhibition is essential for microsecond interaural time difference coding. Nature. 2002;417:543–547. doi: 10.1038/417543a. [DOI] [PubMed] [Google Scholar]
- Brownell WE. Organization of the cat trapezoid body and the discharge characteristics of its fibers. Brain Res. 1975;94:413–433. doi: 10.1016/0006-8993(75)90226-7. [DOI] [PubMed] [Google Scholar]
- Cariani P. Temporal codes and computations for sensory representation and scene analysis. IEEE Trans Neural Netw. 2004;15:1100–1111. doi: 10.1109/TNN.2004.833305. [DOI] [PubMed] [Google Scholar]
- Carr CE, Konishi M. Axonal delay lines for time measurement in the owl’s brainstem. Proc Natl Acad Sci U S A. 1988;85:8311–8315. doi: 10.1073/pnas.85.21.8311. [DOI] [PMC free article] [PubMed] [Google Scholar]
- Carr CE, Konishi M. A circuit for detection of interaural time differences in the brain stem of the barn owl. J Neurosci. 1990;10:3227–3246. doi: 10.1523/JNEUROSCI.10-10-03227.1990. [DOI] [PMC free article] [PubMed] [Google Scholar]
- Goldberg JM, Brown PB. Response of Binaural Neurons of Dog Superior Olivary Complex to Dichotic Tonal Stimuli: Some Physiological Mechanisms of Sound Localization. J Neurophysiol. 1969;22:613–636. doi: 10.1152/jn.1969.32.4.613. [DOI] [PubMed] [Google Scholar]
- Greenwood DD. A cochlear frequency-position function for several species 29 years later. J Acoust Soc Am. 1990;87:2592–2605. doi: 10.1121/1.399052. [DOI] [PubMed] [Google Scholar]
- Grothe B. New roles for synaptic inhibition in sound localization. Nat Rev Neurosci. 2003;4:1–11. doi: 10.1038/nrn1136. [DOI] [PubMed] [Google Scholar]
- Guinan JJ, Norris BE, Guinan SS. Single auditory units in the superior olivary complex. II: Locations of unit categories and tonotopic organization. International Journal of Neuroscience. 1972;4:147–166. [Google Scholar]
- Hancock KE, Delgutte B. A physiologically based model of interaural time difference discrimination. J Neurosci. 2004;24:7110–7117. doi: 10.1523/JNEUROSCI.0762-04.2004. [DOI] [PMC free article] [PubMed] [Google Scholar]
- Irvine DRF. The auditory brainstem: A review of the structure and function of auditory brainstem processing mechanisms. Berlin: Springer-Verlag; 1986. [Google Scholar]
- Jeffress LA. A Place Theory of Sound Localization. J Comp Physiol Psychol. 1948;41:35–39. doi: 10.1037/h0061495. [DOI] [PubMed] [Google Scholar]
- Joris P, Yin TC. A matter of time: internal delays in binaural processing. Trends Neurosci. 2007;30:70–78. doi: 10.1016/j.tins.2006.12.004. [DOI] [PubMed] [Google Scholar]
- Joris PX. Envelope coding in the lateral superior olive. II. Characteristic delays and comparison with responses in the medial superior olive. J Neurophysiol. 1996;76:2137–2156. doi: 10.1152/jn.1996.76.4.2137. [DOI] [PubMed] [Google Scholar]
- Joris PX. A dogged pursuit of coincidence. J Neurophysiol. 2006;96:969–972. doi: 10.1152/classicessays.00041.2006. [DOI] [PubMed] [Google Scholar]
- Joris PX, Yin TCT. Envelope coding in the lateral superior olive. III. Comparison with afferent pathways. J Neurophysiol. 1998;79:253–269. doi: 10.1152/jn.1998.79.1.253. [DOI] [PubMed] [Google Scholar]
- Joris PX, Smith PH, Yin TCT. Coincidence detection in the auditory system: 50 years after Jeffress. Neuron. 1998;21:1235–1238. doi: 10.1016/s0896-6273(00)80643-1. [DOI] [PubMed] [Google Scholar]
- Joris PX, van de Sande B, Louage DH, van der Heijden M. Binaural and cochlear disparities. PNAS. 2006;103:12917–12922. doi: 10.1073/pnas.0601396103. [DOI] [PMC free article] [PubMed] [Google Scholar]
- Liberman MC. The cochlear frequency map for the cat: Labeling auditory-nerve fibers of known characteristic frequency. J Acoust Soc Am. 1982;72:1441–1449. doi: 10.1121/1.388677. [DOI] [PubMed] [Google Scholar]
- Licklider JCR. Three auditory theories. In: Koch S, editor. Psychology: a study of a science. Study I. Conceptual and systematic. Vol. 1. New York: McGraw-Hill; 1959. pp. 41–144. Sensory, Perceptual, and Physiological Formulat. [Google Scholar]
- McAlpine D. Creating a sense of auditory space. J Physiol. 2005;566:21–28. doi: 10.1113/jphysiol.2005.083113. [DOI] [PMC free article] [PubMed] [Google Scholar]
- McAlpine D, Grothe B. Sound localization and delay lines - do mammals fit the model? Trends Neurosci. 2003;26:347–350. doi: 10.1016/S0166-2236(03)00140-1. [DOI] [PubMed] [Google Scholar]
- McAlpine D, Jiang D, Palmer A. Interaural delay sensitivity and the classification of low best-frequency binaural responses in the inferior colliculus of the guinea pig. Hear Res. 1996;97:136–152. [PubMed] [Google Scholar]
- McAlpine D, Jiang D, Palmer A. A neural code for low-frequency sound localization in mammals. Nat Neurosci. 2001;4:396–401. doi: 10.1038/86049. [DOI] [PubMed] [Google Scholar]
- McFadden D. Precedence effects and auditory cells with long characteristic delays. J Acoust Soc Am. 1972;54:528–530. doi: 10.1121/1.1913611. [DOI] [PubMed] [Google Scholar]
- Oliver DL, Beckius GE, Bishop DC, Loftus WC, Batra R. Topography of interaural temporal disparity coding in projections of medial superior olive to inferior colliculus. J Neurosci. 2003;23:7438–7449. doi: 10.1523/JNEUROSCI.23-19-07438.2003. [DOI] [PMC free article] [PubMed] [Google Scholar]
- Palmer A. Reassessing mechanisms of low-frequency sound localisation. Curr Opin Neurobiol. 2004;14:457–460. doi: 10.1016/j.conb.2004.06.001. [DOI] [PubMed] [Google Scholar]
- Palmer A, Kuwada S. Binaural and spatial coding in the inferior colliculus. In: Winer JA, Schreiner CE, editors. The Inferior Colliculus. New York: Springer-Verlag; 2005. pp. 377–410. [Google Scholar]
- Pecka M, Brand A, Behrend O, Grothe B. Interaural time difference processing in the mammalian medial superior olive: the role of glycinergic inhibition. J Neurosci. 2008;28:6914–6925. doi: 10.1523/JNEUROSCI.1660-08.2008. [DOI] [PMC free article] [PubMed] [Google Scholar]
- Rose JE, Gross NB, Geisler CD, Hind JE. Some neural mechanisms in the inferior colliculus of the cat which may be relevant to localization of a sound source. J Neurophysiol. 1966;29:288–314. doi: 10.1152/jn.1966.29.2.288. [DOI] [PubMed] [Google Scholar]
- Roth GL, Kochhar RK, Hind JE. Interaural Time Differences: Implications Regarding the Neurophysiology of Sound Localization. J Acoust Soc Am. 1980;68:1643–1651. doi: 10.1121/1.385196. [DOI] [PubMed] [Google Scholar]
- Schroeder MR. New viewpoints in binaural interactions. In: Evans EF, Wilson JP, editors. Psychophysics and Physiology of Hearing. New York: Academic Press; 1977. pp. 455–467. [Google Scholar]
- Seidl AH, Rubel EW, Harris DM. Mechanisms for adjusting interaural time differences to achieve binaural coincidence detection. J Neurosci. 2010;30:70–80. doi: 10.1523/JNEUROSCI.3464-09.2010. [DOI] [PMC free article] [PubMed] [Google Scholar]
- Shamma SA. Stereausis: binaural processing without neural delays. J Acoust Soc Am. 1989;86:989–1006. doi: 10.1121/1.398734. [DOI] [PubMed] [Google Scholar]
- Smith PH, Joris PX, Yin TCT. Projections of physiologically characterized spherical bushy cell axons from the cochlear nucleus of the cat: evidence for delay lines to the medial superior olive. J Comp Neurol. 1993;331:245–260. doi: 10.1002/cne.903310208. [DOI] [PubMed] [Google Scholar]
- Smith PH, Joris PX, Carney LHC, Yin TCT. Projections of physiologically characterized globular bushy cell axons from the cochlear nucleus of the cat. J Comp Neurol. 1991;304:387–407. doi: 10.1002/cne.903040305. [DOI] [PubMed] [Google Scholar]
- Stotler WA. An experimental study of the cells and connections of the superior olivary complex of the cat. Journal of Comparative Neurology. 1953;98:401–432. doi: 10.1002/cne.900980303. [DOI] [PubMed] [Google Scholar]
- Tollin DJ, Yin TC. Interaural phase and level difference sensitivity in low-frequency neurons in the lateral superior olive. J Neurosci. 2005;25:10648–10657. doi: 10.1523/JNEUROSCI.1609-05.2005. [DOI] [PMC free article] [PubMed] [Google Scholar]
- Wagner H, Asadollahi A, Bremen P, Endler F, Vonderschen K, von Campenhausen M. Distribution of interaural time difference in the barn owl’s inferior colliculus in the low- and high-frequency ranges. J Neurosci. 2007;27:4191–4200. doi: 10.1523/JNEUROSCI.5250-06.2007. [DOI] [PMC free article] [PubMed] [Google Scholar]
- Waxman SG, Bennett MVL. Relative conduction velocities of small myelinated and non-myelinated fibers in the central nervous system. Nat New Biol. 1972;238:217–219. doi: 10.1038/newbio238217a0. [DOI] [PubMed] [Google Scholar]
- Yin TCT, Chan JK. Interaural Time Sensitivity in Medial Superior Olive of Cat. J Neurophysiol. 1990;64:465–488. doi: 10.1152/jn.1990.64.2.465. [DOI] [PubMed] [Google Scholar]


