

Abstract
Trial-to-trial variations in the firing rates of neurons in the middle temporal visual area (MT) are correlated with the behavior of macaque monkeys performing motion detection and motion discrimination tasks. Here we examine how these correlations depend on the direction of motion used for a detection task relative to the preferred direction of the neuron under study. There was a robust correlation between the firing rate of MT neurons and the animal’s detection of motion when the direction of that motion was near the neuron’s preferred direction. This correlation was undetectable using motions that were approximately 90° away from the preferred direction and an inverse correlation between activity and behavior was found for motion in the null direction. Correlation between reaction times and single cell activity in MT followed a similar pattern. Although motion detection could have been based solely on the activity of neurons preferring the expected direction, these results suggest that it depends on the relative activity of neurons preferring opposite directions of motion. They furthermore show that the subset of neurons used to guide behavior can vary from trial to trial based on task requirements.
Introduction
Most individual neurons in the middle temporal area (MT) respond selectively to objects moving in a particular direction and at a particular speed (Maunsell and Van Essen, 1983). The sensitivity of MT neurons to motion is such that pooling signals from a small number of neurons could account for the performance of the animal in motion detection and motion discrimination tasks (Newsome et al., 1989; Cohen and Newsome, 2009). Moreover, trial-to-trial correlations between the firing of MT neurons and the performance of the animal have been observed (Britten et al., 1996; Thiele et al., 1999; Cook and Maunsell, 2002; Purushothaman and Bradley, 2005; Cohen and Newsome, 2009). These correlations are expected if MT neurons form part of the substrate for the animal’s behavior in the task, because their trial-to-trial fluctuations will drive trial-to-trial fluctuations in behavior. Further evidence that MT is important for motion processing has come from lesion (Newsome and Pare, 1988)and microstimulation (Salzman et al., 1990; Salzman et al., 1992) experiments.
Despite a wealth of information demonstrating the importance of MT for motion tasks, we still know relatively little about how the activity of its neurons is used to guide behavioral decisions. While only a small number of neurons would be needed to account for behavioral performance in motion detection or discrimination tasks (Shadlen et al., 1996), thousands of MT neurons could contribute useful information about the stimuli used in these tasks. This is true because MT neurons have broad tuning for the direction, speed, and location of moving stimuli (Maunsell and Van Essen, 1983), and MT neurons with a broad range of preferred directions can provide reliable signals about the weak motion in a particular direction (Britten and Newsome, 1998). Two previous studies have examined how trial-to-trial correlations between neuronal responses and behavior vary depending on the difference between the stimulus motion and a neuron’s preferred direction (Purushothaman and Bradley, 2005; Cohen and Newsome, 2009), but not using a detection task, where success might be achieved by monitoring either a very select or a very large set of neurons. Nor has attention been given to whether animals can change the way their weight signals from MT neurons based on instructions that differ from one trial to the next.
To gain more information about which subsets of the active neurons in MT the animal uses to guide behavior, we have examined the correlation between MT activity and behavior while monkeys performed a motion detection task using eight different directions relative to the preferred direction of each cell under study. The results show that animals can readily changing the weighting they give to neurons preferring different directions of motion based on a cue given at the start of each trial. Although detection might be based on monitoring all responsive cells, it instead appears that the animal preferentially monitors neurons with direction preferences that are aligned with, and opposite to, the expected stimulus direction.
Materials and Methods
Subjects and Behavioral Task
Data were recorded from two male rhesus monkeys (Macaca mulatta). All animal procedures were performed in accord with standards of the Baylor College of Medicine Animal Research Committee. Before training each monkey was implanted with a head post and scleral search coil for monitoring eye position. Monkeys were trained in several motion detection and motion discrimination tasks for a period of 3–6 months. After training animals underwent an additional surgery to implant a recording chamber directly dorsal to MT.
Each monkey learned to do a motion detection task in a reaction time mode (Figure 1). The animal was required to first fixate a small spot of light for approximately 500 ms, after which a patch of randomly moving dots appeared with a target spot just off one side of the dot patch. The target both alerted the animal as to which direction of coherent motion would occur on that trial and marked the target for the saccade that the animal would need to make when the coherent motion appeared. This target spot disappeared after 500 ms. After an additional random period of 500 to 3000 ms, the random dot motion changed from 0% coherence to the coherence specified for that trial. The times at which coherent motion began were exponentially distributed within this time range, creating a flat hazard function. The monkey was required to make a saccade to the previously indicated target location within ~825ms of the onset of coherent motion. Trials in which the animal correctly detected the motion were rewarded by juice and there was a delay of 1000 ms before the next trial began. Trials in which the animal reacted before the onset of coherent motion were aborted and a 3000 ms timeout was enforced before the next trial. On trials in which the animal failed to detect the motion no reward was delivered and a 1000 ms inter-trial interval was used. Between 10% and 15% of trials were designated as catch trials where no coherent motion occurred and the monkey was rewarded for maintaining fixation until the trial ended.
Figure 1.
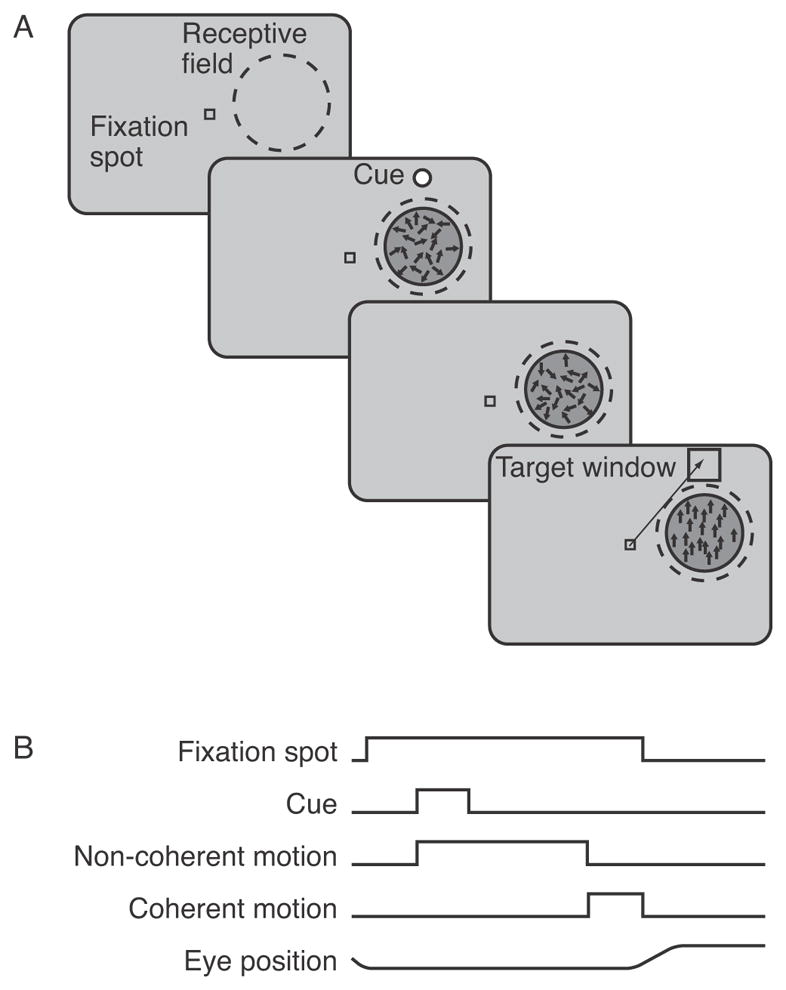
Motion detection task. A) Sequence of stimulus presentations during trials. The animal was required to fixate for 500 ms at the start of each trial. Next, non coherent motion began and a cue appeared that instructed the animal which direction of motion would occur on that trial, and served as the target for a saccade later in the trial. After another 500 ms, the cue disappeared, and non-coherent motion continued for a random period. Finally, coherent motion began and the animal was rewarded if it made a saccade to the previously cued target within 825 ms. B) Illustration of the relative timing of fixation spot, cue, non-coherent motion, coherent motion, and eye position.
Visual stimuli
Animals were seated approximately 62 cm from a CRT video display, which subtended 34° × 26° of visual field. The display had1200 × 800 pixels that were updated at a refresh rate of 85 Hz. The stimuli consisted of patches of randomly moving dots that were centered on the receptive field of the cell under study. Dot density was 2 dots/degree2, and individual dots had a radius of 2 pixels. The dots were light grey presented on a mid-level grey background. Lifetime of each dot was 2 frames, and two sets of dots were used such that half of the dots were replaced with new dots in random positions in one frame and the other half were replaced in the next frame. The coherence level specified the percentage of dots in the half that was not replaced that would move in the designated direction in a given update. All other dots were displaced by the same distance but in random directions. For the primary experiment the coherence was set to a value that resulted in monkey detecting the motion coherence on 50–60% of the trials. Typically this corresponded to ~15% coherence. For direction tuning experiments, the coherence was set to 100%.
On half the trials in the primary experiment the random dot sequences were generated using the same random number seed, so that half of the presentations were exactly repeated stimuli (frozen noise) and the other half were random. Analysis of data from random and constant seeding trials gave qualitatively similar results, and both types of trials are combined for all analyses shown in this paper. For stimuli used to generate direction tuning curves, all stimuli were seeded randomly.
Neuronal recording
Recordings were made using standard extracellular recording techniques and glass coated platinum/iridium electrodes of ~1 MΩ impedance at 1 kHz. All recordings were made from Horsley-Clarke coordinates in the range of 4–7 mm posterior and 16 to 19 mm lateral. Spikes from a neuron were isolated using a window discriminator and spike times were recorded with a precision of 1 ms. Eye position was monitored using a scleral eye coil and recorded every 1 ms.
For each cell we characterized the receptive field by computer assisted hand plotting and centered the random dot stimuli on this location. The size of the patch of random dots was set to match the size of the receptive field. The speed of the stimulus was adjusted to provide robust responses but speed preferences were not measured quantitatively. We measured the direction tuning of all cells that were responsive and had receptive fields confined to the video display. Direction tuning curves were obtained by having the animal perform the detection task using 100% coherent stimuli presented in 8 different directions. A Gaussian curve was fit to the tuning data online to determine the preferred direction and tuning width. Neurons for which the peak and asymptote of the fitted Gaussian differed by less than a factor of 2.3 were considered to have weak direction selectivity were excluded from the analyses presented here (9 of 60 neurons).
Analysis
The directions of motion used for the primary experiment were not evenly spaced. They were −90°, −45°, −22.5°, 0°, +22.5°, +45°, +90°, and +180° relative to the preferred direction determined from the online Gaussian fit. Final values for direction preference reported here were obtained by a more thorough offline analysis that allowed all four parameters of the Gaussian (preferred direction, baseline, amplitude and SD) to vary, and which excluded spikes obtained beyond reaction time of the animal. For some analyses data were assigned to 8 bins with base values of 0°, ±22.5°, ±45°, ±90°, and 180° relative to the preferred direction. The actual range for each bin was −135° to 67.5°, −67.5° to 33.75°, −33.75° to −11.25°, −11.25° to 11.25°, 11.25° to 33.75°, 33.75° to 67.5°, 67.5° to 135°, and 180°± 45° relative to the preferred direction.
For most analyses, spike times were aligned relative to the onset of coherent motion and filtered with an exponential filter that had a time constant of 100 ms (Cook and Maunsell, 2002). Spikes recorded from the beginning of each trial up to 200 ms after non-coherent random dot onset were excluded from analysis as were those recorded after the response of the animal. Detect probability (DP) and reaction time correlation (RTC) were calculated in steps of10 ms during the trial from 500 ms before coherent motion onset to the median reaction time for a particular stimulus condition. To perform these analyses for a particular direction on a given cell, we required that the animal achieved between 5% and 95% correct, and responded before the onset of coherent motion on no more than 40% of the trials.
Detect probability was computed using an ROC analysis (Green and Swets, 1966)of the filtered spike trains from trials where the animal correctly detected the motion (“hit”) and those where the animal failed to detect the motion(“missed”, Cook and Maunsell, 2002). A minimum of 5 hit and 5 missed trials was required for this analysis(average 34 hits and 21 misses). Reaction time correlation was computed using the Pearson correlation coefficient for the filtered spike train versus reaction time for all of the hit trials for each condition (Cook and Maunsell, 2002). A minimum of 5 hits was required for computation of RTC (average 34).
Statistical significance of these correlations was assessed using bootstrap procedures. We used 500 repetitions of random sampling from our population with replacement. From these data we obtained the mean and 2 SD from the mean to set the 95% confidence intervals on DT and RTC time courses.
For analysis that required a single value of DP or RTC (for example correlating DP with the firing rate or sensitivity of the neuron under study), we used intervals that captured the peak of each measure. For DP measurements were obtained from a time window 400–500 ms after the start of coherent motion. For similar analyses requiring a single value for RTC, values were obtained from a window 200–300 ms into the coherent motion. Different time windows were used for the two parameters because RTC values peaked at an earlier time in the trial. To compute grand detect probabilities, which combine responses across different stimulus conditions (Heuer and Britten, 2004; Uka and DeAngelis, 2004; Nienborg and Cumming, 2006), spikes counts from each cell were normalized (using a Z-score) within each direction condition, and then counts across were sorted into responses from detected and missed trials and subjected to ROC analysis.
Results
Behavior summary
Behavioral outcomes for trials were classified as a “hit” if the animal responded within the allowed reaction time after the onset of coherent motion, a “miss” if the animal failed to respond in time, and as a “false alarm” if the animal responded before the coherent motion began. Behavioral outcomes for catch trials, in which a coherent motion stimulus was not displayed, were classified as “correct reject” if the animal maintained fixation until the end of the trial. We set the coherence of the stimulus close to the animal’s threshold to ensure enough missed trials for the DP calculation. Animal performance on the task combined across animals was 53% hit, 32% missed, and 15% false alarms on motion present trials, and 58% correct reject and 42% false alarm on catch trials. Performance of the two monkeys was similar (monkey S: 50% hit, 36% missed,14% false alarm, and 56% correct reject on catch trials; monkey F: 58% hit, 27% missed, 15% false alarm, 60% correct reject on catch trials). Median reaction time combined across animals was 537 ms (monkey S: 537 ms, monkey F: 547 ms).
Relationship between behavior and neuronal population responses
We recorded responses from 60 individual units in MT, of which 9 were excluded from analysis because they had weak direction selectivity (see Materials and Methods). The results presented here are based on 28 cells from monkey S and 23 cells monkey F. We first describe how the average firing rates for the population related to performance on the task, and then present data on specific trial-by-trial measures of correlation between activity and animal behavior.
Figure 2A, B and C show the average normalized firing rates for different directions of motion relative to the preferred direction as a function of time around the onset of coherent motion. Although coherent motion occurred at a random time in each trial, the onset has been aligned at time 0 in these and most other plots. Responses to different directions of motion relative to preferred are plotted in different horizontal bands in each panel. Each cell’s preferred direction lie as the center of the plot, and the null direction is plotted on the top and bottom of the plot.
Figure 2.

Relationship of average normalized firing rates to behavior. A) Average normalized response on trials with correct detections (“hit”). For each neuron, responses were aligned the onset of motion coherence and then trials with different directions were averaged separately and normalized to the overall peak response during a 1 s period centered on motion coherence onset. There was a prominent, direction selective response shortly after the onset of motion coherence. B) Corresponding data for trials on “miss” trials, using the same scale as in 2A. C) Difference between the average responses on “hit” and “miss” trials, normalized for each neuron to the overall peak response. D) Average normalized response on trials with correct detections. Data and analysis as in 2A, but after aligning trials on the animal’s response. E) Average normalized response on “false alarm” trials, using the same scale as in 2D. F) Average normalized responses to periods without coherent motion that the animal did not respond to (“correct reject”). Epochs were drawn from correctly completed trials using times before the onset of coherent motion that had exactly the same distribution as the trials in 2E. Same scale as in 2D, E.
Figure 2A shows the average normalized responses to coherence onsets that were successfully detected by the animal. During the non-coherent motion(−500 to 0 ms), cells in our sample fired at an average of 43 spikes/s, or 78% of their maximum firing rate of firing for weak coherent motion in the preferred direction. During the coherent motion in the preferred direction the average firing rate increased to 97% of maximum, and during coherent motion in the null direction firing decreased to 71% of maximum. Thus, the animal could use both positive and negative modulations in firing rate from different neurons to perform the task. A similar pattern of response was seen on the missed trials (Figure 2B), but the change in response was weaker. Figure 2C shows the difference between the average activity on hit and missed trials, plotted on a different scale. The relatively consistent neuronal activity across directions before the onset of coherent motion in Figure 2A and B shows that directing the animals to attend to different directions of motion did not modulate responses much(Treue and Martinez-Trujillo, 1999; Martinez-Trujillo and Treue, 2004), although a few cells did show such effects.
Figure 2D plots the same responses from Figure 2A after aligning neuronal activity to the animal’s response on each trial. Figure 2E shows corresponding data from false alarm trials. If the animal was using the direction cue given on every trial and was attending to the motion in the random dot stimulus, we would expect to find that responses on false alarm trials would tend to be preceded by tuned activity within MT that peaked at about the same time as the activity in trials with coherent motion. Indeed, we see a peak in activity near the preferred direction approximately 200 ms before the response of the animal. Because cells did not respond before false alarms when the null direction was cued, these data are consistent with the animal attending to a neuronal signal of motion in the cued direction and responding to stochastic fluctuations in the stimulus that increased the net motion in the cued direction, and not simply waiting for any change in the stimulus. For comparison, Figure 2F shows average activity during time-matched periods of trials when the animal did not make a false alarm, which shows no such structure. The absence of structure in Figure 2F supports the idea that the structure in Figure 2E is associated with random fluctuations in the stimulus rather than attention to the cued direct altering the responses of MT neurons (see also the periods of Figures 2A and B before coherent motion onset).
Overall, this pattern of average firing rates is consistent with the idea that the animal relied on this population of MT cells to perform the task, and that it assigned different weighting to neurons in the population as the cue direction of motion was changed.
Trial-to-trial measures
The responses of an example cell to coherent motion in its preferred direction are shown in Figure 3. To analyze the data we first sorted the trials according to whether or not the animal detected the onset of the coherent motion (Figure 3A). Trials where the motion was detected were further sorted according to the reaction time of the animal. Data from different trials were then aligned to the onset of coherent motion (0 ms). Spikes beyond the reaction time on each trial are not used in any of our analyses.
Figure 3.

Responses from one cell for the preferred direction of motion. A) Spike rasters for all trials for the preferred direction sorted according to whether the animal correctly detected (hit) or failed to detect (miss) the coherent motion. Trials are aligned by the onset of coherent motion, which is at time 0. Reaction times on correct trials are shown by the filled circles. Tick marks indicate the occurrence of a single spike. Spikes beyond the reaction time are not shown and were not included in any analyses. B) Filtered spike data. The raster in A has been filtered with an exponential filter with a time constant of 100 ms. C) Average firing rate on hit (thick line) and missed (thin line) trials. Both traces are truncated at the median reaction time. D) Time course of detect probability. An ROC analysis was performed on the filtered firing rate distributions for hit and missed trials at 10 ms intervals from 500 ms before onset of coherent motion. E) Time course of reaction time correlation.
For analysis, spike trains from the aligned trial rasters were filtered with an exponential filter that had a time constant of 100 ms (Figure 3B, Cook and Maunsell, 2002). The averages of these filtered spike trains for hit and missed trials are shown in Figure 3C. We used the filtered spike trains to examine two measures of correlation between behavior and single cell activity. The first was detect probability (DP), which is a measure of how well differences in the filtered spike responses on detected trials versus missed trials could serve to predict the behavioral outcome on single trials (Cook and Maunsell, 2002). DP was calculated for time points from 500 ms before the onset of coherent motion to the median reaction time at 10 ms intervals (Figure 3D). The DP index can assume values from 0 to 1. A value of 1 indicates that the cell fired more on every trial where the animal correctly detected the motion, and that an ideal observer could perfectly predict whether the animal would detect the motion on a single trial by examining the firing rate from the cell. A DP of 0.5 means that the cell provides no useful information that could be used to predict behavior. A DP of below 0.5 indicates that the cell fired less on trials when the animal correctly detected the motion. The time course of DP for individual cells was noisy (Figure 3D) but generally near 0.5 during the non-coherent motion (t < 0) and slightly above 0.5 for the preferred direction during the coherent motion (t > 0).
The second measure of correlation between behavior and cell activity was reaction time correlation (RTC), which is the trial-by-trial correlation between firing rate of the neuron and the reaction time of the animal (Cook and Maunsell, 2002). This measure was also calculated at 10 ms intervals from 500 ms before the onset of coherent motion to the median reaction time (Figure 3E). The RTC index can assume values between −1 and 1. A negative RTC means that on trials when the cell fired more the animal tended to react more quickly. A value near 0 for RTC indicates no correlation between firing rate and reaction time, and positive values indicate the cell fired less on trials when the animal reacted quickly. RTC was also noisy for individual cells, but tended to be near 0 during the non-coherent motion (time < 0) and slightly negative during the coherent motion in the preferred direction (time > 0).
Correlations of Cell Responses to the Different Directions
Our results for the preferred direction were similar to results from previous experiments that have examined the relationship between behavior and single unit activity in MT (Britten et al., 1996; Cook and Maunsell, 2002). However, our goal was to examine these correlations for other directions as well. The time course for cell firing rate, DP, and RTC is shown for all 8 directions tested for one example cell in Figure 4. The response of the cell to non-coherent motion was ~30 spikes/s, regardless of the cued direction (Figure 4A). During the coherent motion, the cell shows a strong increase in response for directions near the preferred direction (maximum firing rate ~70 spikes/s). Note that the direction bands in this and subsequent figures do not represent equal ranges of direction (see Materials and Methods). An analysis of the time course of DP for this cell for different directions of motion reveals a peak in DP of near 0.8 between 300 and 500 ms after the start of coherent motion for directions that are close to the preferred direction (Figure 4B). Further from the preferred direction the DP remains near chance (0.5). RTC also shows a (negative) peak for directions near the preferred (Figure 4C). Because different directions of motion were randomly interleaved, the results in Figure 4B and C show that this neuron’s correlation with behavior changed on a trial-to-trial basis depending on how its preferred direction related to the expected direction of motion.
Figure 4.

Data from one cell for all directions tested. A) The time course of the firing rate for each direction is shown. Coherent motion began at time = 0 ms. Eight directions relative to the preferred direction were tested for each cell (0°, ±22.5°, ±45°, ±90° and 180°). The same null direction (180°) data appear at the top and bottom of each plot. B) Time course of DP for each direction. A broad peak in detect probability is visible for directions near the preferred direction during the coherent motion portion of the trial. C) Time course of RTC for each direction tested. A broad peak in reaction time correlation is seen for directions near the preferred direction. The grey areas in panels B and C are beyond the median reaction time for that direction and were excluded from analysis.
Similar trends were observed for our entire sample of cells. For the preferred direction of motion, DP peaked at 0.58 around 400 ms after the start of the coherent motion (Figure 5A). For trials in the null direction(180°), the average DP was below 0.5, indicating that cells fired less when the animal successfully detected the motion in their null direction. Average RTC followed a similar pattern, but peaked about 200 ms into the coherent motion. The RTC peaks earlier because the correlation between rate of firing and reaction time is strongest near the onset of responses where there are differences in the rate of rise in spike on trials with fast and slow behavioral responses, while DP depends on differences in rates of firing that are largest once responses have risen to full strength/(Cook and Maunsell, 2002).
Figure 5.

Average time course of effects for the entire MT sample (n = 51). A) Normalized firing rate for each direction bin. Data for each cell were assigned to 8 bins centered on 0°,±22.5°, ±45°, ±90°, and 180° relative to the preferred direction (see Materials and Methods) and normalized to the maximum firing for any direction at any time between 500 ms before the onset of coherent motion and the median reaction times. The same null direction (180°) data appear at the top and bottom of each plot. B) Detect probability for each direction bin. Same formatting as in A. C) Time course of DP for 5 direction bins (0°, ±22.5°, ±45°, ±90°, and 180° relative to preferred direction). Lines indicate the mean detect probability for each bin. The blue shaded region depicts the 95% confidence intervals for the preferred direction. All traces are truncated at the overall median reaction time. D) Time course of reaction time correlation for selected bins. Same formatting as in C.
The data appearing in Figure 5A and B are replotted in 5C and D after binning responses by distance from the preferred direction (0, ±22°, ±45°, ±90°, 180°). We used a bootstrap analysis to determine the 95% confidence intervals for the time course of DP and RTC for each direction of motion. For clarity, only the confidence interval for the preferred direction is shown; other confidence intervals were comparatively broad. DP for the preferred direction, ±22°, and ±45° away from the preferred direction were significantly above 0.5 during the coherent motion, while the DP for ±90° was indistinguishable from 0.5 (Figure 5C). Although the DP for the null direction dropped below 0.5 (Figure 5A, C), this decline was not statistically significant. Complementary results were obtained for RTC (Figure 5D). The RTCs for the preferred direction, ±22°, and ±45° were significantly less than 0 during the coherent motion. RTC for the ±90° and 180° directions were indistinguishable from zero.
The magnitude and time course of the DP and RTC for the preferred direction are similar to those obtained for MT in a closely-related reaction time task (Cook and Maunsell, 2002). Cohen and Newsome (Cohen and Newsome, 2009)also examined CP and RTC for the preferred direction in MT in a reaction time task using a 0% coherent random dot stimulus. They found a similar RTC but their CP was slightly smaller than our DP. The DP value for the preferred direction is also quite similar to choice probability (CP) values obtained in non-reaction time motion discrimination tasks in MT (Britten et al., 1996; Croner and Albright, 1999; Williams et al., 2003)or MST (Celebrini and Newsome, 1994), and for MT during speed discrimination (Liu and Newsome, 2005), but higher values of CP have been found for MT neurons when animals engage in discrimination of low-contrast motion (Thiele et al., 1999), depth discrimination(Uka and DeAngelis, 2004)or judgment of structure from motion (Dodd et al., 2001; Krug et al., 2004).
Tuning of Correlations with Behavior
The effect of direction of motion on the correlation between neuronal activity and behavior can be seen with greater sensitivity by averaging responses during time windows near the peaks of the effects (400–500 ms after stimulus onset for DP, 200–300 ms after stimulus onset for RTC). For this analysis responses for each cell were normalized and then combined to produce a grand DT and RTC (see Materials and Methods). Results of this analysis are shown in Figure 6A and B. In each panel, the data points are the values for that parameter in each direction bin, the error bars are the 95% CI based on bootstrap, and the solid black line is a Gaussian curve fit to the values. This analysis shows that DP for the null direction is reliably less than 0.5 (0.46). The tuning for RTC is complementary, but the coefficient remains indistinguishable from 0 for the null direction given our sample size. The direction tuning for DP and RTC appear similar. Although the correspondence in tuning for these two measures is easy to understand, before this experiment it was theoretically possible that detection of motion and the reaction time to that motion could have had different relationships with activity in MT.
Figure 6.

Tuning of neuronal measures. A) Tuning of DP relative to difference from the preferred direction. Data points indicate the mean for each direction bin calculated at 400–500 ms into the coherent motion. Error bars are 95% confidence intervals. The solid line is the best fitting Gaussian (sigma = 75°) B) Tuning of RTC correlation at 200–300 ms into the coherent motion period. Same format as A. The sigma of the fitted Gaussian was 58°. C) Average normalized responses to random dot motion that was non-coherent (open symbols) and weakly coherent (closed symbols). The dashed and solid lines are the best-fitting Gaussians (sigma for coherent motion = 60°). D) Average sensitivity of neurons to different directions of motion, based on an ROC analysis comparing activity before and after the onset of coherent motion. The sigma of the fitted Gaussian is 71°.
The DP and RTC tuning with direction was furthermore similar to the spiking response to different directions. Figure 6C shows the average normalized response of the neurons to different directions of the weak coherent motion. (Note that the baseline is not zero.) The open points are average normalized responses to non-coherent motion preceding the coherent motion onset, and the dashed line is a Gaussian fit to these points. Responses to the non-coherent motion were largely unaffected by the anticipated motion. As described earlier, MT neurons were slightly suppressed by coherent motion in the null direction. DP and RTC both fell to baseline over the same range in which spiking responses fell to the response to non-coherent motion.
Figure 6D shows an alternative measure of the sensitivity of the neurons to different directions of motion. To assess the detection sensitivity of each cell we used an ROC analysis on the firing rates from the period 50 ms to 500 ms into the coherent motion versus the firing rates from the 500 ms immediately before onset of coherent motion to evaluate how well an ideal observer could use the firing of the cell to perform the task. An index of 1 indicates that the difference in firing rates between the coherent and non-coherent period could be used to perform the task perfectly, an index of 0.5 indicates the cell would provide no information that could be used to perform the task. Values below 0.5 indicate that responses were weaker when the coherent motion began. This tuning curve also closely resembles that for DP and RTC.
These analyses indicate a stronger correlation between behavior and MT activity when the task is performed on an axis within a range of directions near the preferred direction. One concern is that correlations can appear stronger when higher rates of firing occur, so that some of the tuning for DP and RTC might be artifactual. However, lowering spike rate can only draw DP toward 0.5, so rate differences cannot explain a mean DP less than 0.5 for the null direction (Figure 6A). Additionally, used weak coherent motion so that the rate of firing would not vary greatly with direction of motion. The mean responses to weak coherent motion in the preferred and null directions (Figure 6C) were 54 and 39spikes/s, a difference that should not contribute appreciably to DP or RTC. To confirm that these differences in correlation with behavior do not depend on differences in average firing rate for the different directions of motion, we examined the correlation between firing rate and DP across cells for all of our samples within 45° of the preferred direction (Figure 7A). This range was selected because the analyses so far had indicated a significant DP and RTC for these directions. The firing rates obtained in response to motion near the preferred direction varied considerably from cell-to-cell, but no reliable trend was observed for cells with higher firing rates to have higher DP values (r = 0.00, p = 0.98, slope = 0.00001). There was a marginally significant relationship between RTC and firing rate (Figure 7B, r = 0.13, p = 0.04, slope = −0.0007), but it was far too weak to account for the changes in RTC associated with different directions of motion.
Figure 7.

The effect of firing rate and cell performance on DP and RTC. Only trials with coherent motion within 45° of the preferred direction are included. Each cell can contribute up to 5 points to each plot. DP values were obtained based on activity 400 – 500 ms after the onset of coherent motion. RTC values were obtained based on activity 200 – 300 ms after onset of coherent motion. A) DP vs. average firing rate (r = 0.00, p = 0.98, slope = 0.00001). B) RTC versus firing rate. A weak trend is observed for RTC to vary by firing rate (r = 0.13, p = 0.04, slope = −0.0007/°). C) DP versus cell performance. Cell performance is measured by an ROC analysis of the firing rate obtained in response to the non-coherent motion versus the firing obtained for the coherent motion. A small but significant trend is observed for larger DP for cells that had better detection performance (r = 0.22, p = 0.001, slope = 0.16). D) RTC versus cell detection performance. Again a weak trend is observed for RTC to depend on cell performance (r = 0.11, p = 0.10, slope = −0.14).
We also examined the extent to which the strongest detect probabilities were observed for cells that were most sensitive to the change in motion coherence, as expected from the relationships shown in Figure 6A and D. For this analysis we used the measure of sensitivity described for Figure 6D. Again we examined the set of observations within 45° of the preferred direction. We found a weak but significant correlation between detection performance of the cell and DP (Figure 7C, r = 0.22, p = 0.001, slope = 0.16). A corresponding trend was observed for RTC, but it was not statistically significant (Figure 7D, r = 0.11, p = 0.1, slope = −0.14).
Discussion
Selective sampling of neuronal signals
We found that trial-to-trial correlations between the activity of MT neurons and behavioral detection vary with the direction of stimulus motion. DP was greatest for neurons with preferred directions aligned with the direction of stimulus motion, and fell below 0.5 for neurons that preferred the opposite direction. Correspondingly, RTC was most negative for neurons with preferred directions aligned with the stimulus direction, and most positive for neurons with the opposite preference.
Two previous studies have examined trial-to-trial correlations for MT neurons as a function of stimulus direction. Cohen and Newsome (2009) measured choice probability (CP) in monkeys that reported whether motion occurred in one or the opposite (coarse discrimination). Purushothaman and Bradley(2005) measured CP using a task in which animals had to report whether motion was slightly clockwise or counter-clockwise from a reference direction (fine discrimination). Both studies found that CP varied systematically with the difference between a neuron’s preferred direction and stimulus direction. For the coarse discrimination, as with our detection, CP was greatest for neurons with preferred directions aligned to the stimulus motion. Those cells should provide the most reliable signal for either coarse discrimination or detection because their rate of firing will change the most with motion onset. For fine discrimination, CP was greatest for neurons with one flank of their direction tuning curve aligned with the direction of stimulus motion. Those cells should provide the most reliable signal for fine discrimination because their response will change the most for small changes in stimulus direction. Thus, all three studies show that the strength of neuronal-behavioral correlations varies across neurons with different direction preferences. Which neurons are most correlated with behavior depends on the task demands, with the cells that are likely to be most informative having the strongest correlation.
The ability to base decisions more strongly on signals from neurons with either the peaks or the flanks of their tuning curves aligned to stimulus motion suggests that the mechanism for monitoring sensory signals in cortex is highly flexible. Many other studies have also suggested that decisions can be based on selective weighting of signals from neurons in a local cortical region. Psychophysical measurements from monkeys performing a disparity discrimination task revealed that the animals preferentially based their decisions on stimuli with near disparities, and significant CP values were correspondingly found for V2 neurons that were most sensitive to near disparities, but not for neurons that were most sensitive to far disparities (Nienborg and Cumming, 2007). Another study showed that when animals were required to perform a disparity discrimination task, the highest values of CP in MT were for neurons that had disparity tuning for “near” or “far”, while low values of CP were found for neurons that were tuned for disparities near zero(Uka and DeAngelis, 2004). This occurred despite the fact that the depth discrimination task was adjusted such that the two stimuli to be discriminated were the preferred and worst disparity for each cell, and suggests that the subset of neurons involved the task can depend on the training history of the animal rather than the cue given to the animal on each trial related to what stimulus to expect. Gu and colleagues (2008) showed that when monkeys perform a discrimination by integrating visual and vestibular signals, the activity of the subset of MST neurons that prefer the same direction of motion for either modality are most correlated with behavior. Other studies have shown that neurons in MT (Krug et al., 2004)and MST (Celebrini and Newsome, 1994; Heuer and Britten, 2004)are significantly correlated with behavior in some visual tasks but not in other, closely related, tasks.
Our results underscore how flexible readout can be. Previous studies of trial-by-trial correlations have kept the axis of motion fixed throughout data collection from each neuron. By randomly cueing different directions of motion on different trials, we could examine changes from one trial to the next that depended on the cued direction. We found that the correlation between a neuron’s activity and the behavioral detection could change from trial to trial depending on the alignment between the preferred direction and the stimulus direction. Thus, the coupling between MT activity and behavioral responses can change rapidly and flexibly to sample those neurons that are best suited to serve the immediate task.
Negative weighting of neuronal signals
CP in motion discrimination tasks is typically defined with respect to the stimulus direction closest to a neuron’s preferred direction, such that a CP greater than 0.5 means that the neuron fires more on trials in which the animal selected the stimulus closest to the neuron’s preferred direction. Nevertheless, CP can equally well be defined with respect to behavioral selection of the opposite direction. Using the conventional definition, CP is typically greater than 0.5. Defining CP with respect to the opposite direction inverts the measurement making CP less than 0.5 by exactly the amount it had been greater than 0.5 using the conventional definition. Thus, in studies of direction discrimination, CPs for preferred and null directions are forced to be symmetric around 0.5 by the symmetry of the task. Our detection task has no such symmetry, because on each trial motion occurs in a single, known direction, and behavioral performance could depend only on neurons that prefer directions close to the expected direction. In our task, DPs for anti-preferred neurons would be expected to average 0.5 if they were uninvolved in the task.
We found instead that DP was less than 0.5 in neurons preferring motion in the opposite direction, indicating that these neurons were given a negative weight. This strategy is adaptive, because neurons preferring both directions will provide information about motion onset. Nevertheless, this negative weighting of neurons preferring the opposite direction of motion (DP < 0.5) is notable. Given the average responses of MT neurons to motion in different directions (Figure 6C), a transition from no net motion to motion in any direction will increase the overall activity among a diverse population of MT neurons. Thus, detection of motion onset, unlike discrimination of different directions of motion, could be based on summing the activity of MT neurons without regard for direction preferences. Instead, the detection appears to depend on the same sort of differential weighting of neuronal responses that is thought to underlie discrimination tasks. It is possible that all behaviors involving known values of a stimulus parameter use differential weighting of neuronal responses when cortical organization brings neurons with opposing selectivities for that parameter into a local cortical region. Correlations between activity and behavior have been found only where there is some degree of spatial organization for the feature in question (Nienborg and Cumming, 2006), suggesting that differential activity may be an important aspect of cortical readout.
The DP below 0.5 for motion in the null direction also documents that the correlations we measured did not depend on overall arousal or fluctuations in spatial attention. A significant DP could arise from random fluctuations in arousal or spatial attention that modulated behavioral performance and the activity of all neurons in the recorded region. However, the existence of negative DP values shows that the process underlying DP samples neurons with different direction preferences selectively, and therefore cannot arise from changes in arousal or spatial attention. Finding DPs above and below 0.5 for different directions of motion also means that the modulation in DP cannot be attributed to differences in firing rate for motion in the preferred and null directions. Low firing rates can artificially draw DP toward 0.5, but cannot move DP from one side of 0.5 to the other.
The tuning of cortical readout
While a full description of which cells are selected for readout in this motion detection task would require more information, such as the strength of interneuronal correlations across the active population, the current results clarify the nature of readout that is used. In particular, the animal does not appear to use an overall change in average firing rate from the entire population of active cells in MT. The activity of cells with direction preferences orthogonal to the stimulus direction showed little correlation with behavior and the activity of cells that prefer the null direction is anti-correlated. The negative weighting given to neurons that prefer the null direction also rules out the possibility that the animal relies on only the neurons with direction preferences precisely aligned to the stimulus direction.
Superficially, the current results suggest that behavior in the direction detection task depended on differential weighting of signals from neurons spanning a broad range of direction preferences. MT neurons continue to provide reliable signals about motion strength even for directions off-axis from their preferred direction (Britten and Newsome, 1998). However, it is conceivable that the detection was based on monitoring only small subsets of neurons that prefer directions closely aligned to the stimulus direction and its opposite. In that case, other neurons could show correlations with behavior only because their activity was correlated with the monitored neurons, not because they contributed to the behavior. Cohen and Newsome (2009) showed in simulations that neurons that do not contribute to a behavior can have CPs that are indistinguishable from those for neurons that drive the behavior if the two types of neurons have even modestly correlated activity (see also Nienborg and Cumming, 2010). For this reason, the tuning of a cortical readout function cannot be inferred directly from the tuning of correlations such as DP or RTC.
While readout might have been limited to extremely narrow ranges of direction preferences, experiments that have perturbed small subsets of neurons suggest that readout is in fact broadly tuned. Pharmacological inactivation or electrical microstimulation in various structures affect behavioral responses in ways that suggest that neurons with widely disparate response preferences contribute to visual perception (Nichols and Newsome, 2002)and oculomotor responses (Lee et al., 1988; Groh et al., 1997). Results from psychophysics experiments also support the idea that the observer uses a broad readout of population activity (Treue et al., 2000; Hol and Treue, 2001)even when this is not adaptive (Lisberger and Ferrera, 1997). While further work will be needed to characterize the tuning of cortical readout and its consistency across different tasks and cortical areas, most behaviors may depend on a broad, tuned weighting of local populations in cortex.
Acknowledgments
We thank Marlene Cohen, Mark Histed, Incheol Kang and Joonyeol Lee for their thoughtful comments on drafts of the manuscript, and Dennis Murray and Tori Williford for technical assistance. Supported by HHMI and NEI R01EY005911
References
- Britten KH, Newsome WT. Tuning bandwidths for near-threshold stimuli in area MT. J Neurophysiol. 1998;80:762–770. doi: 10.1152/jn.1998.80.2.762. [DOI] [PubMed] [Google Scholar]
- Britten KH, Newsome WT, Shadlen MN, Celebrini S, Movshon JA. A relationship between behavioral choice and the visual responses of neurons in macaque MT. Vis Neurosci. 1996;13:97–100. doi: 10.1017/s095252380000715x. [DOI] [PubMed] [Google Scholar]
- Celebrini S, Newsome WT. Neuronal and psychophysiology sensitivity to motion signals in extrastriate area MST of the macaque monkey. J Neurosci. 1994;14:4109–4124. doi: 10.1523/JNEUROSCI.14-07-04109.1994. [DOI] [PMC free article] [PubMed] [Google Scholar]
- Cohen MR, Newsome WT. Estimates of the contribution of single neurons to perception depend on timescale and noise correlation. J Neurosci. 2009;29:6635–6648. doi: 10.1523/JNEUROSCI.5179-08.2009. [DOI] [PMC free article] [PubMed] [Google Scholar]
- Cook EP, Maunsell JHR. Dynamics of neuronal responses in macaque MT and VIP during motion detection. Nat Neurosci. 2002;5:985–994. doi: 10.1038/nn924. [DOI] [PubMed] [Google Scholar]
- Croner LJ, Albright TD. Segmentation by color influences responses of motion-sensitive neurons in the cortical middle temporal area. J Neurosci. 1999;19:3935–3951. doi: 10.1523/JNEUROSCI.19-10-03935.1999. [DOI] [PMC free article] [PubMed] [Google Scholar]
- Dodd JV, Krug K, Cumming BG, Parker AJ. Perceptually bistable three-dimensional figures evoke high choice probabilities in cortical area MT. J Neurosci. 2001;21:4809–4821. doi: 10.1523/JNEUROSCI.21-13-04809.2001. [DOI] [PMC free article] [PubMed] [Google Scholar]
- Green DM, Swets JA. Signal Detection Theory and Psychophysics. Wiley; New York: 1966. [Google Scholar]
- Groh JM, Born RT, Newsome WT. How is a sensory map read out? Effects of microstimulation in visual area MT on saccades and smooth pursuit eye movements. J Neurosci. 1997;17:4312–4330. doi: 10.1523/JNEUROSCI.17-11-04312.1997. [DOI] [PMC free article] [PubMed] [Google Scholar]
- Gu Y, Angelaki DE, DeAngelis GC. Neural correlates of multisensory cue integration in macaque MSTd. Nat Neurosci. 2008;11:1201–1210. doi: 10.1038/nn.2191. [DOI] [PMC free article] [PubMed] [Google Scholar]
- Heuer HW, Britten KH. Optic flow signals in extrastriate area MST: comparison of perceptual and neuronal sensitivity. J Neurophysiol. 2004;91:1314–1326. doi: 10.1152/jn.00637.2003. [DOI] [PubMed] [Google Scholar]
- Hol K, Treue S. Different populations of neurons contribute to the detection and discrimination of visual motion. Vis Res. 2001;41:685–689. doi: 10.1016/s0042-6989(00)00314-x. [DOI] [PubMed] [Google Scholar]
- Krug K, Cumming BG, Parker AJ. Comparing perceptual signals of single V5/MT neurons in two binocular depth tasks. J Neurophysiol S. 2004;92:1586–1596. doi: 10.1152/jn.00851.2003. [DOI] [PubMed] [Google Scholar]
- Lee C, Rohrer WH, Sparks DL. Population coding of saccadic eye movements by neurons in the superior colliculus. Nature. 1988;332:357–360. doi: 10.1038/332357a0. [DOI] [PubMed] [Google Scholar]
- Lisberger SG, Ferrera VP. Vector averaging for smooth pursuit eye movements initiated by two moving targets in monkeys. J Neurosci. 1997;17:7490–7502. doi: 10.1523/JNEUROSCI.17-19-07490.1997. [DOI] [PMC free article] [PubMed] [Google Scholar]
- Liu J, Newsome WT. Correlation between speed perception and neural activity in the middle temporal visual area. J Neurosci. 2005;25:711–722. doi: 10.1523/JNEUROSCI.4034-04.2005. [DOI] [PMC free article] [PubMed] [Google Scholar]
- Martinez-Trujillo JC, Treue S. Feature-based attention increases the selectivity of population responses in primate visual cortex. Curr Biol. 2004;14:744–751. doi: 10.1016/j.cub.2004.04.028. [DOI] [PubMed] [Google Scholar]
- Maunsell JHR, Van Essen DC. Functional properties of neurons in the middle temporal visual area of the macaque: I. Selectivity for stimulus direction, speed, and orientation. J Neurophysiol. 1983;49:1127–1147. doi: 10.1152/jn.1983.49.5.1127. [DOI] [PubMed] [Google Scholar]
- Newsome WT, Pare EB. A selective impairment of motion processing following lesions of the middle temporal visual area (MT) J Neurosci. 1988;8:2201–2211. doi: 10.1523/JNEUROSCI.08-06-02201.1988. [DOI] [PMC free article] [PubMed] [Google Scholar]
- Newsome WT, Britten KH, Movshon JA. Neuronal correlates of a perceptual decision. Nature. 1989;341:52–54. doi: 10.1038/341052a0. [DOI] [PubMed] [Google Scholar]
- Nichols MJ, Newsome WT. Middle temporal visual area microstimulation influences veridical judgments of motion direction. J Neurosci. 2002;22:9530–9540. doi: 10.1523/JNEUROSCI.22-21-09530.2002. [DOI] [PMC free article] [PubMed] [Google Scholar]
- Nienborg H, Cumming B. Correlations between the activity of sensory neurons and behavior: how much do they tell us about a neuron’s causality? Curr Opin Neurobiol. 2010;20:376–381. doi: 10.1016/j.conb.2010.05.002. [DOI] [PMC free article] [PubMed] [Google Scholar]
- Nienborg H, Cumming BG. Macaque V2 neurons, but not V1 neurons, show choice-related activity. J Neurosci. 2006;26:9567–9578. doi: 10.1523/JNEUROSCI.2256-06.2006. [DOI] [PMC free article] [PubMed] [Google Scholar]
- Nienborg H, Cumming BG. Psychophysically measured task strategy for disparity discrimination is reflected in V2 neurons. Nat Neurosci. 2007;10:1608–1614. doi: 10.1038/nn1991. [DOI] [PMC free article] [PubMed] [Google Scholar]
- Purushothaman G, Bradley DC. Neural population code for fine perceptual decisions in area MT. Nat Neurosci. 2005;8:99–106. doi: 10.1038/nn1373. [DOI] [PubMed] [Google Scholar]
- Salzman CD, Britten KH, Newsome WT. Cortical microstimulation influences perceptual judgements of motion direction. Nature. 1990;346:174–177. doi: 10.1038/346174a0. [DOI] [PubMed] [Google Scholar]
- Salzman CD, Murasugi CM, Britten KH, Newsome WT. Microstimulation in visual area MT: Effects on direction discrimination performance. J Neurosci. 1992;12:2331–2355. doi: 10.1523/JNEUROSCI.12-06-02331.1992. [DOI] [PMC free article] [PubMed] [Google Scholar]
- Shadlen MN, Britten KH, Newsome WT, Movshon JA. A computational analysis of the relationship between neuronal and behavioral responses to visual motion. J Neurosci. 1996;16:1486–1510. doi: 10.1523/JNEUROSCI.16-04-01486.1996. [DOI] [PMC free article] [PubMed] [Google Scholar]
- Thiele A, Distler C, Hoffmann KP. Decision-related activity in the macaque dorsal visual pathway. Eur J Neurosci. 1999;11:2044–2058. doi: 10.1046/j.1460-9568.1999.00630.x. [DOI] [PubMed] [Google Scholar]
- Treue S, Hol K, Rauber HJ. Seeing multiple directions of motion physiology and psychophysics. Nat Neurosci. 2000;3:270–276. doi: 10.1038/72985. [DOI] [PubMed] [Google Scholar]
- Treue S, Martinez-Trujillo JC. Feature-based attention influences motion processing gain in macaque visual cortex. Nature. 1999;399:575–579. doi: 10.1038/21176. [DOI] [PubMed] [Google Scholar]
- Uka T, DeAngelis GC. Contribution of area MT to stereoscopic depth perception: choice-related response modulations reflect task strategy. Neuron. 2004;42:297–310. doi: 10.1016/s0896-6273(04)00186-2. [DOI] [PubMed] [Google Scholar]
- Williams ZM, Elfar JC, Eskandar EN, Toth LJ, Assad JA. Parietal activity and the perceived direction of ambiguous apparent motion. Nat Neurosci. 2003;6:616–623. doi: 10.1038/nn1055. [DOI] [PubMed] [Google Scholar]