

Abstract
Neuregulin 1 (NRG1) is a trophic factor that has been implicated in neural development, neurotransmission and synaptic plasticity. NRG1 has multiple isoforms that are generated by usage of different promoters and alternative splicing of a single gene. However, little is known about NRG1 isoform composition profile, whether it changes during development or the underlying mechanisms. We found that each of the six types of NRG1 has a distinct expression pattern in the brain at different ages, resulting in a change in NRG1 isoform composition. In both human and rat, the most dominant are types III and II followed by either types I or V, while types IV and VI are the least abundant. The expression of NRG1 isoforms is higher in rat brains at ages of E13 and P5 (in particular type V), suggesting roles in early neural development and in the neonatal critical period. At the cellular level, the majority of NRG1 isoforms (types I, II and III) is expressed in excitatory neurons although they are also present in GABAergic neurons and astrocytes. Finally, the expression of each NRG1 isoform is distinctly regulated by neuronal activity, which causes significant increase in type I and IV NRG1 levels. Neuronal activity regulation of type IV expression requires a CRE cis-element in the 5′UTR that bind to CREB. These results indicate that expression of NRG1 isoforms is regulated by distinct mechanisms, which may contribute to versatile functions of NRG1 and pathologic mechanisms of brain disorders such as schizophrenia.
Keywords: Neuregulin 1, schizophrenia, gene regulation, neuronal activity, promoter, neurons
Introduction
NRG1 is a family of growth factors that has been implicated in the development of neural crest cells (Mei and Xiong, 2008) and GABAergic circuitry (Woo et al., 2007; Fazzari et al., 2010; Ting et al., 2011). It is also implicated in the migration (Anton et al., 1997; Rio et al., 1997), neurite outgrowth (Bermingham-McDonogh et al., 1996; Mahanthappa et al., 1996), and synapse formation (Li et al., 2007) of excitatory neurons. NRG1 suppresses LTP (Huang et al., 2000; Ma et al., 2003; Kwon et al., 2005; Pitcher et al., 2008) and the activity of pyramidal neurons (Wen et al., 2010), probably via promoting GABA release from interneurons (Chen et al., 2010; Wen et al., 2010). The diverse functions of NRG1 are contributed in part by a large number of NRG1 isoforms. In human, NRG1 has more than 30 isoforms that can be grouped into six types (I-VI), each with a distinct N-terminal region (Falls, 2003; Mei and Xiong, 2008). Generation of the enormous numbers of NRG1 isoforms in human is thought to be mainly contributed by alternative splicing of more than 30 exons of the gene. Recent studies suggest that its expression may also be controlled by 5′ promoters of different types of NRG1 (Steinthorsdottir et al., 2004; Tan et al., 2007). The NRG1 isoforms differ in domain structure and expression levels in various tissues/cells during neural development and in adult. Mice carrying mutations that inactivate particular isoforms show distinct phenotypes, in support of the notion that NRG1 isoforms have distinct functions (Kramer et al., 1996; Fischbach and Rosen, 1997; Meyer et al., 1997; Gerlai et al., 2000; Wolpowitz et al., 2000; Rimer et al., 2005; Bjarnadottir et al., 2007).
In the nervous system, the genes of NRG1 and its receptor ErbB4 are associated with schizophrenia (Stefansson et al., 2002; Yang et al., 2003; Nicodemus et al., 2006; Norton et al., 2006; Silberberg et al., 2006; Law et al., 2007; Mei and Xiong, 2008), bipolar disorder (Thomson et al., 2007; Goes et al., 2008; Prata et al., 2009; Zuliani et al., 2011) and positive symptoms of psychosis in late onset Alzheimer’s disease (Go et al., 2005). NRG1 signaling may play a role in epilepsy, as the ErbB4 gene was disrupted in a patient with early myoclonic encephalopathy (Backx et al., 2009). Finally, NRG1 appears to be neuroprotective in stroke (Shyu et al., 2004; Xu et al., 2004).
Though six types of NRG1 have been identified in human, little is known about the composition profile and whether it changes during development. Neither is clear about whether they are all expressed in rodents. We attempted to address these questions in this study. In addition, we determined in what neurons or cells NRG1 isoforms are expressed. Finally, we investigated mechanisms of the regulation of their expression by neuronal activity. Results demonstrate that expression of NRG1 isoforms is regualted by complex mechanisms, which may contribute to versatile functions of NRG1 and pathology of brain disorders including schizophrenia.
Materials and Methods
Animal
Sprague-Dawley rats of either sex were purchased from Harlan. Experiments with animals were approved by the Institutional Animal Care and Use Committee of the Georgia Health Sciences University.
Primary cortical neuron culture
Cortical neurons were cultured as described previously (Woo et al., 2007). Briefly, cerebral cortex of E18 Sprague-Dawley rats was dissociated in HBSS containing 0.1% trypsin. Cells were seeded on poly-L-lysine-coated 12-well plates at high density (8 × 10⁵/well) in DMEM media with 10% FBS. 4 hr later the media was replaced with Neurobasal supplemented with 2% B27, 2 mM glutamine, 1 I.U./mL penicillin and 100 μg/mL streptomycin. At DIV12, most, if not all, cells under our condition were neurons (Supplemental data, Figs. S1A and B). In some experiments, neurons (DIV3 – 12) were treated with 50 mM KCl or 100 μM kainic acid for 6 hr before RNA extraction.
Primary astrocyte culture
Astrocytes were cultured as described previously with modification (McCarthy and de Vellis, 1980). Briefly, cerebral cortex was of P3 Sprague-Dawley rats were dissociated in HBSS containing 0.1% trypsin. Cells were seeded on poly-L-lysine-coated 100 mm culture dish at high density (1 × 10⁷/dish) in DMEM media with 10% FBS, 1 I.U./mL penicillin and 100 μg/mL streptomycin. Media was changes every 3 days, when dishes were shacked and washed extensively 3 times with PBS to remove oligodendrocytes, microglia and neurons. At DIV10, >90% glia cells were GFAP-positive astrocytes (sppulimentary data, Fig. S1C). Astrocytes were trypsinized and replated on 12-well plates till confluency >90%, before being treated with 50 mM KCl for 6 hr.
Isolation of total RNA
Total RNA was isolated from cultured neurons or astrocytes by using RNeasy mini kit (Qiagen, Valencia, CA) and from brain samples by using Trizol (Invitrogen, Carlsbad, CA), purified by using RNeasy mini kit (Qiagen, Valencia, CA). In some experiments, adult rats were treated for 4 hr with saline (control) or kainic cid (KA, 10 mg/kg body weight, i.p.). Epileptic seizures were observed within 1 hr after KA injection (Sperk, 1994).
Reverse transcription quantitative PCR (RT-qPCR)
Equal amounts of total RNAs (1 μg for cultured neurons and 4 μg for brain tissue) were reverse-transcribed by random hexamer-primers using SuperScript III reverse transcriptase (Invitrogen, Carlsbad, CA). 1/200 (1/40 for type VI) of resulting cDNA was analyzed by quantitative real time PCR (qPCR) in triplicates using SYBR Green/ROX (Fermentas, Glen Burnie, MD) on Chromo 4 (Bio-Rad, Hercules, CA). Forward primers were correspondent to sequences in type-specific exons and reverse primers were in either Ig or EGF exons. Primers are exon-spanning for most PCR reactions except for those for the EGF domain that should amplify all NRG1 isoforms. mRNA levels were normalized to β-actin that was assayed simultaneously on the same reaction plate. To measure the absolute mRNA copy number of a given isoform, each qPCR reaction plate included three samples (in triplicates) that contained known copy numbers (i.e., 102, 104 and 106) of isoform-specific templates, to generate a standard curve. Fig. S2A list all primers used in the study.
Dual luciferase assay
5′ untranslated regions (UTR) of type I and IV NRG1s were amplified by PCR using as template BAC clone RP11-957C19 and RP11-957H23, respectively (Roswell Park Cancer Institute, Buffalo, New York). They were sub-cloned into pGL2 vector, upstream of the firefly luciferase gene, to generate Iwt-Luc and IVwt-Luc. Mutant luciferase constructs were generated by mutagenesis (Stragtagene, La Jolla, CA) and verified by sequencing. SH-SY5Y human neuroblastoma cells were co-transfected by electroporation (Lonza, Switzerland) with a pGL2-based luciferase construct with pRL-TK that expresses Rellina luciferase under the control of the TK promoter (ratio, 20:1). 12 hr after transfection, cells were treated with vehicle or 50 mM KCl for 12 hr before lysis. Activities of firefly and Rellina luciferases were assayed by a microplate luminometer (Tropix TR717, Bedford, MA). Firefly luciferase activity was normalized by Rellina luciferase activity to eliminate sample handling variation. Fig. S2B list all primers used in the study.
Fluorescent in situ hybridization (FISH)
Rats were perfused with room temperature 4% formaldehyde in PBS. Brain samples were post-fixed in 4% formaldehyde in PBS for 18~24 hr at 4°C, dehydrated, and embedded in paraffin. Brain sections (5 μm in thickness) were subjected to dual fluorescent in situ hybridization by using RNAscope (Advanced Cell Diagnostics, Inc., Hayward, CA) following the manufacturer’s protocol (Masand et al., 2011). For each gene, a set of 40 specific probes (25 bp in length in average) were synthesized that span ~ 1 kb region in entirety with no base gaps in between. The probes were designed in pairs, of which each probe had a different oligonucleotide tail that contributed to one essential half of the binding site for a pre-amplifier. Each preamplifier could hybridize to 20 amplifiers, each of which could hybridize to 20 fluorescent label probes. For dual fluorescence in situ, each set of the probes uses different oligonucleotide tails, preamplifiers, amplifiers and label probes that were labeled with unique fluorophores. In control experiments, brain sections were incubated with probes of DapB, a protein of E. coli that is not expressed in mammalian cells, or probes against ubiquitin C, a protein that is ubiquitously expressed. As shown in Fig. S3, no signal was produced by the DapB probes whereas the ubiquitin C probes labeled all cells in brain sections. This demonstrated the specificity of the in situ method. Three to six views (150 μm × 230 μm per view) were randomly selected in each of layers II to VI (total 14 – 18 views) and FISH-labeled cells were counted by using ImageJ software. The sequences for probe generation as follow: type I NRG1, 31~444 of U02322 + 544 bp intron; type II NRG1, 37~514 of AF194993 + 432 bp intron; type III NRG1, 37~1179 of AF194438; GAD67, 974~1925 of M76177.1; VGLUT1, 532~1633 of U07609.1.
Electrophoretic mobility shift assay (EMSA)
EMSA was performed as described previously with modification (Kim et al., 2005). Briefly, His-CREB1 was purified by Ni-NTA (Qiagen, Valencia, CA), desalted by Centriprep (Millipore, Billerica, MA), and incubated in 20 μl of (final volume) of the DNA-binding buffer [(10 mM HEPES, pH 7.9, 50 mM KCl, 0.5 mM dithiothreitol, 5% glycerol), 0.1 μg of poly(dI-dC)] and 2.5 nM of IRDye 700 end-labeled double-stranded oligonucleotide probes (Eurofins MWG Operon, Huntsville, AL). After incubation at 30°C for 15 min, the reaction mixture was resolved by 6% acrylamide gel electrophoresis in 0.5 X Tris-borate-EDTA buffer at 4°C. IRDye-probes and associated complexes were visualized by Odyssey Infrared Imaging System (LI-COR, Lincoln, Nebraska USA). In some reactions, excessive unlabeled double-stranded oligonucleotides or anti-CREB antibody was included. The proximal CRE (p-CRE) probe sequence was 5′CAGGT CCTTG CTCAC TGAAG CGTCA CCTCT CACTC CCCAG where the CRE element was indicated in bold.
Statistical analysis
For multiple group comparisons, statistical differences were calculated by one-way ANOVA followed by paired Student’s t-test. For data presentation, normalized values were averaged and presented as mean ± SEM. Values of p < 0.05 were considered statistically significant.
Results
NRG1 isoform compositions of the human cerebral cortex
There are 6 types of NRG1 in human, each of which has a distinct N-terminal region (Steinthorsdottir et al., 2004; Mei and Xiong, 2008). Types I, II, IV, and V have an Ig domain prior to the EGF domain whereas types III and VI do not (Fig. 1A). RT-qPCR was performed to characterize the composition of NRG1 isoforms in human brain and to determine whether it changes during development. Forward primers were designed based on type-specific sequences (Figs. 1A and S1A). Reverse primers were against either the Ig (for types I, II, IV, and V) or EGF domain (for types III and VI). To ensure similar and high efficiency in qPCR among different types, two additional criteria were used. First, primers were designed to have identical annealing temperatures (i.e., 60°C) for all types of NRG1, including those for the gene β-actin. Second, the size of PCR products was kept to less than 200 bp. Sequences of these primers are shown in Fig. S1A. Using as template the cDNA of human cerebral cortexes, PCR with type-specific primers generated products of predicted sizes (Fig. 1B). Finally, to measure the absolute mRNA copy number of a given isoform, each qPCR reaction plate included three samples that contained known copy numbers (i.e., 102, 104 and 106) of isoform-specific templates, to generate a standard curve.
Fig. 1. Distinct expression patterns of NRG1 types in the human cerebral cortex.

A, Diagram of NRG1 gene structure. Type-specific forward primers (indicated by arrows) for each type were located in unique exons whereas reverse primers were located in either Ig or EGF domain. Forward primers were also designed for EGF domain. B, Agarose gel electrophoresis of RT-qPCR products. Total RNA of human cerebral cortex was used as template in RT-qPCR with specific primers. Products were resolved on 3% agarose gel and visualized by ethidium bromide staining. Bands were at the anticipated molecular weight. Due to potential difference in PCR efficiencies, band intensity did not faithfully indicate relative amount. C, Different levels of NRG1 types in the cerebral cortex of a 13-year-old subject. D, Composition of NRG1 types in the cerebral cortex of a 13-year-old subject. E, Different levels of NRG1 types in the cerebral cortex of a 60-year-old subject. The copy numbers per micro gram total RNA of each type NRG1 were 1.67 ± 0.17 × 10⁴ (type I), 8.31 ± 1.17 × 10⁴ (type II), 2.93 ± 0.23 × 10⁵ (type III), 1.31 ± 0.06 × 10³ (type IV), 5.12 ± 0.73 × 10³ (type V), and 227 ± 226 (type VI). F, Composition of NRG1 types in the cerebral cortex of a 60-year-old subject.
As shown in Figs. 1C and 1E, all six types of NRG1 were detectable in the cerebral cortex of healthy human subjects at ages of 13 and 60, respectively, in agreement with previous reports (Steinthorsdottir et al., 2004; Tan et al., 2007). We measured the mRNA copy number of each isoform per microgram of RNA. Unless otherwise indicated, “copies” throughout the text indicates mRNA copy numbers/μg total RNA. The most abundant type at age 13 was type III, accounting for ~59% (with 3.39 ± 0.11 × 10⁵ copies), followed by types II (~29%, 1.68 ± 0.07 × 10⁵ copies), V (~7%, 3.96 ± 0.17 × 10⁴ copies), and I (~4%, 2.45 ± 0.15 × 10⁴ copies). Levels of types IV and VI were extremely low, accounting for less than 1% of total NRG1 (1.40 ± 0.32 × 10³ and 3.08 ± 0.91 × 10² copies, respectively). During development or ageing, the total copy concentration reduced by ~29% from 5.73 ± 0.10 × 10⁵ copies in 13-year-old cerebral cortex to 3.99 ± 0.36 × 10⁵ copies in 60-year-old cerebral cortex. This resulted from reduction in all NRG1 isoforms. Nevertheless, type III remained the most dominant isoform representing ~73% (2.92 ± 0.23 × 10⁵ copies) of total NRG1. The increase in type III’s representation appeared to be at the sacrifice of types II and V (reduced to ~21% and ~1%, respectively). The composition of types I, IV, and VI showed no significant change although the copy numbers were reduced proportionally. These results demonstrate that the major NRG1 isoform in human cortex is type III, followed by types II and I; and the composition changes during development in particular for type V.
Distinct expression patterns of NRG1 isoforms during rat neural development
Type I, II and III are known to express in rodent brains (Pinkas-Kramarski et al., 1994; Corfas et al., 1995; Lu et al., 1995; Chuah et al., 2000; Bovetti et al., 2006; Edwards and Bottenstein, 2006). However, whether the other, novel types exist in rodent brains remains unknown. Neither is known about relative levels of NRG1 isoforms during development. Similar strategies for human NRG1 primers were used to design primers of rat NRG1 types (Figs. 1A and S2A). Because information was not available on mRNA sequences of rodent type IV, V and VI NRG1s, we aligned rat genome sequences to human mRNA sequences and identified putative, correspondent exons in rat. Forward primers against rat types IV, V and VI were designed based on these sequences (Fig. S2A). One additional pair of primers was designed against the EGF domain to detect all isoforms (Fig. 1A). As with studies of human NRG1 isoforms, PCR products were kept less than 200 bp and primers had identical annealing temperatures (i.e., 60°C) for all types of NRG1,β-actin, and BDNF, except those of type IV whose annealing temperature was 70°C to obtain specific bands. Because of this, we designed another pair of primers for β-actin (RT-b-2) with annealing temperature at 70°C (Supplemental data, Fig. S2A). Using as template the cDNA of rat embryonic brain, PCR with type-specific primers generated products of predicted sizes (Fig. 2A). To make sure that the products were not artifacts amplified by PCR, they were subcloned into pGEX-T-easy vector (Promega, Madison, WI) and verified by DNA sequencing (Fig. 2B). These indicate that six different types of NRG1 are expressed in rodent embryonic brains.
Fig. 2. Expression of all six types of NRG1 in rat brain.

RT-qPCR was performed using the same strategy as described in Fig. 1A. A, Agarose gel electrophoresis of RT-qPCR products. Total RNA of E18 rat brain was used as template in RT-qPCR with specific primers. Products were resolved on 3% agarose gel and visualized by ethidium bromide staining. Bands were at the anticipated molecular weight. Due to potential difference in PCR efficiencies, band intensity did not faithfully indicate relative amount. B, DNA sequence analysis of RT-qPCR products. RT-qPCR products were purified and subcloned into pGEM-T easy vector (Promega, Madison, WI) for sequencing with T7 primer. Shown were partial DNA sequences of respective domains.
As in studies of human NRG1 isoforms, the absolute mRNA copy concentration of a given isoform was calculated based on isoform-specific standard curves generated on the same qPCR reaction plate. As shown in Fig. 3A and 3B, in E18 rat cerebral cortex, type II was the most abundant NRG1 isoform (with 1.28 ± 0.06 ×10⁶ copies), accounting for 46.66% of total NRG1 isoforms. Next abundant isoforms were types I and III (with 6.81 ± 0.09 × 10⁵ and 7.81 ± 0.17 × 10⁵ copies, respectively), accounting for ~25% and ~28%, respectively. These three types account for more than 99% of total NRG1s in the embryonic cortex. Among the remainder were types IV and V with about 5.57 ± 1.27 × 10² and 3. 89 ± 0.85 × 10³ copies, respectively. Type VI was the least abundant (with fewer than 50 copies) in embryonic cortex.
Fig. 3. Development-dependent expression of NRG1 types.

RT-qPCR was performed as described in Fig. 1A with the RNA templates of cerebral cortex of different age. A, Different expression levels of NRG1 types in E18 cerebral cortex. The copy numbers per μg total RNA of each type NRG1 were 6.81 ± 0.09 × 10⁵ (type I), 1.28 ± 0.06 × 10⁶ (type II), 7.81± 0.17 × 10⁵ (type III), 557 ± 127 (type IV), 3890 ± 850 (type V), and 31 ± 14 (type VI), whereas total NRG1 were 2.75 ± 0.08 × 10⁶. B, Composition of NRG1 types in E18 cerebral cortex. C, Different expression levels of NRG1 types in P5 cerebral cortex. The copy number per μg total RNA of each type NRG1 were 3.22 ± 0.10 × 10⁶ (type I), 9.16 ± 0.45 × 10⁶ (type II), 6.03 ± 0.40 × 10⁶ (type III), 1.43 ± 0.12 × 10³ (type IV), 2.79 ± 0.50 × 10⁶ (type V) and 1.06 ± 0.63 × 10³ (type VI) whereas total NRG1 were 2.12 ± 0.12 × 10⁷. D, Composition of NRG1 types in P5 cerebral cortex. E, Different expression levels of NRG1 types in P15 cerebral cortex. The copy number per μg total RNA of each type NRG1 were 4.51 ± 0.75 × 10⁴ (type I), 6.25 ± 0.33 × 10⁵ (type II), 2.35 ± 0.06 × 10⁵ (type III), 0 (undetectable, type IV), 1.02 ± 0.08 × 10⁴ (type V) and 3.26 ± 2.32 × 10² type VI whereas total NRG1 were 9.16 ± 0.27 × 10⁷. F, Composition of NRG1 types in P15 cerebral cortex. G, Different expression levels of NRG1 types in P70 cerebral cortex. The copy number per μg total RNA of each type NRG1 were 1.46 ± 0.21 × 10⁴ (type I) 1.46 ± 0.28 × 10⁵ (type II), 1.88 ± 0.25 × 10⁵ (type III), 0 (undetectable, type IV), 5.58 ±13.60 × 10² (type V) and 64 ± 13 (type IV) whereas total NRG1 were 3.54 ± 0.55 × 10⁷. H, Composition of NRG1 types in P70 cerebral cortex. I, Alteration of NRG1 types in developing cerebral cortex.
Interestingly, total NRG1 levels in the cortex at postnatal day (P) 5, a critical period of neural development (Clancy et al., 2007), were increased by 7.7 folds (to 2.12 ± 0.12 × 10⁷ copies). The increase occurred in all isoforms (Fig. 3C). Remarkably, type V increased by 718 fold to 2.79 ± 0.50 × 10⁶ copies, which accounted for ~13% of total NRG1. Type VI increased by 34 fold, to 1.06 ± 0.63 × 10³ copies. Nevertheless, types II, III, and I remained to be most abundant, accounting for ~43%, ~28%, and ~15%, respectively (Fig. 3D). The total NRG1 levels reduced dramatically at P15, to 9.16 ± 0.27 × 10⁵ copies and remained relatively low afterwards (Figs. 3E and 3I). Most noticeable changes were for types I (from ~15% to ~5%), V (from ~13% to ~1%) and IV (from detectable to undetectable) (Fig. 3F). Type IV remained undetectable afterwards and in adult. This observation was in agreement with a recent report that human type IV NRG1 mainly expresses in fetal stage (Tan et al., 2007).
These results could suggest unique functions of NRG1 isoforms during development and underlying regulatory mechanisms. The developmental changes alter the composition of NRG1 signaling contributed by each isoform in adult cortex. At P70, the most abundant NRG1 isoforms are types III and II, accounting for ~53% and ~41%, respectively. Followed by type I (~25%), type V (~2%) and type VI (<1%). Type IV is undetectable. (Figs. 3G and 3H). Similar developmental expression patterns were observed for NRG1 isoform expressions in the hippocampus (data not shown). At E13, type I and III NRG1 were expressed at higher levels than that at E18, suggesting a role of these two isoforms in earlier development.
Expression of NRG1 isoforms in neurons and astrocytes
Brain expression of NRG1 isoforms has been studied by in situ hybridization (Pinkas-Kramarski et al., 1994; Corfas et al., 1995; Eilam et al., 1998; Kerber et al., 2003; Flames et al., 2004; Woo et al., 2007). However, no information is available regarding cellular expression pattern of NRG1 isoforms. To determine in which cells NRG1 isoforms are expressed, we performed fluorescent in situ hybridization (FISH) by using RNAscope (Advanced Cell Diagnostics, Inc., Hayward, CA). The characterized type-specific sequences of type IV, V, and VI are less than 100 bp, shorter than the optimal length of probes for in situ hybridization. Therefore, we focused on expression of types I, II and III in the cortical region. As shown in Fig. 4A, these isoforms were detectable in neurons labeled by VGLUT1, a marker of excitatory neurons (Bellocchio et al., 2000). Quantitative analysis indicated that ~51% of VGLUT1-positive neurons were positive for type III, ~31% for type II, and ~5% for type I (Fig. 4B). Notice that NRG1 signals were also present in cells that were not positive for VGLUT1, suggesting that they may be expressed in other neurons or cells. To address this question, dual FISH was done with probes for NRG1 isoforms and GAD67, a marker of GABAergic interneurons (Esclapez et al., 1993). Indeed, NRG1 isoforms co-stained with GAD67: ~40% of GAD67-positive neurons were positive for type III, ~6% for type II, and ~2% for type I (Figs. 4C and 4D). Interestingly, of type I-positive neurons, ~10% were positive for GAD67 and ~46% for VGLUT1, leaving ~43% of cells negative for either of the markers (Fig. 4E). Similarly, ~14% of type II-positive and ~26% of type III-positive cells were negative for either CGLUT1 or GAD67 (Fig. 4E). These results suggested that NRG1 isoforms may be expressed in cells “other” than excitatory or inhibitory neurons. We speculated that astrocytes may express NRG1, and tested this notion by RT-qPCR analysis of cultured rat astrocytes. As shown in Fig. 6G, various NRG1 isoforms were detectable in astrocytes, where the composition was ~83% for type I, ~13% for type III, ~4% for type II, and remainder isoforms less than 1%. This result is in agreement with the report that NRG1 is present in astrocytes (Kerber et al., 2003).
Fig. 4. Expression of NRG1 isoforms in excitatory and inhibitory neurons and astrocytes.

Dual fluorescence in situ hybridization (FISH) was performed to determine which cells in the cortex express NRG1 isoforms. A, Representative images of dual FISH of VGLUT1 (red) and NRG1 isoforms (aqua). Regions in white rectangles in the upper panels were enlarged in lower panels. Arrow heads indicate cells expressing NRG1 isoforms, but not VGLUT1. Arrows indicate cells expressing both NRG1 isoforms and VGLUT1. Bar, 20 μm. B, Percentage of VGLUT1 positive cells expressing NRG1 types I (5.47 ± 1.13 %, n=18), II (31.09 ± 3.58 %, n=18), or III (51.10 ± 2.71 %, n=14). C, Representative images of dual FISH of GAD67 (red) and NRG1 isoforms (aqua). Regions in white rectangles in the upper panels were enlarged in lower panels. Arrow heads indicate cells expressing NRG1 isoforms, but not GAD67. Arrows indicate cells expressing both NRG1 isoforms and GAD67. Bar, 20 μm. D, Percentage of GAD67 positive cells expressing NRG1 types I (2.15 ± 1.29 %, n=18), II (5.62 ± 1.83 %, n=18), or III (39.56 ± 3.91 %, n=14).. E, Distribution of NRG1 isoforms in VGLUT1 (I, 46.50 ± 8.35 %, n=18; II, 82.47 ± 2.78 %, n=18; III, 58.61 ± 1.87 %, n=18) and GAD67 (I, 10.19 ± 6.20 %, n=18; II, 3.63 ± 1.23 %, n=18; III, 15.58 ± 1.64 %, n=14) positive neurons.
Fig. 6. Differential regulation of NRG1 type expression in cultured neurons and atrocytes by KCl treatment.

Total RNAs were isolated from control or KCl (50 mM, 6 hr)-treated cortical neurons (A–F, indicated ages) and astrocytes (G, H), and subjected to RT-qPCR. NRG1 types were first normalized by β-actin whose levels were revealed in same reactions and then normalized by control. **p<0.01
Neuronal activity differently regulates NRG1 expression
Neuronal activity was shown to increase NRG1 expression (Eilam et al., 1998), where the NRG1 primers would detect isoforms containing the Ig and EGF domains which include types I, II, IV and V NRG1. It remains unknown which type(s) of NRG1 are regulated by neuronal activity. To determine which types are targets of neuronal activity, epilectic seizures were induced in adult rat brain by kainic acid injection (10 mg/kg, ip) (Sperk et al., 1983). Under our conditions, seizures began to develop within 1 hr of injection and continued for at least 5 hr. Kainic acid-treated rats and controls (injected with saline) were sacrificed 4 hr after treatment and total RNAs were isolated for RT-qPCR as described above. Two control gene probes were included: β-actin and BDNF. Kainic acid treatment had no effect on β-actin expression in the cortex, but increased BDNF levels, in agreement with previous observations (Zafra et al., 1990; Metsis et al., 1993; Timmusk et al., 1993; Castren et al., 1998). These results indicate successful establishment of the method to increase neuronal activity in rats. As shown in Fig. 5, neuronal activity has distinct effects on expression of NRG1 isoforms. While it had no effect on levels of types III, V, or VI, levels of types I and II were increased to 8.9 and 1.9 folds above basal in the cortex of treated animals. Type IV remained undetectable in kainic acid-treated brain samples (data not shown). Similar regulation pattern was observed for NRG1 isoform expression in the hippocampus (data not shown).
Fig. 5. Increased expression of types I and II NRG1 in the cerebral cortex of KA-treated rats.
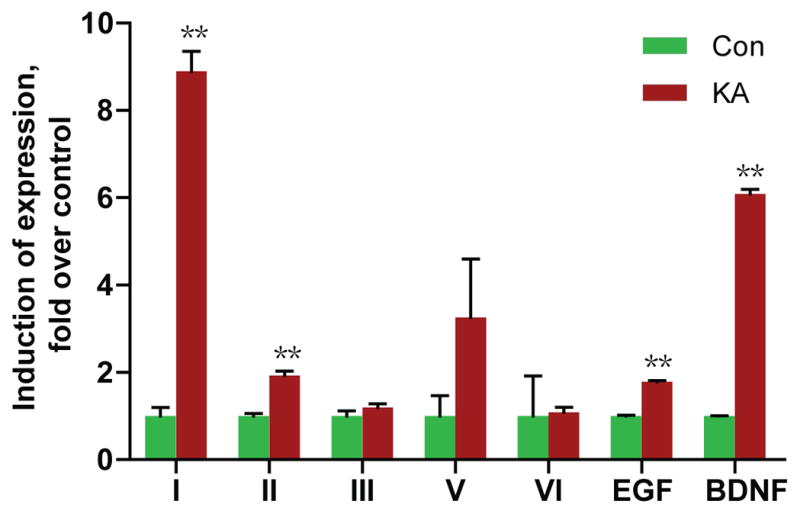
Rats were injected with 10 mg/ml KA to induce seizure and sacrificed 4 hr after injection. Total RNAs were subjected to RT-qPCR. NRG1 types were first normalized by β-actin whose levels were revealed in same reactions and then normalized by control. **p<0.01
To better investigate mechanisms, we determined whether the regulation of NRG1 isoform expression could occur in cultured neurons. To this end, we cultured E18 cortical neurons for 3–12 days in vitro (DIV) and treated them without or with 50 mM KCl for 6 hr. This treatment depolarizes neurons and has been shown to increase expression of BDNF (Shieh et al., 1998; Tao et al., 1998; Hong et al., 2008). Total RNAs were extracted and transcripted to cDNAs as described in Methods and levels of NRG1 were quantified by RT-qPCR as described above. In untreated neurons, major types are types I, II, and III at DIV3, 9, and 12. Interestingly, type V increased significantly over time in cultured neurons (0.28% at DIV3, 2.3% at DIV9, and 12% at DIV12) (Figs. 6 and S6). Developmental change in expression was also observed in other types (Fig. S6). KCl treatment consistently increased levels of types I and IV at three different DIVs. Its effect on types III and VI appeared to be age-dependent (increased only at DIV3 and DIV12, respectively). For reasons that are not understood, type II was not increased in KCl-treated neurons although elevated in rats with induced seizure. We have also treated neurons briefly with 100 μM KA that also activates neurons (Murphy and Miller, 1989), and found that this treatment increased levels of types I and IV, but not other isoforms (Fig. S4). Together with in vivo studies, these results indicate that neuronal expression of NRG1 isoforms is differentially regulated by activity. KCl treatment (for 6 hr) increased levels of type I, but not other types, of NRG1 in astrocytes (Fig. 6H). The result suggests that the increase in type I NRG1 in vivo may be contributed in part by increase in astrocytes. NRG1 joins a list of trophic factors whose expression in astrocytes is regulated by KCl-induced depolarization (Chang et al., 2001; Wu et al., 2004).
Identification of cis-elements essential for neuronal activity regulation
We investigated mechanisms by which neuronal activity regulates expression of NRG1 isoforms. To this end, we focused on types I and IV because their expression is altered in the brain of schizophrenia patients (Hashimoto et al., 2004; Law et al., 2006). Series of firefly luciferase constructs were generated that contained different lengths of 5′UTR and were co-transfected with the control vector pRL-TK into SH-SY5Y human neuroblastoma cells. Twelve hours later, cells were stimulated with 50 mM KCl for 12 hr and assayed for both firefly and Rellina luciferases. NRG1 reporter activity was normalized by Rellina luciferase activity. We were able to narrow neuronal activity-responsible cis-elements within 441-bp 5′UTR for type I NRG1 (Supplemental data, Fig. S5A). Within this region were two putative cis-elements: one for Egr-1 and another for NFAT-1, which have been implicated in neuronal activity-dependent gene regulation (Asai et al., 2004; Knapska and Kaczmarek, 2004). However, their mutation on 2.9k-bp 5′UTR had no effect on response to neuronal activity (Supplemental Figs. S5B and S5C), indicating that they are dispensable. Attempts to identify relevant cis-elements were not successful because deletion or mutation of 441-bp 5′UTR significantly reduced basal promoter activity.
DNA sequence analysis of type IV 5′UTR revealed two putative CRE elements: proximal (−73 ~ −77) and distal (−319 ~ −323), both with characteristic consensus sequence “CGTCA” (Fig. 7A). Notice that the proximal CRE and its surrounding nucleotides are conserved among different species including human, rat and mouse. On the other hand, the distal CRE site exits only in human, not in rodents. CRE elements interact with CREB, a transcription factor known to play a critical role in neuronal activity-induced gene expression (Sheng et al., 1991; Tao et al., 1998; Redmond et al., 2002). To determine whether the CRE elements are necessary for neuronal activity-induction of type IV expression, we generated a luciferase reporter construct that contained 1.6 kb human type IV promoter (−1560 ~ +91) (Tan et al., 2007) and two mutants where either the proximal or distal CRE element was mutated to “TTTAA” (IVpmt-Luc and IVdmt-Luc, respectively, Fig. 7B). They were transfected into human neuroblastoma SH-SY5Y cells and luciferase activity was measured in control and KCl-treated neurons. As shown in Fig. 7C, mutation of the proximal CRE prevented type IV 5′UTR from responding to neuronal activity stimulation whereas mutation of the distal CRE had little effect. These results suggested an important role of the proximal CRE for neural activity-dependent regulation.
Fig. 7. CRE cis-element is critical for activity-dependent regulation of type IV NRG1.

A, Sequence comparison of type I 5′UTRs of human, rat, and mouse. Distal and proximal CRE sites were highlighted in red rectangles. * indicate conserved nucleotides. Underlined sequence included 20 bp upstream and 15 bp downstream of CRE sites were used for EMSA. B, Diagram of luciferase report constructs. C, The proximal CRE cis-element was necessary for activity-dependent increase of type IV expression. SH-SY5Y cells were co-transfected with indicated reporters and pRL-TK. 12 hr after transfection, cells were treated with vehicle or 50 mM KCl for 12 hr. Luciferase activity was measured as described in Methods. **p<0.01. D, Interaction between proximal CRE cis-element and CREB. Double stranded oligonucleotides containing the proximal CRE of human type IV promoter (shown in 6A) was 5′ end-labeled with IRDye 700 and incubated with recombinant CREB1 for 15 min at 30 °C. In some experiments, 200 X unlabeled oligonucleotides or anti-CREB antibody were included in the reaction. The reaction mixture was resolved on 4% nondenaturing polyarcrylamide gel. S: shift band; SS: super shift; NS: non-specific band.
Next, we determined whether the proximal CRE was able to bind to CREB by EMSA. Double-stranded oligonucleotide probes were synthesized that contained the proximal CRE with 20-bp upstream and 15-bp downstream flanking sequence (indicated by black line in Fig. 7A), 5′ end-labeled with IRDye 700, and incubated with purified recombinant CREB protein (Kim et al., 2005). As shown in Fig. 7D, the addition of recombinant CREB caused a delay in migration of labeled proximal CRE probes in a dose-dependent manner, indicating that CREB could bind to the proximal CRE. The interaction was specific because, first, it was diminished in the presence of excessive unlabeled probes. Second, the addition of specific anti-CREB antibodies caused a supershift of the probe-CREB complex. Taken together, these results suggest that the proximal CRE binds to CREB to promote type IV expression in response to neuronal activation. Intriguingly, the schizophrenia risk allele SNP8NRG243177 (rs6994992) is localized in the 5′UTR region of the type IV NRG1 (Stefansson et al., 2002). It is associated with reduced activation of frontal and temporal lobe regions and increased development of psychotic symptoms and decreased premorbid IQ (Hall et al., 2006). It was shown to reduce the basal activity of the type IV NGR1 promoter (Tan et al., 2007). The C-to-T mutation had no effect on activity-mediated induction of the type IV promoter (Fig. 8).
Fig. 8. SNP8NRG243177 (rs6994992) had no effect on the regulation by neuronal activity.

A, DNA sequences of IVwt-Luc and IV-SNP. The C-to-T mutation was indicated by red rectangles. The backbone of the Luc constructs were described in Fig. 7B. B, No effect of SNP8NRG243177 T allele on KCl-induced type IV NRG1 promoter activity. **p<0.01.
Discussion
Major findings of this study are as follows. First, each of the six types of NRG1 has a distinct expression pattern in the brain at different ages, resulting in a change in NRG1 isoform composition. In both human and rat, most dominant is type III and II followed by either type I or V, while type IV and VI are least abundant (less than 1% of total NRG1). Second, levels of NRG1 isoforms are higher in brains of E13 and P5 rats, suggesting roles in early neural development and in the neonatal critical period. Third, at the cellular level, the majority of NRG1 isoforms (types I, II and III) is expressed in neurons co-expressing VGLUT1, but they are also present in GAD67-positive neurons and astrocytes. Fourth, expression of each NRG1 isoform is distinctly regulated by neuronal activity. Neuronal activity regulation of type IV expression requires a CRE cis-element in the 5′UTR that bind to CREB.
The most abundant NRG1 isoforms in embryonic brains are types I, II, and III, in agreement with previous observations that these isoforms play roles in neural development. For example, type I NRG1 regulates the generation of neural crest-derived neurons in cranial ganglia (Meyer et al., 1997) and long-range attraction of migrating interneurons (Flames et al., 2004). Type III NRG1 could act as a short-range attractant for migrating interneurons in the CNS (Flames et al., 2004) and is critical for development of neural crest-derived Schwann cells (Meyer et al., 1997; Wolpowitz et al., 2000). Type II NRG1 has been implicated in the development of Schwann cells and myelination and ensheathment of peripheral nerves (Marchionni et al., 1993; Trachtenberg and Thompson, 1996) and protection of dopaminergic neurons (Zhang et al., 2004). Interestingly, NRG1 isoforms in rat brains increase to highest levels (7.7 folds of levels of E18) at P5, when an epoch of plasticity occurs during the so-called critical period (P0 – P5) for rat primary somatosensory cortex (Rice and Van der Loos, 1977; Schlaggar and O’Leary, 1993). In particular, type V levels were increased transiently by more than 700 folds, from representing less than 1% of total NRG1 at E18 to ~13% at P5. Notice that type V is expressed at higher levels in 13-year-old human brain. However, the function of type V remains unclear as it contains only 16 type-specific N-terminal amino acids that are predicted by cDNA. This short type-specific sequence made it difficult to determine which neurons or cells express type V NRG1. The novel type V exon is ~600 kb downstream of type II and IV exons, and ~300 kb upstream of type I exon (Steinthorsdottir et al., 2004). So far, no disease-associated SNP has been identified around this exon. Nevertheless, the unique expression pattern of type V NRG1 suggests a potential role in plasticity in the critical period that warrants further investigation.
In human and rat adult brain, the compositions of NRG1 are very similar with two dominant types (type III representing ~73% in human and ~53% in rat; and type II, representing ~21% in human and ~41% in rat). NRG1 isoforms (type III, II, and I) are expressed in both VGLUT1- and GAD67-positive neurons, as well as astrocytes. Whether one or more isoforms are expressed in a single neuron or cell awaits further study. Target of NRG1 in neurotransmission and synaptic plasticity include GABAergic interneurons (Woo et al., 2007; Chen et al., 2010; Wen et al., 2010; Ting et al., 2011), glutamatergic neurons (Gu et al., 2005; Kwon et al., 2005; Li et al., 2007) and dopaminergic neurons (Zhang et al., 2004; Kwon et al., 2008; Zheng et al., 2009). Therefore, NRG1 may function in both autonomous and non-autonomous manners.
Neuronal activity regulates expression of genes that are critical for neural development and/or synaptic plasticity (West et al., 2002; Flavell and Greenberg, 2008). NRG1 expression was shown previously to be regulated by increased neuronal activity (Eilam et al., 1998). Here we show that neuronal activity differentially regulates the expression of NRG1 isoforms. Increased neuronal activity appears to have no effect on levels of types III and II, the two major isoforms that represent 94% in adult brain. In contrast, type I is increased by 8.9 fold in vivo after epileptic seizure and by 3.7 fold in cultured neurons after depolarization. Although type II was elevated by a modest 1.9 fold in vivo, its level remains unchanged in neurons after depolarization, suggesting that the increase may be a secondary effect. Type IV mRNA was not detectable in adult naïve or kainic acid-treated brain, but was increased by 10.8 folds in KCl-treated neurons in culture. Intriguingly, its response to neuronal activation appears to require a CRE cis-element that binds to CREB, a transcription factor that has been implicated in synaptic plasticity (Qiu and Ghosh, 2008; Alberini, 2009; Benito and Barco, 2010). For example, it is critical for activity-dependent BDNF expression (Tao et al., 1998; Hong et al., 2008). Noticeably, in astyrocytes, the expression of type I, the major type that is present in these cells, is also increased in response to KCl treatment. These observations indicate that brain activity would change the composition of NRG1 isoforms in different regions and different cells, and thus alter NRG1 function under physiological condition and pathological conditions including stroke and epilepsy.
Schizophrenia is a debilitating mental disorder that affects 1% of general population (Harrison and Weinberger, 2005; Frankland et al., 2008). NRG1 has been identified as a susceptibility gene of schizophrenia in various populations (Stefansson et al., 2002; Yang et al., 2003; Mei and Xiong, 2008). Most of the schizophrenia-associated SNPs are localized to the 5′ and 3′ regulatory regions of the NRG1 gene (Stefansson et al., 2002; Stefansson et al., 2003; Yang et al., 2003; Corvin et al., 2004; Li et al., 2004; Zhao et al., 2004; Petryshen et al., 2005; Harrison and Law, 2006; Lachman et al., 2006; Munafo et al., 2006; Benzel et al., 2007). The 5′SNPs may regulate NRG1 expression in schizophrenic patients (Law et al., 2006; Silberberg et al., 2006). Accordingly, types I, II, and IV are at higher levels in the prefrontal cortex and/or hippocampus of schizophrenic patients (Hashimoto et al., 2004; Law et al., 2006; Chong et al., 2008; Parlapani et al., 2010), with increased NRG1 signaling (Hahn et al., 2006) whereas type I NRG1 was reduced in some patients (Parlapani et al., 2010). The schizophrenia-associated allele SNP8NRG243177, located in the 5′UTR of type IV NRG1, appeared to have no effect on the induction by neuronal activity. Exactly how these SNPs regulate NRG1 expression remains unclear.
Supplementary Material
Acknowledgments
We thank the anonymous reviewers for their constructive comments and critiques, Dr. Riqiang Yan of Cleveland Clinic for human brain samples, and members of the Mei lab for discussion. This work was supported by in part by grants from NIH, NARSAD and CSC of China.
References
- Alberini CM. Transcription factors in long-term memory and synaptic plasticity. Physiol Rev. 2009;89:121–145. doi: 10.1152/physrev.00017.2008. [DOI] [PMC free article] [PubMed] [Google Scholar]
- Anton ES, Marchionni MA, Lee KF, Rakic P. Role of GGF/neuregulin signaling in interactions between migrating neurons and radial glia in the developing cerebral cortex. Development. 1997;124:3501–3510. doi: 10.1242/dev.124.18.3501. [DOI] [PubMed] [Google Scholar]
- Asai M, Iwasaki Y, Yoshida M, Mutsuga-Nakayama N, Arima H, Ito M, Takano K, Oiso Y. Nuclear factor of activated T cells (NFAT) is involved in the depolarization-induced activation of growth hormone-releasing hormone gene transcription in vitro. Mol Endocrinol. 2004;18:3011–3019. doi: 10.1210/me.2003-0471. [DOI] [PubMed] [Google Scholar]
- Backx L, Ceulemans B, Vermeesch JR, Devriendt K, Van Esch H. Early myoclonic encephalopathy caused by a disruption of the neuregulin-1 receptor ErbB4. Eur J Hum Genet. 2009;17:378–382. doi: 10.1038/ejhg.2008.180. [DOI] [PMC free article] [PubMed] [Google Scholar]
- Bellocchio EE, Reimer RJ, Fremeau RT, Jr, Edwards RH. Uptake of glutamate into synaptic vesicles by an inorganic phosphate transporter. Science. 2000;289:957–960. doi: 10.1126/science.289.5481.957. [DOI] [PubMed] [Google Scholar]
- Benito E, Barco A. CREB’s control of intrinsic and synaptic plasticity: implications for CREB-dependent memory models. Trends Neurosci. 2010;33:230–240. doi: 10.1016/j.tins.2010.02.001. [DOI] [PubMed] [Google Scholar]
- Benzel I, Bansal A, Browning BL, Galwey NW, Maycox PR, McGinnis R, Smart D, St Clair D, Yates P, Purvis I. Interactions among genes in the ErbB-Neuregulin signalling network are associated with increased susceptibility to schizophrenia. Behav Brain Funct. 2007;3:31. doi: 10.1186/1744-9081-3-31. [DOI] [PMC free article] [PubMed] [Google Scholar]
- Bermingham-McDonogh O, McCabe KL, Reh TA. Effects of GGF/neuregulins on neuronal survival and neurite outgrowth correlate with erbB2/neu expression in developing rat retina. Development. 1996;122:1427–1438. doi: 10.1242/dev.122.5.1427. [DOI] [PubMed] [Google Scholar]
- Bjarnadottir M, Misner DL, Haverfield-Gross S, Bruun S, Helgason VG, Stefansson H, Sigmundsson A, Firth DR, Nielsen B, Stefansdottir R, Novak TJ, Stefansson K, Gurney ME, Andresson T. Neuregulin1 (NRG1) signaling through Fyn modulates NMDA receptor phosphorylation: differential synaptic function in NRG1+/− knock-outs compared with wild-type mice. J Neurosci. 2007;27:4519–4529. doi: 10.1523/JNEUROSCI.4314-06.2007. [DOI] [PMC free article] [PubMed] [Google Scholar]
- Bovetti S, De Marchis S, Gambarotta G, Fasolo A, Perroteau I, Puche AC, Bovolin P. Differential expression of neuregulins and their receptors in the olfactory bulb layers of the developing mouse. Brain Res. 2006;1077:37–47. doi: 10.1016/j.brainres.2006.01.034. [DOI] [PubMed] [Google Scholar]
- Castren E, Berninger B, Leingartner A, Lindholm D. Regulation of brain-derived neurotrophic factor mRNA levels in hippocampus by neuronal activity. Prog Brain Res. 1998;117:57–64. doi: 10.1016/s0079-6123(08)64007-8. [DOI] [PubMed] [Google Scholar]
- Chang HY, Hua LL, Morgan A, Lee SC. Inhibition of astrocyte TNFalpha expression by extracellular potassium. Brain Res. 2001;888:176–179. doi: 10.1016/s0006-8993(00)03098-5. [DOI] [PubMed] [Google Scholar]
- Chen YJ, Zhang M, Yin DM, Wen L, Ting A, Wang P, Lu YS, Zhu XH, Li SJ, Wu CY, Wang XM, Lai C, Xiong WC, Mei L, Gao TM. ErbB4 in parvalbumin-positive interneurons is critical for neuregulin 1 regulation of long-term potentiation. Proc Natl Acad Sci U S A. 2010 doi: 10.1073/pnas.1010669107. [DOI] [PMC free article] [PubMed] [Google Scholar]
- Chong VZ, Thompson M, Beltaifa S, Webster MJ, Law AJ, Weickert CS. Elevated neuregulin-1 and ErbB4 protein in the prefrontal cortex of schizophrenic patients. Schizophr Res. 2008;100:270–280. doi: 10.1016/j.schres.2007.12.474. [DOI] [PMC free article] [PubMed] [Google Scholar]
- Chuah MI, Cossins J, Woodhall E, Tennent R, Nash G, West AK. Glial growth factor 2 induces proliferation and structural changes in ensheathing cells. Brain Res. 2000;857:265–274. doi: 10.1016/s0006-8993(99)02455-5. [DOI] [PubMed] [Google Scholar]
- Clancy B, Finlay BL, Darlington RB, Anand KJ. Extrapolating brain development from experimental species to humans. Neurotoxicology. 2007;28:931–937. doi: 10.1016/j.neuro.2007.01.014. [DOI] [PMC free article] [PubMed] [Google Scholar]
- Corfas G, Rosen KM, Aratake H, Krauss R, Fischbach GD. Differential expression of ARIA isoforms in the rat brain. Neuron. 1995;14:103–115. doi: 10.1016/0896-6273(95)90244-9. [DOI] [PubMed] [Google Scholar]
- Corvin AP, Morris DW, McGhee K, Schwaiger S, Scully P, Quinn J, Meagher D, Clair DS, Waddington JL, Gill M. Confirmation and refinement of an ‘at-risk’ haplotype for schizophrenia suggests the EST cluster, Hs.97362, as a potential susceptibility gene at the Neuregulin-1 locus. Mol Psychiatry. 2004;9:208–213. doi: 10.1038/sj.mp.4001412. [DOI] [PubMed] [Google Scholar]
- Edwards JM, Bottenstein JE. Neuregulin 1 growth factors regulate proliferation but not apoptosis of a CNS neuronal progenitor cell line. Brain Res. 2006;1108:63–75. doi: 10.1016/j.brainres.2006.06.025. [DOI] [PubMed] [Google Scholar]
- Eilam R, Pinkas-Kramarski R, Ratzkin BJ, Segal M, Yarden Y. Activity-dependent regulation of Neu differentiation factor/neuregulin expression in rat brain. Proc Natl Acad Sci U S A. 1998;95:1888–1893. doi: 10.1073/pnas.95.4.1888. [DOI] [PMC free article] [PubMed] [Google Scholar]
- Esclapez M, Tillakaratne NJ, Tobin AJ, Houser CR. Comparative localization of mRNAs encoding two forms of glutamic acid decarboxylase with nonradioactive in situ hybridization methods. J Comp Neurol. 1993;331:339–362. doi: 10.1002/cne.903310305. [DOI] [PubMed] [Google Scholar]
- Falls DL. Neuregulins: functions, forms, and signaling strategies. Exp Cell Res. 2003;284:14–30. doi: 10.1016/s0014-4827(02)00102-7. [DOI] [PubMed] [Google Scholar]
- Fazzari P, Paternain AV, Valiente M, Pla R, Lujan R, Lloyd K, Lerma J, Marin O, Rico B. Control of cortical GABA circuitry development by Nrg1 and ErbB4 signalling. Nature. 2010;464:1376–1380. doi: 10.1038/nature08928. [DOI] [PubMed] [Google Scholar]
- Fischbach GD, Rosen KM. ARIA: a neuromuscular junction neuregulin. Annual Review of Neruoscience. 1997;20:429–458. doi: 10.1146/annurev.neuro.20.1.429. [DOI] [PubMed] [Google Scholar]
- Flames N, Long JE, Garratt AN, Fischer TM, Gassmann M, Birchmeier C, Lai C, Rubenstein JL, Marin O. Short-and long-range attraction of cortical GABAergic interneurons by neuregulin-1. Neuron. 2004;44:251–261. doi: 10.1016/j.neuron.2004.09.028. [DOI] [PubMed] [Google Scholar]
- Flavell SW, Greenberg ME. Signaling mechanisms linking neuronal activity to gene expression and plasticity of the nervous system. Annu Rev Neurosci. 2008;31:563–590. doi: 10.1146/annurev.neuro.31.060407.125631. [DOI] [PMC free article] [PubMed] [Google Scholar]
- Frankland PW, Sakaguchi M, Arruda-Carvalho M. Starting at the endophenotype: A role for alpha-CaMKII in schizophrenia? Mol Brain. 2008;1:5. doi: 10.1186/1756-6606-1-5. [DOI] [PMC free article] [PubMed] [Google Scholar]
- Gerlai R, Pisacane P, Erickson S. Heregulin, but not ErbB2 or ErbB3, heterozygous mutant mice exhibit hyperactivity in multiple behavioral tasks. Behav Brain Res. 2000;109:219–227. doi: 10.1016/s0166-4328(99)00175-8. [DOI] [PubMed] [Google Scholar]
- Go RC, Perry RT, Wiener H, Bassett SS, Blacker D, Devlin B, Sweet RA. Neuregulin-1 polymorphism in late onset Alzheimer’s disease families with psychoses. Am J Med Genet B Neuropsychiatr Genet. 2005;139B:28–32. doi: 10.1002/ajmg.b.30219. [DOI] [PubMed] [Google Scholar]
- Goes FS, Sanders LL, Potash JB. The genetics of psychotic bipolar disorder. Curr Psychiatry Rep. 2008;10:178–189. doi: 10.1007/s11920-008-0030-5. [DOI] [PubMed] [Google Scholar]
- Gu Z, Jiang Q, Fu AK, Ip NY, Yan Z. Regulation of NMDA receptors by neuregulin signaling in prefrontal cortex. J Neurosci. 2005;25:4974–4984. doi: 10.1523/JNEUROSCI.1086-05.2005. [DOI] [PMC free article] [PubMed] [Google Scholar]
- Hahn CG, Wang HY, Cho DS, Talbot K, Gur RE, Berrettini WH, Bakshi K, Kamins J, Borgmann-Winter KE, Siegel SJ, Gallop RJ, Arnold SE. Altered neuregulin 1-erbB4 signaling contributes to NMDA receptor hypofunction in schizophrenia. Nat Med. 2006;12:824–828. doi: 10.1038/nm1418. [DOI] [PubMed] [Google Scholar]
- Hall J, Whalley HC, Job DE, Baig BJ, McIntosh AM, Evans KL, Thomson PA, Porteous DJ, Cunningham-Owens DG, Johnstone EC, Lawrie SM. A neuregulin 1 variant associated with abnormal cortical function and psychotic symptoms. Nat Neurosci. 2006;9:1477–1478. doi: 10.1038/nn1795. [DOI] [PubMed] [Google Scholar]
- Harrison PJ, Weinberger DR. Schizophrenia genes, gene expression, and neuropathology: on the matter of their convergence. Mol Psychiatry. 2005;10:40–68. doi: 10.1038/sj.mp.4001558. image 45. [DOI] [PubMed] [Google Scholar]
- Harrison PJ, Law AJ. Neuregulin 1 and schizophrenia: genetics, gene expression, and neurobiology. Biol Psychiatry. 2006;60:132–140. doi: 10.1016/j.biopsych.2005.11.002. [DOI] [PubMed] [Google Scholar]
- Hashimoto R, Straub RE, Weickert CS, Hyde TM, Kleinman JE, Weinberger DR. Expression analysis of neuregulin-1 in the dorsolateral prefrontal cortex in schizophrenia. Mol Psychiatry. 2004;9:299–307. doi: 10.1038/sj.mp.4001434. [DOI] [PubMed] [Google Scholar]
- Hong EJ, McCord AE, Greenberg ME. A biological function for the neuronal activity-dependent component of Bdnf transcription in the development of cortical inhibition. Neuron. 2008;60:610–624. doi: 10.1016/j.neuron.2008.09.024. [DOI] [PMC free article] [PubMed] [Google Scholar]
- Huang YZ, Won S, Ali DW, Wang Q, Tanowitz M, Du QS, Pelkey KA, Yang DJ, Xiong WC, Salter MW, Mei L. Regulation of neuregulin signaling by PSD-95 interacting with ErbB4 at CNS synapses. Neuron. 2000;26:443–455. doi: 10.1016/s0896-6273(00)81176-9. [DOI] [PubMed] [Google Scholar]
- Kerber G, Streif R, Schwaiger FW, Kreutzberg GW, Hager G. Neuregulin-1 isoforms are differentially expressed in the intact and regenerating adult rat nervous system. J Mol Neurosci. 2003;21:149–165. doi: 10.1385/JMN:21:2:149. [DOI] [PubMed] [Google Scholar]
- Kim CH, Xiong WC, Mei L. Inhibition of MuSK expression by CREB interacting with a CRE-like element and MyoD. Mol Cell Biol. 2005;25:5329–5338. doi: 10.1128/MCB.25.13.5329-5338.2005. [DOI] [PMC free article] [PubMed] [Google Scholar]
- Knapska E, Kaczmarek L. A gene for neuronal plasticity in the mammalian brain: Zif268/Egr-1/NGFI-A/Krox-24/TIS8/ZENK? Prog Neurobiol. 2004;74:183–211. doi: 10.1016/j.pneurobio.2004.05.007. [DOI] [PubMed] [Google Scholar]
- Kramer R, Bucay N, Kane DJ, Martin LE, Tarpley JE, Theill LE. Neuregulins with an Ig-like domain are essential for mouse myocardial and neuronal development. Proc Natl Acad Sci U S A. 1996;93:4833–4838. doi: 10.1073/pnas.93.10.4833. [DOI] [PMC free article] [PubMed] [Google Scholar]
- Kwon OB, Longart M, Vullhorst D, Hoffman DA, Buonanno A. Neuregulin-1 reverses long-term potentiation at CA1 hippocampal synapses. J Neurosci. 2005;25:9378–9383. doi: 10.1523/JNEUROSCI.2100-05.2005. [DOI] [PMC free article] [PubMed] [Google Scholar]
- Kwon OB, Paredes D, Gonzalez CM, Neddens J, Hernandez L, Vullhorst D, Buonanno A. Neuregulin-1 regulates LTP at CA1 hippocampal synapses through activation of dopamine D4 receptors. Proc Natl Acad Sci U S A. 2008;105:15587–15592. doi: 10.1073/pnas.0805722105. [DOI] [PMC free article] [PubMed] [Google Scholar]
- Lachman HM, Pedrosa E, Nolan KA, Glass M, Ye K, Saito T. Analysis of polymorphisms in AT-rich domains of neuregulin 1 gene in schizophrenia. Am J Med Genet B Neuropsychiatr Genet. 2006;141B:102–109. doi: 10.1002/ajmg.b.30242. [DOI] [PubMed] [Google Scholar]
- Law AJ, Kleinman JE, Weinberger DR, Weickert CS. Disease-associated intronic variants in the ErbB4 gene are related to altered ErbB4 splice-variant expression in the brain in schizophrenia. Hum Mol Genet. 2007;16:129–141. doi: 10.1093/hmg/ddl449. [DOI] [PubMed] [Google Scholar]
- Law AJ, Lipska BK, Weickert CS, Hyde TM, Straub RE, Hashimoto R, Harrison PJ, Kleinman JE, Weinberger DR. Neuregulin 1 transcripts are differentially expressed in schizophrenia and regulated by 5′ SNPs associated with the disease. Proc Natl Acad Sci U S A. 2006;103:6747–6752. doi: 10.1073/pnas.0602002103. [DOI] [PMC free article] [PubMed] [Google Scholar]
- Li B, Woo RS, Mei L, Malinow R. The neuregulin-1 receptor erbB4 controls glutamatergic synapse maturation and plasticity. Neuron. 2007;54:583–597. doi: 10.1016/j.neuron.2007.03.028. [DOI] [PMC free article] [PubMed] [Google Scholar]
- Li T, Stefansson H, Gudfinnsson E, Cai G, Liu X, Murray RM, Steinthorsdottir V, Januel D, Gudnadottir VG, Petursson H, Ingason A, Gulcher JR, Stefansson K, Collier DA. Identification of a novel neuregulin 1 at-risk haplotype in Han schizophrenia Chinese patients, but no association with the Icelandic/Scottish risk haplotype. Mol Psychiatry. 2004;9:698–704. doi: 10.1038/sj.mp.4001485. [DOI] [PubMed] [Google Scholar]
- Lu HS, Chang D, Philo JS, Zhang K, Narhi LO, Liu N, Zhang M, Sun J, Wen J, Yanagihara D, et al. Studies on the structure and function of glycosylated and nonglycosylated neu differentiation factors. Similarities and differences of the alpha and beta isoforms. J Biol Chem. 1995;270:4784–4791. doi: 10.1074/jbc.270.9.4784. [DOI] [PubMed] [Google Scholar]
- Ma L, Huang YZ, Pitcher GM, Valtschanoff JG, Ma YH, Feng LY, Lu B, Xiong WC, Salter MW, Weinberg RJ, Mei L. Ligand-dependent recruitment of the ErbB4 signaling complex into neuronal lipid rafts. J Neurosci. 2003;23:3164–3175. doi: 10.1523/JNEUROSCI.23-08-03164.2003. [DOI] [PMC free article] [PubMed] [Google Scholar]
- Mahanthappa NK, Anton ES, Matthew WD. Glial growth factor 2, a soluble neuregulin, directly increases Schwann cell motility and indirectly promotes neurite outgrowth. J Neurosci. 1996;16:4673–4683. doi: 10.1523/JNEUROSCI.16-15-04673.1996. [DOI] [PMC free article] [PubMed] [Google Scholar]
- Marchionni MA, Goodearl AD, Chen MS, Bermingham-McDonogh O, Kirk C, Hendricks M, Danehy F, Misumi D, Sudhalter J, Kobayashi K, et al. Glial growth factors are alternatively spliced erbB2 ligands expressed in the nervous system. Nature. 1993;362:312–318. doi: 10.1038/362312a0. [DOI] [PubMed] [Google Scholar]
- Masand RP, El-Mofty SK, Ma XJ, Luo Y, Flanagan JJ, Lewis JS., Jr Adenosquamous Carcinoma of the Head and Neck: Relationship to Human Papillomavirus and Review of the Literature. Head Neck Pathol. 2011 doi: 10.1007/s12105-011-0245-3. [DOI] [PMC free article] [PubMed] [Google Scholar]
- McCarthy KD, de Vellis J. Preparation of separate astroglial and oligodendroglial cell cultures from rat cerebral tissue. J Cell Biol. 1980;85:890–902. doi: 10.1083/jcb.85.3.890. [DOI] [PMC free article] [PubMed] [Google Scholar]
- Mei L, Xiong WC. Neuregulin 1 in neural development, synaptic plasticity and schizophrenia. Nat Rev Neurosci. 2008;9:437–452. doi: 10.1038/nrn2392. [DOI] [PMC free article] [PubMed] [Google Scholar]
- Metsis M, Timmusk T, Arenas E, Persson H. Differential usage of multiple brain-derived neurotrophic factor promoters in the rat brain following neuronal activation. Proc Natl Acad Sci U S A. 1993;90:8802–8806. doi: 10.1073/pnas.90.19.8802. [DOI] [PMC free article] [PubMed] [Google Scholar]
- Meyer D, Yamaai T, Garratt A, Riethmacher-Sonnenberg E, Kane D, Theill LE, Birchmeier C. Isoform-specific expression and function of neuregulin. Development. 1997;124:3575–3586. doi: 10.1242/dev.124.18.3575. [DOI] [PubMed] [Google Scholar]
- Munafo MR, Thiselton DL, Clark TG, Flint J. Association of the NRG1 gene and schizophrenia: a meta-analysis. Mol Psychiatry. 2006;11:539–546. doi: 10.1038/sj.mp.4001817. [DOI] [PubMed] [Google Scholar]
- Murphy SN, Miller RJ. Regulation of Ca++ influx into striatal neurons by kainic acid. J Pharmacol Exp Ther. 1989;249:184–193. [PubMed] [Google Scholar]
- Nicodemus KK, Luna A, Vakkalanka R, Goldberg T, Egan M, Straub RE, Weinberger DR. Further evidence for association between ErbB4 and schizophrenia and influence on cognitive intermediate phenotypes in healthy controls. Mol Psychiatry. 2006;11:1062–1065. doi: 10.1038/sj.mp.4001878. [DOI] [PubMed] [Google Scholar]
- Norton N, Moskvina V, Morris DW, Bray NJ, Zammit S, Williams NM, Williams HJ, Preece AC, Dwyer S, Wilkinson JC, Spurlock G, Kirov G, Buckland P, Waddington JL, Gill M, Corvin AP, Owen MJ, O’Donovan MC. Evidence that interaction between neuregulin 1 and its receptor erbB4 increases susceptibility to schizophrenia. Am J Med Genet B Neuropsychiatr Genet. 2006;141B:96–101. doi: 10.1002/ajmg.b.30236. [DOI] [PubMed] [Google Scholar]
- Parlapani E, Schmitt A, Wirths O, Bauer M, Sommer C, Rueb U, Skowronek MH, Treutlein J, Petroianu GA, Rietschel M, Falkai P. Gene expression of neuregulin-1 isoforms in different brain regions of elderly schizophrenia patients. World J Biol Psychiatry. 2010;11:243–250. doi: 10.3109/15622970802022376. [DOI] [PubMed] [Google Scholar]
- Petryshen TL, et al. Support for involvement of neuregulin 1 in schizophrenia pathophysiology. Mol Psychiatry. 2005;10:366–374. 328. doi: 10.1038/sj.mp.4001608. [DOI] [PubMed] [Google Scholar]
- Pinkas-Kramarski R, Eilam R, Spiegler O, Lavi S, Liu N, Chang D, Wen D, Schwartz M, Yarden Y. Brain neurons and glial cells express Neu differentiation factor/heregulin: a survival factor for astrocytes. Proc Natl Acad Sci U S A. 1994;91:9387–9391. doi: 10.1073/pnas.91.20.9387. [DOI] [PMC free article] [PubMed] [Google Scholar]
- Pitcher GM, Beggs S, Woo RS, Mei L, Salter MW. ErbB4 is a suppressor of long-term potentiation in the adult hippocampus. Neuroreport. 2008;19:139–143. doi: 10.1097/WNR.0b013e3282f3da10. [DOI] [PMC free article] [PubMed] [Google Scholar]
- Prata DP, Breen G, Osborne S, Munro J, St Clair D, Collier DA. An association study of the neuregulin 1 gene, bipolar affective disorder and psychosis. Psychiatr Genet. 2009;19:113–116. doi: 10.1097/YPG.0b013e32832a4f69. [DOI] [PubMed] [Google Scholar]
- Qiu Z, Ghosh A. A brief history of neuronal gene expression: regulatory mechanisms and cellular consequences. Neuron. 2008;60:449–455. doi: 10.1016/j.neuron.2008.10.039. [DOI] [PubMed] [Google Scholar]
- Redmond L, Kashani AH, Ghosh A. Calcium regulation of dendritic growth via CaM kinase IV and CREB-mediated transcription. Neuron. 2002;34:999–1010. doi: 10.1016/s0896-6273(02)00737-7. [DOI] [PubMed] [Google Scholar]
- Rice FL, Van der Loos H. Development of the barrels and barrel field in the somatosensory cortex of the mouse. J Comp Neurol. 1977;171:545–560. doi: 10.1002/cne.901710408. [DOI] [PubMed] [Google Scholar]
- Rimer M, Barrett DW, Maldonado MA, Vock VM, Gonzalez-Lima F. Neuregulin-1 immunoglobulin-like domain mutant mice: clozapine sensitivity and impaired latent inhibition. Neuroreport. 2005;16:271–275. doi: 10.1097/00001756-200502280-00014. [DOI] [PubMed] [Google Scholar]
- Rio C, Rieff HI, Qi P, Khurana TS, Corfas G. Neuregulin and erbB receptors play a critical role in neuronal migration. Neuron. 1997;19:39–50. doi: 10.1016/s0896-6273(00)80346-3. [DOI] [PubMed] [Google Scholar]
- Schlaggar BL, O’Leary DD. Patterning of the barrel field in somatosensory cortex with implications for the specification of neocortical areas. Perspect Dev Neurobiol. 1993;1:81–91. [PubMed] [Google Scholar]
- Sheng M, Thompson MA, Greenberg ME. CREB: a Ca(2+)-regulated transcription factor phosphorylated by calmodulin-dependent kinases. Science. 1991;252:1427–1430. doi: 10.1126/science.1646483. [DOI] [PubMed] [Google Scholar]
- Shieh PB, Hu SC, Bobb K, Timmusk T, Ghosh A. Identification of a signaling pathway involved in calcium regulation of BDNF expression. Neuron. 1998;20:727–740. doi: 10.1016/s0896-6273(00)81011-9. [DOI] [PubMed] [Google Scholar]
- Shyu WC, Lin SZ, Chiang MF, Yang HI, Thajeb P, Li H. Neuregulin-1 reduces ischemia-induced brain damage in rats. Neurobiol Aging. 2004;25:935–944. doi: 10.1016/j.neurobiolaging.2003.10.012. [DOI] [PubMed] [Google Scholar]
- Silberberg G, Darvasi A, Pinkas-Kramarski R, Navon R. The involvement of ErbB4 with schizophrenia: association and expression studies. Am J Med Genet B Neuropsychiatr Genet. 2006;141B:142–148. doi: 10.1002/ajmg.b.30275. [DOI] [PubMed] [Google Scholar]
- Sperk G. Kainic acid seizures in the rat. Prog Neurobiol. 1994;42:1–32. doi: 10.1016/0301-0082(94)90019-1. [DOI] [PubMed] [Google Scholar]
- Sperk G, Lassmann H, Baran H, Kish SJ, Seitelberger F, Hornykiewicz O. Kainic acid induced seizures: neurochemical and histopathological changes. Neuroscience. 1983;10:1301–1315. doi: 10.1016/0306-4522(83)90113-6. [DOI] [PubMed] [Google Scholar]
- Stefansson H, Sarginson J, Kong A, Yates P, Steinthorsdottir V, Gudfinnsson E, Gunnarsdottir S, Walker N, Petursson H, Crombie C, Ingason A, Gulcher JR, Stefansson K, St Clair D. Association of neuregulin 1 with schizophrenia confirmed in a Scottish population. Am J Hum Genet. 2003;72:83–87. doi: 10.1086/345442. [DOI] [PMC free article] [PubMed] [Google Scholar]
- Stefansson H, et al. Neuregulin 1 and susceptibility to schizophrenia. Am J Hum Genet. 2002;71:877–892. doi: 10.1086/342734. [DOI] [PMC free article] [PubMed] [Google Scholar]
- Steinthorsdottir V, Stefansson H, Ghosh S, Birgisdottir B, Bjornsdottir S, Fasquel AC, Olafsson O, Stefansson K, Gulcher JR. Multiple novel transcription initiation sites for NRG1. Gene. 2004;342:97–105. doi: 10.1016/j.gene.2004.07.029. [DOI] [PubMed] [Google Scholar]
- Tan W, Wang Y, Gold B, Chen J, Dean M, Harrison PJ, Weinberger DR, Law AJ. Molecular cloning of a brain-specific, developmentally regulated neuregulin 1 (NRG1) isoform and identification of a functional promoter variant associated with schizophrenia. J Biol Chem. 2007;282:24343–24351. doi: 10.1074/jbc.M702953200. [DOI] [PubMed] [Google Scholar]
- Tao X, Finkbeiner S, Arnold DB, Shaywitz AJ, Greenberg ME. Ca2+ influx regulates BDNF transcription by a CREB family transcription factor-dependent mechanism. Neuron. 1998;20:709–726. doi: 10.1016/s0896-6273(00)81010-7. [DOI] [PubMed] [Google Scholar]
- Thomson PA, Christoforou A, Morris SW, Adie E, Pickard BS, Porteous DJ, Muir WJ, Blackwood DH, Evans KL. Association of Neuregulin 1 with schizophrenia and bipolar disorder in a second cohort from the Scottish population. Mol Psychiatry. 2007;12:94–104. doi: 10.1038/sj.mp.4001889. [DOI] [PubMed] [Google Scholar]
- Timmusk T, Palm K, Metsis M, Reintam T, Paalme V, Saarma M, Persson H. Multiple promoters direct tissue-specific expression of the rat BDNF gene. Neuron. 1993;10:475–489. doi: 10.1016/0896-6273(93)90335-o. [DOI] [PubMed] [Google Scholar]
- Ting AK, Chen Y, Wen L, Yin DM, Shen C, Tao Y, Liu X, Xiong WC, Mei L. Neuregulin 1 promotes excitatory synapse development and function in GABAergic interneurons. J Neurosci. 2011;31:15–25. doi: 10.1523/JNEUROSCI.2538-10.2011. [DOI] [PMC free article] [PubMed] [Google Scholar]
- Trachtenberg JT, Thompson WJ. Schwann cell apoptosis at developing neuromuscular junctions is regulated by glial growth factor. Nature. 1996;379:174–177. doi: 10.1038/379174a0. [DOI] [PubMed] [Google Scholar]
- Wen L, Lu YS, Zhu XH, Li XM, Woo RS, Chen YJ, Yin DM, Lai C, Terry AV, Jr, Vazdarjanova A, Xiong WC, Mei L. Neuregulin 1 regulates pyramidal neuron activity via ErbB4 in parvalbumin-positive interneurons. Proc Natl Acad Sci U S A. 2010;107:1211–1216. doi: 10.1073/pnas.0910302107. [DOI] [PMC free article] [PubMed] [Google Scholar]
- West AE, Griffith EC, Greenberg ME. Regulation of transcription factors by neuronal activity. Nat Rev Neurosci. 2002;3:921–931. doi: 10.1038/nrn987. [DOI] [PubMed] [Google Scholar]
- Wolpowitz D, Mason TB, Dietrich P, Mendelsohn M, Talmage DA, Role LW. Cysteine-rich domain isoforms of the neuregulin-1 gene are required for maintenance of peripheral synapses. Neuron. 2000;25:79–91. doi: 10.1016/s0896-6273(00)80873-9. [DOI] [PubMed] [Google Scholar]
- Woo RS, Li XM, Tao Y, Carpenter-Hyland E, Huang YZ, Weber J, Neiswender H, Dong XP, Wu J, Gassmann M, Lai C, Xiong WC, Gao TM, Mei L. Neuregulin-1 enhances depolarization-induced GABA release. Neuron. 2007;54:599–610. doi: 10.1016/j.neuron.2007.04.009. [DOI] [PubMed] [Google Scholar]
- Wu H, Friedman WJ, Dreyfus CF. Differential regulation of neurotrophin expression in basal forebrain astrocytes by neuronal signals. J Neurosci Res. 2004;76:76–85. doi: 10.1002/jnr.20060. [DOI] [PubMed] [Google Scholar]
- Xu Z, Jiang J, Ford G, Ford BD. Neuregulin-1 is neuroprotective and attenuates inflammatory responses induced by ischemic stroke. Biochem Biophys Res Commun. 2004;322:440–446. doi: 10.1016/j.bbrc.2004.07.149. [DOI] [PubMed] [Google Scholar]
- Yang JZ, Si TM, Ruan Y, Ling YS, Han YH, Wang XL, Zhou M, Zhang HY, Kong QM, Liu C, Zhang DR, Yu YQ, Liu SZ, Ju GZ, Shu L, Ma DL, Zhang D. Association study of neuregulin 1 gene with schizophrenia. Mol Psychiatry. 2003;8:706–709. doi: 10.1038/sj.mp.4001377. [DOI] [PubMed] [Google Scholar]
- Zafra F, Hengerer B, Leibrock J, Thoenen H, Lindholm D. Activity dependent regulation of BDNF and NGF mRNAs in the rat hippocampus is mediated by non-NMDA glutamate receptors. EMBO J. 1990;9:3545–3550. doi: 10.1002/j.1460-2075.1990.tb07564.x. [DOI] [PMC free article] [PubMed] [Google Scholar]
- Zhang L, Fletcher-Turner A, Marchionni MA, Apparsundaram S, Lundgren KH, Yurek DM, Seroogy KB. Neurotrophic and neuroprotective effects of the neuregulin glial growth factor-2 on dopaminergic neurons in rat primary midbrain cultures. J Neurochem. 2004;91:1358–1368. doi: 10.1111/j.1471-4159.2004.02817.x. [DOI] [PubMed] [Google Scholar]
- Zhao X, Shi Y, Tang J, Tang R, Yu L, Gu N, Feng G, Zhu S, Liu H, Xing Y, Zhao S, Sang H, Guan Y, St Clair D, He L. A case control and family based association study of the neuregulin1 gene and schizophrenia. J Med Genet. 2004;41:31–34. doi: 10.1136/jmg.2003.014977. [DOI] [PMC free article] [PubMed] [Google Scholar]
- Zheng Y, Watakabe A, Takada M, Kakita A, Namba H, Takahashi H, Yamamori T, Nawa H. Expression of ErbB4 in substantia nigra dopamine neurons of monkeys and humans. Prog Neuropsychopharmacol Biol Psychiatry. 2009;33:701–706. doi: 10.1016/j.pnpbp.2009.03.021. [DOI] [PubMed] [Google Scholar]
- Zuliani R, Moorhead TW, Bastin ME, Johnstone EC, Lawrie SM, Brambilla P, O’Donovan MC, Owen MJ, Hall J, McIntosh AM. Genetic variants in the ErbB4 gene are associated with white matter integrity. Psychiatry Res. 2011;191:133–137. doi: 10.1016/j.pscychresns.2010.11.001. [DOI] [PMC free article] [PubMed] [Google Scholar]
Associated Data
This section collects any data citations, data availability statements, or supplementary materials included in this article.