

Abstract
Cortical electrical activity during non-rapid eye movement (non-REM) sleep is dominated by slow wave activity (SWA). At larger spatial scales (~2–30 cm) - investigated by scalp EEG recordings - SWA was shown to propagate globally over wide cortical regions as traveling waves, proposed to serve as a temporal framework for neural plasticity. However, whether SWA dynamics at finer spatial scales also reflects the orderly propagation was not yet investigated in humans. In order to reveal the local, finer spatial scale (~1–6 cm) patterns of SWA propagation during non-REM sleep, electrocorticographic (ECoG) recordings were conducted from subdurally implanted electrode grids and a non-linear correlation technique (mutual information, MI) was implemented. MI analysis revealed spatial maps of correlations between cortical areas demonstrating SWA propagation directions, speed and association strength. Highest correlations indicating significant coupling were detected during the initial positive-going deflection of slow waves. SWA propagated predominantly between adjacent cortical areas, albeit spatial non-continuities were also frequently observed. MI analysis further uncovered significant convergence and divergence patterns. Areas receiving the most convergent activity were similar to those with high divergence rate, while reciprocal and circular propagation of SWA was also frequent. We hypothesize that SWA is characterized by distinct attributes depending on the spatial scale it is observed. While at larger spatial scales the orderly SWA propagation dominates, at the finer scale of the ECoG recordings, non-REM sleep is characterized by complex SWA propagation patterns.
Keywords: slow wave activity, electrocorticogram, sleep, oscillations, non-linear, mutual information
Introduction
Cortical SWA (in the ~0.5–2 Hz frequency range) is the EEG correlate of synchronized active (up-) and silent (down-) states of large populations of neocortical neurons during deep non-REM or slow wave sleep (SWS) (Steriade et al., 1993; Cash et al., 2009; Csercsa et al., 2010, Le Van Quyen et al. 2010). Although synchronous up- and down-states were observed in isolated neocortex in vitro (Cossart et al., 2003), several studies showed that the thalamus might also play an active role in shaping cortical SWA (Magnin et al., 2010; Sirota and Buzsaki, 2005; Crunelli and Hughes, 2010). Large-scale thalamo-cortical networks were shown to engage in synchronous low frequency oscillations (Volgushev et al., 2006; Sirota and Buzsaki, 2005). Furthermore, the hippocampus as well as subcortical centers could also participate in this process (Wolansky et al., 2006; Isomura et al., 2006; Mena-Segovia et al., 2008), indicating that slow oscillations could provide a general clockwork for a large variety of neural operations (Sirota and Buzsaki, 2005; Buzsaki, 2006). This view is further strengthened by a series of observations indicating that SWA is indispensable for precisely coordinating hippocampal and thalamo-cortical oscillations. Population activity patterns like hippocampal ripples and synchronously appearing cortical spindles are orchestrated by the cortical SWA, being entrained to the first half of the surface positive, active phase or up-state of slow wave cycles (Siapas and Wilson, 1998; Mölle et al., 2006; Clemens et al., 2007, Csercsa et al., 2010). Also, cortical SWA was shown to propagate over large distances as traveling waves (Massimini et al., 2004; Murphy et al., 2009). On the other hand, memory consolidation processes are often reflected in local changes of cortical SWA (Huber et al., 2004; Massimini et al., 2009) and asynchronies in thalamo-cortical slow rhythms at different recording sites were reported in some studies (Fig. 2 in Sirota and Buzsaki, 2005). Recent reports of regional and temporal heterogeneity of cortical slow waves (Mohajerani et al., 2010) as well as alternative propagation patterns such as spiral waves (Huang et al., 2010) raise the possibility that besides the large-scale orderly traveling of slow waves, complex propagation patterns emerge in a temporally parallel manner at a finer spatial scale.
Signals from subdural electrodes provide substantially better spatial localization as compared with scalp recordings, as a result of the absence of distorting, integrating and attenuating effects of interleaved tissues (Buzsaki, 2006; Bangera et al., 2010). These advantages allowed us to investigate the fine scale (~1 cm) propagation patterns of sleep slow waves such as (i) convergence, (ii) divergence, (iii) reciprocal and (iv) circular propagation. We analyzed subdural ECoG recordings by extending classical linear correlation with information theory-based measures characterized by higher sensitivity in detecting non-linear interactions commonly observed in neural systems (Freiwald et al., 1999). In contrast to the orderly SWA propagation patterns observed in scalp EEG recordings, we found high prevalence of complex SWA patterns at the finer spatial scale provided by the ECoG traces. This spatial scale dependent distinction in electrical activity patterns may reflect the different processing strategies at the local and global cortical levels during SWS.
Materials and Methods
Patient selection
Patients (Pts.) participating in this study (n = 6, five men and one woman (Pt.3)) had medically intractable complex partial seizures and were referred to our epilepsy surgical center for presurgical evaluation (Table 1). All patients underwent intracranial electrode implantation as required for localization of epileptogenic tissue prior to therapeutic resection. Patients or their legal guardian were asked to sign the informed consent form before surgery after detailed explanation of the risks, to be able to participate in this research. The consent forms were approved by the local ethical committee of the National Institute of Neuroscience according to the World Medical Association Declaration of Helsinki.
Table 1.
Patient characteristics
| Patient ID | age at onset | age at surgery | epileptic focus (seizure onset zone) | MRI abnormality |
|---|---|---|---|---|
| Pt.1 | 4 | 26 | left fronto-basal - temporo-polar | left temporo-polar microgyria |
| Pt.2 | 5 | 16 | right superior frontal gyrus | right superior frontal gyrus flair abnormality |
| Pt.3 | 11 | 34 | right supplementary motor area and cuneus | negative |
| Pt.4 | 30 | 42 | left parietal tuber | left temporo-parietal multiplex tubers (sclerosis tuberosa) |
| Pt.5 | 1 | 40 | left parietal operculum and posterior part of insula | negative |
| Pt.6 | 1.5 | 29 | left parietal operculum and posterior part of insula | left parietal and insular flair abnormality |
Electrode implantation and intracranial recording protocols
Since the non-invasive evaluation was inconclusive, all of the patients underwent subdural strip and grid electrode implantation (AD TECH Medical Instrument Corp., Racine, WI, USA: various subdural electrodes; distance between adjacent electrodes, 10 mm). Implantation site selection was based only on results of previous non-invasive clinical studies for seizure focus localization. We used standard craniotomies to insert the electrodes into the subdural space under general anesthesia. The electrode cables were tunneled under the skin to avoid infection and the bone flap was cryopreserved for delayed reimplantation, to avoid any complication from significant brain swelling. A postimplantation MRI (3D sequence, 1 mm slice thickness) was routinely performed to visualize the final position of the electrodes. After 3 dimensional reconstruction and skull stripping of the images (Brain Extraction Tool), electrode contacts were individually localized with the aid of intraoperative photographs.
After recovery from surgery, the patients were admitted to the epilepsy monitoring unit and were continuously monitored for seizures. Video-EEG - monitoring was carried out using a 128 channel Brain Quick System 98 (Micromed, Mogliano Veneto, Italy). All signals were recorded to a mastoid reference (acquisition rate: 1024 or 512 Hz, filtered between 0.1 and 250 Hz).
Slow wave sleep detection
Since the sleep of the patients was fragmented due to medical care, distress from the hospitalization and head wound, we can not provide standard hypnograms that are usually obtained from subjects undergoing standard polysomnography studies without recent craniotomy. Craniotomies may also distort the scalp distribution of the EEG due to lack of bone and excessive fluid accumulation below the scalp. Furthermore, scalp electrodes if placed close to the frontal craniotomy wounds may induce infection, therefore we avoided to place more than two frontal scalp EEG electrodes. In fact, we attempted to use these scalp EEG electrodes whenever possible to aid our partial sleep staging method, but most of the time their signal was not adequate for this purpose due to the desiccation of the EEG electrode gel and other reasons causing large and variable electrode impedances, electromagnetic interference and mechanical artifacts. To overcome these hardships, our partial sleep staging method in the clinical environment was based on the recordings from frontal ECoG channels and long term video, missing out other measures like EMG, EOG, ECG and respiration monitoring that are usually recorded together with EEG in a standard polysomnography environment. Behavioral sleep was confirmed by the all night, long term video recording, while deep non-REM sleep periods were electrographically identified using frontal ECoG traces by expert neurologists. In particular, deep non-REM sleep periods (or SWS) were identified, when a 30 second long sleep epoch contained more than 20% of slow waves having larger than 75 μV peak-to-peak amplitude falling in the 0.5–2 Hz frequency range. The above criteria are consistent with the staging criteria of N3 or SWS, according to the recent AASM guidelines (Iber et al., 2007). In our previous work, using similar partial staging techniques based on ECoG traces and video records, we were able to clearly distinguish between light and deep non-REM sleep (see Figure 2B and 2C, Cash et al., 2009). In another study using similar staging methods we were also able to clearly detect the typical SWA pattern in SWS demonstrated in previous animal and human studies (see Figure 4B and Supplementary Figure 1 in Csercsa et al., 2010). Data containing interictal spikes (within 1 min) and seizures (within overall 60 minutes; 40 minutes in Pt. 4) were excluded from the study to avoid epileptic contamination.
Data analysis
Data preprocessing
Subgrids of 4×4 (Pts. 1, 3 and 5) or 4×5 (Pts. 2, 4 and 6) electrodes were selected for analysis (Fig. 1A). The reduction of the number of grid electrodes was necessary to (i) analyze similar number of channels for comparability reasons and (ii) reduce computational time. Selection of subgrids was based on (i) grid location: an attempt was made to include frontal electrodes where SWA is typically more pronounced (Kurth et al., 2010) and (ii) recording quality: channels not functioning were excluded. For each patient, 3–5 one minute long segments (26 segments in total) of normal SWS were selected. Principles of segment selection were (i) to avoid epileptic contamination (see below) and (ii) to include deep sleep epochs with prominent SWA. In Pt. 6, all segments were recorded within a single night, whereas in the other patients segments from different nights were also included. Selected segments were preceded and followed by 30–30 minutes of seizure-free activity (30–10 in Pt. 4) and were free from interictal spikes. ECoG traces were resampled at 1000 Hz and bandpass filtered (0.1–40 Hz) with a finite impulse response filter using zero phase shift filtering (‘fir1.m’ and ‘filtfilt.m’ built-in Matlab functions) to remove high-frequency ECoG components and electrical noise.
Figure 1. Recording and analysis of SWA propagation.

A: Estimations of the positions of recording sites on standard human brain images based on intraoperative photographs and postoperative structural MR images (reconstructions from A1 to 6 correspond to Pts. 1 to 6, respectively). A2’ shows a photograph taken during the operation. Marked points and electrodes are also exhibited in the corresponding reconstruction image (A2). Recording sites visible in A2’ are displayed in orange in A2. Channel 18 in Pt.2 as well as channels 5, 17 and 18 in Pt.6 were dysfunctional (i.e., either no data were recorded by the electrode, or a disproportionate amount of non-biological noise showed the malfunction of the contact site) and thus left out from the analysis. B: Filtered (0.1 to 40 Hz) ECoG data were subjected to MI analysis for all pairs of recording channels (see also Materials and Methods). One-second-long data segments were compared to time-lagged data from the other channel and the extent of non-linear correlation (predictability) was measured by MI. On the left, short data segments from two ECoG channels are shown. Grey shading designates examples of one-second-long temporal windows for MI calculations. Right: MI was displayed as the function of time lags (1 ms resolution). A significant maximal MI (in this case, 2.61 bits at 153 ms temporal delay) was considered to be a sign of significant correlation between the two channels, which corresponded to propagating sleep slow waves (see Materials and Methods and Results). On the left panel, the time lag between the data windows (grey) is set to the optimal delay (153 ms) at the given time point. Note the similarity of slow wave cycles (orange) in the windows. This analysis was repeated for all fixed time instances and for all pairs of recording channels. C: Based on the MI analysis, SWA propagation time, distance and association strength could be assessed for all significant unitary propagation events, from which a time-resolved propagation map was drawn and visualized in a custom-built graphical user interface. A screenshot from this interface is shown with all ECoG channels (top right), amplitude map (bottom right; coldest/warmest color correspond to smallest/largest ECoG amplitude, see the color bar; 5×4 squares correspond to the 5×4 grid electrodes; amplitude was calculated as the difference of maximal and minimal ECoG value in the data window), propagation map displayed in a schematic form (bottom left) and also projected to the brain surface (top left). For every time point, arrows on the propagation map designate unitary propagation events between two recording sites (marked by numbers on the schematic view). The color of each arrow shows association strength (warmer = stronger, see the color bar) and the width corresponds to propagation time (thicker = shorter time).
Calculation of ‘propagation maps’
We assessed associations between ECoG traces from different channels using mutual information. MI provides the amount of information shared by two variables and is considered a non-linear measure of covariation (Kajikawa and Hackett, 2005; Hangya et al., 2009; Na et al., 2002). The choice of MI instead of linear correlations was motivated by its capability of detecting any kind of dependencies without assumptions on the structure of correlations or the underlying distributions (Na et al., 2002; Kajikawa and Hackett, 2005; Paz et al., 2010), which property is indeed important, since non-linear correlations are generally common among neural signals (Freiwald et al., 1999; Hangya et al., 2009). We further justified this choice by comparing MI with linear cross-correlation analysis (see Results).
For each 1000 ms segment, ECoG values were binned into fixed bins between the overall minimal and maximal value. MI was calculated between different ECoG channels using the classic formulation in combination with Panzeri-Treves bias-correction (Shannon, 1948; Panzeri et al., 2007), as described previously (Hangya et al., 2009). The basic idea of time-shifted correlations or cross-correlations was applied (Ostojic et al., 2009), using MI instead of linear correlation, as follows. On each channel, one second long ECoG segments (Xt to Xt+1000) were correlated to later segments from all other electrodes separately (Yt+τ to Yt+τ +1000, 0 < τ < 1000 ms) by calculating MI (temporal resolution, 1 ms; Fig. 1B). Maximal MI in the function of the time lags (τ) was calculated for all time points (t) and channel pairs. The choice of one second long time windows was motivated by the observation that SWA frequency is around or below 1 Hz (Diekelmann and Born, 2010; Crunelli and Hughes, 2010; Csercsa et al., 2010), thus these time windows were able to roughly include a slow wave cycle. However, it has been shown that MI calculations are robust to the selection of the time windows (Paz et al., 2010). The above calculations were repeated for overlapping one second long ECoG segments (900 ms overlap). Next, correlations were destructed by cutting the ECoG data to 1–1.2 second long segments, which were then shuffled using the ‘randperm.m’ built-in Matlab function that randomly permutes integers based on a uniform distribution. Permutation was repeated if a data segment remained in its original position. Significance of maximal MI was tested by comparing it to a distribution of MI values calculated from such shuffled versions of the original data (number of shufflings ranged from 151296 to 236400). A significance level of p = 0.0001 was used to reduce the number of false positive detections according to high numbers of statistical tests. (This choice corresponds to approximately one false detection in 2.5 seconds.) In case a significant maximal MI was found, waveform correlation was established between the two channels at time point t. It should be noted that according to the binning between the minimal and maximal data values, MI reflected predictability between slow wave cycles rather than higher frequency (lower amplitude) oscillations such as spindles (see also in Results). Thus, significant maximal MI showed the propagation of SWA between two cortical areas, the temporal maximum location provided propagation time and the maximal MI value indicated correlation strength. Propagation speed was calculated by dividing electrode distances with propagation time values. Time-resolved propagation maps were created using the above parameters, visualized as movies and further analyzed (see below). Unitary propagation events (arrows in the propagation map, Fig. 1C) were assessed by significant propagation between two ECoG channels. Start and end points of such events were defined by the zero (t) and maximal location (t +τ) points in the time lag-MI plot (Fig. 1B, right). According to the overlapping windows (see above), the time resolution of propagation map frames was 100 ms, whereas the temporal resolution of time delays was 1 ms (see above). Consistency of time delays for direct and indirect associations was checked to test the robustness of the method.
Correlation triggered average
To visualize ECoG patterns giving rise to significant correlations, we calculated ECoG averages triggered by significant MI values (Fig. 3A). That is, if a significant MI was detected at a certain time instance, a one second long ECoG segment centered to that time point was stored. At the end, these segments were averaged for each recording channel. The average signal reflected typical ECoG patterns underlying significant correlations.
Figure 3. SWA propagation characteristics.
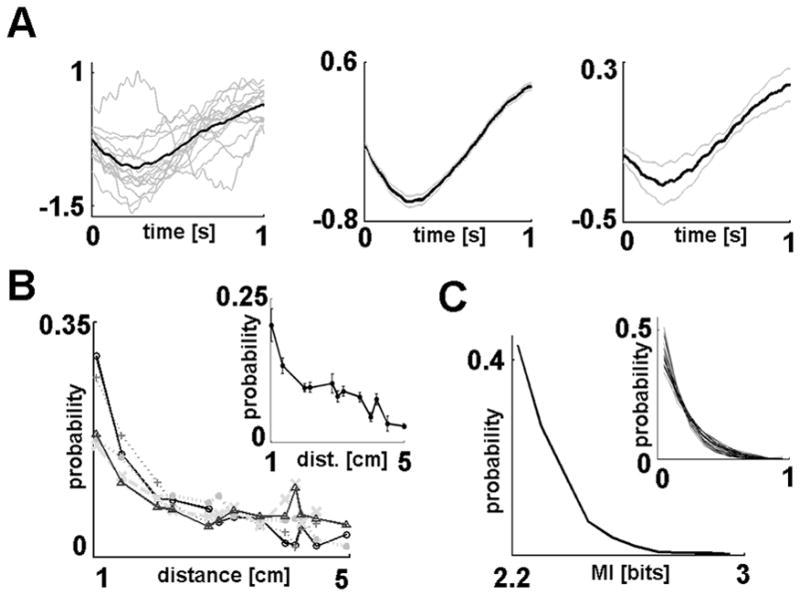
A: Average waveforms of data segments with significant non-linear correlations across ECoG channels. Left: Mean waveform from all ECoG channels separately (grey) and averaged (black) from a representative sleep segment of a single subject. Only data segments that showed significant correlations with other recording channels were included in these calculations. Middle: Mean waveform of significantly correlated data segments from the same subject including all analyzed sleep segments (black). Grey lines show SEM. Right: Grand average from all patients (black, mean; grey, SEM across patients). It should be noted that ECoG segments were standardized before the calculation of waveform averages, thus, tick labels of the y axis show standardized voltage values. Average waveforms of data segments with significant waveform correlations across channels showed characteristic down- to up-state transitions, including mainly the rising phase of SWA. B: Propagation distance distributions of unitary propagation events (i.e., length distribution of single arrows on the propagation map, Fig. 1C). Left: Propagation distance distributions from the five analyzed sleep segments of a representative subject. Inset: Average distribution from all subjects. Error bars indicate SEM. SWA propagation to adjacent locations were significantly more frequent than spread to more distant loci (p = 7.12 × 10⁻²¹, Mann-Whitney U-test), however, spatial non-continuities of SWA propagation between areas located 5 cm away (largest distance covered) could also be detected. C: Distribution of association strength (i.e., maximal MI values of unitary propagation events indicated by the colors of the arrows on the propagation maps, see Fig 1C). MI distribution from a representative sleep segment is shown. Inset: Connection strength distributions overlaid for all analyzed recording segments of all subjects. Because the range of connection strength values could vary, MI values were normalized between 0 and 1 for this plot. The shape of the distribution was similar across sleep segments and subjects.
Analysis of propagation patterns
Convergence/divergence of SWA was defined as unitary propagation events ending/starting at the same recording site within a 100 ms time window. Divergence maps were smoothed over two consecutive frames because of the discrete nature of the starting points of unitary propagation events. Two-dimensional distributions showing relative contribution to the convergence/divergence at a single location were termed ‘contribution maps’. Cortical centers with high convergence/divergence rate did not show correlation with epileptic foci. Reciprocal connections were defined as reciprocal propagation between two sites within 100 ms. Three-point circles (i.e., directed three-point trajectories of which the end points are the same as the starting points) were defined in an analogous way. Controls for the above measures were generated by within-frame random shuffling (uniform distribution using ‘randperm.m’ built-in Matlab function) of unitary propagation events among the electrode pairs. Control distributions for reciprocal connections and three-point circles were generated by 250 or 1000 shufflings. If the value derived from the real data was out of the entire range of control distributions, we used the ‘p ≈ 0’ notation, which can be translated to at least p < 0.004. Normalization with individual control distributions (in Fig. 4 and 5) was performed by subtracting the mean and dividing by the standard deviation of the corresponding control distribution. The application of this procedure results in standardized control distributions and allows the comparison across subjects. Significance of correlations among slow wave propagation characteristics, convergence, divergence and contribution maps was assessed using F-test. Statistical tests were judged at a significance level of p = 0.05 unless stated otherwise. We carried out a signal-to-noise ratio analysis which confirmed that potential differences in recording quality did not have a significant effect on the propagation map evaluation (data not shown).
Figure 4. Convergence and divergence of SWA.

A: Rate of SWA convergence on different electrodes. Warm colors indicate high number of convergent inputs (see color bar). The 4×4 or 4×5 arrangements correspond to the configuration of the electrode grids (Fig. 1A). Representative sleep segments are shown from all subjects in the left column; corresponding control maps of randomized data are shown in the right column (unitary propagation events were randomly shuffled among electrode pairs within each time frame, see Materials and Methods). Lowermost panel: distribution of the mean number of convergent inputs for all channels of all subjects. Inset: Distribution of the same values but normalized with individual control distributions (see Materials and Methods). Red color indicates those bars that fall out of the range of control distributions. B: Contribution maps for recording sites with the highest convergence rate (black dot in white field). Warm colors indicate high proportion of contribution to the SWA convergence. Maps in the same row correspond to the same sleep segment (applies also for C and D). Lowermost panel: Group results showing relative contribution to the convergence on the most prominent ‘convergence center’ in the function of propagation distance (mean ± SEM; only distance values with at least 4 sample elements are shown to allow reliable statistical estimates). Adjacent cortical areas showed significantly larger relative contribution (p = 1.07×10⁻¹⁵, Mann-Whitney U-test), although distant sites could also contribute substantially (see Pts. 1 and 4). C: Rate of SWA divergence for all electrodes. Warm colors indicate high number of divergent outputs. Arrangement follows that of panel A; control maps are displayed in the right column. Note the similarity with corresponding convergence maps (panel A). D: Relative distribution of divergent outputs from sites with highest divergence rates. Arrangement follows that of panel B. Diverging SWA propagated dominantly to adjacent loci (p = 2.07×10⁻²⁰, Mann-Whitney U-test), but distant areas also received substantial diverging SWA (see Pts. 1, 4 and 6). E: The four maps of Pt. 2 shown on panels A to D (second row) are projected onto the brain surface (left, convergence and divergence map; right, corresponding contribution maps). F: Left: Convergence and divergence rates are plotted against each other for all recording sites and sleep segments in all patients. Right: The same rates were normalized to individual controls. Convergence and divergence rates were strongly correlated (R = 0.988 and R = 0.921 in the raw and normalized cases, respectively; p ≈ 0 in both cases). G–H: Distribution of convergence (G) and divergence (H) rates (normalized to controls) over different Brodmann areas. Mean ± SEM values are displayed for each Brodmann area (number below/above the bars). Black, regions covered in at least two patients; grey, areas covered in only one patient. dlPFC, dorsolateral prefrontal cortex; vlPFC, ventrolateral prefrontal cortex.
Figure 5. Convergence and divergence maps were similar within patients across sleep segments.

A: Top row: Convergence maps of Pt. 3 (see color bar). First and second segments were recorded during the second postoperative night; third and fourth segments are from the fourth postoperative night; fifth segment was recorded during the fifth postoperative night. Middle row: Relative contribution to convergent inputs to the area with highest convergence rate. Bottom row: Relative contribution to convergent inputs of the site receiving the most convergent activity during the first segment. B: Divergence maps and relative distribution of diverging activities arranged similarly as convergence maps on panel A. Note that maps for SWS segments recorded during a single night (first and second; third and fourth) were markedly similar in all cases. Also, maps in the fifth column are clearly similar to those of the third and fourth segments, despite recorded during two different (however consecutive) nights.
Linear cross-correlations
Linear cross-correlation analysis was conducted by replacing time-shifted mutual information values by linear cross-correlations. To facilitate the comparison of the results of linear and non-linear analyses, all other parameters of the calculations were left unchanged (including significance testing using shuffled data, see above). Thus, a directional correlation was established when a significant cross-correlation with a positive time lag was observed. (Positive and negative correlation were not differentiated to allow the comparison with the MI measure.) We also calculated the input-output functions related to significant linear (cross-correlation) and non-linear (MI) correlations as follows. For each pair of recording channels, we collected pairs of ECoG segments where a significant association was found, and plotted average ECoG amplitude values of a recording channel as a function of binned ECoG values of the other channel.
All data analysis procedures were implemented in Matlab development environment (MathWorks, Natick, MA) using custom-built and built-in functions.
Results
Non-linear associations during human SWS
The non-linear nature of neural communication was shown in several systems (Freiwald et al., 1999; Darvas et al., 2009; Chen et al. 2010); however, it is unclear whether such non-linearities also appear in the course of slow oscillation propagation. We investigated one minute long segments of SWS in six epileptic patients. ECoGs from 16 to 20 subdural recording sites were analyzed in each patient. We first searched for associations between ECoG waveforms recorded from different brain areas and compared the results of a linear (cross-correlation) and a non-linear (MI; see Materials and Methods) correlation analysis.
Both linear and non-linear types of dependencies were present among ECoG channels in all analysed sleep segments. Significant linear correlation and MI values were summed over time for each pair of recording channels for each recording segment, resulting in linear and non-linear correlation profiles. Although some similarities between the two types of profiles were discoverable (Fig. 2), significant non-linear correlations were more abundant (5687 out of 7266 channel pairs in all recordings, 78.3% compared with 1292 out of 7266, 17.8%), showing additional associations compared to the linear analysis. It should be noted however, that linear correlations were detected in a very few cases when non-linear correlations were not (36 out of 7266 channel pair comparisons, 0.5%), showing that in case of pure linear associations, cross-correlation analysis can be more sensitive than MI.
Figure 2. Non-linear associations during SWA propagation.
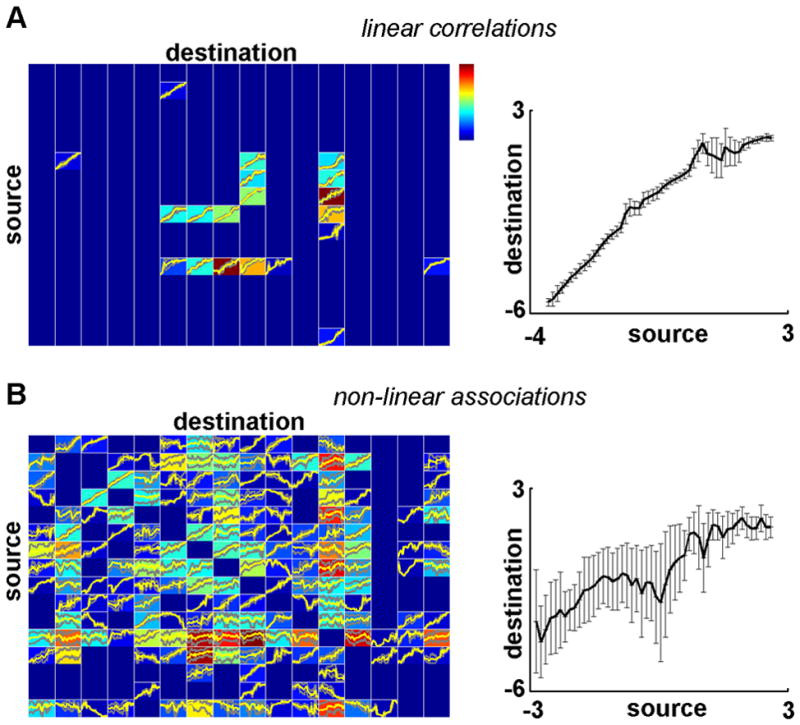
A: Left: Correlation profile and input-output curves of linear cross-correlation analysis from a representative subject. Each colored field corresponds to a pair of recording channels (y axis, ‘source’ channel; x axis, ‘destination’ channel). Colors indicate the total strength of (significant) directional correlation between the source and destination channels (i.e., significant cross-correlation with a positive time lag when calculated with reference to the source channel; warm colors = high correlation values; see Materials and Methods for significance testing of linear and non-liner correlations). A significant cross-correlation between two channels at τmilliseconds means that the ECoG segment of the source channel is correlated with that of the destination channel shifted by τms. We collected these correlated pairs of data segments for each pair of channels and plotted the ECoG values of the destination channel against corresponding values of the source channel (binned and averaged). These input-output functions are plotted in the colored fields for all channel pairs (yellow, mean; grey, SD). Right: A typical input-output function (source, channel 8; destination, channel 9) is enlarged. Bars indicate SD. ECoG segments were standardized (i.e., transformed to zero mean and unitary SD), thus tick labels of both axis show standardized voltage values. Note the line-shape appearance of these input-output curves. B: Left: Non-linear correlation profiles and input-output curves for the same sleep segment calculated by the MI method. Arrangement follows that of panel A. Right: An example input-output function (source, channel 2; destination, channel 11) is enlarged. Note (i) the higher abundance of significant non-linear associations, (ii) the moderate similarities of linear and non-linear correlation profiles (e.g. low rate/absence of correlations for channels 14 and 15, strong correlation between channels 8 and 12) and (iii) the more complex and variable shape of non-linear input-output curves. Higher SD values and ‘noisier’ appearance of the non-linear input-output functions show that the non-linear correlation functions between pairs of channels exhibit temporal changes.
To visualize the associations between channel pairs, we calculated the input-output functions related to significant linear and non-linear correlations. If all such input-output curves are line-shaped even for the MI calculations, then non-linear analysis is unnecessary and the cross-correlation technique is sufficient to detect all associations. As expected, cross-correlations mainly captured linear relationships (Fig. 2A). However, we found that input-output curves were highly complex and often non-linear in a number of cases for MI analysis (Fig. 2B). Thus, as non-linear associations were present during human SWS, the MI analysis was more appropriate in characterizing slow oscillation propagation.
Characteristics of SWA propagation
The significant correlation of time-shifted waveforms recorded from pairs of electrodes was established by the MI technique. The resulting associations at each time point (Fig. 1B-C) served as unitary events for the subsequent calculations.
First, we investigated what characteristic patterns in the ECoG traces gave rise to significant waveform correlations. Raw ECoG segments showing significant non-linear correlation with data segments recorded from other electrodes were averaged for each recording site (“correlation triggered average”, see Materials and Methods). Significant waveform correlations usually corresponded to the rising phase of cortical SWA (Fig. 3A), which further supports the view that waveform correlations detected by the MI method reflect slow wave propagation between different cortical areas. Moreover, it also implies that the most conservative segment of the slow wave cycle is its ascending phase, showing more pronounced correlation across areas compared with other phases of the oscillation.
Next, we calculated general characteristics of SWA propagation. The distribution of propagation distance (i.e., length distribution of the arrows on the propagation map, Fig. 1C) showed that SWA correlations were most common among neighboring cortical areas, although associations between distant sites were also observed (Fig. 3B). These unexpected spatial non-continuities or ‘jumps’ of SWA do not fit the general idea of traveling waves, i.e., propagation of slow waves as single lines over large cortical areas (Massimini et al., 2004). Propagation speed of cortical slow waves (calculated by dividing electrode distances with propagation time values, see Materials and Methods) showed large variability with an overall mean ± SEM of 3.33 ± 0.96 m/s, which is roughly in agreement with previous studies (Massimini et al., 2004; Hill and Tononi, 2005; Murphy et al., 2009). The distribution shape of correlation strength (MI) showed marked similarity across recording segments and subjects (Fig. 3C).
These propagation statistics were not statistically independent. Specifically, weak but significant negative correlations were found between correlation strength and (i) propagation time (significant correlation (p < 0.01) in 24 out of 26 sleep segments with a mean ± SEM correlation coefficient of −0.17 ± 0.01) as well as (ii) propagation distance (significant correlation (p < 0.01) in 22 out of 26 sleep segments with a mean correlation coefficient of −0.16 ± 0.01), whereas it was positively correlated with propagation speed (significant correlation (p < 0.01) in 19 out of 26 sleep segments with a mean correlation coefficient of 0.10 ± 0.01). Thus, fast propagation to short distances was accompanied by higher correlation strength. Expectedly, propagation time was usually positively correlated with propagation distance (positive correlation (p < 0.01) in 23 out of 26 sleep segments with a mean correlation coefficient of 0.28 ± 0.02; negative correlation in one and no significant correlation in two cases).
Complex patterns of SWA propagation
Sleep slow waves detected using scalp EEG recordings were shown to propagate along antero-posterior lines, sweeping across large areas of the cortical mantle (Massimini et al., 2004). The high signal quality of ECoG recordings (Buzsaki, 2006) allowed us to investigate SWA propagation at a finer scale. We tested whether more localized propagation patterns merely reflect line-like spreading found at larger scales, or a more complex propagation pattern characterizes smaller cortical regions.
First we analyzed convergence and divergence patterns. Convergence was assessed when an area received cortical activity from at least two distinct sites within a 100 ms time window, a temporal frame that allows different types of synaptic plasticity (Caporale and Dan, 2008). Locations with high occurrence of convergent activity were observed in all subjects (see ‘convergence maps’ in Fig. 4A and E). Sites of high convergence were preserved over different periods of SWS of the same night (n = 6 subjects) and also, albeit to a lesser extent, different nights (significant correlation of convergence maps were found in all subjects in 13 out of 16 within night and 13 out of 30 between night comparisons; correlation coefficient for significant within and between night comparisons of 0.70 ± 0.05 and 0.65 ± 0.04; see Fig 5A). Recorded cortical areas contributed differentially to all convergent inputs to these sites (see ‘contribution maps’ in Fig. 4B). These contribution maps were also statistically similar within subjects for sleep segments recorded during the same or different nights (significant correlations of contribution maps for the cortical site with the highest rate of convergence were found in all subjects in 12 out of 16 within night and 16 out of 30 between night comparisons; correlation coefficient for significant within and between night comparisons of 0.67 ± 0.05 and 0.70 ± 0.04; see Fig. 5A). Areas with high rate of convergence received activity mostly, but not exclusively, from neighboring cortical locations (Fig. 4B).
Divergence of SWA was defined as propagation to different cortical areas from a single recording site within a 100 ms time window. Divergence maps showed ‘hot spots’ with high divergence rates in all subjects (Fig. 4C and E) and were similar across different sleep segments of the same night as well as across distinct nights within subjects (significant correlation of divergence maps were found in all subjects in 11 out of 16 within night and 12 out of 30 between night comparisons; correlation coefficient for significant within and between night comparisons of 0.75 ± 0.05 and 0.66 ± 0.04; see Fig. 5B). Moreover, these maps were markedly similar to the corresponding convergence maps of the same segment (significant correlation in all cases, n = 26; correlation coefficient of 0.93 ± 0.01; compare Fig. 4A and C; see also Fig. 4F). Thus, convergence and divergence maps changed in a correlated fashion across different nights (Fig. 5). Maps showing relative distribution of divergent outputs from these ‘hot spots’ of SWA propagation (Fig. 4D) were preserved among recording segments (significant correlations were found in all subjects in 12 out of 16 within night and 18 out of 30 between night comparisons; correlation coefficient for significant within and between night comparisons of 0.71 ± 0.05 and 0.69 ± 0.03; see Fig. 5B) and were similar to corresponding convergence contribution maps (significant correlation in 25 out of 26 cases; correlation coefficient of 0.87 ± 0.02; compare Fig. 4B and D).
The placement of the grids was determined by clinical demands resulting in only a partial overlap among patients (Fig. 1A). Although this arrangement prevented detailed anatomical localization of convergence and divergence centers and the construction of topographic maps for convergence and divergence rates, we nevertheless analyzed the spatial organization of these activities according to Brodmann areas (BA). BA8, BA9 and BA46 (dorsolateral prefrontal cortex); BA10 (frontopolar cortex); BA44 and BA45 (ventrolateral prefrontal cortex; Broca area in Pts. 5 and 6, where the grid was above the left hemisphere) were partially covered by the grid in at least two patients. We found that both convergence rates (Fig. 4G) and divergence rates (Fig. 4H) were high in parts of the dorsolateral prefrontal cortex (BA46 and particularly in BA8) and in the ventrolateral prefrontal cortex (BA44 and BA45), whereas it was low in the frontopolar cortex and adjacent areas (BA9 and BA10). The grids in Pt. 4 and Pt 6. covered primary sensory and motor areas, respectively (BA2 in Pt.4 and BA4 Pt.6), where the occurrence of convergent and divergent activity was the lowest. In Pt.4, variable rates of convergence and divergence were found in the middle-superior temporal area and adjacent parietal regions (BA21, BA22, BA39, BA40, BA41, BA42).
The high correlation between input and output patterns of convergence-divergence centers found in this report suggests the presence of reciprocal and short range circular propagation of SWA. We tested these possibilities as follows. For each unitary propagation event of SWA between two cortical recording sites, we investigated whether reciprocal propagation between those areas appears within 100 ms. The number of reciprocal associations was highly above chance in all analyzed sleep episodes of all subjects (p ≈ 0 in comparison with control distributions, Fig. 6A). Finally, three-point circles (i.e., directed three-point trajectories of which the end points are the same as the starting points) of SWA propagation were detected. Three-point circles were abundant in all analyzed epochs (Fig. 6B), showing that propagating SWA often reenters previously visited cortical areas within a short time interval.
Figure 6. Reciprocal connections and short circles in the course of SWA propagation.

A: Normalized number of reciprocal connections calculated for all analyzed sleep segments in all subjects. Normalization was performed using control distributions (see Materials and Methods). Normalized control distributions are superimposed in black (y axis on the left shows probabilities). Normalized numbers of reciprocal propagations are indicated as vertical bars (different lengths correspond to different patients; see y axis on the right). The number of reciprocal connections was found to be highly above control values in all cases (p ≈ 0 in all comparisons). Arrows point to overlapping values. B: Normalized number of three-point circles displayed in a similar way as reciprocal connections. The number of circles was significantly above control values (p ≈ 0 in all cases).
Discussion
Here we analyzed the ECoG patterns of sleep slow waves in humans using a nonlinear correlation technique based on mutual information calculations supplemented by linear correlation measures. While high density scalp EEG provides nearly complete spatial coverage over both hemispheres with a spatial resolution of about 2 cm at the level of the scalp, its localizing capacity is hampered by the spatial smoothing effects of the scalp, skull, pia and cerebrospinal fluid. In contrast, while ECoG recordings provide lower spatial coverage, with a higher spatial resolution of about 1 cm at the level of the cortical surface, it is not burdened by the spatial smoothing effects of the interleaving tissue (Buzsaki, 2006).
Correlations among SWA cycles recorded from different ECoG channels were highest during the first part of the up-states where most of the neuronal spiking interactions take place, confirming that this phase of the oscillation provides an optimal window for neuronal interactions (Luczak et al., 2009). It is also in line with previous findings showing that sleep spindles and hippocampal ripples are phase locked to this segment of the slow wave cycle indicating that the flow of information both among cortical regions and between the thalamo-cortical and hippocampal circuits would be connected to the down- to up-state transition period (Mölle et al., 2006; Clemens et al., 2007).
SWA, recorded by ECoG, showed complex propagation patterns such as convergence, divergence, reciprocal propagation and short circles. Correlations were strongest between neighboring recording sites, although unexpected spatial non-continuities of slow wave propagation were also observed. Cortical areas were shown to receive convergent activity from other regions as well as to disseminate SWA. Centers (or ‘hot spots’) of SWA propagation with high convergence and divergence rate were identified in all subjects. ‘Hot spots’ were stable during and, although to a lesser extent, across nights. These complex patterns of SWA propagation might reflect the differential aspects of local and global mechanisms of neural interactions revealed by cortical electrical activity during SWS.
Our choice of the non-linear correlation measure was based on our observation and on other reports demonstrating that besides linear associations, non-linear dependencies are frequently detected among different brain regions during various brain states (Freiwald et al., 1999; Darvas et al., 2009; Chen et al. 2010). Although linear methods (e.g. cross-correlation, Partial Directed Coherence, Directed Transfer Function) may in certain situations perform better than non-linear ones (e.g MI, transfer entropy, non-linear Granger causality), they has common drawbacks as bias towards the detection of linear associations as well as lack of scaling independence (see Pereda et al., 2005 for a review). The well-established information theory-based MI analysis (Na et al., 2002; Kajikawa and Hackett, 2005; Paz et al., 2010; Pereda et al., 2005) was capable of detecting a larger number of significant associations when compared with linear cross-correlations. These non-linear associations were often characterized by complex and variable input-output functions. Our choices of cross-correlation and MI were in concert with the recommendations of Pereda et al. (2005) for EEG-type data. Functional connections are inferred from linear or non-linear correlation or coherence measures, such as significant short-latency peaks in cross-correlation functions when established between single neurons (Csicsvari et al., 1998; Bartho et al., 2004; Hangya et al., 2010) or significant waveform and phase correlations in case of neural networks or brain areas (Womelsdorf et al., 2007; Singer and Uhlhaas et al., 2009; Buzsaki, 2006; Bullmore and Sporns, 2009). Thus, we speculate that non-linear correlation of SWA activity might reflect functional connections among brain areas.
Associations reported in this study may be mediated by both cortico-cortical and cortico-thalamo-cortical routes of information transmission (Crunelli and Hughes, 2010). Although it is theoretically possible that the two types of communication operate with different temporal delays, consistent bimodality of propagation time distributions could not be revealed. Also, influences of common information sources cannot completely be ruled out (Hangya et al., 2009), although a recent study suggested that such sources do not necessarily cause detectable correlations (Renart et al., 2010).
Based on the concept of traveling waves, a propagating slow wave rarely if at all reenters previously visited cortical sites. However, anatomical studies of cortical structural connectivity show an especially rich repertoire of reciprocal connections and loops within and across brain areas (Bullmore and Sporns, 2009). In concert with the complex patterns of cortical connectivity, we also found a rich source of reciprocal and short circle propagation patterns, which may suggest that electrical activity underlying neuronal processing was often bidirectional, or reentered previously visited areas.
We propose that cortical centers with high convergence and divergence rate might serve as ‘hot spots’ for neuronal interaction in sleep. This view is supported by the relative stability of these ‘hot spots’ and that they show a tendency to have a larger correlation with neighboring cortical areas. Spatial distances between correlated channels were found overall to be short on average, which further emphasize the importance of the finely structured, local neuronal circuitry in electrical activity pattern generation. Longer range correlations arose occasionally, presumably as a consequence of the communication between high connectivity centers. These associations could appear as non-continuous propagation between relatively distant areas. It should be noted however, that rapid step-by-step spread along a continuous array of recording sites could be masked sometimes by higher noise levels on some of the electrodes or reduced signal quality over sulci. Between-night correlations appeared less frequently as compared to within night correlations, which may be a result of slow temporal changes in cortical activity. This hypothesis is in good agreement with previous results showing that local changes in cortical SWA are largely related to daytime experiences (Huber et al., 2004). We did not observe a systematic change of correlation stability with increasing time spent after the surgery. However, an effect of gradual recovery after the surgical intervention on the stability of convergence and divergence centers cannot completely be ruled out.
Although differential placing of the electrode grid in the six patients limited the possibilities of mapping ‘hot spots’ onto anatomical structures, averaging normalized convergence and divergence rates in different Brodmann areas showed an elevated activity in the ventrolateral and dorsolateral prefrontal cortex. These observations are in accordance with previous studies showing the strong involvement of human prefrontal areas in memory consolidation and related delta band oscillatory activity during deep stages of sleep (Diekelmann and Born, 2010). Our findings are also in agreement with the prominent participation of the middle and inferior frontal gyri in SWS propagation (Murphy et al., 2009).
The long-standing observations that sleep is beneficial to remembering (Jenkins and Dallenbach, 1924) has recently been linked to cortical sleep slow waves (Fowler et al., 1973; Marshall et al., 2006). Although large brain areas can engage in synchronous low frequency oscillations (Volghusev et al., 2006; Sirota and Buzsaki, 2005), a number of studies showed localized increase of SWA after learning correlated with memory performance after sleep (Huber et al., 2004; Schmidt et al., 2006; Huber et al., 2007; see also Massimini et al., 2009 and references therein). Thus, a growing body of evidence suggests that memory consolidation during sleep involves localized cortical processes, which are accompanied by regional changes in SWA. Besides reports of SWA propagation over wide cortical areas (Massimini et al., 2004; Hill and Tononi, 2005; Murphy et al., 2009), propagation dynamics should also be examined at a finer spatial scale to detect phenomena possibly underlying local cortical processing (Luczak et al., 2007; Mohajerani et al., 2010). The use of subdural electrode grids, which lack major drawbacks of scalp recordings such as spatial smoothing and attenuation exerted by the intermediate tissues (Buzsaki, 2006; Bangera et al., 2010), allowed us to unravel an unexpected complexity of localized SWA propagation patterns, e.g. short circles and convergence-divergence centers. Thus, our results could provide a first step in filling the gap between global SWA traveling (Massimini et al., 2004) and local operations of cortical networks (Huber et al., 2004; Mohajerani et al., 2010).
Acknowledgments
We thank Emilia Tóth for helping us with the reconstruction of the Brodmann areas. This work was supported by: OTKA PD-77864, OTKA K-81357, NKTH-ANR Neurogen, NKTH-OTKA CNK77793, NIH MH54671.
References
- Bangera NB, Schomer DL, Dehghani N, Ulbert I, Cash S, Papavasiliou S, Eisenberg SR, Dale AM, Halgren E. Experimental validation of the influence of white matter anisotropy on the intracranial EEG forward solution. J Comput Neurosci. 2010;29(3):371–387. doi: 10.1007/s10827-009-0205-z. [DOI] [PMC free article] [PubMed] [Google Scholar]
- Barthó P, Hirase H, Monconduit L, Zugaro M, Harris KD, Buzsáki G. Characterization of neocortical principal cells and interneurons by network interactions and extracellular features. J Neurophysiol. 2004;92:600–608. doi: 10.1152/jn.01170.2003. [DOI] [PubMed] [Google Scholar]
- Bullmore E, Sporns O. Complex brain networks: graph theoretical analysis of structural and functional systems. Nat Rev Neurosci. 2009;10:186–198. doi: 10.1038/nrn2575. [DOI] [PubMed] [Google Scholar]
- Buzsaki G. Rhythms of the Brain. Oxford Univesity Press; New York: 2006. [Google Scholar]
- Caporale N, Dan Y. Spike timing-dependent plasticity: a Hebbian learning rule. Annu Rev Neurosci. 2008;31:25–46. doi: 10.1146/annurev.neuro.31.060407.125639. [DOI] [PubMed] [Google Scholar]
- Cash SS, Halgren E, Dehghani N, Rossetti AO, Thesen T, Wang C, Devinsky O, Kuzniecky R, Doyle W, Madsen JR, Bromfield E, Eross L, Halász P, Karmos G, Csercsa R, Wittner L, Ulbert I. The human K-complex represents an isolated cortical down-state. Science. 2009;324:1084–1087. doi: 10.1126/science.1169626. [DOI] [PMC free article] [PubMed] [Google Scholar]
- Chen CC, Kilner JM, Friston KJ, Kiebel SJ, Jolly RK, Ward NS. Nonlinear coupling in the human motor system. J Neurosci. 2010;30:8393–8399. doi: 10.1523/JNEUROSCI.1194-09.2010. [DOI] [PMC free article] [PubMed] [Google Scholar]
- Clemens Z, Mölle M, Eross L, Barsi P, Halász P, Born J. Temporal coupling of parahippocampal ripples, sleep spindles and slow oscillations in humans. Brain. 2007;130:2868–2878. doi: 10.1093/brain/awm146. [DOI] [PubMed] [Google Scholar]
- Cossart R, Aronov D, Yuste R. Attractor dynamics of network UP states in the neocortex. Nature. 2003;423:283–288. doi: 10.1038/nature01614. [DOI] [PubMed] [Google Scholar]
- Crunelli V, Hughes SW. The slow (<1 Hz) rhythm of non-REM sleep: a dialogue between three cardinal oscillators. Nat Neurosci. 2010;13:9–17. doi: 10.1038/nn.2445. [DOI] [PMC free article] [PubMed] [Google Scholar]
- Csercsa R, Dombovári B, Fabó D, Wittner L, Eross L, Entz L, Sólyom A, Rásonyi G, Szucs A, Kelemen A, Jakus R, Juhos V, Grand L, Magony A, Halász P, Freund TF, Maglóczky Z, Cash SS, Papp L, Karmos G, Halgren E, Ulbert I. Laminar analysis of slow wave activity in humans. Brain. 2010;133:2814–2829. doi: 10.1093/brain/awq169. [DOI] [PMC free article] [PubMed] [Google Scholar]
- Csicsvari J, Hirase H, Czurko A, Buzsáki G. Reliability and state dependence of pyramidal cell-interneuron synapses in the hippocampus: an ensemble approach in the behaving rat. Neuron. 1998;21:179–189. doi: 10.1016/s0896-6273(00)80525-5. [DOI] [PubMed] [Google Scholar]
- Darvas F, Ojemann JG, Sorensen LB. Bi-phase locking - a tool for probing non-linear interaction in the human brain. Neuroimage. 2009;46:123–132. doi: 10.1016/j.neuroimage.2009.01.034. [DOI] [PMC free article] [PubMed] [Google Scholar]
- Diekelmann S, Born J. The memory function of sleep. Nat Rev Neurosci. 2010;11:114–126. doi: 10.1038/nrn2762. [DOI] [PubMed] [Google Scholar]
- Fowler MJ, Sullivan MJ, Ekstrand BR. Sleep and memory. Science. 1973;179:302–304. doi: 10.1126/science.179.4070.302. [DOI] [PubMed] [Google Scholar]
- Freiwald WA, Valdes P, Bosch J, Biscay R, Jimenez JC, Rodriguez LM, Rodriguez V, Kreiter AK, Singer W. Testing non-linearity and directedness of interactions between neural groups in the macaque inferotemporal cortex. J Neurosci Methods. 1999;94:105–119. doi: 10.1016/s0165-0270(99)00129-6. [DOI] [PubMed] [Google Scholar]
- Hangya B, Borhegyi Z, Szilágyi N, Freund TF, Varga V. GABAergic neurons of the medial septum lead the hippocampal network during theta activity. J Neurosci. 2009;29:8094–8102. doi: 10.1523/JNEUROSCI.5665-08.2009. [DOI] [PMC free article] [PubMed] [Google Scholar]
- Hangya B, Li Y, Muller RU, Czurkó A. Complementary spatial firing in place cell-interneuron pairs. J Physiol. 2010;588:4165–4175. doi: 10.1113/jphysiol.2010.194274. [DOI] [PMC free article] [PubMed] [Google Scholar]
- Hill S, Tononi G. Modeling sleep and wakefulness in the thalamocortical system. J Neurophysiol. 2005;93:1671–1698. doi: 10.1152/jn.00915.2004. [DOI] [PubMed] [Google Scholar]
- Huang X, Xu W, Liang J, Takagaki K, Gao X, Wu JY. Spiral wave dynamics in neocortex. Neuron. 2010;68:978–990. doi: 10.1016/j.neuron.2010.11.007. [DOI] [PMC free article] [PubMed] [Google Scholar]
- Huber R, Ghilardi MF, Massimini M, Tononi G. Local sleep and learning. Nature. 2004;430:78–81. doi: 10.1038/nature02663. [DOI] [PubMed] [Google Scholar]
- Huber R, Esser SK, Ferrarelli F, Massimini M, Peterson MJ, Tononi G. TMS-induced cortical potentiation during wakefulness locally increases slow wave activity during sleep. PLoS ONE. 2007;2:e276. doi: 10.1371/journal.pone.0000276. [DOI] [PMC free article] [PubMed] [Google Scholar]
- Iber C, Ancoli-Israel S, Chesson A, Quan SF. The AASM Manual for the Scoring of Sleep and Associated Events: Rules, Terminology and Technical Specifications. Westchester: American Academy of Sleep Medicine; 2007. [Google Scholar]
- Isomura Y, Sirota A, Ozen S, Montgomery S, Mizuseki K, Henze DA, Buzsáki G. Integration and segregation of activity in entorhinal-hippocampal subregions by neocortical slow oscillations. Neuron. 2006;52:871–882. doi: 10.1016/j.neuron.2006.10.023. [DOI] [PubMed] [Google Scholar]
- Jenkins JC, Dallenbach KM. Obliviscence during sleep and waking. Amer J Psychol. 1924;35:605–612. [Google Scholar]
- Kajikawa Y, Hackett TA. Entropy analysis of neuronal spike train synchrony. J Neurosci Methods. 2005;149:90–93. doi: 10.1016/j.jneumeth.2005.05.011. [DOI] [PubMed] [Google Scholar]
- Kurth S, Ringli M, Geiger A, LeBourgeois M, Jenni OG, Huber R. Mapping of cortical activity in the first two decades of life: a high-density sleep electroencephalogram study. J Neurosci. 2010;30:13211–13219. doi: 10.1523/JNEUROSCI.2532-10.2010. [DOI] [PMC free article] [PubMed] [Google Scholar]
- Le Van Quyen M, Staba R, Bragin A, Dickson C, Valderrama M, Fried I, Engel J. Large-scale microelectrode recordings of high-frequency gamma oscillations in human cortex during sleep. J Neurosci. 2010;30:7770–7782. doi: 10.1523/JNEUROSCI.5049-09.2010. [DOI] [PMC free article] [PubMed] [Google Scholar]
- Luczak A, Barthó P, Harris KD. Spontaneous events outline the realm of possible sensory responses in neocortical populations. Neuron. 2009;62:413–425. doi: 10.1016/j.neuron.2009.03.014. [DOI] [PMC free article] [PubMed] [Google Scholar]
- Luczak A, Barthó P, Marguet SL, Buzsáki G, Harris KD. Sequential structure of neocortical spontaneous activity in vivo. Proc Natl Acad Sci USA. 2007;104:347–352. doi: 10.1073/pnas.0605643104. [DOI] [PMC free article] [PubMed] [Google Scholar]
- Magnin M, Rey M, Bastuji H, Guillemant P, Mauguière F, Garcia-Larrea L. Thalamic deactivation at sleep onset precedes that of the cerebral cortex in humans. Proc Natl Acad Sci USA. 2010;107:3829–3833. doi: 10.1073/pnas.0909710107. [DOI] [PMC free article] [PubMed] [Google Scholar]
- Marshall L, Helgadóttir H, Mölle M, Born J. Boosting slow oscillations during sleep potentiates memory. Nature. 2006;444:610–613. doi: 10.1038/nature05278. [DOI] [PubMed] [Google Scholar]
- Massimini M, Huber R, Ferrarelli F, Hill S, Tononi G. The sleep slow oscillation as a traveling wave. J Neurosci. 2004;24:6862–6870. doi: 10.1523/JNEUROSCI.1318-04.2004. [DOI] [PMC free article] [PubMed] [Google Scholar]
- Massimini M, Tononi G, Huber R. Slow waves, synaptic plasticity and information processing: insights from transcranial magnetic stimulation and high-density EEG experiments. Eur J Neurosci. 2009;29:1761–1770. doi: 10.1111/j.1460-9568.2009.06720.x. [DOI] [PMC free article] [PubMed] [Google Scholar]
- Mena-Segovia J, Sims HM, Magill PJ, Bolam JP. Cholinergic brainstem neurons modulate cortical gamma activity during slow oscillations. J Physiol. 2008;586:2947–2960. doi: 10.1113/jphysiol.2008.153874. [DOI] [PMC free article] [PubMed] [Google Scholar]
- Mohajerani MH, McVea DA, Fingas M, Murphy TH. Mirrored bilateral slow-wave cortical activity within local circuits revealed by fast bihemispheric voltage-sensitive dye imaging in anesthetized and awake mice. J Neurosci. 2010;30:3745–3751. doi: 10.1523/JNEUROSCI.6437-09.2010. [DOI] [PMC free article] [PubMed] [Google Scholar]
- Mölle M, Yeshenko O, Marshall L, Sara SJ, Born J. Hippocampal sharp wave-ripples linked to slow oscillations in rat slow-wave sleep. J Neurophysiol. 2006;96:62–70. doi: 10.1152/jn.00014.2006. [DOI] [PubMed] [Google Scholar]
- Murphy M, Riedner BA, Huber R, Massimini M, Ferrarelli F, Tononi G. Source modeling sleep slow waves. Proc Natl Acad Sci USA. 2009;106:1608–1613. doi: 10.1073/pnas.0807933106. [DOI] [PMC free article] [PubMed] [Google Scholar]
- Na SH, Jin SH, Kim SY, Ham BJ. EEG in schizophrenic patients: mutual information analysis. Clin Neurophysiol. 2002;113:1954–1960. doi: 10.1016/s1388-2457(02)00197-9. [DOI] [PubMed] [Google Scholar]
- Ostojic S, Brunel N, Hakim V. How connectivity, background activity, and synaptic properties shape the cross-correlation between spike trains. J Neurosci. 2009;29:10234–10253. doi: 10.1523/JNEUROSCI.1275-09.2009. [DOI] [PMC free article] [PubMed] [Google Scholar]
- Panzeri S, Senatore R, Montemurro MA, Petersen RS. Correcting for the sampling bias problem in spike train information measures. J Neurophysiol. 2007;98:1064–1072. doi: 10.1152/jn.00559.2007. [DOI] [PubMed] [Google Scholar]
- Paz R, Gelbard-Sagiv H, Mukamel R, Harel M, Malach R, Fried I. A neural substrate in the human hippocampus for linking successive events. Proc Natl Acad Sci USA. 2010;107:6046–6051. doi: 10.1073/pnas.0910834107. [DOI] [PMC free article] [PubMed] [Google Scholar]
- Pereda E, Quiroga RQ, Bhattacharya J. Nonlinear multivariate analysis of neurophysiological signals. Prog Neurobiol. 2005;77:1–37. doi: 10.1016/j.pneurobio.2005.10.003. [DOI] [PubMed] [Google Scholar]
- Renart A, de la Rocha J, Bartho P, Hollender L, Parga N, Reyes A, Harris KD. The asynchronous state in cortical circuits. Science. 2010;327:587–590. doi: 10.1126/science.1179850. [DOI] [PMC free article] [PubMed] [Google Scholar]
- Schmidt C, Peigneux P, Muto V, Schenkel M, Knoblauch V, Münch M, de Quervain DJ, Wirz-Justice A, Cajochen C. Encoding difficulty promotes postlearning changes in sleep spindle activity during napping. J Neurosci. 2006;26:8976–8982. doi: 10.1523/JNEUROSCI.2464-06.2006. [DOI] [PMC free article] [PubMed] [Google Scholar]
- Shannon C. A mathematical theory of communication. Bell Syst Tech J. 1948;27:379–423. 623–656. [Google Scholar]
- Sirota A, Buzsáki G. Interaction between neocortical and hippocampal networks via slow oscillations. Thalamus Relat Syst. 2005;3:245–259. doi: 10.1017/S1472928807000258. [DOI] [PMC free article] [PubMed] [Google Scholar]
- Steriade M, Nuñez A, Amzica F. A novel slow (< 1 Hz) oscillation of neocortical neurons in vivo: depolarizing and hyperpolarizing components. J Neurosci. 1993;13:3253–3265. doi: 10.1523/JNEUROSCI.13-08-03252.1993. [DOI] [PMC free article] [PubMed] [Google Scholar]
- Uhlhaas PJ, Pipa G, Lima B, Melloni L, Neuenschwander S, Nikolić D, Singer W. Neural synchrony in cortical networks: history, concept and current status. Front Integr Neurosci. 2009;3:17. doi: 10.3389/neuro.07.017.2009. [DOI] [PMC free article] [PubMed] [Google Scholar]
- Volgushev M, Chauvette S, Mukovski M, Timofeev I. Precise long-range synchronization of activity and silence in neocortical neurons during slow-wave oscillations. J Neurosci. 2006;26:5665–5672. doi: 10.1523/JNEUROSCI.0279-06.2006. Erratum in: J Neurosci 26:table of contents. [DOI] [PMC free article] [PubMed] [Google Scholar]
- Wolansky T, Clement EA, Peters SR, Palczak MA, Dickson CT. Hippocampal slow oscillation: a novel EEG state and its coordination with ongoing neocortical activity. J Neurosci. 2006;26:6213–6229. doi: 10.1523/JNEUROSCI.5594-05.2006. [DOI] [PMC free article] [PubMed] [Google Scholar]
- Womelsdorf T, Schoffelen JM, Oostenveld R, Singer W, Desimone R, Engel AK, Fries P. Modulation of neuronal interactions through neuronal synchronization. Science. 2007;316:1609–1612. doi: 10.1126/science.1139597. [DOI] [PubMed] [Google Scholar]