

Abstract
Microglia are the brain-resident macrophages responsible for immune surveillance that become activated in response to injury, infection, environmental toxins, and other stimuli that threaten neuronal survival. Previous work from our group demonstrated that mice deficient in Regulator of G-protein Signaling 10 (RGS10), a microglia-enriched GTPase activating protein (GAP) for G-protein alpha subunits, displayed increased microglial burden in the CNS at birth and developed a parkinsonian phenotype after exposure to chronic systemic inflammation, implicating a neuroprotective role for RGS10 in the nigrostriatal pathway. While it is known that RGS10 is expressed in both microglia and certain subsets of neurons, it is not known whether RGS10 functions similarly in both cells types. In this study we sought to delineate the specific role of RGS10 in microglia and identify the molecular pathway(s) required for RGS10 to exert its actions in microglia. Here, we identify RGS10 as a negative regulator of the NF-κB pathway in microglia and demonstrate that the pro-inflammatory and cytotoxic phenotype of Rgs10-null microglia can be reversed by lentiviral-mediated restoration of RGS10 expression. In vivo gene transfer of RGS10 into the substantia nigra pars compacta (SNpc) of rats reduced microgliosis and protected against 6-OHDA neurotoxin-induced death of dopaminergic (DA) neurons. Together, our findings suggest that modulation of RGS10 activity in microglia may afford therapeutic benefit in the treatment of chronic neuroinflammatory conditions as well as neuroprotection against inflammation-related degeneration in Parkinson’s disease (PD), the second most common neurodegenerative disorder affecting individuals over age 65.
Keywords: RGS10, microglia, neuroinflammation, dopaminergic neurodegeneration, Parkinson’s disease
Introduction
Microglia, the monocyte-derived resident macrophages of the brain, are primarily responsible for performing innate immune surveillance in the CNS (Puntambekar, 2008; Tansey, 2008). Microglia play a homeostatic role in the CNS and respond to environmental stresses and immunological challenges by scavenging excess neurotoxins and removing dying cells and cellular debris (Ransohoff and Perry, 2009). However, chronically activated microglia overproduce soluble inflammatory mediators such as tumor necrosis factor (TNF), nictric oxide and interleukin-1 all of which have been demonstrated to enhance inflammation-induced oxidative stress in vulnerable neuronal populations (Moss and Bates, 2001; Liu et al., 2002; Block and Hong, 2005; McGeer et al., 2005; Mrak and Griffin, 2005; Sawada et al., 2006). Therefore, elucidation of molecular regulators of microglial responses that affect neuronal survival during chronic inflammatory stress is of great importance as it may reveal opportunities for novel anti-inflammatory strategies to prevent or delay onset of chronic neurodegenerative disease.
Neuroinflammation has been strongly implicated in the pathophysiology of Parkinson’s disease (PD) (reviewed in (Tansey et al., 2007). Two recent microarray studies reported increased expression of genes encoding inflammatory cytokines, subunits of the mitochondrial electron transport chain, and programmed cell death pathways as well as decreased expression of several glutathione-related genes in the lateral tier of substantia nigra (SN) (Duke et al., 2007; Simunovic et al., 2009), the brain region where vulnerable dopaminergic (DA) neurons are located and lost in patients with PD. Moreover, a role for neuroinflammation in PD is supported by epidemiological studies that suggest chronic use of non-steroidal anti-inflammatory drugs may be protective against development of PD (reviewed by (Tansey and Goldberg, 2010).
The Regulator of G-protein Signaling 10 (RGS10) is a 20-kDa protein belonging to a family of highly conserved RGS proteins (Hunt et al., 1996) that negatively regulate G-protein coupled receptor (GPCR) signaling by virtue of their GTPase activating protein (GAP) activity at Gα subunits (Ross and Wilkie, 2000; Sierra et al., 2002). RGS10 is abundantly expressed in the immune system and in a broad range of brain regions including the hippocampus, striatum, and dorsal raphe (Gold et al., 1997). Although RGS10 protein has been detected in a number of subcellular compartments in mouse neurons and microglia (Waugh et al., 2005), its exact physiological function in either cell type is unknown. Phosphorylation of RGS10 by PKA at Ser-168 induces translocation of RGS10 from the plasma membrane and cytosol into the nucleus (Burgon et al., 2001) but it is not known whether it participates in regulation of gene transcription. Previously we reported that RGS10-deficient mice displayed increased microglial burden in the CNS and exposure to chronic systemic inflammation resulted in degeneration of nigral DA neurons (Lee et al., 2008), a parkinsonian phenotype. Our present study identifies RGS10 as a negative regulator of NF-κB-dependent inflammatory factor production in activated microglia in vitro and in vivo and demonstrates the neuroprotective effects of microglial RGS10 gene transfer in a rat model of parkinsonism.
Materials and Methods
Animal Studies
Experimental procedures involving use of animal tissue were performed in accordance with the NIH Guidelines for Animal Care and Use and approved by the Institutional Animal Care and Use Committee at The University of Texas Southwestern Medical Center in Dallas, TX and at Emory University School of Medicine in Atlanta, GA. RGS10−/− mice, generated as previously described (Lee et al., 2008), were re-derived on a C57BL/6 strain for us by Jackson laboratory (Bar Harbor, ME) and have been back-crossed for over ten generations.. Young adult Sprague Dawley SASCO rats (200–250g) were purchased from Charles River Laboratories (Wilmington, MA). Animals were housed in climate controlled facilities staffed with certified veterinarians.
Cell Culture
Primary microglial cells were harvested from mouse pups (n= 6–8 per genotype) at postnatal day 3–6 (P3–P6). Briefly, the brain cortices were isolated and minced. Tissues were dissociated in 0.25 % Trypsin-EDTA for 20 minutes at 37 oC and agitated every 5 minutes. Trypsin was neutralized with complete media [DMEM/F12 supplemented with 20 % heat-inactivated fetal bovine serum (Sigma), 1 % penicillin-streptomycin, and 1 % L-glutamine (Sigma)]. Mixed glial cultures were maintained in complete media at 37 oC and 5 % CO2 for 14–18 days in vitro. Once cultures reached 95 % confluence, primary microglial cells were harvested by mechanical agitation (150 rpm for 40 min). Isolated microglia were plated in DMEM/F12 supplemented with 10 % heat-inactivated fetal bovine serum. The purity of the microglial cultures was found to be > 95 % as measured by CD68 (macrosialin) staining. Contamination with astrocytes (GFAP-positive cells) and neurons (MAP2-positive cells) was < 5%.
The BV2 mouse microglia cell line (Blasi et al., 1990) was grown in DMEM/F12 (Sigma-Aldrich) supplemented with 5 % heat-inactivated fetal bovine serum (FBS, from Sigma-Aldrich) 1 % penicillin/streptomycin, and 1% L-glutamine (Sigma-Aldrich) and serially passaged until reaching 70 % confluence. The murine dopaminergic cell line MN9D (Choi et al., 1991) was grown in DMEM (Sigma-Aldrich) supplemented with 10 % Fetal Clone III (from Hyclone) and 1 % penicillin/streptomycin and serially passaged until reaching 70 % confluence. Terminal differentiation of MN9D cells into DA neuron-like cells was achieved with 5 mM valproic acid in N2 (Invitrogen)-supplemented serum-free DMEM for 3 days. Primary mouse postnatal ventral mesencephalic neuron/glia cultures were prepared from mouse pups (n= 6–8 per genotype) at postnatal day 2–3 (P2–P3). Tissue was minced in ice-cold dissociation media containing sterile filtered DNase1 (1μL/mL, Invitrogen, Carlsbad, CA), Dispase II (1.2 U/mL, Roche, Indianapolis, IN), and Papain (1 mg/mL, Sigma-Aldrich, St. Louis, MO) dissolved in DMEM/F12 (Invitrogen) for 30 minutes at 37 oC with agitation every 10 minutes. Following mechanical and chemical dissociation, mixed glial cells were filtered through a 40 μm-pore filter (BD Falcon). Cells were plated into a 24-well plate (one 75-uL microislands per well at a density of 1 × 10⁶ cells/m) pre-coated with poly-D-lysine (0.1 mg/mL) and laminin (20 ug/mL) in Neurobasal-A medium (Invitrogen) supplemented with 10 % heat-inactivated fetal bovine serum (FBS), 50 U/mL penicillin, 50 ug/mL streptomycin. Microislands were allowed to adhere at 37 °C in a humidified atmosphere of 5 % CO2/95 % air for 30 min and subsequently supplemented with Neurobasal A medium with B27 (Gibco), 1 % penicillin-streptomycin, and 1 % L-glutamine (Sigma). Media was replenished every 3 days by changing one third of the total volume. After 7 days in vitro, cultures were treated in quadruplicate with TNF (10 ng/mL), 6-OHDA (20 uM or 50 uM) for 72 hrs or pre-treated 6-OHDA (20 uM) for 18 hrs followed by TNF (10 ng/mL) for 72 hrs. Cells were fixed, permeabilized and processed for immunocytochemical analyses.
Small Interfering RNA (siRNA)
RGS10-specific siRNA duplexes, nonsilencing control siRNA, and siRNA transfection reagents were purchased from Santa Cruz Biotechnology (Santa Cruz, CA). The siRNA transfection was performed according to the manufacturer’s protocol. Final siRNA concentration was 60 nM and siRNA optimization and validation have been described previously (Lee et al., 2008).
Target effector assay
Assays were performed as described previously using differentiated MN9D cells (target) plated in flat-bottomed 96-well plates at a density of 7 × 10³ cells/well and either primary post-natal microglia or murine microglial BV2 cells (effector cells). LPS from E. coli strain 0111:B4 (Catalog # L4391) was purchased from Sigma-Aldrich. Two days after transfer of microglia conditioned media (CM), CellTiter 96 Aqueous Assay (Promega) was used to measure metabolic activity of MN9D cells during the last 2–4 hours of a two-day culture as a measure of cell viability. Each experimental condition was performed in triplicate (or quadruplicate in the case of experiments involving differentiated MN9D cells) and three to four independent experiments were conducted to confirm the results.
Phagocytosis Assay
Primary microglia were isolated and plated at a density of 50,000 cells/well in 96-well plates and allowed to adhere for 8 hours. Aβ1-42 (US peptide) is dissolved in 12.5 % acetonitrile and phosphate-buffered saline, and aggregated at a concentration of 50 μM at 37 °C for 2 h. Upon adherence, cells were treated with LPS (10 ng/mL)/ Aβ1-42 (1 μM), M-CSF (50 ng/mL) or M-CSF (50 ng/mL)/ Aβ1-42 (1 μM) for 18 hrs. Phagocytic activity measured using the Vibrant Phagocytosis Assay using fluorescently labeled E. coli particle (Invitrogen). Fc-receptor-mediated phagocytosis was measured using the CytoSelect™ 96-Well Phagocytosis Assay (Cell Biolabs, Inc, San Diego, CA). Primary microglia cells were harvested and plated in culture medium at 2 × 10⁵ cells/mL and incubated overnight at 37 oC in 5 % CO2 humidified air. Cells were plated (100 μL) in each well of a 96-well plate and treated with LPS (10 ng/mL)/ Aβ1-42 (1μM), M-CSF (50 ng/mL) or M-CSF (50 ng/mL)/ Aβ1-42 (1 μM) for 18 hrs. IgG opsonized erythrocyte suspension was prepared by mixing and incubating opsonization solution with the sheep erythrocyte suspension at a 1:500 dilution at 37 oC for 30 minutes. 10 uL of IgG opsonized erythrocytes suspension was added and incubated for 2 hrs. Culture medium was removed by gentle aspiration. Wells were washed and lysed according to the manufacturer’s manual. Lysates were incubated with substrate solution and the absorbance was measured at 610 nm in a 96-well plate reader.
Chemotaxis Assay
Primary microglia cells were fluorescently stained using 200 nM of Mitotracker Red CM2-XROS (Molecular Probes, Invitrogen) for 30 min at 37 °C and cells were washed in serum free media and then plated at 2 × 10⁵ cells per well in the insert provided by HTS FluoroBlok Multiwell Insert System (BD Falcon). The inserts were placed in a feeder tray with 1 mL of serum-free media in each well. Cells were allowed to adhere for 3 hours in the incubator and then inserts were transferred to a seeder plate which contains LPS (1 ug/mL), medium containing 10 % FBS or LPS (1 ug/mL) plus medium containing 10 % FBS for 18 hours. Plate was read using a bottom reading fluorescent plate reader at 585 nm excitation/ 620 nm emission. Each experimental condition was performed in quadruplicate.
Multiplexed Immunoassays
Murine microglial BV2 cells or primary microglia were cultured in the presence of various concentrations of LPS for 24 hrs. Conditioned Medium (CM) from BV2 cells were used to measure the production of cytokines and chemokines including murine IFN-γ, IL-1β, IL-6, IL-10, IL-12, KC, and TNF using a multiplex assay per the manufacturer’s instructions(Meso-Scale Discovery, Gaithersburg, MD).
Lentivirus
The human full length RGS10 DNA sequence or Green Fluorescent Protein (GFP) sequence were subcloned into a constitutive self-inactivating lentiviral vector based on the plasmid pLV5′ of an internal ribosome entry site (IRES). The GFP-expressing lentivirus has been previously described and validated. (Pfeifer et al., 2002; Taylor et al., 2006; McCoy et al., 2008; McAlpine et al., 2009; Harms et al., 2010). Lentiviral vectors were VSV pseudotyped and RGS10 or GFP expression was driven by the CMV/b-actin hybrid promoter (CAG). Viral vectors were provided by the Hope Center Viral Vectors Core, a facility supported by a Neuroscience Blueprint Core grant (P30 NS057105) from NIH to Washington University. The final titer was 1.6 × 10⁹ IU/mL for the lenti-RGS10 and 1.2 × 10⁸ IU/mL for lenti-GFP control. All viruses were diluted in Hanks Balanced Salt Solution (HBSS) (Invitrogen, Carlsbad, CA).
Immunocytochemistry
Cells were fixed and immunostained as described previously (Lee et al., 2008). Antibodies for RGS10 (1:200, Santa Cruz Biotech), GFP (1:1000, Abcam), Tyrosine hydroxylase (TH) (1:250, Millipore) and the approrpirate Alexa-conjugated secondary antibodies (1:1000, Invitrogen) plus Hoechst 33258 as a nuclear counterstain were employed. Images were captured with a CoolSnap CCD ES monochromatic camera and analyzed with MetaMorph software (Universal Imaging Systems, West Chester, PA). Cells were incubated for 24 hrs at 4 °C with anti-). TH-positive cells in mixed glial cultures were quantified by IsoCyte™ laser scanning imager (MDS Analytical Technologies)
Luciferase reporter assays
Primary microglia cells at a density of 1 × 10⁴ cells or BV2 cells at a density of 5x 10³ cells were plated in a Costar 96-Well White Clear-Bottom Plates (Fisher Scientific) and incubate for 24 hrs to adhere on the bottom of the plate. Cells then were transfected with 10 multiplicity of infection (MOI) of the inducible NFκB-responsive or CREB-responsive firefly luciferase reporter and 1 MOI of the cignal™ lenti renilla control using SureENTRY transduction reagent according to manufacturer manual (SABioscience). The next day, primary microglia cells were treated either PBS (vehicle), 1 ug/mL LPS or 10 ng/mL recombinant mosue (rm) TNF (R&D systems, Minneapolis MN) for 18 hrs. BV2 cells were transfected with siControl or siRGS10 plasmid for 24 hrs before the cells were treated as indicated. At the end of the treatment period, firefly and renilla luciferase activities were determined using the Dual-Glo Luciferase Assay System (Promega). The amount of firefly luciferase activity of the transfected cells was normalized to renilla luciferase activity. Data are expressed as the relative luciferase activity compared to the vehicle-treated cells. Data presented are from one experiment representative of three independent experiments.
Western blots
Cells were lysed with 1 % NP-40, 10 mM Tris pH 7.4, 150 mM NaCl, 100 μg/mL PMSF, and protease inhibitor mix (Sigma) for 30 min on ice. Lysates were resuspended in 2x Laemmli sample buffer and loaded on precast 12 % SDS-PAGE gels (Bio-Rad), transferred onto PDVF membranes (Millipore), and probed with anti-IkB (1:200), anti-p65 (1:200), anti-p50 (1:200) and α-tubulin (1:1000) antibody (Santa Cruz Biotechnology) plus the appropriate HRP-conjugated secondary antibody (1:5000, Jackson ImmunoResearch Lab, West Grove, PA). Immuno-reactive bands were visualized with SuperSignal West Femto HRP substrate (Thermo Fisher Scientific, Rockford, IL) according to the manufacturer’s instructions. Membranes were stripped with 0.2 M glycine, 1 % SDS and 0.1 % Tween-20, pH 2.2 and re-probed as necessary.
Stereotaxic Surgery
Young adult female Sprague-Dawley rats (200–250 g) were used for intrastriatal 6-OHDA lesions performed as described previously (McCoy et al., 2008) using the following stereotaxic coordinates (AP): −1.2 mm from bregma, (ML): −3.9 mm, (DV): −5.0 mm below surface of the dura. 4 μL of 6-OHDA or saline were infused into the striatum on the right hemisphere at the rate of 0.5 μL/min. A second burr hole was drilled to allow a single unilateral injection of 2 μL of lenti-RGS10 (n=8) or lenti-GFP (n=7) using a 28-gauge needle at a rate of 0.5μL/min into the substantia nigra pars compacta into the nigra on the right side of hemisphere at the following coordinates (AP): −5.3 mm from bregma, (ML): −2.3 mm, (DV): −7.3 mm below surface of dura. Post-operatively and for the following 3 days, animals received subcutaneous injections of the buprenomorphine HCL (0.05 mg/kg) and were monitored closely for signs of pain or discomfort.
Perfusions and Tissue processing
At 3 weeks post lesion, animals were deeply anesthetized with Euthasol (pentobarbital sodium and phenytoin sodium) and intracardially perfused as described previously (McCoy et al., 2008). Tissue was processed as described previously (McCoy et al., 2008). Coronal sections (30 μm thickness) were cut through the striatum and substantia nigra pars compacta (SNpc) on a Leica (Nussloch, Germany) cryostat and mounted on glass slides (SuperFrost Plus; Fisher Scientific, Houston, TX) for immunohistological analyses and stereological estimate of DA neuron number.
Immunohistochemistry
For bright-field immunohistochemistry, sections on glass slides were performed using previously published DAB protocols (Taylor et al., 2006; Harms et al., 2010). The following antibodies were used: Tyrosine hydroxylase (TH) (1:5000, Millipore); Neuronal nuclei (NeuN) (1:2000, Millipore); biotinylated secondary antibodies (1:200, Vector 68 Laboratories Burlingame, CA); neutravidin-HRP (1:5000, Thermo Scientific). For immunofluorescence, sections on glass slides were fixed for an additional 15 min in 4 % paraformaldehyde, followed by a 1 × PBS rinse, pH 7.4. Sections were incubated in 0.2 M glycine, pH 7.4, for 30 min to minimize tissue autofluorescence caused by the aldehyde fixative. Sections were permeabilized for 35 min in TBS containing 0.3 % Triton X-100 and 1 % normal donkey serum (NDS), followed by blocking for 60 min in TBS containing 1 % NDS. Sections were incubated in primary antibody for 24 hrs at 4 °C in TBS containing 0.1 % Triton X-100 and 1 % NGS. Tyrosine hydroxylase (TH) (MAB318, Millipore) (1:250), Iba1 (Wako Pure Chemical Industries, Ltd., Osaka, Japan) (1:250), RGS10 (C-20, Santa Cruz) (1:200) followed by the appropriate Alexa-conjugated secondary antibodies (1:1000, Invitrogen). Non-immune IgG sera at the same concentration as the primary antibodies were used to confirm the specificity of staining.
Confocal Microscop
Images of Iba1+ microglia (red) and RGS10+ cells (green) and TH+ cells (blue) in the ventral midbrain three weeks after lenti-RGS10 transduction were acquired using an Olympus FV1000 Laser Scanning Confocal system attached to an Olympus IX81 microscope (Center Valley, PA). Images (12 bits/pixel) and optical slices for a Z-stack series were obtained using a 100x (1.45 numerical aperture) objective at the best resolution (0.38-μm interval step slices at a sampling speed of 20 μs/pixel) and processed for analysis using Olympus Fluoview FV10-ASW (version 01.07.02.02; Center valley, PA) software and Adobe Photoshop CS3 (version 10.0.1; San Jose, CA).
Quantification of Microglia
Quantification of Iba1+ cells was performed on images captured under 20x objective lens on a Nikon 90i fluorescence microscope using thresholding analysis on Nikon Elements 5 software. Values represent the mean ± S.E.M. of Iba1+ microglia per field calculated from six separate brain sections (4–6 random fields per section) within SNpc or a region of equal size in the entorhinal cortex from 3 animals per genotype.
Stereology
StereoInvestigator analyses software (Micro Bright Field Inc., Williston, VT) was used to perform unbiased stereological counts of TH-immunoreactive (TH-IR) cell bodies in the SNpc using the optical fractionator method (West et al., 1991). For analysis, the treatment of the various brain sections was blinded to the observer. The boundary of SNpc was outlined under magnification of the 4X objective. Cells were counted with a 40 × oil immersion objective (1.3 NA) using a Nikon 80i upright fluorescence microscope. Serial sections through the extent of SNpc were cut on a Leica CM1650 cryostat and placed 6 per slide (cut thickness of 30 μm and final mounted thickness of 22 μm) for systematic analysis of randomly placed counting frames (size 50 × 50 μm) on a counting grid (size of 190 × 130 μm) and sampled using an 18 μm optical dissector with 2 μm upper and lower guard zones. Every other slide was stained for TH/bisbenzimide. A DA neuron was defined as a TH immunoreactive cell body with a clearly visible TH-negative nucleus.
Statistical analysis
For culture experiments, differences treatments among the different groups were analyzed by two-way ANOVA followed by the bonferroni post hoc test for p values significance. Differences among means were analyzed using one-way ANOVA. When ANOVA showed significant differences, comparisons between means were tested by the Tukey–Kramer multiplecomparison post hoc test. Left versus right differences from the same animals were analyzed using two-tailed paired Student’s t test. Values expressed are the group mean +/− SEM. Values expressed are the mean +/− SEM; *p < 0.05; **p< 0.01;***p <0.001 compared within the group. #p < 0.05; ##p< 0.01; ###p <0.001 compared between the groups.
Results
RGS10 limits inflammatory factor production by activated microglia and cytotoxicity on dopaminergic cells
RGS10 is highly expressed in brain microglia (Waugh et al., 2005) and we previously reported increased microglial burden in the brains of RGS10-null mice (Lee et al., 2008), suggesting RGS10 may have a critical function in microglia activation. Therefore, we investigated the resting and activated phenotype of primary microglia isolated from RGS10-null mice with the intent to identify signaling pathways regulated by RGS10 in microglia. First, we measured the production of inflammatory mediators in resting microglia and after LPS stimulation. Multiplexed immunoassays revealed that conditioned medium of LPS-treated primary microglia contained significantly higher amounts of TNF in a physiologically relevant concentration range and also increased levels of other cytokines including IL-1, IL-6, IL-10, IL-12, and the chemokine CXCL1 also known as KC or GRO-1 (Fig. 1). These results were in agreement with previous findings in which conditional knockdown using siRNA oligos specific RGS10 in the BV2 mouse microglia cell line resulted in enhanced LPS-evoked TNF production and enhanced cytotoxicity on dopaminergic neuroblastoma cells (Lee et al., 2008). To further extend these findings we investigated whether the enhanced pro-inflammatory profile of activated RGS10-null microglia resulted in enhanced cytotoxicity on DA cells compared to that of activated wild type microglia. Using target effector assays, we found that conditioned medium (CM) from LPS-treated RGS10-null microglia induced robust death of MN9D cells in a dose-dependent manner compared to CM from wild type microglia (Fig. 2A). To confirm the specificity of RGS10 for this microglia effector function we compared the cytotoxicity of microglia after conditional knockdown of RGS4, another RGS protein of similar molecular weight that is also expressed in microglia. Target effector assays using scrambled control siRNA, RGS4 siRNA, or RGS10 siRNA oligonucleotides in the BV2 microglia cell line as effector cells confirmed the specificity of the RGS10 knockdown; only knockdown of RGS10, and not RGS4, resulted in enhanced dose-dependent LPS-induced toxicity of microglial-derived CM on terminally differentiated MN9D dopaminergic cells (Fig. 2B). To investigate whether RGS10 also has a critical role in other microglia effector functions, we measured the phagocytic and chemotactic responses of post-natal microglia isolated from wild type versus RGS10-null mice. We found that LPS plus fibrillar amyloid s (fAs), macrophage colony-stimulating factor (M-CSF), or combinations of these agents elicited similar extents of phagocytosis of fluorescently-labeled E. coli particles by both wild type and RGS10-null microglia (Fig. 3A) but lower extent of phagocytic activity of Fc gamma receptor-mediated phagocytosis (Fig. 3B). Lastly, we measured the chemotactic response of wild type versus RGS10-null microglia to serum-containing medium or serum plus LPS and found a 20–25 % increase in chemotaxis but no difference between genotypes (Fig. 3C). Taken together, these findings support the idea that RGS10 primarily functions in an anti-inflammatory role in activated microglia by limiting production of Th1 cytokines and chemokines, thereby lessening cytotoxic effects on vulnerable neurons during periods of neuroinflammatory stress. In a recent study, Nurr1, a transcription factor required for specification of dopaminergic neuron fate, was shown to play this exact role in both microglia and astrocytes (Saijo et al., 2009).
Figure 1. RGS10 limits production of microglial inflammatory mediators.

Primary microglia from WT or Rgs10-null (P4) mice were isolated as described in materials and methods. Cells were plated at a density of 50,000 cells/well in 24-well plates and treated with PBS or LPS (10 ng/mL or 1 ug/mL) for 24 hrs. Conditioned media were collected and inflammatory factor production was measured by multiplexed immunoassays (Meso-Scale Discovery). Values shown are group means (n=3) ± S.E.M from one experiment representative of four independent experiments. *, ** or *** denotes significant differences between vehicle and LPS within the genotype at p < 0.05, p < 0.01 or p < 0.001 respectively. ##,### denotes significant differences between WT and Rgs10-null group at p < 0.01 or p< 0.001 respectively. Values shown are group means (n=3) ± S.E.M from one experiment representative of three independent experiments.
Figure 2. RGS10 limits cytotoxicity of activated microglia on DA cells.

Primary microglia from WT or Rgs10-null (P4) mice were isolated as described in materials and methods. A. Primary microglia were plated at a density of 50,000 cells/well in 24-well plates and treated with PBS or LPS (10 ng/mL or 1 ug/mL) for 24 hrs. Conditioned media were collected and transferred into differentiated MN9Ds (10,000 cells/well in 96-well plate). Target effector assay (MTS viability assay) was performed 48 hrs after incubation. *** denotes significant differences at p < 0.001 between vehicle and LPS within the genotype. ##,### denotes significant differences at p < 0.01 or p< 0.001 respectively between WT and Rgs10-null group. Values shown are group means (n=4) ± S.E.M from one experiment representative of three independent experiments. B, Target effector assay using RGS10 siRNA or RGS4 siRNA transfected BV2 microglia as effector cells. BV2 cells were plated at a density of 150,000 cells/well in 12-well plates and transfected with control siRNA, RGS10 siRNA or RGS4 siRNA (final concentration at 60 nM) for 24 hrs. BV2 cells were treated with PBS or LPS (10 ng/mL or 1 ug/mL) for 24 hrs and conditioned media were collected and transferred into differentiated MN9D cells. Viability of MN9D cells was measured 48 hrs after addition of conditioned media. * or *** denotes significant differences between vehicle and LPS within the group at p < 0.05 or p < 0.001 respectively. #, ## or ### denotes significant differences between the groups (siCon and siRGS10 group, siRGS10 and siRGS4 or siCon and siRGS4) at p < 0.05, p < 0.01 or p< 0.001 respectively. Values shown are group means (n=4) ± S.E.M from one experiment representative of two independent experiments. C. Western blot analysis of RGS10 and RGS4 in BV2 cells 24 hrs after transfection of siRNAs for control, RGS10 or RGS4. Expression levels were determined by densitometry and normalized to alpha-tubulin expression.
Figure 3. Effects of RGS10 deficiency on phagocytosis and chemotaxis.

Primary microglia from Rgs10-null (P4) mice were isolated as described in materials and methods. Cells were plated in 96-well plates at a density of 50,000 cells/well and treated with LPS (10 ng/mL)/ Aβ1-42 (1 uM), M-CSF (50 ng/mL) or M-CSF (50 ng/mL)/ Aβ1-42 (1 uM) for 18 hrs. A, Phagocytic activity against E. coli particles was measured using the Vibrant Phagocytosis Assay using fluorescently labeled E. coli particles (Invitrogen) as described in material and method. B, Fc-receptor mediated phagocytosis assay were performed using CytoSelect™ 96-Well Phagocytosis Assay (Cell Biolabs, Inc, San Diego, CA) as described in material and method. C, Fluorescently (Mitotracker Red) labeled primary microglia were plated at a density of 200,000 cells/insert. Inserts were transferred to a seeder plate which contains LPS (1 ug/mL), medium containing 10 % FBS or LPS (1 ug/mL) plus medium containing 10 % FBS for 18 hours. Chemotaxis was measured by reading fluorescence at 585 nm excitation/ 620 nm emission. *, ** or *** denotes significant differences between vehicle and treatments within the genotype at p < 0.05, p < 0.01 or p < 0.001 respectively. ### denotes significant differences between WT and Rgs10-null group at p< 0.001. Values shown are group means (n=4) ± S.E.M from one experiment representative of three independent experiments.
RGS10 negatively regulates NF-κB activation in LPS and TNF-stimulated microglia
While RGS10 has never been reported to act as a transcription factor or to be involved in regulation of gene transcription, previous work from our group demonstrated that in resting microglia, RGS10 is expressed throughout both cytoplasmic and nuclear compartments and upon stimulation with LPS (10 ng/mL) there is rapid and robust nuclear enrichment of RGS10 discernible by 24 hrs after stimulation (Lee et al., 2008). Therefore, we posited that nuclear RGS10 limits cytokine production in activated microglia by modulating NF-κB pathway activation. To test this directly, we performed western blot analyses to measure expression of the NF-κB subunits p65 and p50 in RGS10-null microglia. We found increased levels of both p50 and p65 in RGS10-null microglia compared to wild type microglia, suggesting that loss of RGS10 may contribute to dysregulated NF-κB pathway expression and/or activation (Fig. 4A). To further test this directly, we measured NF-κB-dependent transcriptional activity in resting or activated wild type (WT) and RGS10-null microglia using lentiviral constructs encoding NF-κB-luciferase reporter plasmids. We found that RGS10-null microglia displayed enhanced NF-κB pathway activation in response to both LPS (Fig. 4B) and TNF (Fig. 4C) compared to that of wild type microglia. To determine whether RGS10 could acutely regulate NF-κB pathway activation, we infected RGS10-null microglia with a lentiviral expression plasmid encoding FLAG-tagged RGS10 (or GFP as negative control) and compared their NF-κB-luciferase signal with that of wild type microglia transduced with lenti-GFP at baseline and after LPS or TNF stimulation. In support of the hypothesis that RGS10 is a negative regulator of NF-κB pathway activation, we found that re-introduction of RGS10 was sufficient to reverse the enhanced NF-κB signal after LPS or TNF stimulation in RGS10-null microglia (Fig. 4D). To confirm and extend these findings, we measured NF-κB pathway activation in murine microglia BV2 cells after siRNA-mediated RGS10 knockdown and after restoration of RGS10 via lenti-RSG10. In agreement with results obtained in RGS10-null microglia, RGS10 knockdown in BV2 cells significantly enhanced NF-κB activity in response to LPS or TNF stimulation (Fig. 4E). Importantly, re-introduction of RGS10 by lenti-RGS10 after siRGS10 knockdown was sufficient to normalize the response NF-κB activation response (Fig. 4E). Together, these results suggest the anti-inflammatory function of RGS10 is mediated via negative regulation of NF-κB-dependent gene transcription in activated microglia and are consistent with the pro-inflammatory phenotype of microglia after genetic ablation or siRNA-mediated knockdown of RGS10.
Figure 4. RGS10 negatively regulates NFkB activation in LPS and TNF-treated primary microglia and restoration of RGS10 is sufficient to reverse the NFkB activation in LPS and TNF-treated BV2 microglia.

Primary microglia from Rgs10-null (P4) mice were isolated as described in materials and methods. A, Cells were plated at the density of 200,000 cells/well in 12-well plates and treated with LPS (1 ug/ml) for indicated times. Western blot analysis were performed to measure expression of NFkB signaling proteins (expressions were determined by densitometry and normalized to alpha-tubulin expression). Data is representative of two independent experiments. B, C, Primary microglia were plated at the density of 15,000 cells/well in 96-well plates. Cells were transfected with the inducible NFκB-responsive firefly luciferase reporter and the Cignal™ lenti renilla as described in materials and methods. Cells were treated with LPS (1ug/mL) (B) or TNF (10 ng/mL) (C) for 18 hrs. D. Primary microglia were isolated from WT and RGS10-null mice and plated at the density of 15,000 cells/well in 96-well plates. Cells were transfected with the inducible NFκB-responsive firefly luciferase reporter and the Cignal™ lenti renilla as described in materials and methods and infected with lenti-GFP or lenti-RGS10 (approximately 7.5X10⁵ EU) for 24 hrs prior to LPS or TNF treatments. Cells were then treated with LPS (1ug/mL) or TNF (10 ng/mL) for 18 hrs and luciferase assay was performed and values were normalized to renilla activity. E, BV2 cells were plated at the density of 5,000 cells/well in 96-well plates. Cells were transfected with reporter as described above. Cells were then transfected with control siRNA, RGS10 siRNA or lenti-RGS10 virus for 24 hrs followed by LPS (1ug/mL) or TNF (10 ng/mL) treatement for 18 hrs. Luciferase assay was performed values were normalized to renilla activity. *, ** or *** denotes significant differences between vehicle and LPS within the genotype at p < 0.05, p < 0.01 or p < 0.001 respectively. #,##,### denotes significant differences between WT and Rgs10-null group at p < 0.05, p< 0.01 or p< 0.001 respectively. Values shown are group means (n=4) ± S.E.M from one experiment representative of three independent experiments.
Restoration of RGS10 is sufficient to reverse the pro-inflammatory and cytotoxic phenotype of Rgs10-null microglia
Based on the above finding that lentiviral-mediated restoration of RGS10 protein expression in RGS10-null microglia or after siRNA-mediated knockdown of RGS10 reversed the exaggerated LPS- and TNF-induced activation of the NF-κB pathway (Fig. 4), we expected that production of inflammatory factors by activated microglia and their resultant cytotoxicity on DA cells would also be attenuated. To test this directly, we transduced RGS10-null microglia with lenti-RGS10 or lenti-GFP (as negative control) and confirmed RGS10 expression in > 99 % of the cells by immunofluorescence labeling (Fig. 5A). We then collected CM from saline or LPS (1ug/mL)-treated microglia and measured inflammatory factor protein levels by multiplexed immunoassays. Our analyses revealed that CM of lenti-RGS10-infected microglia contained significantly lower amounts of TNF, IL-6, KC (CXCL1) proteins but slightly increased levels of IL-1 (Fig. 5B). To determine whether this reduction in levels of pro-inflammatory cytokines was sufficient to attenuate cytotoxicity on terminally differentiated MN9D dopaminergic cells, we performed target-effector assays. We found that CM from LPS-treated RGS10-null microglia in which RGS10 protein expression was restored with lenti-RGS10 exerted lower cytoxicity on differentiated dopaminergic MN9D cells compared to CM from RGS10-null microglia transduced with lenti-GFP (Fig. 6). Taken together, our findings demonstrate that RGS10 negatively regulates NF-κB pathway activation consistent with its ability to limit microglia-derived inflammatory factor production and cytotoxicity on dopaminergic cells. The implication of these findings is that RGS10 may limit the vulnerability of primary DA neurons from the ventral midbrain to the degenerating effects of exacerbated inflammation during neurotoxic insults. To test this directly, we compared the sensitivity of DA neurons (tyrosine hydroxylase-positive neurons) in primary neuron-glia cultures from ventral mesencephalon from post-natal RGS10-null or wild type mice to TNF and/or the oxidative neurotoxin 6-hydroxydopamine (6-OHDA). We found genetic ablation of RGS10 renders DA neurons more vulnerable to 6-OHDA and the combined effects of TNF and 6-OHDA (Fig. 7). Together with our previous observation that RGS10-null mice exposed to chronic systemic inflammation displayed increased vulnerability to inflammation-related nigral degeneration (Lee et al., 2008), these in vitro and in vivo findings revealed an important neuroprotective role for RGS10 and prompted us to investigate whether overexpression of RGS10 in microglia prior to a neuronal insult that compromises DA neuron survival in vivo could suppress overproduction of inflammatory factors by activated microglia and afford neuroprotection to the nigrostriatal pathway.
Figure 5. Restoration of RGS10 is sufficient to reverse the pro-inflammatory phenotype of Rgs10-null microglia.

Primary microglia from Rgs10-null (P4) mice were isolated as described in materials and methods. Cells were plated at a density of 50,000 cells/well in 24-well plates and infected with lenti-RGS10 or lenti-GFP virus for 48 hrs. A, Immunofluorescent labeling of the GFP or RGS10 in primary RGS10-null microglia to confirm the expression of GFP and RGS10 after transduction. Scale bar, 100 um. B. Western blot analysis of RGS10 in RGS10-null primary microglia after 24 hours of viral transduction with lenti-RGS10 or lenti-GFP virus. Expression levels were determined by densitometry and normalized to alpha-tubulin expression. C, Primary microglia were plated at a density of 50,000 cells/well in 24-well plates and infected with lenti-RGS10 or lenti-GFP virus for 48 hrs. Cells were treated with PBS or LPS (10 ng/mL or 1 ug/mL) for 24 hrs. Conditioned media were collected and inflammatory factor production was measured by multiplexed immunoassays (Meso-Scale Discovery). * or *** denotes significant differences between vehicle and LPS within the group at p < 0.05 or p < 0.001 respectively. #, ### denotes significant differences between lenti-GFP and lenti-RGS group at p < 0.05 or p< 0.001 respectively. Values shown are group means (n=4) ± S.E.M from one experiment representative of three independent experiments.
Figure 6. Restoration of RGS10 is sufficient to reverse the enhanced cytotoxic phenotype of Rgs10-null microglia on dopaminergic cells.
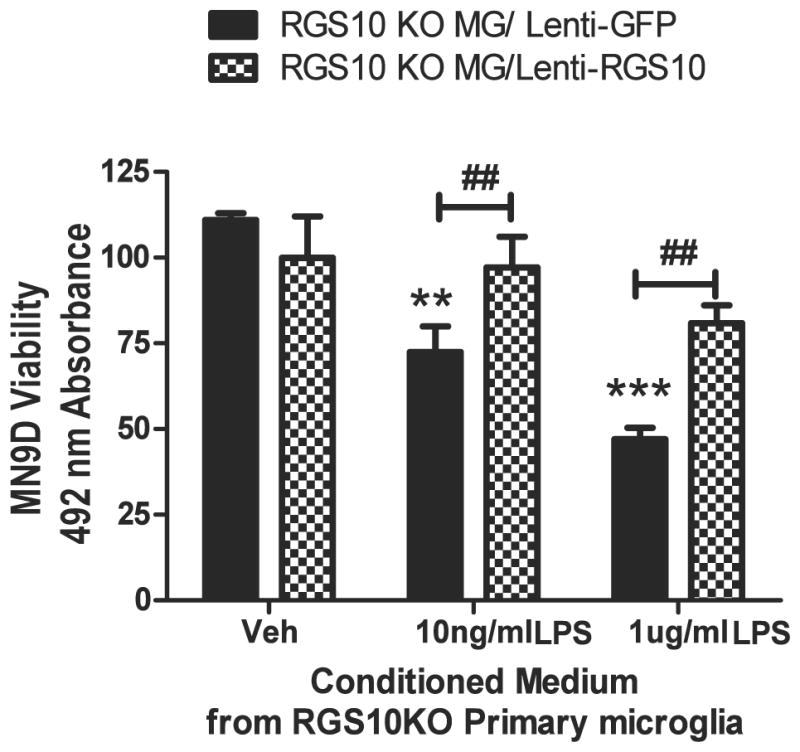
Primary microglia cells plated at a density of 50,000 cells/well in 24-well plates and infected with lenti-RGS10 or lenti-GFP for 48 hrs. Cells were treated with PBS or LPS (10 ng/mL or 1 ug/mL) for 24 hrs and conditioned media were collected for target-effector assays. Cytotoxic effects on differentiated MN9D dopaminergic cells were measured 48 hrs after incubation. Values shown are group means (n=4) ± S.E.M from one experiment representative of 3 independent experiments. ** or *** denotes significant differences between vehicle and LPS within the group at p < 0.01 or p < 0.001 respectively. ## denotes significant differences between lenti-GFP and lenti-RGS10 group at ##p < 0.01.
Figure 7. RGS10-deficient ventral midbrain primary neuron-glia cultures display increased sensitivity to inflammatory and neurotoxic stimuli.
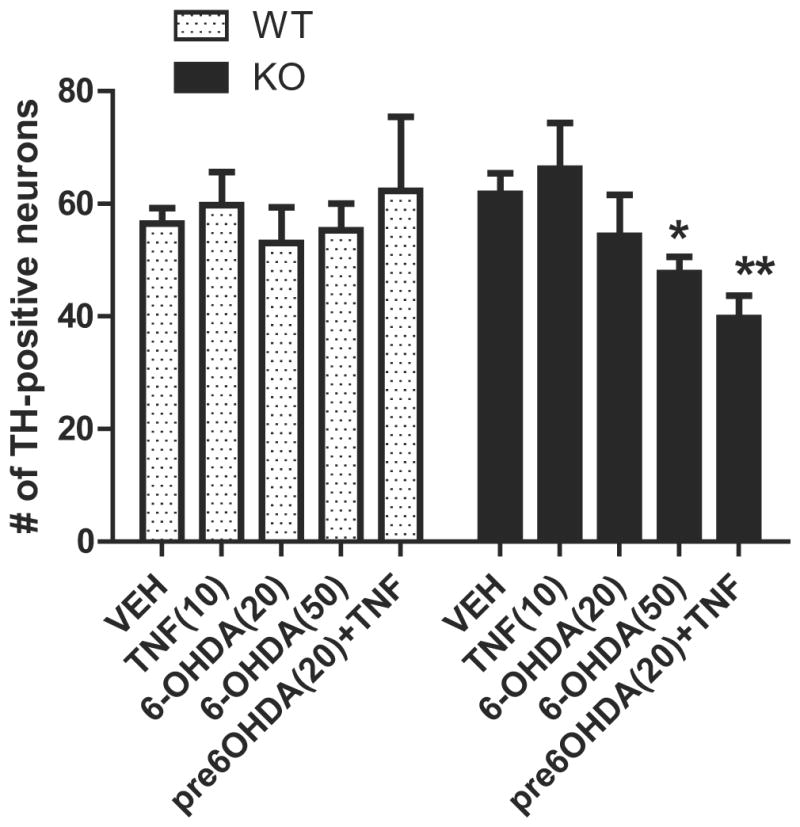
Primary neuron/glia cultures from postnatal mouse ventral mesencephalon were prepared as described in materials and methods. Cells were plated in 24-well plates (one 75 ul-microisland per well at a density of 1 × 10⁶ cells/mL). Experiments were performed in cultures after 7 days in vitro (DIV). Cells were treated in quadruplicate with TNF (10 ng/mL), 6-OHDA (20 uM or 50 uM) for 72 hrs or pre-treated with 6-OHDA (20 uM) for 18 hrs followed by TNF (10 ng/mL) for 72 hrs. Cells were fixed, permeabilized and blocked according to immunocytochemistry protocol. Cells were incubated for 24 hrs at 4° C with anti-Tyrosine hydroxylase (TH) (1:250) (Millipore) and Alexa-488 conjugated secondary antibody (1:1000) (Invitrogen).. * or ** denotes significant differences between vehicle and treatments within the group at p < 0.05 or p < 0.01 respectively. Values shown are group means (n=4) ± S.E.M from one experiment representative of three independent experiments
RGS10 gene transfer into ventral midbrain attenuates microglia activation and protects the nigrostriatal pathway against neurotoxin-induced degeneration
The oxidative neurotoxin 6-OHDA is a mitochondrial complex I inhibitor commonly used in rodents to induce retrograde degeneration of the nigrostriatal pathway, the histopathological hallmark of PD. 6-OHDA-induced degeneration is characterized by increased inflammatory mediators including cytokines, nictric oxide, and prostaglandins (Gao et al., 2008; Koprich et al., 2008) and work from our group demonstrated that TNF-dependent neuroinflammation in the substantia nigra pars compacta (SNpc) is required for 6-OHDA-mediated degeneration of nigral DA neurons (McCoy et al., 2006; McCoy et al., 2008). Therefore, we investigated the extent to which viral overexpression of RGS10 in ventral midbrain microglia attenuated their activation response in the SNpc after an intrastriatal 6-OHDA lesion and afforded protection of nigral DA neurons against 6-OHDA-induced degeneration. Under stereotaxic guidance, a unilateral intra-striatal injection of 6-OHDA was administered into the right hemisphere immediately followed by a single injection of a lentivirus encoding RGS10 or GFP (as negative control) into SNpc; importantly, the glial-selectivity of this lentiviral vector has been established in previous studies (McCoy et al., 2008; Harms et al., 2010). Three weeks after administration of the 6-OHDA and lentiviral injections we measured microglial burden by performing immunofluorescence analyses with an antibody specific for the microglial-specific marker ionized calcium-binding adaptor molecule 1 (Iba1) (Ito et al., 1998). These analyses revealed that 6-OHDA/lenti-GFP injected rats displayed robust microglia activation in SNpc (Fig. 8A and C) whereas 6-OHDA/lenti-RGS-injected rats displayed microglia activation similar to that in the unlesioned hemisphere (Fig. 8B and C). Confocal examination of RGS10 expression in brain sections immunostained with anti-RGS10 antibody confirmed that microglia (Iba1+ cells) and not DA neurons (TH+ cells) in SNpc were transduced by the lentivirus; as expected lenti-RGS10-injected rats were found to positively express the RGS10 transgene and displayed higher levels of RGS10 immunoreactivity compared to lenti-GFP-injected rats (Fig. 9A). To investigate whether the in vivo anti-inflammatory effects of microglial RGS10 gene transfer were also accompanied by neuroprotection of DA neurons, the number of TH-positive neurons in SNpc was estimated by unbiased stereology. We found that a single intranigral injection of lenti-RGS10 but not lenti-GFP given at the time of a unilateral intrastriatal 6-OHDA lesion significantly attenuated death of TH-positive neurons (Fig. 9B, C). These results directly demonstrate that microglia-specific gene transfer of RGS10 in vivo is an effective way to attenuate injury-induced microgliosis and limit inflammation-related nigral degeneration of DA neurons.
Figure 8. RGS10 gene transfer into the SNpc attenuates microgliosis in 6-OHDA-induced hemiparkinsonism in rats.

Unilateral lesion was induced by injecting 6-OHDA into the striatum of rats as described in materials and methods. Animals were stereotaxically injected with 2 uL of lentivirus expressing GFP (A) or RGS10 (B) into the substantia nigra pars compacta (SNpc). Animals were perfused 3 weeks after the lesion and brains were processed for immunohistology. Dual-labeling immunofluorescence for the microglial marker Iba1 (Alexa-594) and the dopaminergic neuron marker TH (Cy5) in the ventral midbrain of WT mice. Scale bar represents 200 μm. Insets show high magnification images of Iba1-immunoreactive microglia. C, Quantification of Iba1+ cells per field in midbrain of 6-OHDA/lenti-GFP or 6-OHDA/lenti-RGS10 rats (See Methods). *** denotes significant differences between contralateral (unlesioned) side and ipsilateral (lesioned) within the groups at p < 0.001. ### denotes significant differences between lenti-GFP and lenti-RGS10 groups at p < 0.001.
Figure 9. RGS10 gene transfer in SNpc attenuates 6-OHDA-induced hemiparkinsonism in rats.

Unilateral lesion was induced by stereotaxical injecting 20 μg of 6-OHDA into the striatum of rats and then animals were injected with lentivirus expressing GFP (n=7) or RGS10 (n=8) into the substantia nigra pars compacta (SNpc) as described in materials and methods. Animals were perfused 3 weeks after the lesion and brains were processed for immunohistology. A, Confocal immunofluorescence analyses of RGS10 (green), the microglial marker Iba1 (red) and the dopaminergic neuron marker TH (blue, pseudo color for Cy5) in the ventral midbrain. Scale bar, 10 μm. B, Tyrosine hydroxylase (TH) immunohistochemical analyses were performed after unilateral lesions were induced by a single injection of 6-OHDA (b, d) into the right striatum followed by a single injection of lenti-GFP (n=7) (b) or lenti-RGS10 (n=8) (d) into the right substantia nigra pars compacta (a,c; contralateral unlesioned side). Scale bar, 450 um. C, Unbiased stereological estimate of DA neuron number (TH-positive cells) in ipsilateral (lesioned) SNpc or the contralateral (unlesioned) side. **, *** denotes significant differences between contralateral side and ipsilateral within the groups at p < 0.01 or p < 0.001 respectively. ## denotes significant differences between lenti-GFP and lenti-RGS10 groups at p < 0.01.
Discussion
The primary mechanism by which RGS proteins are thought to participate in cell signaling events is via negatively regulation of G-protein coupled receptor (GPCR) signaling by virtue of their GTPase activating protein (GAP) activity at Gα subunits (Ross and Wilkie, 2000; Sierra et al., 2002). Although several other RGS proteins in addition to RGS10 have been shown to traffic to the nucleus (Chatterjee and Fisher, 2000; Burchett, 2003), their extra-cytoplasmic roles have remained unclear and underexplored primarily because most GPCRs are present near the cell surface (Huang and Fisher, 2009). Previously, we observed nuclear enrichment of RGS10 in microglia in response to inflammatory stimuli (Lee et al., 2008); here we provide compelling evidence that the functional significance of RGS10 in the nucleus relates to its anti-inflammatory role as a negative regulator of NF-κB. Specifically, the present study demonstrates that by limiting activation of NF-κB, a pathway known to play a central role in reprogramming gene expression during inflammatory responses and cellular stress (Karin and Ben-Neriah, 2000), RGS10 limits expression and production of pro-inflammatory cytokines that can have neurotoxic effects on vulnerable dopaminergic (DA) neurons (Fig. 10). Nigral DA neurons are exquisitively sensitive to inflammatory stimuli and in particular to soluble TNF because of their high expression of TNF receptor 1 (Aloe and Fiore, 1997; McGuire et al., 2001; Gayle et al., 2002; Carvey et al., 2005), the canonical death receptor (Tartaglia et al., 1993). In support of this, previous work from our group demonstrated that lentiviral delivery of dominant negative TNF (DN-TNF) rescued nigral DA neurons from oxidative neurotoxin-induced degeneration in rat models of parkinsonism (McCoy et al., 2006; McCoy et al., 2008; Harms et al., 2010). Importantly, our finding that lentiviral-mediated RGS10 gene transfer in vivo into microglia afforded neuroprotection against neurotoxin-induced degeneration of nigral DA neurons has therapeutic implications and suggests that it may be possible to harness the anti-inflammatory action of RGS10 as a potential neuroprotective strategy to limit inflammation-related degeneration.
Figure 10. Model for the role of RGS10 in microglia activation and dopaminergic neuron survival.
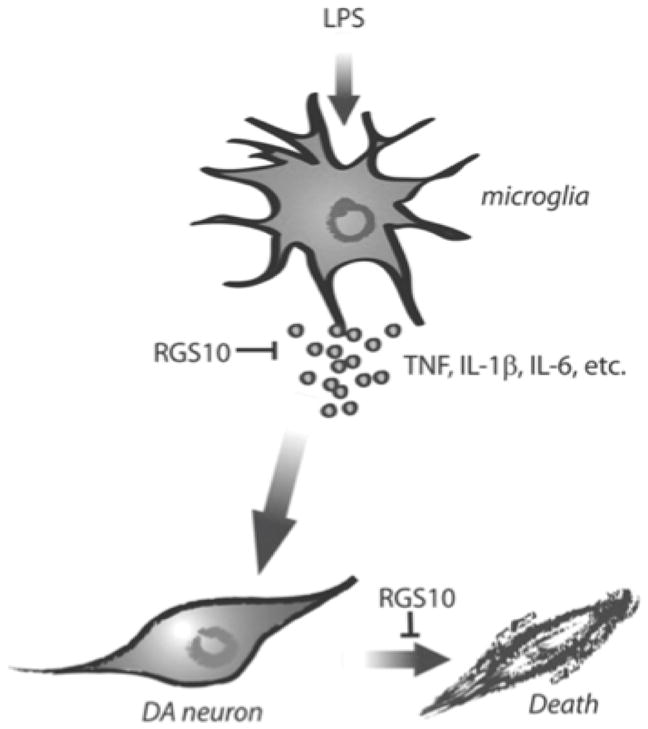
RGS10 negatively regulates NF-κB signaling and thus limits production of microglial-derived inflammatory factors with neurotoxic activities on dopaminergic neurons,; this important function in microglia protects dopaminergic neurons from inflammation-induced degeneration.
The importance of molecular regulators of glial activation that limit production of neurotoxic factors (such as TNF) that activate non-autonomous cell death pathways in vulnerable dopaminergic neurons has become increasingly recognized in recent years and this has served to advance our understanding of the underlying neuroinflammatory mechanisms that may contribute to the pathogenesis of Parkinson’s disease (PD). In addition to the studies on RGS10 presented here, another example is the unexpected finding that a transcription factor (Nurr 1) critical for dopaminergic fate determination during development (Saijo et al., 2009) also functions in microglia and astrocytes to limit production of pro-inflammatory cytokines through negative regulation of NF-κB-dependent transcription. Thus, the mechanism by which loss of Nurr 1 or loss of RGS10 compromise DA neuron survival is overproduction of glial factors toxic to DA neurons. One speculative possibility is that loss of these and perhaps other protective factors occurs with aging and leads to enhanced CNS inflammation, increased vulnerability to inflammation-induced degeneration, and increased risk for development of PD. If this is true, it may be possible to restore glial levels of these factors in the nigra via therapeutic gene transfer to protect vulnerable DA neurons.
Modulation of innate immune responses and in particular manipulation of molecular regulators of microglia activation such as RGS10 may represent a novel avenue for therapeutic intervention in the management of neurodegenerative diseases such as PD and AD. In essence, the functional outcome of shifting the phenotype of activated microglia from neurotoxic to neuroprotective will depend on whether or not the particular intervention attenuates microglia effector functions that compromise neuronal survival and accelerate neuronal death or inflicts collateral damage by compromising immune function (Wyss-Coray and Mucke, 2002). Several epidemiological studies suggest that chronic use of nonsteroidal anti-inflammatory drugs (NSAIDs) can lower risks for development of PD in humans by 46% (Chen et al., 2003; Chen et al., 2005; Samii et al., 2009). Although the exact molecular mechanisms targeted by NSAIDs to lower risk have yet to be clearly identified, they are generally thought to include attenuated production of prostaglandins which potentiate overproduction of pro-inflammatory factors by activated microglia. Indeed, the role of microglia activation and the innate immune system in neurodegenerative diseases is now supported by the recent genetic association between the human leukocyte antigen (HLA) class II gene HLA-DRA and late-onset sporadic PD in a genome-wide association study (Hamza et al., 2010). HLA genes are encoded within the human major histocompatibility complex (MHC) and form the basis for adaptive and innate immune responses. HLA-DR molecules are expressed by antigen-presenting cells (APC), including microglia in the brain and HLA-DR positive microglia are found in large numbers in post-mortem brains of PD patients (McGeer et al., 1988). Together, these findings strongly suggest there is a good deal of cross-talk between the immune system and the brain and it is likely that the aging process as well as environmental exposures and/or brain trauma may fundamentally alter this process and contribute to neurodegeneration (Lucin and Wyss-Coray, 2009). Stronger interdisciplinary approaches by neuroscientists and immunologists to elucidate the key molecular and cellular pathways that regulate neuroimmune communication and microglia effector functions in the brain will be needed and are expected to reveal novel targets for therapeutic intervention in the clinic.
Acknowledgments
We thank Kelly Ruhn, Isaac Treviño, and Jianjun Chang for animal colony maintenance and technical assistance and members of the Tansey lab for useful discussions. This work was supported by a Target Validation grant from the Michael J. Fox Foundation for Parkinson’s Research (M.G.T), a pilot grant from Emory University Parkinson’s Disease Collaborative Environmental Research Center Development Program (J-K.L) and R01NS072467-01 (M.G.T.) from the NINDS at the National Institutes of Health.
Footnotes
No Conflict of interests
References Cited
- Aloe L, Fiore M. TNF-alpha expressed in the brain of transgenic mice lowers central tyroxine hydroxylase immunoreactivity and alters grooming behavior. Neurosci Lett. 1997;238:65–68. doi: 10.1016/s0304-3940(97)00850-1. [DOI] [PubMed] [Google Scholar]
- Blasi E, Barluzzi R, Bocchini V, Mazzolla R, Bistoni F. Immortalization of murine microglial cells by a v-raf/v-myc carrying retrovirus. J Neuroimmunol. 1990;27:229–237. doi: 10.1016/0165-5728(90)90073-v. [DOI] [PubMed] [Google Scholar]
- Block ML, Hong JS. Microglia and inflammation-mediated neurodegeneration: multiple triggers with a common mechanism. Prog Neurobiol. 2005;76:77–98. doi: 10.1016/j.pneurobio.2005.06.004. [DOI] [PubMed] [Google Scholar]
- Burchett SA. In through the out door: nuclear localization of the regulators of G protein signaling. J Neurochem. 2003;87:551–559. doi: 10.1046/j.1471-4159.2003.02047.x. [DOI] [PubMed] [Google Scholar]
- Burgon PG, Lee WL, Nixon AB, Peralta EG, Casey PJ. Phosphorylation and nuclear translocation of a regulator of G protein signaling (RGS10) J Biol Chem. 2001;276:32828–32834. doi: 10.1074/jbc.M100960200. [DOI] [PubMed] [Google Scholar]
- Carvey PM, Chen EY, Lipton JW, Tong CW, Chang QA, Ling ZD. Intra-parenchymal injection of tumor necrosis factor-alpha and interleukin 1-beta produces dopamine neuron loss in the rat. J Neural Transm. 2005;112:601–612. doi: 10.1007/s00702-004-0222-z. [DOI] [PubMed] [Google Scholar]
- Chatterjee TK, Fisher RA. Cytoplasmic, nuclear, and golgi localization of RGS proteins. Evidence for N-terminal and RGS domain sequences as intracellular targeting motifs. J Biol Chem. 2000;275:24013–24021. doi: 10.1074/jbc.M002082200. [DOI] [PubMed] [Google Scholar]
- Chen H, Jacobs E, Schwarzschild MA, McCullough ML, Calle EE, Thun MJ, Ascherio A. Nonsteroidal antiinflammatory drug use and the risk of Parkinson’s disease. Annals of Neurology. 2005;59:988–989. doi: 10.1002/ana.20682. [DOI] [PubMed] [Google Scholar]
- Chen H, Zhang SM, Hernan MA, Schwarzschild MA, Willett WC, Colditz GA, Speizer FE, Ascherio A. Nonsteroidal anti-inflammatory drugs and the risk of Parkinson disease. Arch Neurol. 2003;60:1059–1064. doi: 10.1001/archneur.60.8.1059. [DOI] [PubMed] [Google Scholar]
- Choi HK, Won LA, Kontur PJ, Hammond DN, Fox AP, Wainer BH, Hoffmann PC, Heller A. Immortalization of embryonic mesencephalic dopaminergic neurons by somatic cell fusion. Brain Res. 1991;552:67–76. doi: 10.1016/0006-8993(91)90661-e. [DOI] [PubMed] [Google Scholar]
- Duke DC, Moran LB, Pearce RK, Graeber MB. The medial and lateral substantia nigra in Parkinson’s disease: mRNA profiles associated with higher brain tissue vulnerability. Neurogenetics. 2007;8:83–94. doi: 10.1007/s10048-006-0077-6. [DOI] [PubMed] [Google Scholar]
- Gao HM, Kotzbauer PT, Uryu K, Leight S, Trojanowski JQ, Lee VM. Neuroinflammation and oxidation/nitration of alpha-synuclein linked to dopaminergic neurodegeneration. J Neurosci. 2008;28:7687–7698. doi: 10.1523/JNEUROSCI.0143-07.2008. [DOI] [PMC free article] [PubMed] [Google Scholar]
- Gayle DA, Ling Z, Tong C, Landers T, Lipton JW, Carvey PM. Lipopolysaccharide (LPS)-induced dopamine cell loss in culture: roles of tumor necrosis factor-alpha, interleukin-1beta, and nitric oxide. Brain Res Dev Brain Res. 2002;133:27–35. doi: 10.1016/s0165-3806(01)00315-7. [DOI] [PubMed] [Google Scholar]
- Gold SJ, Ni YG, Dohlman HG, Nestler EJ. Regulators of G-protein signaling (RGS) proteins: region-specific expression of nine subtypes in rat brain. J Neurosci. 1997;17:8024–8037. doi: 10.1523/JNEUROSCI.17-20-08024.1997. [DOI] [PMC free article] [PubMed] [Google Scholar]
- Hamza TH, Zabetian CP, Tenesa A, Laederach A, Montimurro J, Yearout D, Kay DM, Doheny KF, Paschall J, Pugh E, Kusel VI, Collura R, Roberts J, Griffith A, Samii A, Scott WK, Nutt J, Factor SA, Payami H. Common genetic variation in the HLA region is associated with late-onset sporadic Parkinson’s disease. Nat Genet. 2010;42:781–785. doi: 10.1038/ng.642. [DOI] [PMC free article] [PubMed] [Google Scholar]
- Harms AS, Barnum CJ, Ruhn KA, Varghese S, Trevino I, Blesch A, Tansey MG. Delayed Dominant-Negative TNF Gene Therapy Halts Progressive Loss of Nigral Dopaminergic Neurons in a Rat Model of Parkinson’s Disease. Mol Ther. 2010 doi: 10.1038/mt.2010.217. [DOI] [PMC free article] [PubMed] [Google Scholar]
- Huang J, Fisher RA. Chapter 5 nuclear trafficking of regulator of g protein signaling proteins and their roles in the nucleus. Prog Mol Biol Transl Sci. 2009;86:115–156. doi: 10.1016/S1877-1173(09)86005-5. [DOI] [PubMed] [Google Scholar]
- Hunt TW, Fields TA, Casey PJ, Peralta EG. RGS10 is a selective activator of G alpha i GTPase activity. Nature. 1996;383:175–177. doi: 10.1038/383175a0. [DOI] [PubMed] [Google Scholar]
- Ito D, Imai Y, Ohsawa K, Nakajima K, Fukuuchi Y, Kohsaka S. Microglia-specific localisation of a novel calcium binding protein, Iba1. Brain Res Mol Brain Res. 1998;57:1–9. doi: 10.1016/s0169-328x(98)00040-0. [DOI] [PubMed] [Google Scholar]
- Karin M, Ben-Neriah Y. Phosphorylation meets ubiquitination: the control of NF-[kappa]B activity. Annual review of immunology. 2000;18:621–663. doi: 10.1146/annurev.immunol.18.1.621. [DOI] [PubMed] [Google Scholar]
- Koprich JB, Reske-Nielsen C, Mithal P, Isacson O. Neuroinflammation mediated by IL-1 beta increases susceptibility of dopamine neurons to degeneration in an animal model of Parkinson’s disease. J Neuroinflammation. 2008;5:8. doi: 10.1186/1742-2094-5-8. [DOI] [PMC free article] [PubMed] [Google Scholar]
- Lee JK, McCoy MK, Harms AS, Ruhn KA, Gold SJ, Tansey MG. Regulator of G-protein signaling 10 promotes dopaminergic neuron survival via regulation of the microglial inflammatory response. J Neurosci. 2008;28:8517–8528. doi: 10.1523/JNEUROSCI.1806-08.2008. [DOI] [PMC free article] [PubMed] [Google Scholar]
- Liu B, Gao HM, Wang JY, Jeohn GH, Cooper CL, Hong JS. Role of nitric oxide in inflammation-mediated neurodegeneration. Ann N Y Acad Sci. 2002;962:318–331. doi: 10.1111/j.1749-6632.2002.tb04077.x. [DOI] [PubMed] [Google Scholar]
- Lucin KM, Wyss-Coray T. Immune activation in brain aging and neurodegeneration: too much or too little? Neuron. 2009;64:110–122. doi: 10.1016/j.neuron.2009.08.039. [DOI] [PMC free article] [PubMed] [Google Scholar]
- McAlpine FE, Lee JK, Harms AS, Ruhn KA, Blurton-Jones M, Hong J, Das P, Golde TE, LaFerla FM, Oddo S, Blesch A, Tansey MG. Inhibition of soluble TNF signaling in a mouse model of Alzheimer’s disease prevents pre-plaque amyloid-associated neuropathology. Neurobiol Dis. 2009;34:163–177. doi: 10.1016/j.nbd.2009.01.006. [DOI] [PMC free article] [PubMed] [Google Scholar]
- McCoy MK, Ruhn KA, Martinez TN, McAlpine FE, Blesch A, Tansey MG. Intranigral lentiviral delivery of dominant-negative TNF attenuates neurodegeneration and behavioral deficits in hemiparkinsonian rats. Mol Ther. 2008;16:1572–1579. doi: 10.1038/mt.2008.146. [DOI] [PMC free article] [PubMed] [Google Scholar]
- McCoy MK, Martinez TN, Ruhn KA, Szymkowski DE, Smith CG, Botterman BR, Tansey KE, Tansey MG. Blocking soluble tumor necrosis factor signaling with dominant-negative tumor necrosis factor inhibitor attenuates loss of dopaminergic neurons in models of Parkinson’s disease. J Neurosci. 2006;26:9365–9375. doi: 10.1523/JNEUROSCI.1504-06.2006. [DOI] [PMC free article] [PubMed] [Google Scholar]
- McGeer EG, Klegeris A, McGeer PL. Inflammation, the complement system and the diseases of aging. Neurobiol Aging. 2005;26(Suppl 1):94–97. doi: 10.1016/j.neurobiolaging.2005.08.008. [DOI] [PubMed] [Google Scholar]
- McGeer PL, Itagaki S, Boyes BE, McGeer EG. Reactive microglia are positive for HLA-DR in the substantia nigra of Parkinson’s and Alzheimer’s disease brains. Neurology. 1988;38:1285–1291. doi: 10.1212/wnl.38.8.1285. [DOI] [PubMed] [Google Scholar]
- McGuire SO, Ling ZD, Lipton JW, Sortwell CE, Collier TJ, Carvey PM. Tumor necrosis factor alpha is toxic to embryonic mesencephalic dopamine neurons. Exp Neurol. 2001;169:219–230. doi: 10.1006/exnr.2001.7688. [DOI] [PubMed] [Google Scholar]
- Moss DW, Bates TE. Activation of murine microglial cell lines by lipopolysaccharide and interferon-gamma causes NO-mediated decreases in mitochondrial and cellular function. Eur J Neurosci. 2001;13:529–538. doi: 10.1046/j.1460-9568.2001.01418.x. [DOI] [PubMed] [Google Scholar]
- Mrak RE, Griffin WS. Glia and their cytokines in progression of neurodegeneration. Neurobiol Aging. 2005;26:349–354. doi: 10.1016/j.neurobiolaging.2004.05.010. [DOI] [PubMed] [Google Scholar]
- Pfeifer A, Ikawa M, Dayn Y, Verma IM. Transgenesis by lentiviral vectors: lack of gene silencing in mammalian embryonic stem cells and preimplantation embryos. Proc Natl Acad Sci U S A. 2002;99:2140–2145. doi: 10.1073/pnas.251682798. [DOI] [PMC free article] [PubMed] [Google Scholar]
- Puntambekar SS, Doose JM, Carson MJ. Microglia: A CNS-specific tissue macrophage. In: Lane TECM, Bergmann C, Wyss-Coray T, editors. Central Nervous System Diseases and Inflammation. 1. New York: Springer; 2008. pp. 1–12. [Google Scholar]
- Ransohoff RM, Perry VH. Microglial physiology: unique stimuli, specialized responses. Annual review of immunology. 2009;27:119–145. doi: 10.1146/annurev.immunol.021908.132528. [DOI] [PubMed] [Google Scholar]
- Ross EM, Wilkie TM. GTPase-activating proteins for heterotrimeric G proteins: regulators of G protein signaling (RGS) and RGS-like proteins. Annu Rev Biochem. 2000;69:795–827. doi: 10.1146/annurev.biochem.69.1.795. [DOI] [PubMed] [Google Scholar]
- Saijo K, Winner B, Carson CT, Collier JG, Boyer L, Rosenfeld MG, Gage FH, Glass CK. A Nurr1/CoREST pathway in microglia and astrocytes protects dopaminergic neurons from inflammation-induced death. Cell. 2009;137:47–59. doi: 10.1016/j.cell.2009.01.038. [DOI] [PMC free article] [PubMed] [Google Scholar]
- Samii A, Etminan M, Wiens MO, Jafari S. NSAID Use and the Risk of Parkinson’s Disease: Systematic Review and Meta-Analysis of Observational Studies. Drugs & aging. 2009;26:769–779. doi: 10.2165/11316780-000000000-00000. [DOI] [PubMed] [Google Scholar]
- Sawada M, Imamura K, Nagatsu T. Role of cytokines in inflammatory process in Parkinson’s disease. J Neural Transm. 2006;(Suppl):373–381. doi: 10.1007/978-3-211-45295-0_57. [DOI] [PubMed] [Google Scholar]
- Sierra DA, Gilbert DJ, Householder D, Grishin NV, Yu K, Ukidwe P, Barker SA, He W, Wensel TG, Otero G, Brown G, Copeland NG, Jenkins NA, Wilkie TM. Evolution of the regulators of G-protein signaling multigene family in mouse and human. Genomics. 2002;79:177–185. doi: 10.1006/geno.2002.6693. [DOI] [PubMed] [Google Scholar]
- Simunovic F, Yi M, Wang Y, Macey L, Brown LT, Krichevsky AM, Andersen SL, Stephens RM, Benes FM, Sonntag KC. Gene expression profiling of substantia nigra dopamine neurons: further insights into Parkinson’s disease pathology. Brain. 2009;132:1795–1809. doi: 10.1093/brain/awn323. [DOI] [PMC free article] [PubMed] [Google Scholar]
- Tansey MG, Goldberg MS. Neuroinflammation in Parkinson’s disease: its role in neuronal death and implications for therapeutic intervention. Neurobiol Dis. 2010;37:510–518. doi: 10.1016/j.nbd.2009.11.004. [DOI] [PMC free article] [PubMed] [Google Scholar]
- Tansey MG, McCoy MK, Frank-Cannon TC. Neuroinflammatory mechanisms in Parkinson’s disease: potential environmental triggers, pathways, and targets for early therapeutic intervention. Exp Neurol. 2007;208:1–25. doi: 10.1016/j.expneurol.2007.07.004. [DOI] [PMC free article] [PubMed] [Google Scholar]
- Tansey MGaW-C T. Cytokines in CNS Inflammation and Disease. In: Lane TECM, Bergmann C, Wyss-Coray T, editors. Central Nervous System Diseases and Inflammation. 1. New York: Springer; 2008. pp. 59–106. [Google Scholar]
- Tartaglia LA, Ayres TM, Wong GH, Goeddel DV. A novel domain within the 55 kd TNF receptor signals cell death. Cell. 1993;74:845–853. doi: 10.1016/0092-8674(93)90464-2. [DOI] [PubMed] [Google Scholar]
- Taylor L, Jones L, Tuszynski MH, Blesch A. Neurotrophin-3 gradients established by lentiviral gene delivery promote short-distance axonal bridging beyond cellular grafts in the injured spinal cord. J Neurosci. 2006;26:9713–9721. doi: 10.1523/JNEUROSCI.0734-06.2006. [DOI] [PMC free article] [PubMed] [Google Scholar]
- Waugh JL, Lou AC, Eisch AJ, Monteggia LM, Muly EC, Gold SJ. Regional, cellular, and subcellular localization of RGS10 in rodent brain. J Comp Neurol. 2005;481:299–313. doi: 10.1002/cne.20372. [DOI] [PubMed] [Google Scholar]
- West MJ, Slomianka L, Gundersen HJ. Unbiased stereological estimation of the total number of neurons in thesubdivisions of the rat hippocampus using the optical fractionator. Anat Rec. 1991;231:482–497. doi: 10.1002/ar.1092310411. [DOI] [PubMed] [Google Scholar]
- Wyss-Coray T, Mucke L. Inflammation in neurodegenerative disease--a double-edged sword. Neuron. 2002;35:419–432. doi: 10.1016/s0896-6273(02)00794-8. [DOI] [PubMed] [Google Scholar]