Abstract
We present a depth-resolved Image Mapping Spectrometer (IMS) which is capable of acquiring 4D (x, y, z, λ) datacubes. Optical sectioning is implemented by structured illumination. The device’s spectral imaging performance is demonstrated in a multispectral microsphere and mouse kidney tissue fluorescence imaging experiment. We also compare quantitatively the depth-resolved IMS with a hyperspectral confocal microscope (HCM) in a standard fluorescent bead imaging experiment. The comparison results show that despite the use of a light source with four orders of magnitude lower intensity in the IMS than that in the HCM, the image signal-to-noise ratio acquired by the IMS is 2.6 times higher than that achieved by the equivalent confocal approach.
1. Introduction
Fluorescence microscopy is an indispensable tool in biological research and has been used extensively in widespread applications [1]. The continuing development of fluorescent probes bringing new spectral characteristics and new functional properties for cellular labeling has widened the possibilities of what biological features can be measured by a microscope. Taking full advantage of their properties, however, often requires imaging systems have a spectral resolving power to discriminate those fluorescent probes which have significant spectral overlaps.
Hyperspectral imaging is a hybrid imaging modality that combines the advantages of traditional imaging cameras and spectrometers [2]. It measures sample’s spatial and spectral information, and constructs a 3D (x, y, λ) datacube for spectral unmixing analysis [3]. However, most hyperspectral imagers are scanning-based systems. They either scan in the spatial domain, e.g. hyperspectral confocal microscope [4] and slit-scanning microscope [5], or scan in the spectral domain, e.g., liquid crystal tunable filters or acoustic optic tunable filters [6]. Because scanning-based systems cannot collect light from all voxels of the datacube in parallel, there is a loss of light throughput by a factor of N when measuring N scan elements. To overcome this limitation, snapshot hyperspectral imagers such as Computed Tomography Imaging Spectrometer (CTIS) [7], Coded Aperture Snapshot Spectral Imager (CASSI) [8] and Image-Replicating Imaging Spectrometer (IRIS) [9] have been developed. Although the spectral imaging capabilities of these snapshot hyperspectral imagers have been demonstrated, they suffer many problems, e.g., CTIS and CASSI require extensive computational cost, while IRIS is limited in the number of spectral bands which can acquire at high spatial resolution.
The Image Mapping Spectrometer (IMS) is a novel snapshot hyperspectral imager that is developed for full-throughput measurement of spectrally resolved scenes [10–12]. It replaces the regular camera in a digital imaging system, allowing one to add spectrum acquisition capability to a variety of imaging modalities, such as microscopy [10,11] and endoscopy [12]. The operation of the IMS is based on the image mapping principle [10]. Briefly, a custom-fabricated optical component – termed image mapper – is utilized to remap a sample’s 3D (x, y, λ) datacube onto a 2D CCD camera, so that a sample’s spatial and spectral information can be measured in parallel. Since no scanning is employed, the IMS features high-speed (currently up to 7.2 fps [12]) (x, y, λ) datacube acquisition without sacrificing spatial and spectral resolution. In addition, since the IMS is a direct imaging device, little computational cost is required to reconstruct a (x, y, λ) datacube.
Previous IMS-based experiments were implemented in wide-field imaging, but for imaging volumetric samples such as biological tissues, wide-field measurements suffer from spatial-spectral crosstalk due to light contributed from out-of-focus layers. This crosstalk decreases the ability to resolve all voxels in the datacube and compromises spectral unmixing capability. To address this problem, here we add optical sectioning capability to the IMS with structured illumination (SI). By acquiring three (x, y, λ) datacubes I1, I2and I3with 2π/3phase-shifted sinusoid illumination patterns and subsequent demodulation, the IMS achieves ~1 μm axial resolution for the acquired spectral channel images.
Although the throughput of the IMS is halved by the added sectioning hardware (see Section 2), high contrast depth-resolved spectral channel images were still acquired in a mouse kidney tissue fluorescence imaging experiment (see Section 3). In addition, due to the added sectioning capability, a 4D (x, y, z, λ) datacube is also successfully acquired by the IMS. The 4D imaging results demonstrate that no artifacts are introduced by integrating traditional 3D (x, y, z) imaging with IMS’ multispectral imaging.
To show the advantages of depth-resolved IMS over other commercially available multispectral imagers, we quantitatively compare the depth-resolved IMS with a hyperspectral confocal microscope (HCM) (Zeiss Meta 510) in the context of photon collection and image signal-to-noise ratio (SNR) (see Section 4). The experimental results indicate that, at a given frame rate, the depth-resolved IMS surpasses the corresponding HCM approach 130 times in the photon collection, and 2.6 times in the image SNR respectively.
2. System layout
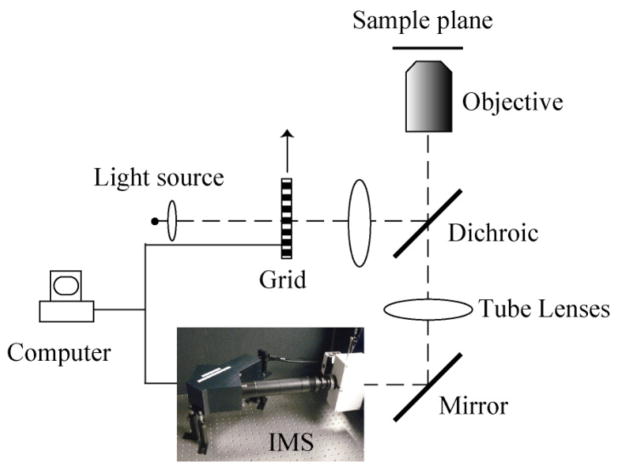
The schematic of the depth-resolved IMS is shown in Fig. 1. The IMS is coupled to a side image port of an inverted microscope (Axio Observer, Zeiss). The optical design and layout for the IMS is detailed in [12]. Here the IMS is assembled in a robust ruggedized enclosure so that the device is stable and functional in ambient room light. The 3D (x, y, λ) datacube that the IMS acquires is of size 350 × 350 × 46. The spatial sampling and spectral sampling are balanced in the IMS design so that over 90% IMS’ camera pixels can be effectively utilized [12]. When a Zeiss Plan-Apochromat 63 × oil immersion objective (NA = 1.4) is used on the microscope, the IMS achieves ~0.44 μm lateral spatial resolution in the 160 μm × 160 μm field-of-view (FOV).
Fig. 1.
Depth-resolved IMS with SI.
The sample is illuminated by a 120W X-cite arc lamp. Structured illumination is implemented by placing a 10 lp/mm Ronchi ruling grid (NT38-258, Edmund Optics) at a conjugate plane of the microscope’s sample plane in the epi-illumination optical path. The grid is mounted on a ceramic servo motor stage (ALIO industries, P/N: AI-HR4-10000E-XY). The IMS is synchronized with the movement of the grid for automatic acquisition. The depth-resolved (x, y, λ) datacube I is acquired from three (x, y, λ) datacubes I1, I2and I3which are captured with 2π/3 phase shifted sinusoid illumination patterns by the demodulation algorithm [13,14]:
| (1) |
The axial resolution of depth-resolved IMS (with a 63 × oil immersion objective on the microscope) was measured by imaging sub-resolution point sources – green fluorescent beads (Dia = 175 nm, Invitrogen PS-Speck Microscope Point Source Kit). By scanning the sample in the z axis, the axial PSF was measured at the wavelength 530 nm (see the red line in Fig. 2). To provide a baseline reference, the theoretical axial PSF at this wavelength is also shown as a blue dashed line in Fig. 2. The axial resolution resz is calculated as the full-width-half-maximum (FWHM) of the measured axial PSF, which is:
| (2) |
Fig. 2.
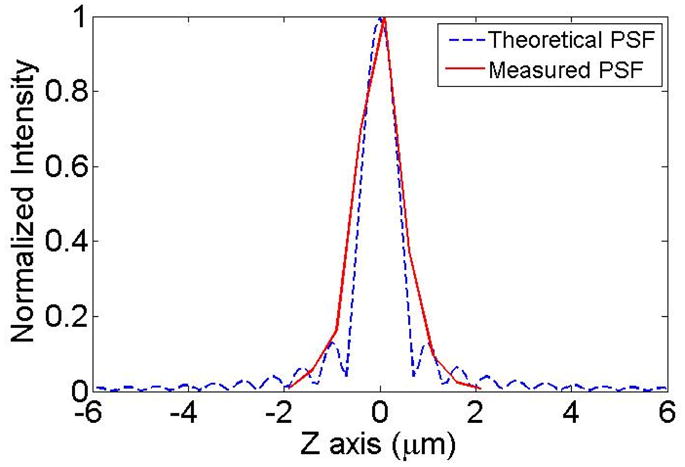
Axial PSF measurement in the depth-resolved IMS.
This imaging result proves that the depth-resolved IMS has similar sectioning capability as regular wide-field imaging modalities with SI. Although the raw intensity images are remapped and reconstructed in the IMS, it does not reduce the effectiveness of SI in allowing depth-resolved imaging.
3. Multispectral fluorescence microscopic imaging with depth-resolved IMS
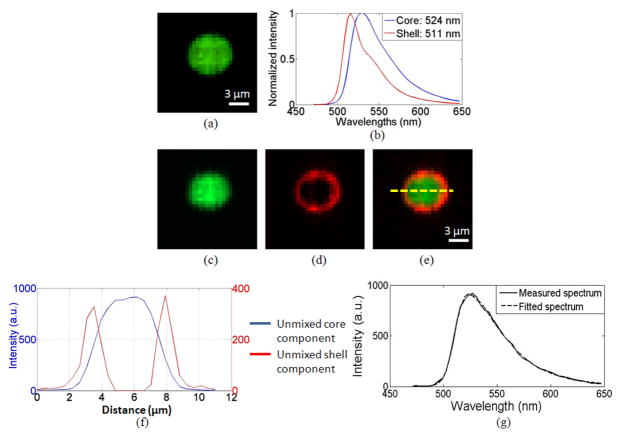
To demonstrate the IMS’ sectioning and spectral imaging capabilities in fluorescence microscopy, we imaged a multispectral microsphere (FocalCheck test slide #2, Invitrogen). The diameter of the fluorescent microsphere is 6 μm. Its core and shell are stained with two different fluorescent dyes: The fluorescence emitted from the core has a peak emission at 524 nm; while the fluorescence emitted from the shell has a peak emission at 511 nm (See Fig. 2(b). The core and shell reference spectra were acquired from single dye stained control sample on the same test slide). A Chroma filter set 41015 (485 LP) was used to separate fluorescence from excitation light.
The spectral imaging results from a sectioned depth layer are shown in Fig. 3. Due to significant spectral overlaps of the dyes, in the panchromatic display of the acquired datacube (Fig. 3(a)), the core and shell cannot be discriminated. After applying a linear spectral unmixing algorithm [15] to the acquired datacube, the fluorescent emissions from core (peak at 524 nm) and shell (peak at 511 nm) are successfully separated (Fig. 3(c)–(e)). The spectral unmixing accuracy is evaluated at the pixel level near the separating interface of the two fluorophores. The result shows that the fitted spectrum matches well with the measured spectrum (see Fig. 3(g)). In addition, a dashed line is drawn across the bead section (Fig. 3(e)) to show the intensity changes of two fluorescent dyes (Fig. 3(f)). No fluorescence emitted from the shell is detected in the core. This demonstrates the sectioning and spectral imaging capabilities of depth-resolved IMS.
Fig. 3.
Spectral imaging of a sectioned depth layer of a fluorescent microsphere by depth-resolved IMS. (a) Panchromatic display of acquired datacube. (b) The spectra of the core and ring of the microsphere. (c) – (d) Pseudo-colored core and ring components after spectral unmixing. (e) A merged image of (c) and (d). (f) Intensity profile of two fluorescent dyes across the microsphere section. (g) Measured spectrum vs. fitted spectrum at the interface of the two fluorophores.
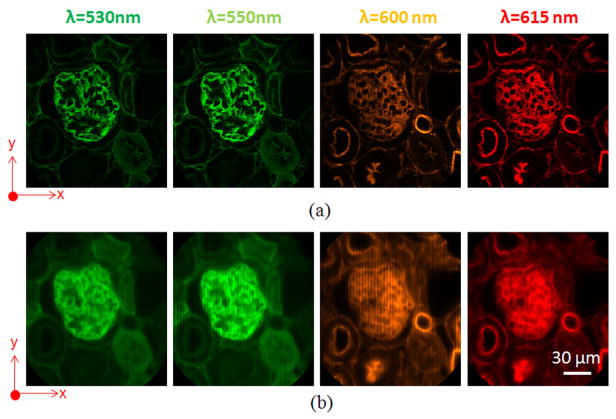
Next, we imaged a mouse kidney tissue section with a combination of fluorescent dyes. In the sample, the glomeruli and convoluted tubules were stained with Alexa Fluor 488 (exc: 493 nm, emi: 516 nm), and the filamentous actin was stained with Alexa Fluor 568 (exc: 578 nm, emi: 604 nm). Chroma filter set 61001 (DAPI/FITC/PI) was used to separate fluorescence from excitation light. The integration time for each phase image was 0.1 sec. Selected spectral channel images are shown in Fig. 4(a). For comparison, the same FOV was also imaged by the IMS in wide-field imaging and shown in Fig. 4(b). Comparing Fig. 4(a) with Fig. 4(b), the image contrast acquired by the depth-resolved IMS has been significantly increased due to reduced spatial-spectral crosstalk.
Fig. 4.
Spectral channel images of mouse kidney tissue section acquired by (a) depth-resolved IMS, and (b) IMS under wide-field imaging.
To evaluate the 4D (x, y, z, λ) imaging performance of depth-resolved IMS, the mouse kidney tissue section was imaged along the z axis with 1 μm step. The captured 4D (x, y, z, λ) datacube is of size 350 × 350 × 35 × 46, and shown at four selected wavelengths in Fig. 5 (see Media 1 for the rotation view of (x, y, z) datacubes at four selected wavelengths, and see Media 2 for a scan through of all acquired wavelengths). The x–y cross section views shown in Fig. 5 are taken at the plane with z = 15 μm, and the x–z cross section views are taken at the plane with y = 80 μm. Due to the added sectioning capability, the hollow structure of micro-tubules and filamentous actin is unambiguously revealed by the IMS. This 4D imaging result proves that no artifacts are introduced by integrating traditional 3D (x, y, z) imaging with IMS’ multispectral imaging,
Fig. 5.
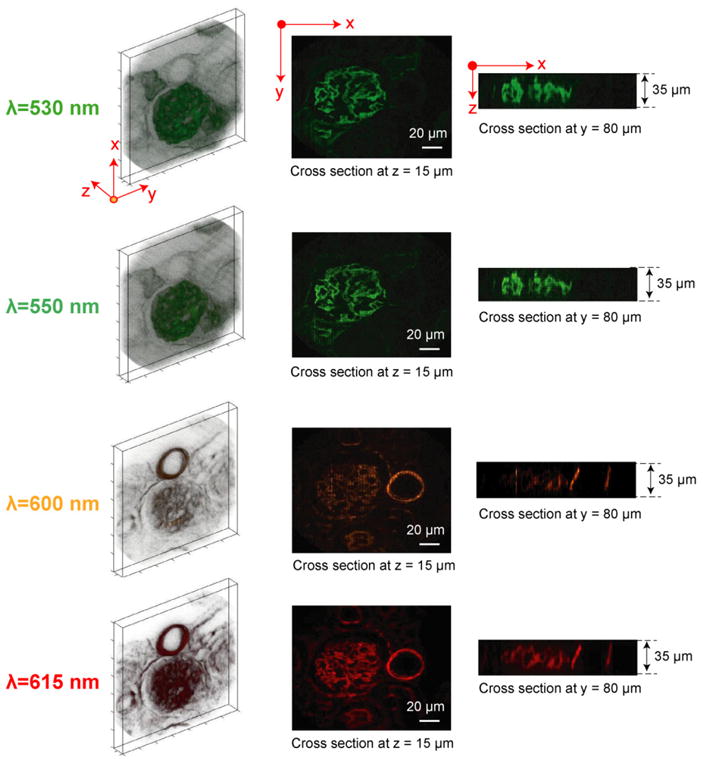
(Media 1 and Media 2) 4D (x, y, z, λ) imaging of a mouse kidney tissue section by the depth-resolved IMS. The glomeruli and convoluted tubules were stained with Alexa Fluor 488 and the filamentous actin was stained with Alexa Fluor 568. The acquired 4D (x, y, z, λ) datacube is of size 350 × 350 × 35 × 46. A total of four out of 46 wavelength (x, y, z) datacubes are shown.
4. Quantitative comparison between the depth-resolved IMS and a hyperspectral confocal microscope
Since the IMS has the sectioning capability due to the implementation of SI, here we quantitatively compare it with a commercially available hyperspectral confocal microscope (HCM) (Zeiss Meta 510) in a depth-resolved fluorescence imaging experiment.
Although the IMS and HCM have similar functionality, technically they behave very differently both at light collection and illumination side. At the light collection side, the IMS is a parallel acquisition system – the spectral information of all spatial sampling points is collected simultaneously in the FOV; while the HCM is a scanning-based system – the spectral information of spatial points is collected in sequence. The HCM’s scanning mechanism causes a severe trade-off between the number of photons collected at each spatial sampling pixel and the whole frame acquisition time – the faster the imager scans, the shorter dwelling time a pixel can have. To some extent, a HCM can compensate this throughput loss at the illumination side by focusing a high-power laser onto the sample. The illumination irradiance in the HCM is usually several orders of magnitude higher than that in the IMS. However, the high illumination irradiance may cause serious photo-damage and photo-toxicity, which is of a particular concern in live cell imaging experiments [16,17]. Once the fluorophores have been boosted to their saturation excitation state [18] – a situation commonly reached by existing confocal systems – even the method of using high power laser falters because the fluorescent emission rate could not be further increased (see the discussion in Section 4.3).
Additionally, the approaches that the IMS and HCM adopt to achieve optical sectioning are also different. Whereas HCM gates the out-of-focus light by a physical pinhole prior to detection, IMS with SI rejects out-of-focus light by computational demodulation after detection. Thus the image noise level acquired under SI is usually higher than that acquired in the HCM.
To provide a quantitative comparison between the IMS and HCM, a standard fluorescent bead imaging experiment was implemented. Since the two imaging modalities use different photon detectors – the IMS uses an interline CCD camera (Imperx, P/N: IPX-16M3-L) while the HCM uses a photomultiplier tube (PMT) array, we first calibrated the photon detector’s gain for each imaging modality (Section 4.1). Then, we measured the maximum number of photons that can be collected from a sectioned depth layer when two imaging modalities were operated at a given frame rate (Section 4.2). The illumination power (Arc lamp for the IMS, Argon laser for the HCM) was maximized in both setups. We also investigated whether the HCM can compensate its scanning-caused throughput loss by using a more powerful laser source in Section 4.3. Since noise amplification occurs in SI measurement, SNR can be a more useful quantity to compare than collected photon count. Thus, we estimated the noise level in the spectral channel images acquired by the depth-resolved IMS and HCM, and compared the two imaging modalities in the context of acquired image SNR (Section 4.4).
4.1 Calibration of photon detector’s gain in the IMS and HCM
For a digital imaging system, the signal Sc one acquires from an image is in the unit of counts. To calculate from this quantity the actual number of detected photons Sp, we define the detector’s gain as the conversion relation:
| (3) |
Note that the detector’s gain defined here is not necessarily the same thing as the internal gain value for a PMT, as it includes the amplifier gain and analog-to-digital conversion factor.
For shot noise limited systems, the measured image noise Nc (in counts) in the IMS’ CCD camera and HCM’ PMT are:
| (4) |
where σC is photon noise standard deviation in units of counts, while σp is the photon noise in units of photons. There is a factor 1.21/2 between the measured image noise Nc,HCM and photon noise σc due to the fact that the PMT is working in the analog mode [19].
Since photon noise σp obeys Poissonian statistics:
| (5) |
Combining Eq. (4) and Eq. (5), we have:
| (6) |
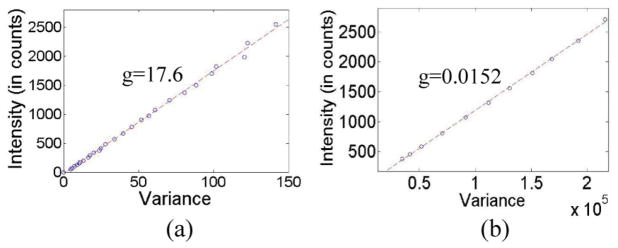
Equation (6) indicates that there is a linear relationship between the square of image noise (termed signal variance) and image signal level Sc with a slope equal to 1/g in IMS imaging while 1.2/g in HCM imaging.
To experimentally measure the IMS and HCM detector gains, we mounted an integration sphere (FOIS-1, Ocean Optics) on the microscope’s sample stage. The integration sphere was illuminated by a halogen lamp source. The uniform fields were imaged by the IMS and HCM respectively. Specific detector gain settings were chosen on the two modalities based on the criteria that full dynamic range was reached in the subsequent fluorescent bead imaging experiment (Section 4.2). By applying a linear regression to the variables and at Sc different illumination intensities (see Fig. 6), the IMS and HCM detector’s gains are obtained:
| (7) |
Fig. 6.
Signal variance vs. Intensity in (a) IMS and (b) HCM.
4.2 Measurement of collected photons in a standard fluorescent bead imaging experiment by the depth-resolved IMS and HCM
In the comparison experiment, a standard green fluorescent bead (Diameter = 2 μm, emi peak: 516 nm) sample was chosen to be imaged by both modalities. Since these fluorescent beads are photo-stable [20], no photobleaching is expected to be observed in the present study. The comparison experiment concept is shown in Fig. 7. A spatial depth layer (x, y, λ) of a fluorescent bead is acquired by SI in the depth-resolved IMS, and by pinhole filtering in the HCM. Subsequently, this depth-resolved spatial layer is dispersed and imaged into the spectral channels with nominal wavelengths λ1, λ2··· λn. Since the spectral channel λm = 516 nm is close to the peak of bead’s fluorescent emission and maximum of detectors’ quantum efficiency curve, it is chosen as the representative in the following comparisons.
Fig. 7.
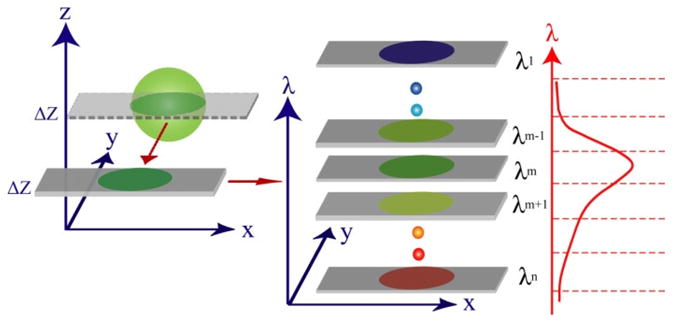
Experimental design concept for comparison study.
The depth-resolved IMS used a Chroma filter set 41015 (exc: 450/50 nm, emi: 485nm LP) to separate fluorescence from excitation light. The HCM excited the sample with an Argon laser (488 nm), and the fluorescence was collected by the same Zeiss objective (63 ×/NA = 1.40) that was used for the IMS. Lambda acquisition mode (8 parallel spectral acquisition channels with spectral bin width ~10 nm) was chosen on the HCM’s operation software. The HCM’s pinhole size was set to be 1.26 Airy disks so that the sectioning thickness (~0.9 μm) was close to that of the depth-resolved IMS. The imaging parameters used in the comparison experiment are summarized in Table 1.
Table 1.
Imaging Parameters for Depth-resolved IMS and HCM in Comparison Experiment
| Depth-resolved IMS
|
HCM
|
|
|---|---|---|
| T: Frame time to acquire a sectioned depth layer | 983 ms (327 ms for a phase image) | 983 ms |
| t: Pixel exposure (dwelling) time | 983 ms | 1.6 μs |
| M × M: Frame sampling | 350 × 350 | 512 × 512 |
| Δλ: Spectral bin width | ~3.5 nm | ~10 nm |
| Δz: Sectioning thickness | ~1.08 μm | ~0.9 μm |
Note that in the depth-resolved IMS, the pixel exposure time is equal to the frame time due to the parallel acquisition of the IMS (although the illumination intensity is halved due to the grid pattern under SI); while in the HCM, the pixel dwelling time is equal to the division of the frame time to the frame sampling minus scanning time due to the mechanical scanning across the field. To cancel out the differences in frame sampling, spectral bin width (assuming spectral flatness over both bin widths), and sectioning thickness between the two modalities, a signal scaling factor is calculated for the depth-resolved IMS with respect to the HCM by:
| (8) |
In Eq. (8), the frame sampling is included in the signal scaling factor because in the HCM imaging one can increase the pixel dwelling time by scanning a smaller area.
The fluorescence emitted by a bead was measured by summing all the pixel intensities (in counts) at the location of the bead. A total of 20 fluorescent beads were measured by the depth-resolved IMS and HCM respectively. (see Fig. 8). The mean fluorescent signals of beads measured by the depth-resolved IMS are SC,IMS = 4.87 ×10³ in counts; while those measured by the HCM are SC,HCM = 4.84×10⁴ in counts. By converting the measured signal counts to photons and scaling the signal with factor L, the ratio of photons collected by the depth-resolved IMS to the HCM at the given frame rate is:
| (9) |
Fig. 8.
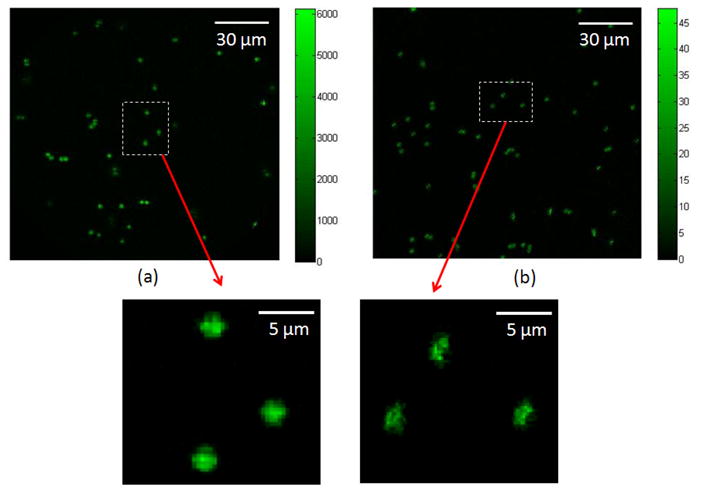
(a) Depth-resolved IMS imaging vs. (b) HCM imaging in a standard fluorescent bead imaging experiment. The color bar is in the unit of converted photons from image intensity counts.
Note that the photon collection ratio calculated in Eq. (9) is consistent with previous studies [21], which estimate the peak signal in wide-field deconvolution microscopy is normally around 30,000 photons/pixel while in point-scanning confocal microscopy it is around 20 – 100 photons/pixel. Since the throughput is halved in the depth-resolved IMS setup due to the implementation of SI, the photon collection ratio r calculated in Eq. (9) is smaller than the result comparing wide-field deconvolution microscopy with confocal microscopy.
4.3 Illumination irradiance in the depth-resolved IMS and HCM
In our microscope setups, the illumination power (Arc lamp for the IMS, Argon laser for the HCM) was maximized for both depth-resolved IMS and HCM. To show the difference between the two modalities at the illumination side, we calculate the illumination irradiance on the microscope stage. In the HCM imaging, the power of the 488 nm excitation laser on the sample plane was measured to be 0.32mW. Assuming the illumination power is focused onto a point-spread-function (PSF), the size of which is ~0.44 μm, the illumination irradiance is approximately:
| (10) |
In the depth-resolved IMS imaging, a total of 40 mW illumination power was measured; however, the illumination area is over the entire microscope objective’s FOV (Dia ~400 μm). Thus the illumination irradiance is approximately
| (11) |
The above results indicate that, at the illumination side, HCM can achieve much higher illumination irradiance than the IMS. This approach is usually adopted by the HCM to compensate its scanning-caused throughput loss at the light collection side. However, the high illumination irradiance may cause serious photodamage and phototoxicity, especially in live cell imaging experiments. Since the generation rate of reactive oxygen species (ROS) – the chemical radical suggested as the main source of photodamage and phototoxicity – has a nonlinear relationship with the illumination irradiance [22], the differences between short exposure of high-intensity light (as in the HCM imaging) and continuous exposure to much lower light level (as in the IMS imaging) may yield important differences in the photodamage and phototoxicity in living cells [21]. This fact makes the IMS better suited than the HCM in live cell imaging applications because the light-induced perturbation is minimized.
To investigate whether the photon collection ratio in Eq. (9) can be reduced if HCM use a more powerful laser source than the current setup, we measured the emissions of a fluorescent bead at different excitation laser powers (see Fig. 9). The maximal number of photons that the fluorophore can emit before reaching its saturation state [18] is calculated by fitting an exponential curve I =a − ae−bP to the measured (I is the measured fluorescence signaldata and P is the excitation laser power). The fitting result shows the decay coefficient b is equal to 2.61 mW−1. The signal ratio of the fluorophore at the laser power P= ∞ P = 0.32 mW to is thus obtained:
| (12) |
Fig. 9.
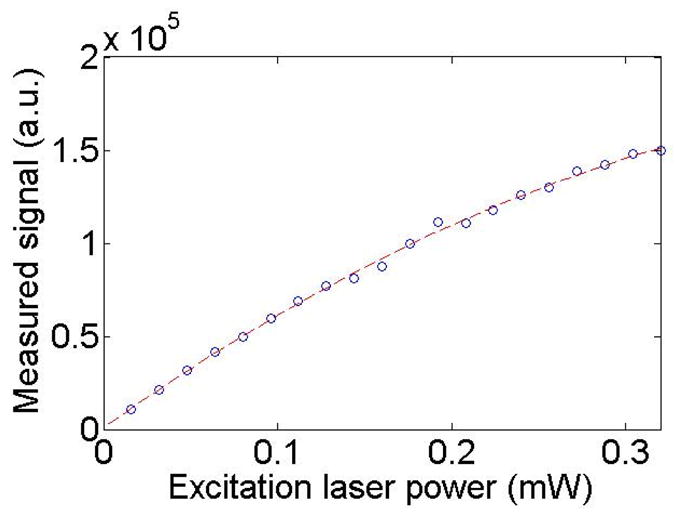
Excitation laser power vs. Measured signal in HCM imaging.
Consequently, if the HCM uses a more powerful laser source in the presented comparison study, the measured photons by the depth-resolved IMS still remains:
| (13) |
times higher than what can be measured by the HCM.
4.4 Noise level estimate and image S/N comparison
Here we consider both systems to be shot noise limited. In HCM imaging, the out-of-focus light is rejected prior to the detection, so the image noise is mainly contributed by the photon noise from the sectioned depth layer. Thus the image SNR for a sectioned fluorescent bead in the HCM imaging is:
| (14) |
In Eq. (14), Sp,HCM is the fluorescent signal from a sectioned bead depth layer and is calculated in Eq. (9).
In the depth-resolved IMS imaging, the out-of-focus light is rejected after detection, so that the image noise is contributed by the photon noise both from in-focus and out-of-focus depth layers. To measure the actual noise in the depth-resolved IMS imaging, we captured 1000 time-sequenced (x, y, z, λ, t) datacubes for the same fluorescent bead sample. Then the mean fluorescent intensity Ī and its standard deviation σI at a bead spatial sampling point (x1, y1, z1) in spectral channel λ = 516 nm are calculated as:
| (15) |
The measured actual noise σI is 4.78 times higher than the sectioned layer’s photon noise . Assuming the ratio is the same for all spatial sampling points (x, y, z) at the bead location, the image SNR for a sectioned fluorescent bead in the IMS imaging is estimated to be:
| (16) |
where Sp,IMS is the fluorescent signal from a sectioned bead depth layer and is calculated in Eq. (9). L is the signal scaling factor defined in Eq. (8).
By comparing Eq. (14) with Eq. (16), we have following conclusions: at a frame rate of ~1 fps, the image SNR acquire by the depth-resolved IMS is
| (17) |
times higher than that acquired by the hyperspectral confocal approach. Note that this result is also suggested by Fig. 8.
5. Conclusions
In this paper, we present a depth-resolved IMS which is capable of acquiring 4D (x, y, z, λ) datacubes. By implementing structured illumination, the IMS has the same sectioning capability as the regular wide-field imaging modalities but with additional spectral resolving power. The 4D imaging of a mouse kidney tissue section proves that no artifacts are introduced by integrating traditional 3D (x, y, z) imaging with IMS’s multispectral imaging.
The depth-resolved IMS not only provides high-resolution sectioned (x, y, λ) datacubes, but its light collection capability surpasses that of an equivalent confocal microscope by over two orders of magnitude. This is achieved despite the use of a lower power excitation source in the IMS measurements relative to the HCM’s argon laser, a fact that is of value in the live cell imaging because the light-induced photodamage and phototoxicity can be minimized. Note that the presented comparison between depth-resolved IMS and HCM was implemented under one-photon excitation. For two-photon excitation microscopy (TPEM), previous studies have shown that the in-focus light collection efficiency of TPEM is comparable to the confocal pinhole filtering approach [23]. So even if the pinhole filtering in the HCM is replaced by the TPEM, the depth-resolved IMS is still expected to have an edge on the photon collection.
SI is an effective way to add the sectioning capability to the IMS, especially due to its easy integration with the IMS on a standard microscope setup. However, under SI the out-of-focus light still uses the detector’s dynamic range and thus contributes to the shot noise, so that the acquired image noise level is usually higher than for HCM, a fact that decreases the advantages of the IMS at the light collection side. However, in the presented study, the acquired image SNR by the depth-resolved IMS is still ~2.6 times higher than that acquired by the HCM. For the imaging applications in which the out-of-focus light dominates the detector’s dynamic range, the alternative implementation of selective plane illumination [24] with the IMS may provide better image contrast due to the illumination’s intrinsic sectioning capability.
In addition, in the comparison both IMS and HCM are considered to be shot noise limited because the detectors’ full dynamic range is used. Generally speaking, the readout noise in the CCD camera (e.g., ~16 electrons in the IMS’ camera) is higher than that in the HCM’s PMT (< 1 electron). For low light imaging experiments, the CCD camera’s relatively high readout noise may become a concern. However, in the recently developed scientific CMOS (sCMOS) cameras [25], readout noise has been significantly reduced to less than 2 electrons even at very high frame rate (100 fps). Incorporation of such cameras into the IMS will not only increase IMS’ acquisition speed, but also provide a background noise level comparable to that in HCM imaging.
Supplementary Material
Acknowledgments
This work is supported by the National Institute of Health under Grant No. R21EB009186 and R21EB011598.
References and links
- 1.Lichtman JW, Conchello JA. Fluorescence microscopy. Nat Methods. 2005;2(12):910–919. doi: 10.1038/nmeth817. [DOI] [PubMed] [Google Scholar]
- 2.Hiraoka Y, Shimi T, Haraguchi T. Multispectral imaging fluorescence microscopy for living cells. Cell Struct Funct. 2002;27(5):367–374. doi: 10.1247/csf.27.367. [DOI] [PubMed] [Google Scholar]
- 3.Zimmermann T, Rietdorf J, Pepperkok R. Spectral imaging and its applications in live cell microscopy. FEBS Lett. 2003;546(1):87–92. doi: 10.1016/s0014-5793(03)00521-0. [DOI] [PubMed] [Google Scholar]
- 4.Raicu V, Stoneman MR, Fung R, Melnichuk M, Jansma DB, Pisterzi LF, Rath S, Fox M, Wells JW, Saldin DK. Determination of supramolecular structure and spatial distribution of protein complexes in living cells. Nat Photonics. 2009;3(2):107–113. [Google Scholar]
- 5.Kumazaki S, Hasegawa M, Ghoneim M, Shimizu Y, Okamoto K, Nishiyama M, Oh-Oka H, Terazima M. A line-scanning semi-confocal multi-photon fluorescence microscope with a simultaneous broadband spectral acquisition and its application to the study of the thylakoid membrane of a cyanobacterium Anabaena PCC7120. J Microsc. 2007;228(Pt 2):240–254. doi: 10.1111/j.1365-2818.2007.01835.x. [DOI] [PubMed] [Google Scholar]
- 6.Morris HR, Hoyt CC, Treado PJ. Imaging spectrometers for fluorescence and Raman microscopy - acoustooptic and liquid-crystal tunable filters. Appl Spectrosc. 1994;48(7):857–866. [Google Scholar]
- 7.Ford BK, Volin CE, Murphy SM, Lynch RM, Descour MR. Computed tomography-based spectral imaging for fluorescence microscopy. Biophys J. 2001;80(2):986–993. doi: 10.1016/S0006-3495(01)76077-8. [DOI] [PMC free article] [PubMed] [Google Scholar]
- 8.Cull CF, Choi K, Brady DJ, Oliver T. Identification of fluorescent beads using a coded aperture snapshot spectral imager. Appl Opt. 2010;49(10):B59–B70. doi: 10.1364/AO.49.000B59. [DOI] [PubMed] [Google Scholar]
- 9.Gorman A, Fletcher-Holmes DW, Harvey AR. Generalization of the Lyot filter and its application to snapshot spectral imaging. Opt Express. 2010;18(6):5602–5608. doi: 10.1364/OE.18.005602. [DOI] [PubMed] [Google Scholar]
- 10.Gao L, Kester RT, Tkaczyk TS. Compact image slicing spectrometer (ISS) for hyperspectral fluorescence microscopy. Opt Express. 2009;17(15):12293–12308. doi: 10.1364/oe.17.012293. [DOI] [PMC free article] [PubMed] [Google Scholar]
- 11.Gao L, Kester RT, Hagen N, Tkaczyk TS. Snapshot image mapping spectrometer (IMS) with high sampling density for hyperspectral microscopy. Opt Express. 2010;18(14):14330–14344. doi: 10.1364/OE.18.014330. [DOI] [PMC free article] [PubMed] [Google Scholar]
- 12.Kester RT, Bedard N, Gao L, Tkaczyk TS. Real-time snapshot hyperspectral imaging endoscope. J Biomed Opt. 2011;16(5):056005. doi: 10.1117/1.3574756. [DOI] [PMC free article] [PubMed] [Google Scholar]
- 13.Neil MAA, Juskaitis R, Wilson T. Method of obtaining optical sectioning by using structured light in a conventional microscope. Opt Lett. 1997;22(24):1905–1907. doi: 10.1364/ol.22.001905. [DOI] [PubMed] [Google Scholar]
- 14.Karadagli3 D, Wilson T. Image formation in structured illumination wide-field fluorescence microscopy. Micron. 2008;39(7):808–818. doi: 10.1016/j.micron.2008.01.017. [DOI] [PubMed] [Google Scholar]
- 15.Zimmermann T. Spectral imaging and linear unmixing in light microscopy. In: Scheper T, editor. Advances in Biochemical Engineering Biotechnology. Springer; 2005. [DOI] [PubMed] [Google Scholar]
- 16.Hopt A, Neher E. Highly nonlinear photodamage in two-photon fluorescence microscopy. Biophys J. 2001;80(4):2029–2036. doi: 10.1016/S0006-3495(01)76173-5. [DOI] [PMC free article] [PubMed] [Google Scholar]
- 17.Xiao J. Single-molecule imaging in live cells. In: Hinterdorfer P, Oijen AV, editors. Handbook of Single-Molecule Biophysics. Springer; 2009. [Google Scholar]
- 18.Lakowicz JR. Principles of fluorescence spectroscopy. 3. Springer; 2006. [Google Scholar]
- 19.Photonics H. Photomultiplier Tubes: Basics and Applications. 2. 1999. Characteristics of Photomultiplier Tubes; p. 71. [Google Scholar]
- 20.The Molecular Probes Handbook. Invitrogen, Inc; [Google Scholar]
- 21.Shaw PJ. Comparison of widefield/deconvolution and confocal microscopy for three-dimensional imaging. In: Pawley JB, editor. Handbook of Biological Confocal Microscopy. 3. Springer; 2006. [Google Scholar]
- 22.Dixit R, Cyr R. Cell damage and reactive oxygen species production induced by fluorescence microscopy: effect on mitosis and guidelines for non-invasive fluorescence microscopy. Plant J. 2003;36(2):280–290. doi: 10.1046/j.1365-313x.2003.01868.x. [DOI] [PubMed] [Google Scholar]
- 23.Sako Y, Sekihata A, Yanagisawa Y, Yamamoto M, Shimada Y, Ozaki K, Kusumi A. Comparison of two-photon excitation laser scanning microscopy with UV-confocal laser scanning microscopy in three-dimensional calcium imaging using the fluorescence indicator Indo-1. J Microsc. 1997;185(Pt 1):9–20. doi: 10.1046/j.1365-2818.1997.1480707.x. [DOI] [PubMed] [Google Scholar]
- 24.Huisken J, Swoger J, Del Bene F, Wittbrodt J, Stelzer EH. Optical sectioning deep inside live embryos by selective plane illumination microscopy. Science. 2004;305(5686):1007–1009. doi: 10.1126/science.1100035. [DOI] [PubMed] [Google Scholar]
- 25.Fairchild, Inc., Andor, Inc., and PCO, Inc. sCMOS data sheet. http://www.scmos.com/
Associated Data
This section collects any data citations, data availability statements, or supplementary materials included in this article.


