

Abstract
The protein kinase C (PKC) family of enzymes regulates cell physiology through phosphorylation of serine and threonine residues of many proteins in most cell types. Here we have identified PKC-β1 and PKC-γ as isoforms are essential for rod photoreceptor differentiation in mouse retinas. Using ex vivo retinal explants we found that phorbol ester 12-myristate 13-acetate (PMA) and insulin-like growth factor 1 (IGF1) induced rod differentiation, as defined by opsin or Crx expression, in a PKC-dependent manner days ahead of rod development in untreated explants. PKC-β1 and PKC-γ were co-localized with PCNA- and STAT3-positive progenitors through the later differentiation period. Pharmacological or genetic inhibition of either isoform resulted in partial reduction in appearance of rods, whereas removing both isoforms resulted in their complete absence. Furthermore, a significant decline of STAT3 tyrosine phosphorylation was observed by activation of PKC, while inhibition of PKC resulted in an increase of phosphorylated STAT3 along with a delayed cell cycle exit of progenitors with prolonged PCNA expression. In adult retinas IGF1 activates PI-3 kinase (PI3K) but in neonatal retinas its action was identical to the action of an PI3K inhibitor. These data unveil a novel signaling cascade that co-ordinates and regulates rod differentiation through specific PKC isoforms in mammals.
Keywords: PKC, rod photoreceptors, IGF1, STAT3
Introduction
Fate choices of neural progenitors are regulated through the actions of an integrated set of extrinsic and intrinsic factors. Like other regions of the CNS, the retina develops from multipotential sets of neuroblasts that give rise to specific cell types in a stereotypic sequence (Turner and Cepko 1987, Holt et al., 1988; Wetts and Fraser, 1988, Rapaport et al., 2004). The retina develops in a general inner to outer sequence with rod photoreceptors among the last cell types to differentiate, predominantly during the early postnatal period (Young, 1985, Rapaport et al., 2004). Within the retinal epithelium, photoreceptor differentiation is influenced by a number of cell interactions mediated by either direct cell-cell contacts or through soluble factors released from cells (Watanabe and Raff, 1990, 1992; Reh, 1992; Altshuler and Cepko, 1992; Altshuler et al., 1993; Levine et al., 2000; Yang, 2004). Several factors have been shown to promote the formation of rods but the mechanisms by which these signals regulate the transition from progenitor to postmitotic neuron are only partially understood.
In this manuscript we have identified a pathway essential for rod formation that involves protein kinase C (PKC). The PKC family of serine/threonine kinases consist of at least 10 isoforms that are grouped into three distinct classes: (1) calcium-dependent or classical cPKCs Ca Dependent (Classical): α, βI, βII, γ, (2) Ca Independent (Novel): δ, ε, η, θ, and (3) Atypical : λ, ζ, ι (Inoue et al., 1977; Mellor and Parker, 1998). In the mature nervous system, these kinases transduce signals involved in many different processes including ion fluxes, receptor modulation, cell proliferation and gene expression (Kheifets and Mochly-Rosen, 2007). During development, specific PKCs have been reported to have a role in fate specification of different tissues as well as the differentiation of several cell types. For example, primary cultures of hippocampal cells express the PKCs α, βI, γ, θ, and ζ, constitutively while PKCs βII, δ, ε, and η, are upregulated upon the induction of differentiation with retinoic acid treatment (Oehrlein et al., 1998).
Here we specifically identified two PKC isoforms, PKC-β1 and PKC-γ, which are pivotal for the development of rods, as their absence completely inhibits rod differentiation. We identified IGF1 as one specific activator of PKC-β1 and PKC-γ that can increase the number of rod differentiating from the retinal progenitor pool. One consequence of PKC activation is a reduction in phosphorylated STAT3, a molecule whose activation inhibits rods differentiation (Zhang et al., 2004; Rhee et al., 2004, Ozawa et al., 2004). We also found that at postnatal day 1 (PN1) IGF1 binding activates its receptor but the PI3K signaling differs from neonate and adult retinas. Overall, our results are consistent with the hypothesis that movement of retinal cells out of the progenitor pool into a rod photoreceptor differentiation pathway involves release of the differentiation block created by STAT3, and that this can be regulated in part by extrinsic factors such as IGF-1 acting through PKC-βI and γ.
Materials and Methods
Reagents
Polyclonal antibodies against PKC-β1, STAT3, pAKT1/2/3 (Ser 473) (Santa Cruz Biotechnology, Santa Cruz, CA), pSTAT3 (Y705), PKC alpha (Cell Signaling Technology, Inc., Beverly, MA), PCNA (Sigma St Louis, MO), and PKC-γ (Abcam, Cambridge, MA) were employed in these experiments. Antigen peptides for STAT3 were used for blocking reagents to check antibody specificity. Ret-P1 monoclonal antibody recognizes an epitope on the N-terminus of opsin of rod photoreceptors (Barnstable, 1980; Hicks and Barnstable, 1987). Recombinant LIF was purchased from Millipore (Billerica, MA), recombinant mouse IGF1 from Sigma (St Louis, MO), PMA from LC Laboratories (Woburn, MA), AKT inhibitor VIII, Go7874 and PKC-β inhibitor from Calbiochem (Darmstadt, Germany), PI3Kinase inhibitor (Ly294002) from Cell Signaling technology, Inc (Beverly, MA), FGF2, EGF, and BDNF from BioSource International, Inc (Camarillo, CA).
Animals
C57Bl/6J and PKC-γ knockout (B6;129P2-Prkcctm1Stl/J) mice were purchased from Jackson Laboratory (Bar Harbor, ME, USA). In initial experiments we noticed small differences in the timing of rod development between the C57Bl/6J strain and the B6;129P2-Prkcctm1Stl/J strain. To eliminate these genetic background differences we backcrossed the KO animals to C57Bl/6J and heterozygous animals mated to generate homozygous PKC-γ KO, WT, and heterozygous littermates. All experiments were approved by the Animal Care and Use Committee of Pennsylvania State University School of Medicine. Mice were housed on a 12-hr/12-hr light/dark cycle with ad libitum access to rodent chow. Embryonic day 15.5 (E16.5), E17.5, postnatal day 1 (PN1), PN3, PN5, PN7 and PN13 animals of either sex were used for tissue sectioning and immunohistochemistry.
PN1 animals of either sex were used for retinal explant cultures. Most of the litters were born on E20, which was considered equivalent to postnatal day 1 (PN1). Embryos were dissected into cooled phosphate-buffered saline (PBS) for retinal explant isolation. Genotyping of the PKC-γ KO animals was carried out using the following primers: Wild type oIMR0496: GCT CCG ACG AAC TCT ATG CCA, oIMR0497: GTG GAG TGA AGC TGC GTG AGA, Mutant generic neo primers oIMR6916: CTT GGG TGG AGA GGC TAT TC and oIMR6917: AGG TGA GAT GAC AGG AGA TC using Jackson Laboratory protocols.
Retina isolation and culture
Whole retinas were isolated from pups at PN1, by removing the sclera and most of the retinal pigmented epithelium (RPE) layer (Sparrow et al., 1990; Zhao and Barnstable, 1996; Zhang et al., 2002; Zhang et al., 2004) and cultured in UltraCulture™ (Cambrex Bio Science, Rockland, ME) serum-free medium supplemented with gentamycin antibiotic (10 μg/ml). Retinas were culture individually in 1ml of media in a 24-well culture dish at 37°C in a 5% CO2, balance air, atmosphere. Medium was changed every other day by replacing 0.5ml with fresh medium. Dissociated retinal cells were obtained by incubating isolated retinas in 0.25% trypsin at 37°C for 15 min. Retinas were transferred to tubes containing DMEM medium with 10% FBS. A flame-polished glass Pasteur pipette was used to triturate the retinas to obtain single cells. Cells were then placed on a glass slide coated with poly-L-lysine (Sigma, St Louis, Missouri), and fixed in 4% PFA for 30 min. Cells were subsequently double-labeled for PCNA (1:5000) and for PKC-βI (1:1000), PKC-γ (1:1000) or STAT3 (1:1000).
Western blot
Whole cell extracts were prepared and Western blot assays performed as described previously (Asao and Fu, 2000; Zhang et al., 2004). Briefly, retinas from postnatal mice or explanted retina were suspended in a whole cell extract buffer. The tissues were frozen and thawed three times to lyse the cells. The supernatant was collected by micro-centrifugation, and protein concentrations were measured. 25 to 30 μg of lysate were separated by SDS-polyacrylamide gel electrophoresis and transferred to Immun-BlotTM polyvinylidene difluoride membrane (Biorad Hercules, CA). After blocking with 5% non-fat milk in washing buffer, membranes were incubated with primary antibodies. Following washes, they were incubated in anti-rabbit or anti-mouse IgG coupled to horseradish peroxidase. The immunoreactive bands were visualized using SuperSignalR Chemiluminescent Substrate (Thermo Scientific Rockford, IL). The quantitative image analysis was performed using Image J 1.29 (downloaded from http://rsb.info.nih.gov/ij/).
Histology and immunocytochemistry
Whole eyes and explanted retinas were fixed with 4% paraformaldehyde in PBS for 24 hr at 4°C. After three washes with PBS, fixed explants were dehydrated through a series of graded ethanols and embedded in paraffin. All samples for one experiment were placed in the same blocks and sectioned for immunohistochemistry. Antigen retrieval was performed using 6.5 mM Sodium Citrate pH 6 and boiling for 45 min. A standard immunohistochemistry protocol (Zhang et al., 2003, 2004) was employed for single or double labeling using fluorescent dye-conjugated secondary antibodies (Jackson Immuno-Research Laboratory, West Grove, PA). Sections were imaged using an Olympus Fluoview FV1000 confocal microscope (Olympus Center Valley, PA). For each set of experiments, acquisition parameters for each antibody were maintained constant.
Sections used for cell counting were taken adjacent to the optic nerve and contained the full extent of the retina from central to peripheral regions. Labeled rods were counted over the full length of retina and normalized for variations in tissue size. No correction was made for retinal thickness as all were close to 70μm. Cell counts were obtained for three sections from each retina and at least three retinas were studied per treatment.
Real-time RT-PCR
Total RNA was isolated by TRIzol (Invitrogen Carlsbad, California) and purified by RNeasy mini kits (Qiagen, Valencia, CA). Final concentrations were determined spectrophotometrically using a GeneSpect III (Hitachi Tokyo, Japan). For each sample, 50 μl RT reaction containing 2 μg RNA, 10 μl 5× first-strand buffer, 5 μl 10 mM deoxyribonucleotide triphosphates, 5 μl 0.1 mM dithiothreitol, 1 μlRNase-OUT, and 1μl SuperScript II reverse transcriptase. (Invitrogen Carlsbad, California) was incubated at 42°C for 50 min.
Real-time PCR used a 25 μl reaction volume containing 12.5 μl Sybr-green supermix (BioRad Hercules, CA) with primers and 12.5 μl diluted RT product. Annealing temperatures were set at 60°C for 40 cycles using an iCycler (BioRad Hercules, CA). Primer sequences were: opsin: fwd: 5′-TGC TGT TTT CCT TGG CCT TTG G-3′, rev: 5′-TCT CTT CAG CAT GCC AGG AAG T-3′; beta-actin: fwd:5′-GTG GGG CGC CCC AGG CAC CA-3′, rev: 5′-CTCCTT ATT GTC ACG CAC GGA TTT C-3′; Crx fwd: 5′-TCA AGA ACC GGA GGG CTA AAT-3′, rev: 5′ATA GCT CTG GCC TGA TAG GGA
Statistical analysis
Statistical analyses were performed using the GraphPad Prism software. Student’s t test (two-tailed, unpaired) was used to compare two groups and one-way ANOVA (with Newman–Keuls post test) was used to compare more than two groups.
Results
PKC regulates appearance of rod photoreceptors in retinal explant cultures
To test whether intrinsic signals from peptide growth factors or neurotrophins could stimulate the generation of rod photoreceptors we added IGF1, FGF2, EGF, or BDNF for four days to P1 retinal explant cultures. We also tested the action of a phorbol ester, a molecule known to affect differentiation in many cell types. After four days in culture, retinas were fixed and labeled with an opsin antibody to count the number of rod photoreceptors. Approximately 50 rods per section (49.8 ±5.5, N=5) were detected in sections from control tissues. BDNF treatment led to only a slight increase (66.67 ±8.8, N=3, P=0.15) in the number of rods counted. Both EGF and FGF2 increased the number of rods present at the end of the culture (86.7 ± 10.1, N=3, P <0.02 and 88.0 ± 7.6, P < 0.01 respectively), but IGF1 (182.2 ± 5.9 N=5, P< 0.0001) and PMA (170.6 ± 3.4 N=5, P<0.0001) both gave a much greater increase (Fig 1A and B). Because of the smaller effects of EGF and FGF2 we did not pursue the mechanism of action of these factors further.
Figure 1. IGF1 and PMA increase the number of rod photoreceptors present in PN1 retinal explants by activating PKC.

(A) Numbers of rods present on PN1 retinas after four days of culture in the presence of 50 ng/mL IGF1, 100 nM FGF2, 100 nM EGF, 100 nM BDNF or 100 nM PMA. Counts were obtained by averaging the number of rods present in three individual histological cross sections of each retina. At least three different retinas were studied per treatment focusing on the central areas of the retina. ***P<0.005. (B) Immunofluorescence detection of opsin (green) overlaid with nuclear counterstain (Hoechst, blue) of four day PN1 retinal explants. PN1 retinas were cultured from WT mice for four days in the presence of 50ng/mL IGF1 or 100 nM PMA. OL, Outer retinal layer; IL, Inner retinal layer. (C) Numbers of rods present at the end of a four day culture of P1 WT retinas in the presence of 50 ng/mL IGF1, 100 nM PMA, or 100 nM Go7874. Cell counts were obtained as above. Numbers were normalized to control values. ***P<0.005. Scale bar, 40 μm.
A major action of PMA is the activation of PKCs. We tested whether the increase in opsin-positive cells induced by PMA, and by IGF1, might be due to activation of PKC by repeating the experiments in the presence Go 7874, a pan inhibitor of PKCs. Such cultures did not show any significant increase in opsin-positive cells over control (Fig 1C and D). These results suggest activation of PKC, either chemically or by the growth factor IGF1 can increase the production of opsin-positive rod photoreceptors in the neonatal mouse retina.
To ensure that the changes brought by PKC activation were on the whole process of rod photoreceptor differentiation rather than just on opsin expression, we examined the expression of the transcription factor Crx, another early marker of rods. After four days in culture we found that activation of PKC by PMA or IGF1 increased expression of Crx RNA over eight-fold (8.6 ± 5.3, n=4, P<0.02) and (9.8 ± 2.2 n=4, P<0.007) respectively, an increase comparable to that of opsin itself (5.2 ± 2.4, n=4, P<0.02) and (7.2 ± 1.2, n=4, P<0.005) (Fig 2A and B). Similarly, treatment with either IGF1 or PMA increased Opsin and Crx protein levels by approximately 2-fold (1.6 ± 0.2, n=3, P<0.05 and 1.9 ± 0.05, n=3, P<0.05 respectively) (Fig 2C and D). These results suggest that activation of one or more isoforms of PKC is sufficient to trigger expression of multiple genes that are characteristic of the early stages of rod photoreceptor differentiation.
Figure 2. IGF1 and PMA treatment of PN1 retinal explants increases expression of rod specific genes.

Quantitative RT-PCR assay showing expression of Opsin and Crx in P1 retinal explants cultured for four days in the presence of PMA (A) or IGF1 (B). **P<0.005, *P<0.05. Beta-actin and GAPDH expression was used to normalize mRNA levels and values are expressed relative to control levels. Amount of Opsin (C) and Crx (D) proteins found in four day retinal explants of PN1 retinas using Western blot analysis. Beta-actin expression was used to normalize total protein levels. Values in graph are normalized to control levels. *P<0.05, **P<0.01.
PKC-βI and PKC-γ are expressed in dividing progenitors at the time of rod photoreceptor differentiation
PKC exists as a series of eight classical (α, βI, βII, and γ) and novel (δ, ε, η, and θ) isoforms that can be activated by phorbol esters, as well as atypical forms that are not sensitive to these agents. To define which PKC isoforms might be responsible for inducing rod formation we first examined the temporo-spatial pattern of classical and novel PKC isoform expression during retinal development. No expression of βII, δ, ε, η, and θ isoforms was detected by either immunocytochemistry or western blotting (data not shown). On the other hand, both PKC-γ (Fig 3A–D) and PKC-β1 (Fig 3E–H) were expressed strongly at the outer margin of the retina from embryonic stages until the end of retinogenesis in the first postnatal week. In addition, both PKC isoforms were expressed by cells in the inner retina, and this expression persisted into the adult (not shown). PKC-α was detected only after PN5 when the differentiation of most retinal cells is substantially advanced (Fig 3I–L). As described by others, it is expressed mainly in the bipolar cells of the inner nuclear layer, suggesting that it has a limited involvement, if any, in rod development (Osborne et al., 1992; Kosaka et al., 1998).
Figure 3. PKC Beta1 and Gamma isoforms are expressed during retinal development.

Immunofluorescent detection of PKC Alpha, Beta1 and Gamma (A–L, red) from embryonic day 17.5 (A,E,I), P1 (B,F,J), P5 (C,G,K) and co-localization with opsin (green) expression at PN5 (D,K,L). (M) Expression of PKC Beta1 and Gamma (red) co-localization with PCNA (green) in the central and peripheral retina of E15.5, E17.5, PN1 and PN3 retinas. OL, Outer retinal layer; IL, Inner retinal layer. Scale bar, 40 μm.
At early postnatal stages the outer layer of the retina contains both proliferating progenitors and post-mitotic neurons. To test which cell population in this region expressed PKC-β1 and PKC-γ we co-stained the sections with proliferating cell nuclear antigen (PCNA) antibody to label the dividing cells. Although much of the PKC-β1 and PKC-γ labeling was present in the apical processes of retinal cells at the very outer edge of the retina, we found some PKC-γ and PKC-β1 labeled cell bodies and these co-localized with PCNA positive cells in the outer retina during late embryonic and early postnatal stages of retinal development (Fig 3M). By PN3 it became harder to detect dividing cells in central retina, although many were still present in more peripheral regions. Because much of the PKC-β1 and PKC-γ labeling was in the cell processes, particularly the endings at the outer surface, it was difficult to get an accurate estimate of the extent of overlap in labeling. To confirm that PKC was in fact expressed in the mitotic cells we also stained cells dissociated from E17.5 retinas. A much clearer staining localized to the membrane of the cells was observed with the PKC-β1 and PKC-γ antibodies. At this stage 95% of the cells were PCNA-positive, and of these 83% were also PKC-β1 positive and 85% were also PKC-γ positive (data not shown). This confirms the expression of these PKC isoforms in progenitor cells and indicates that most of the cells expressed both isoforms.
PKC-β1 and PKC-γ each have an effect on rod photoreceptor development
Although both PKC-β1 and PKC-γ are expressed in dividing progenitors at the time that many of them progress into a rod photoreceptor lineage, the pattern of expression does not show which of these enzymes regulates the normal process of rod photoreceptor development. To investigate whether PKC-β1 was capable of enhancing rod photoreceptor development, we pharmacologically inhibited PKC-β using a compound developed by Eli Lilly and commercialized by Calbiochem. This PKC inhibitor has an IC50 of 12 nM for PKC-β1 and 5nM for PKC-βII, 331 nM for PKC-α, and higher than 1uM for PKC-γ and ε. Since this inhibitor is orders of magnitude more effective on PKC-β1 and βII, but PKC-βII is not expressed in retinas during rod development, we used it as a specific inhibitor of PKC-β1 in our retinal explants. Treatment of explants with the PKC-β inhibitor (30 nM) plus PMA reduced the number of rods detected compared to treatment with PMA alone (Fig 4A), although the increase was still two fold greater than untreated controls (2.1 ± 0.2, n=3, P<0.005). Even ten-fold higher concentrations of PKC-β inhibitor did not further reduce the number of rods, suggesting that the partial reduction was not due to sub-optimal concentrations of the inhibitor. As in previous experiments, however, addition of the pan-PKC inhibitor Go 7874 reduced the number of detectable rods to control levels.
Figure 4. Inhibition of PKC B1 activity partially inhibits the effect of PMA and IGF1 on rod photoreceptor formation.

Increase in rods present at the end of a four day culture of PN1 retinas after addition of PMA (A) and IGF1 (B) in the presence or absence of PKC B1 specific inhibitor (30 nM or 300 nM) or 100 nM PKC pan inhibitor (Go7874) relative to untreated explants. Values were obtained by averaging the number of rods present in three individual section of a single retina. At least three different retinas were studied per treatment. **P<0.005, ***P<0.001.
We repeated these experiments using IGF1 to activate PKC and found that IGF1 treatments increased the number of rods present by almost six fold (5.7 ± 0.4, n=3, P<0.005) and addition of the PKC-β inhibitor substantially reduced the increase, although it remained significantly above control values (2.7 ± 0.2, n=3, P<0.005). Here again, ten-fold higher concentrations of PKC-β inhibitor did not change the magnitude of this increase whereas the pan-PKC inhibitor Go 7874 reduced the number of rods to control levels (Fig 4B).
To examine the effects of PKC-γ on rod development we used PKC-γ knock out (KO) mice. We first examined the natural time course of opsin-positive rod appearance using sections of eyes obtained from animals of various ages (Fig 5). At P5, the PKC-γ KO animals did not contain any opsin-positive rod photoreceptors, whereas wild type littermates already had a substantial number of rods. At PN7, the PKC-γ KO animals appear to have fewer opsin-positive cells. The fluorescence intensity of equal areas of opsin-stained retinas was reduced by fifty percent in PKC-γ KO retinas compared to wild type littermate retinas (0.4 ± 0.1, n=4, P<0.009). By P13, however, retinas from PKC-γ KO animals had no detectable difference in the fluorescence intensity of opsin labeling photoreceptors, and there were no significant changes in the morphology of the rods at this level of resolution when compared to control littermates (fig 5B). This suggests that the absence of PKC-γ causes a substantial delay of rod development, but that eventually a full complement of rods is formed. One mechanism by which absence of PKC-γ could delay rod differentiation is by retarding the exit of cells from the proliferative pool. To test this idea, we investigated the expression of PCNA in the outer layer of the retina, using the outer plexiform layer as boundary (Fig 5C). By measuring fluorescence intensity we found that at P5 PKC-γ KO contain almost three times as much labeling in the outer layer of the retina as wild-type littermates (2.8 ± 0.7, n=4, P<0.007). The difference was even more striking in the outer layer of the retinas of PN7 PKC-γ KO animals where we found almost thirteen times more PCNA labeling than their wild type littermates (12.7 ± 0.7, n=4, P<0.005). This persistence of the progenitor pool was temporary because at PN13 neither the PKC-γ KO nor the WT littermates had detectable PCNA positive cells.
Figure 5. Absence of PKCγ during retinal development causes a delay in rod formation and prolongs progenitor cell cycle exit.

(A) Immunofluorescence detection of Opsin and PCNA (green) of PKCγ KO and WT littermate retinas of ages PN5, PN7 and PN13. Sections were overlaid with nuclear counterstain (Hoechst, blue). (B) Fluorescence intensity of Opsin present in retinas at ages PN5, PN7 and PN13 comparing PKCγ KO retinas to wild type littermates. (C) Fluorescence intensity of PCNA present in the outer layer of the retinas at ages PN5, PN7 and PN13 comparing PKCγ KO retinas to wild type littermates. The outer plexiform layer defined the limit between outer and inner layers of the retina. *P<0.05, **P<0.01, ***P<0.005. Values were obtained by averaging the fluorescence intensity of at least three representative areas of at least three different retinas. Scale bar, 40 μm
To examine whether IGF1, or PMA, could enhance rod photoreceptor differentiation even in the absence of PKC-γ and PKC-β1 activity we tested the effects of these agents on the PKC-γ KO retinas. As shown in Fig 6A, when cultured in the presence PMA for four days PKC-γ KO retinas had over almost eight the number of rods compared with PKC-γ KO control retinas cultured in medium alone (7.5 ± 0.5, n=4, P<0.0001). Addition of the PKC-β inhibitor completely abolished the PMA stimulation and reduced the number of rods to below the levels in untreated cultures (0.57 ± 0.11, n=4, P=0.09). Similarly, when the retinas were cultured in the presence of IGF1 (Fig 6B), we found that there were about nine times more rods than in untreated retinas (9.2 ± 0.6, n=4, P<0.0001), but retinas cultured in the presence of IGF1 plus the inhibitor of PKC-β had numbers of rods not significantly different from untreated retinas. This result confirms that the effects of PMA and IGF1 on rod development can be partially mediated through either PKC-γ or PKC-β1. However, in the absence of PKC-γ and PKC-β1 activities, by gene targeting and specific pharmacological inhibition respectively, neither PMA nor IGF1 were able to induce rod formation.
Figure 6. In the absence of PKCβ1 or PKCγ, neither PMA nor IGF1 can induce rod photoreceptor formation.

(A) Increase in rods present at the end of a four day culture of PN1 PKCγ KO retinas in the presence of 100 nM of PMA, and PMA plus 30nM PKCβ1 inhibitor relative to untreated explants. (B) Increase in rods present at the end of a four day culture of PKCγ KO retinas in the presence of 50 ng/ml IGF1 or IGF1 and 30 nM PKCβ1 inhibitor. Cell counts were obtained from four retinas for each treatment.
We next tested whether the activity of PKC-γ and PKC-β1 is necessary for control levels of rod photoreceptor formation in the absence of added factors using P1 retinal explants. To effectively distinguish between a delay in rod development, as seen in PKC-γ KO animals, and a complete block in rod development, we cultured PKC-γ KO and wild type littermate retinas for eight days, which is ample time to achieve rod differentiation. We cultured retinas from PKC-γ KO animals and WT littermates in the presence of the specific PKC-β1 inhibitor (Fig 7A-D) and measured opsin expression by summing the total fluorescence over a uniform field of the section. We found that PKC-γ KO retinas cultured in the presence of PKC-β1 inhibitor contained very few opsin labeled cells and only 8% of the total opsin fluorescence found in the WT littermates (Fig 7E). We conclude that in the absence if both PKC-γ and PKC-β1 normal rod development is halted.
Figure 7. Absence of PKCβ1 and PKCγ isoforms during retinal development inhibits rod photoreceptor formation.

(A–D) Immunofluorescence detection of Opsin (green) in PN1 retinas after eight days culture of PKCγ KO and WT littermates in the presence of PKCβ1 inhibitor. Sections were overlaid with nuclear counterstain (Hoechst, blue). (E) Fluorescence intensity of rhodopsin present in PN1 retinas after eight days culture of PKCγ KO and WT littermates in the presence of PKCβ1 inhibitor. ***P<0.009. Values were obtained by averaging the fluorescence intensity of at least three representative areas of at least three retinas. Scale bar, 40 μm
IGF1 fails to activate PI3K in PN1 retinas
To investigate the pathway by which IGF1 activates PKC during development, we looked at the role of the major enzymes regulated by IGF1 receptor activity, namely PI3Kinase (PI3K) and its downstream target AKT. Addition of the pan AKT inhibitor VIII to PN1 retinal explants for four days did not result in any significant change in the number of rods in control conditions, or the increased number of rods seen following IGF1 treatment (Fig 8A). This suggests that the effects of IGF1 on rod development were not dependent on AKT activity.
Figure 8. IGF1 activates PKC by inhibiting PI3K activity.

(A) Number of rods found in PN1 WT retinas at the end of a four day culture in the presence of 50 ng/mL IGF1 and 500 nM AKT inhibitor VIII. (B) Number of rods found in PN1 WT retinas at the end of a four day culture in the presence of IGF1, 50 μM Ly294002 and combination compared to controls. (C) Number of rods found in PKCγ KO PN1 retinas at the end of a four day culture in the presence of Ly294002, PKC B1 inhibitor, and a combination of the two expressed as a ratio to the number in untreated controls. Total number of rods was counted from at least three cross sections of a single treated retina. At least three retinas were studied and the average was plotted. ***P<0.001,**P<0.01, *P<0.05. (D) Immunofluorescence detection of opsin (green) in PKCγ KO P1 retinas after four days of culture in the presence of 50 μM Ly294002, 30 nM PKC B1 Inhibitor and combination. Scale bar, 40 μm.
On the other hand when cultures were treated with the compound Ly294002 to inhibit the activity of PI3K the number of rods was over nine times that of control cultures (9.4 ± 0.2, n=3, P<0.0001) (Fig 8B). Adding IGF1 together with Ly294002 did not substantially increase the number of rods over that induced by the inhibitor alone (10.1 ± 0.2, n=3, P<0.0001) (Fig 8B). The effects of PI3K inhibitor on rod development were PKC-dependent since the stimulatory effect of adding Ly294002 to the PKC-γ KO retinal cultures was blocked by the PKC-β inhibitor (Fig 8C).
Thus, both IGF1 and PI3K inhibitor treatments increase the number of rod photoreceptors. This seems paradoxical since in many cell types IGF1 stimulates the activity of PI3K and subsequent AKT phosphorylation. Since our results were more compatible with an inhibition of PI3K mediated by IGF1, we compared the actions of IGF1 on freshly isolated neonatal and adult retinas by measuring the phosphorylation of downstream targets of PI3K five and thirty minutes after addition of IGF1. As shown in Figure 9, in adult retinas IGF1 treatments resulted in increase phosphorylation of AKT with a maximum stimulation at five minutes that was about three times compared to control (3.3 ± 0.6, n=3, P<0.05). The stimulation gradually decreased after thirty minutes exposure to IGF1 (1.703 ± 0.1602, n=6, P<0.005), a result in accord with other studies (Barber et al., 2001, Biswass et al., 2008). In the neonatal retinas, however, IGF1 treatment led to a significant reduction in phosphorylation of AKT to fifteen percent of control after five minutes treatment (0.2 ± 0.1, n=3, P<0.003) and fifty percent of control after thirty minutes (0.5 ± 0.03, n=7, P<0.001).
Figure 9. IGF1 treatment of PN1 and adult retinas results in opposite effects on phosphorylation of AKT and GSK3β.

(A) Amount of phosphorylated Ser 473 AKT found in adult and P1 WT retinas after 5 and 30 minutes treatment with 50 ng/mL IGF1. (B) Amount of phosphorylated Ser 9 GSK3β found in adult and PN1 WT retinas after 5 minutes treatment with 50 ng/mL IGF1. (C) Amount of phosphorylated Tyr 204 ERK found in adult and PN1 WT retinas after 5 minutes treatment with 50 ng/mL IGF1.***P<0.005, *P<0.05 vs control. Dotted line depicts the levels of untreated retinas. At least three retinas were studied per condition.
To confirm the effects of IGF1 on the PI3K-AKT pathway, we looked at the phosphorylation of GSK3β on Ser 9 which is mediated by AKT upon stimulation of PI3K. We found a reduction of about twenty percent on the phosphorylation of GSK3β after five minutes addition of IGF1 (0.8 ± 0.04, n=3, P<0.005) confirming the inhibitory effects of IGF1 on the PI3K/AKT pathway in the neonatal retina (Fig 9B). On the other hand, treatment of adult retinas for five minutes with IGF1 resulted in increased phosphorylation of GSK3β by about seventy five percent when compared to untreated retinas (1.7 ± 0.08, n=3, P<0.05).
To distinguish whether the different response to IGF1 in neonatal tissue was due to IGF receptor dysfunction or to a change at the post-receptor level, we examined the effects of IGF1 on another IGF1 receptor coupled pathway, the ERK/MAPK pathway. As shown in Fig 9C, in the adult retinas, treatment with IGF1 for five minutes resulted in seventy percent increase on the Tyr204 phosphorylation of ERK (1.7 ± 0.2, n=3, P<0.05). In the neonatal retinas, ERK phosphorylation increased by almost five fold (5.0 ± 1.0, n=3, P<0.05) suggesting the tyrosine kinase activity of the IGF1R is active throughout development in the retina and that the effects we observe are due to altered structure or activity of PI3K enzyme itself or its coupling to the receptor.
IGF1 does not phosphorylate the regulatory domain of PI3K in PN1 retinas
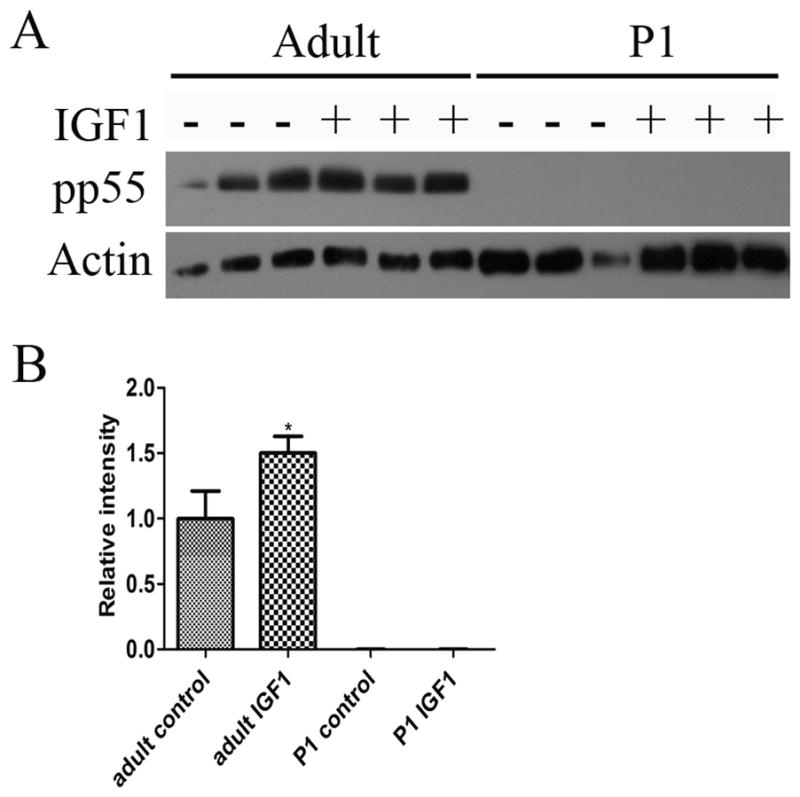
To evaluate the mechanism behind the different effects of IGF1 treatments in adult and PN1 retinas on PI3K activity, we looked at the expression of catalytic and regulatory domain of PI3K in PN1 and adult retinas. We found that both adult and PN1 retinas express the P110α catalytic domain and the p85 regulatory domains, and there was no detectable change in total protein in PN1 retinas after IGF1 treatment (data not shown). We also investigated the effects of IGF1 on the phosphorylation of the regulatory domain of PI3K using an antibody specific for p85 tyrosine phosphorylation at residue 458. We found that five minutes stimulation with IGF1 did not result in phosphorylation of p85 in either PN1 or adult retinas. The same antibody, however, recognizes the tyrosine phosphorylation of p55 splice variant at residue 199 and we found that adult retinas contained a substantial amount of phosphorylated p55, and IGF1 treatment for five minutes resulted in fifty percent increase in phosphorylation of p55 (1.5 ± 0.1, n=3, P<0.05) (Fig 10). However, we did not detect any phosphorylation of p55 either before or after IGF1 treatment in PN1 retinas. The absence of phosphorylation of the regulatory domain after five minutes treatment with IGF1 in PN1 retinas may be responsible for the differences in phosphorylation state of AKT between adult and PN1 retinas.
Figure 10. In PN1 retinas, IGF1 does not phosphorylate the regulatory domain of PI3K.

(A) Western Blot with phosphorylated p55 in PN1 and adult retinas under control conditions and after 5 minutes treatment with IGF1. (B) Graph. *P<0.05 vs control. At least three retinas were studied per condition.
IGF1 inhibits STAT3 tyrosine phosphorylation
Activation of STAT3 during retinal development inhibits differentiation of rod photoreceptors. We therefore tested the hypothesis that IGF1 increased the number of rod photoreceptors by inhibiting STAT3 tyrosine phosphorylation.
We pre-incubated PN1 retinal explants in medium for 5 hrs and then treated them with PMA or IGF1 for thirty minutes. We analyzed the levels of tyrosine phosphorylation of STAT3 by western blots (Fig 11A). Treatment with PMA or IGF1 decreased the levels of tyrosine phosphorylation of STAT3 relative to untreated controls by 70% and 80% respectively (0.3 ± 0.1, n=6, P<0.001), (0.3 ± 0.1, n=3, P<0.002). However, simultaneous addition of Go7874 not only abolished the effects of IGF1 and PMA but the levels of phosphorylation of STAT3 were higher than control levels with IGF1 (2.9 ± 0.4, n=3, P<0.002) and similar to control levels with the PMA. These data suggest that IGF1 and PMA can regulate the tyrosine phosphorylation levels of STAT3 through modulation of PKC activity, and that PKC activity plays an important role in determining the baseline level of STAT3 activity.
Figure 11. PKC activation inhibits LIF induced STAT3 tyrosine phosphorylation.
(A) Amount of tyrosine phosphorylated STAT3 found in PN1 WT retinas after five hours explant culture followed by 30 minutes treatment with 100 nM PMA, 50 ng/mL IGF1, 100 nM Go7874, and 50 μM Ly294002. Amount of tyrosine phosphorylated STAT3 (B) and total STAT3 (C) found in retinas of PN1 PKC Gamma KO and WT littermates cultured for five hours in the presence or absence of PKC B1 inhibitor. Amount of tyrosine phosphorylated STAT3 found in PN1 WT retinas after five hours explants culture followed by 3 hours pre-incubation with either PMA (D) or IGF1 (E) with subsequent addition of LIF for 30 min. ***P<0.0005, **P<0.005, *P<0.05.
We obtained similar results when we treated the retinas with the PI3K inhibitor Ly294002. Thirty minutes treatment with Ly294002 decreased the tyrosine phosphorylation of STAT3 by 50% (0.5 ± 0.05, n=3, P<0.002), a reduction that was also abolished by the simultaneous addition of 100nM Go7874.
A prediction from these results is that the absence of PKC-β1 and PKC-γ would lead to increased baseline pSTAT3 levels. Retinas were isolated from PN1 PKC-γ KO and WT littermates, cultured for 5 hours and the protein extracted and analyzed for the levels of phosphorylated STAT3. We found that the basal levels of phosphorylated STAT3 in the PKC-γ KO animals were significantly greater than those in the WT littermates (2.7 ± 0.55, n=3, P<0.05) (Fig 11B). In addition, when PKC-β1 inhibitor was added to the culture for the entire 5 hours, phosphorylation of STAT3 was further increased to almost five times the levels of control WT untreated retinas (5.0 ± 1.0, n=3, P<0.005). STAT3 can promote its own expression through a STAT3 binding site in its promoter (Narimatsu et al., 2001). When we examined the effects of inhibition of PKC-γ on total STAT3 protein we found that PKC-γ KO had almost twice as much STAT3 total protein as the WT littermate control (1.9 ± 0.06, n=3, P<0.005) (Fig 11C). When we added the PKC-β inhibitor to the PKC-γ KO retinas, the total levels of STAT3 did not further increase. In addition, WT retinas in the presence of PKC-β inhibitor on average total levels of STAT3 increased about fifty percent, but the changes did not reach statistical significance.
To test whether PKC activation could also prevent LIF induced STAT3 tyrosine phosphorylation we added IGF1 or PMA to cultures at the same time as LIF or for a 3 hr preincubation. Although simultaneous addition of IGF1 or PMA was not able to reduce the increase in STAT3 phosphorylation, a 3 hr preincubation significantly reduced the effect of LIF without any significant effect on STAT3 protein levels (Fig 11D and E). These data suggest that PMA and IGF1 can prevent the activation of STAT3 by LIF, which has been previously shown to inhibit rod differentiation (Zhang et al., 2004).
This effect is also apparent at the cellular level since preincubation with PMA for 6 hr was able to block LIF induced inhibition of rod photoreceptor development (Fig 12) and increased the number of rods present at the end of the culture by over five fold when compare to untreated controls (5.2 ± 0.7, n=9, P<0.0001).
Figure 12. PMA pre-incubation abolishes LIF-induced block of rod photoreceptor development.

Immunofluorescence detection of rhodopsin (green) in WT PN1 retinas after four days of culture in the presence of 100 nM PMA (B, G), 20 ng/mL of LIF (C, H), PMA and LIF added at the same time (D, I) and six hours pre treatment with PMA followed by LIF (E, J). (K) Graph of the number of rods present at the end of a four day culture of WT P1 retinas in the presence of PMA, LIF and combination. ***P<0.005.
Together these experiments demonstrate that activation of PKC-β1 and PKC-γ by growth factors such as IGF1, or agents such as PMA can reduce STAT3 activation and release the block on the transition from progenitor cell to differentiating rod photoreceptor.
Discussion
In this manuscript we have shown that specific isoforms of PKC are pivotal intracellular mediators of signals that regulate the production of rod photoreceptors in the postnatal mouse retina. The complete lack of rods detected in the presence of PKC inhibitors suggests that this enzyme may play this key role for the wide variety of other signals that can elicit rod production.
To provide access to factors that might modulate rod photoreceptor formation, we made use of a well-characterized explant culture system that we developed and have used in many studies of retinal development (Sparrow et al., 1990; Zhao et al., 1995; Zhang et al. 2002; 2004; 2005). These cultures maintain excellent cell viability, tissue lamination and cell differentiation. In a microarray analysis of gene expression in vivo and in explant cultures, we did, however, find that expression of some genes is delayed by 1–2 days (Liu et al., 2008). This is apparent in the low levels of opsin expression in 4 day explant cultures from PN1 animals as compared with sections from PN5 animals. Nevertheless, since over 75% of 8,880 expressed genes detected in retinal explants showed the same expression volume and pattern as in vivo, we feel that the cultures are an excellent model of retinal development.
Of the 11 known isozymes of PKC we found only two, PKC-β1 and PKC-γ, that were expressed in retinal progenitor cells between E17.5 and PN5, the peak of rod differentiation, to control rod development. Specific inhibition of either isoform reduced the number of rods formed following stimulation by either IGF1, or direct chemical stimulation by PMA, but completion blockade of rod formation was only achieved when the activity of both isoforms was blocked. Since both isoforms were co-expressed in many of the progenitor cells this suggests redundancy of function rather than expression in separate cell populations. Further work, however, may reveal additional functions unique to each isoform, or additional signal mechanisms that selectively activate one or the other. A similar developmental role for PKC-β1 and PKC-γ has been suggested by several studies in other regions of the CNS. In spinal cord, PKC-α, PKC-β1 and PKC-γ are expressed in developing motor neurons and it has been suggested that they are necessary for various aspects of both morphological and functional differentiation of these cells (Miki, 1996). Similarly, tissue culture studies have implicated PKC-β1 and PKC-γ in differentiation of astrocytes and oligodendrocytes (Asotra and Macklin, 1994).
Although we do not know the immediate targets of PKC-β1 and PKC-γ, we propose that a key action of these enzymes is to regulate the activity of STAT3. There is growing evidence that STAT3 plays a pivotal role in mammalian development. It serves as a key transcription factor regulating mouse embryonic stem cell self-renewal and in the embryonic neocortex STAT3 activity maintains neural precursor cells (Xie et al., 2009; Yoshimatsu et al., 2006). Our previous results had indicated that STAT3 has this role throughout development since it serves as a gatekeeper to determine whether retinal progenitor cells remain in a proliferating pool or transition into a terminal differentiation pathway. Sustained activation of STAT3 by virally encoded, constitutively-active STAT3 completely blocked rod photoreceptor formation and, conversely, a virally encoded dominant-negative form of STAT3 allowed formation of rods even in the presence of CNTF (Zhang et al., 2004). A variety of signals found in the developing retina can promote STAT3 activity, including Notch-Delta-like 1, FGF1, IFN-α and LIF, and the maintenance of a progenitor state is presumably due to the sum of their activity (Yoshimatsu et al., 2006; Zhang et al., 2004; 2005). Some of these signals decrease with developmental age suggesting that the driving force for STAT3 activation declines as progenitor cells become competent to differentiate. Our results suggest that PKC has an active role in regulating the decrease in STAT3 activation necessary to trigger rod photoreceptor differentiation.
Two known mechanisms of STAT3 inactivation are inhibition of Janus kinase (JAK) by SOCS3 and by increased activation of phosphatases. SOCS3 is expressed in the outer retina and is upregulated when STAT3 is downregulated (Ozawa et al., 2007). SOCS3 is clearly activated by post-transcriptional mechanisms and it is possible that these are the substrate for PKCs action. Because cells contain a substantial number of phosphatases, and the signal cascade from IGF1 to STAT3 involves multiple steps of phosphorylation, it is currently difficult to determine whether PKC-β1 and PKC-γ exert their effects on STAT3 through activation of a phosphatase.
Perhaps the most surprising result reported here is that IGF1 and an inhibitor of the IGF1 receptor both increase the number of rods in retinal explants. In the retina, IGF1 levels increase postnatally from below 200 pg/mg at birth to 300 pg/mg at PN7, and above 400 pg/mg at p21 (Modanlou et al., 2006), a time course consistent with a role for IGF1 as an extracellular signal that triggers rod formation. A number of studies have implicated IGF1 in neural development although many of these studies have focused on the role of this factor in proliferation and survival of cells (Meyer-Franke et al., 1995, Hernández-Sánchez et al., 1995, Kermer et al., 2000, Moramoto et al., 2005).
The IGF1 receptor regulates ERK phosphorylation through a ras/raf pathway (Webster et al., 1994, Keeton et al., 2005; Kiepe et al., 2005; Parrizas et al., 1997) and the increase in ERK1/2 phosphorylation induced by IGF1 indicates that its receptor was activated in both neonatal and adult retinas. In many cell types the major effect of IGF1 is activation of PI3 kinase, a result we confirmed in mature retinal tissue. On the other hand, in the P1 retinas IGF1 treatment led to a decrease in phosphorylation of both AKT and GSK3β. This suggests that the coupling between the IGF1 receptor and the enzyme PI-3 kinase is abnormal in the neonate. In support of this is our finding that in the adult, but not the PN1, retinas IGF1 induces an increase in the phosphorylation of the p55 regulatory subunit of PI3 kinase. Phosphorylation of the regulatory subunit by the activated IGF1 receptor is essential for PI3 kinase activation. At present we do not know whether there is a difference in regulatory subunit expression at the different ages or to a failure of the p55 subunit to interact with the receptor in the P1 tissue. This, however, is only a partial explanation of our results. The level of phosphorylation (activation) of AKT is a balance set by the relative levels of activators produced by PI3 kinase and the actions of inhibitory phosphatases, such as SHIP2 and pharbin (Sasaoka et al., 2004, Clement et al., 2001, Wada et al., 2001, Pesesse et al., 1997, Ishihara et al., 1999). We propose that IGF1 binding to its receptor in PN1 tissue activates one of these phosphatases which is not counteracted by PI3K, resulting in a net effect of reduced phosphorylated AKT. Since AKT itself is not involved in stimulating formation of rods, we propose that the same imbalance results in the activation of PKC β1 and PKC γ.
A similar mechanism may be responsible for the induction of rods seen with the PI3K inhibitor (Ly294002) treatment. In the retina, many growth factors activate PI3K upon binding to its receptors, including PDGF, BDNF, EGF and bFGF (Biswas et al., 2008, Hollborn et al., 2004, Nakazawa et al., 2002). The receptor activation simultaneously stimulates other proteins such as MAPK and phosphatases that feedback and balance each other’s activities. Addition of the PI3K inhibitor unbalances the signaling of all the receptors that may be activating PI3K at that time, thus, the stimulation of rod production is even higher. It is therefore the lack of activity of PI3K that directly or indirectly allows PKC to promote rod photoreceptor differentiation.
Although we have described our results as a single pathway, it is clear that the key step, activation of PKC-β1 and PKC-γ, can be regulated by multiple pathways (reviewed in Ananthanarayanan et al., 2003). It is possible that many of the factors that have been shown to influence rod formation in the developing retina converge at this step of PKC activation and that the level of activation is the sum of multiple pathways. Since many of these factors change their level of expression as a consequence of the development of other retinal cells, or other systemic events, this provides a mechanism for the retina to generate rod photoreceptors in synchrony with development of the whole organism.
Acknowledgments
This work was supported by NIH grant EY 013865 and by the Macula Vision Foundation.
References
- Altshuler D, Cepko C. A temporally regulated, diffusible activity is required for rod photoreceptor development in vitro. Development. 1992;114:947–957. doi: 10.1242/dev.114.4.947. [DOI] [PubMed] [Google Scholar]
- Altshuler D, Lo Turco JJ, Rush J, Cepko C. Taurine promotes the differentiation of a vertebrate retinal cell type in vitro. Development. 1993;119:1317–1328. doi: 10.1242/dev.119.4.1317. [DOI] [PubMed] [Google Scholar]
- Ananthanarayanan B, Stahelin RV, Digman MA, Cho W. Activation mechanisms of conventional protein kinase C isoforms are determined by the ligand affinity and conformational flexibility of their C1 domains. J Biol Chem. 2003;278:46886–46894. doi: 10.1074/jbc.M307853200. [DOI] [PubMed] [Google Scholar]
- Asao H, Fu XY. Interferon-gamma has dual potentials in inhibiting or promoting cell proliferation. J Biol Chem. 2000;275:867–874. doi: 10.1074/jbc.275.2.867. [DOI] [PubMed] [Google Scholar]
- Asotra K, Macklin WB. Developmental expression of protein kinase C isozymes in oligodendrocytes and their differential modulation by 4 beta-phorbol-12,13-dibutyrate. J Neurosci Res. 1994;39:273–289. doi: 10.1002/jnr.490390305. [DOI] [PubMed] [Google Scholar]
- Barber AJ, Nakamura M, Wolpert EB, Reiter CE, Seigel GM, Antonetti DA, Gardner TW. Insulin rescues retinal neurons from apoptosis by a phosphatidylinositol 3-kinase/Akt-mediated mechanism that reduces the activation of caspase-3. J Biol Chem. 2001;276:32814–32821. doi: 10.1074/jbc.M104738200. [DOI] [PubMed] [Google Scholar]
- Barnstable CJ. Monoclonal antibodies which recognize different cell types in the rat retina. Nature. 1980;286:231–235. doi: 10.1038/286231a0. [DOI] [PubMed] [Google Scholar]
- Biswas SK, Zhao, Nagalingam YA, Gardner TW, Sandirasegarane L. PDGF- and insulin/IGF1-specific distinct modes of class IA PI 3-kinase activation in normal rat retinas and RGC-5 retinal ganglion cells. Invest Ophthalmol Vis Sci. 2008;49:3687–3698. doi: 10.1167/iovs.07-1455. [DOI] [PubMed] [Google Scholar]
- Clement S, Krause U, Desmedt F, Tanti JF, Behrends J, Pesesse X, Sasaki T, Penninger J, Doherty M, Malaisse W, Dumont JE, Le Marchand-Brustel Y, Erneux C, Hue L, Schurmans S. The lipid phosphatase SHIP2 controls insulin sensitivity. Nature. 2001;409:92–97. doi: 10.1038/35051094. [DOI] [PubMed] [Google Scholar]
- Diaz B, Serna J, De Pablo F, De la Rosa EJ. In vivo regulation of cell death by embryonic pro insulin and the insulin receptor during early retinal neurogenesis. Development. 2000;127:1641–1649. doi: 10.1242/dev.127.8.1641. [DOI] [PubMed] [Google Scholar]
- Hernández-Sánchez C, López-Carranza A, Alarcón C, de la Rosa EJ, de Pablo F. Autocrine/paracrine role of insulin-related growth factors in neurogenesis: local expression and effects on cell proliferation and differentiation in retina. Proc Natl Acad Sci USA. 1995;92:9834–9838. doi: 10.1073/pnas.92.21.9834. [DOI] [PMC free article] [PubMed] [Google Scholar]
- Hicks D, Barnstable CJ. Different rhodopsin monoclonal antibodies reveal different binding patterns on developing and adult rat retina. J Histochem Cytochem. 1987;35:1317–1328. doi: 10.1177/35.11.3655327. [DOI] [PubMed] [Google Scholar]
- Hollborn M, Bringmann A, Faude F, Wiedemann P, Kohen L. Signaling pathways involved in PDGF-evoked cellular responses in human RPE cells. Biochem Biophys Res Commun. 2006;344:912–919. doi: 10.1016/j.bbrc.2006.03.185. [DOI] [PubMed] [Google Scholar]
- Hollborn M, Jahn K, Limb GA, Kohen L, Wiedemann P, Bringmann A. Characterization of the basic fibroblast growth factor-evoked proliferation of the human Muller cell line, MIO-M1. Graefes Arch Clin Exp Ophthalmol. 2004;242:414–422. doi: 10.1007/s00417-004-0879-x. [DOI] [PubMed] [Google Scholar]
- Holt CE, Bertsch TW, Ellis HM, Harris WA. Cellular determination in the Xenopus retina is independent of lineage and birth date. Neuron. 1988;1:15–26. doi: 10.1016/0896-6273(88)90205-x. [DOI] [PubMed] [Google Scholar]
- Ishihara H, Sasaoka T, Hori H, Wada T, Hirai H, Haruta T, Langlois WJ, Kobayashi M. Molecular Cloning of Rat SH2-Containing Inositol Phosphatase 2 (SHIP2) and Its Role in the Regulation of insulin signaling. Biochem Biophys Res Commun. 1999;260:265–272. doi: 10.1006/bbrc.1999.0888. [DOI] [PubMed] [Google Scholar]
- Keeton AB, Bortoff KD, Franklin JL, Messina JL. Blockade of rapid versus prolonged extracellularly regulated kinase 1/2 activation has differential effects on insulin-induced gene expression. Endocrinology. 2005;146:2716–2725. doi: 10.1210/en.2004-1662. [DOI] [PubMed] [Google Scholar]
- Kermer P, Klöcker N, Labes M, Bähr M. Insulin-like growth factor-1 protects axotomized rat retinal ganglion cells from secondary death via PI3-K-dependent Akt phosphorylation and inhibition of caspase-3 in vivo. J Neurosci. 2000;20:2–8. [PubMed] [Google Scholar]
- Kheifets V, Mochly-Rosen D. Insight into intra- and inter-molecular interactions of PKC: design of specific modulators of kinase function. Pharmacol Res. 2007;55:467–476. doi: 10.1016/j.phrs.2007.04.014. [DOI] [PMC free article] [PubMed] [Google Scholar]
- Kiepe D, Ciarmatori S, Hoeflich A, Wolf E, Tonshoff B. Insulin-like growth factor (IGF)-I stimulates cell proliferation and induces IGF binding protein (IGFBP)-3 and IGFBP-5 gene expression in cultured growth plate chondrocytes via distinct signaling pathways. Endocrinology. 2005;146:3096–104. doi: 10.1210/en.2005-0324. [DOI] [PubMed] [Google Scholar]
- Kosaka J, Suzuki A, Morii E, Nomura S. Differential localization and expression of alpha and beta isoenzymes of protein kinase C in the rat retina. J Neurosci Res. 1998;54:655–63. doi: 10.1002/(SICI)1097-4547(19981201)54:5<655::AID-JNR10>3.0.CO;2-Z. [DOI] [PubMed] [Google Scholar]
- Levine EM, Close J, Fero M, Ostrovsky A, Reh TA. p27Kip1 regulates cell cycle withdrawal of late multipotent progenitor cells in the mammalian retina. Dev Biol. 2000;219:299–314. doi: 10.1006/dbio.2000.9622. [DOI] [PubMed] [Google Scholar]
- Liu MG, Xu X, Zhang SSM, Barnstable CJ. Comparison of gene expression during in vivo and in vitro retina development. J Ocul Biol Dis Infor. 2008;1:59–72. doi: 10.1007/s12177-008-9009-z. [DOI] [PMC free article] [PubMed] [Google Scholar]
- Mellor H, Parker PJ. The extended protein kinase C superfamily. Biochem J. 1998;332 (Pt 2):281–292. doi: 10.1042/bj3320281. [DOI] [PMC free article] [PubMed] [Google Scholar]
- Meyer-Franke A, Kaplan MR, Pfrieger FW, Barres BA. Characterization of the signaling interactions that promote the survival and growth of developing retinal ganglion cells in culture. Neuron. 1995;15:805–819. doi: 10.1016/0896-6273(95)90172-8. [DOI] [PubMed] [Google Scholar]
- Miki A. Expression of alpha-, beta-, and gamma-subspecies of protein kinase C in the motor neurons in the embryonic and postnatal rat spinal cord. Neuroscience. 1996;72:805–814. doi: 10.1016/0306-4522(95)00576-5. [DOI] [PubMed] [Google Scholar]
- Modanlou HD, Gharraee Z, Hasan J, Waltzman J, Nageotte S, Beharry KD. Ontogeny of VEGF, IGF-I, and GH in neonatal rat serum, vitreous fluid, and retina from birth to weaning. Invest Ophthalmol Vis Sci. 2006;47:738–744. doi: 10.1167/iovs.05-1046. [DOI] [PubMed] [Google Scholar]
- Morimoto T, Miyoshi T, Matsuda S, Tano Y, Fujikado T, Fujikado Y. Transcorneal Electrical Stimulation Rescues Axotomized Retinal Ganglion Cells by Activating Endogenous Retinal IGF1 System. Invest Ophthalmol Vis Sci. 2005;6:2147–2155. doi: 10.1167/iovs.04-1339. [DOI] [PubMed] [Google Scholar]
- Nakazawa T, Tamai M, Mori N. Brain-derived neurotrophic factor prevents axotomized retinal ganglion cell death through MAPK and PI3K signaling pathways. Invest Ophthalmol Vis Sci. 2002;43:3319–3326. [PubMed] [Google Scholar]
- Oehrlein SA, Maelicke A, Herget T. Expression of protein kinase C gene family members is temporally and spatially regulated during neural development in vitro. Eur J Cell Biol. 1998;77:323–337. doi: 10.1016/S0171-9335(98)80091-5. [DOI] [PubMed] [Google Scholar]
- Osborne NN, Barnett NL, Morris NJ, Huang FL. The occurrence of three isoenzymes of protein kinase C (alpha, beta and gamma) in retinas of different species. Brain Res. 1992;570:161–166. doi: 10.1016/0006-8993(92)90577-v. [DOI] [PubMed] [Google Scholar]
- Ozawa Y, Nakao K, Shimazaki T, Takeda J, Akira S, Ishihara K, Hirano T, Oguchi Y, Okano H. Downregulation of STAT3 activation is required for presumptive rod photoreceptor cells to differentiate in the postnatal retina. Mol Cell Neurosci. 2004;262:258–70. doi: 10.1016/j.mcn.2004.02.001. [DOI] [PubMed] [Google Scholar]
- Parrizas M, Saltiel AR, LeRoith D. Insulin-like growth factor 1 inhibits apoptosis using the phosphatidylinositol 3′-kinase and mitogen-activated protein kinase pathways. J Biol Chem. 1997;272:154–161. doi: 10.1074/jbc.272.1.154. [DOI] [PubMed] [Google Scholar]
- Pesesse X, Deleu S, De Smedt F, Drayer L, Erneux C. Identification of a Second SH2-Domain-Containing Protein Closely Related to the Phosphatidylinositol Polyphosphate 5-Phosphatase SHIP Biochem. Biophys Res Commun. 1997;239:697–700. doi: 10.1006/bbrc.1997.7538. [DOI] [PubMed] [Google Scholar]
- Rapaport DH, Wong LL, Wood ED, Yasamura D, LaVail MM. Timing and topography of cell genesis in the rat retina. J Comp Neurol. 2004;474:304–324. doi: 10.1002/cne.20134. [DOI] [PubMed] [Google Scholar]
- Reh TA. Cellular interactions determine neuronal phenotypes in rodent retinal cultures. J Neurobiol. 1992;23:1067–1083. doi: 10.1002/neu.480230811. [DOI] [PubMed] [Google Scholar]
- Rhee KD, Goureau O, Chen S, Yang XJ. Cytokine-induced activation of signal transducer and activator of transcription in photoreceptor precursors regulates rod differentiation in the developing mouse retina. J Neurosci. 2004;24:9779–9788. doi: 10.1523/JNEUROSCI.1785-04.2004. [DOI] [PMC free article] [PubMed] [Google Scholar]
- Sasaoka T, Wada T, Fukui K, Murakami S, Ishihara H, Suzuki R, Tobe K, Kadowaki T, Kobayashi M. SH2-containing inositol phosphatase 2 predominantly regulates Akt2, and not Akt1, phosphorylation at the plasma membrane in response to insulin in 3T3-L1 adipocytes. J Biol Chem. 2004;15:14835–43. doi: 10.1074/jbc.M311534200. [DOI] [PubMed] [Google Scholar]
- Sparrow JR, Hicks D, Barnstable CJ. Cell commitment and differentiation in explants of embryonic rat neural retina. Comparison with the developmental potential of dissociated retina. Dev Brain Res. 1990;51:69–84. doi: 10.1016/0165-3806(90)90259-2. [DOI] [PubMed] [Google Scholar]
- Turner DL, Cepko CL. A common progenitor for neurons and glia persists in rat retina late in development. Nature. 1987;328:131–136. doi: 10.1038/328131a0. [DOI] [PubMed] [Google Scholar]
- Wada T, Sasaoka T, Funaki M, Hori H, Murakami S, Ishiki M, Haruta T, Asano T, Ogawa W, Ishihara H, Kobayashi M. Overexpression of SH2-Containing Inositol Phosphatase 2 Results in Negative Regulation of Insulin-Induced Metabolic Actions in 3T3-L1 Adipocytes via Its 5′-Phosphatase Catalytic Activity Mol. Cell Biol. 2001;21:1633–1646. doi: 10.1128/MCB.21.5.1633-1646.2001. [DOI] [PMC free article] [PubMed] [Google Scholar]
- Watanabe T, Raff MC. Rod photoreceptor development in vitro: intrinsic properties of proliferating neuroepithelial cells change as development proceeds in the rat retina. Neuron. 1990;4:461–467. doi: 10.1016/0896-6273(90)90058-n. [DOI] [PubMed] [Google Scholar]
- Watanabe T, Raff MC. Diffusible rod-promoting signals in the developing rat retina. Development. 1992;114:899–906. doi: 10.1242/dev.114.4.899. [DOI] [PubMed] [Google Scholar]
- Webster J, Prager D, Melmed S. Insulin-like growth factor-1 activation of extracellular signal-related kinase-1 and -2 in growth hormone-secreting cells. Molecular Endocrinology. 1994;8:539–544. doi: 10.1210/mend.8.5.8058064. [DOI] [PubMed] [Google Scholar]
- Wetts R, Fraser SE. Multipotent precursors can give rise to all major cell types of the frog retina. Science. 1988;239:1142–1145. doi: 10.1126/science.2449732. [DOI] [PubMed] [Google Scholar]
- Xie X, Chan KS, Cao F, Huang M, Li Z, Lee A, Weissman IL, Wu JC. Imaging of STAT3 signaling pathway during mouse embryonic stem cell differentiation. Stem Cells Dev. 2009;18:205–214. doi: 10.1089/scd.2008.0152. [DOI] [PMC free article] [PubMed] [Google Scholar]
- Yang XJ. Roles of cell-extrinsic growth factors in vertebrate eye pattern formation and retinogenesis. Seminars in cell & developmental biology. 2004;15:91–103. doi: 10.1016/j.semcdb.2003.09.004. [DOI] [PMC free article] [PubMed] [Google Scholar]
- Yoshimatsu T, Kawaguchi D, Oishi K, Takeda K, Akira S, Masuyama N, Gotoh Y. Non-cell-autonomous action of STAT3 in maintenance of neural precursor cells in the mouse neocortex. Development. 2006;133:2553–2563. doi: 10.1242/dev.02419. [DOI] [PubMed] [Google Scholar]
- Young RW. Cell proliferation during postnatal development of the retina in the mouse. Brain Res. 1985;353:229–239. doi: 10.1016/0165-3806(85)90211-1. [DOI] [PubMed] [Google Scholar]
- Zhang S, Liu M-G, Kano A, Zhan C, Fu X-Y, Barnstable CJ. STAT3 activation in response to growth factors or cytokines participates in retina precursor proliferation. Exp Eye Res. 2005;81:103–115. doi: 10.1016/j.exer.2005.01.016. [DOI] [PubMed] [Google Scholar]
- Zhang SS, Wei JY, Li C, Barnstable CJ, Fu XY. Expression and activation of STAT proteins during mouse retina development. Apr Exp Eye Res. 2003;76:421–431. doi: 10.1016/s0014-4835(03)00002-2. [DOI] [PubMed] [Google Scholar]
- Zhang SS-M, Fu XY, Barnstable CJ. Tissue Culture Studies of Retinal Development. Methods. 2002;28:439–447. doi: 10.1016/s1046-2023(02)00263-3. [DOI] [PubMed] [Google Scholar]
- Zhang SS, Wei J, Qin H, Zhang L, Xie B, Hui P, Deisseroth A, Barnstable CJ, Fu XY. STAT3-mediated signaling in the determination of rod photoreceptor cell fate in mouse retina. Invest Ophthalmol Vis Sci. 2004;45:2407–2412. doi: 10.1167/iovs.04-0003. [DOI] [PubMed] [Google Scholar]
- Zhao S, Barnstable CJ. Differential effects of bFGF on development of the rat retina. Brain Res. 1996;723:169–176. doi: 10.1016/0006-8993(96)00237-5. [DOI] [PubMed] [Google Scholar]