

Abstract
In the retina, the receptive fields (RFs) of almost all ganglion cells (GCs) are comprised of an excitatory center and a suppressive surround. The RF center arises from local excitatory bipolar cell (BC) inputs and the surround from lateral inhibitory inputs. Selective antagonists have been used to define the roles of GABAA and GABAC receptor-mediated input in RF organization. In contrast, the role of glycine receptor (GlyR) subunit specific inhibition is less clear because the only antagonist, strychnine, blocks all GlyR subunit combinations. We used mice lacking the GlyRα2 (Glra2−/−) and GlyRα3 (Glra3−/−) subunits, or both (Glra2/3−/−), to explore their roles in GC RF organization. By comparing spontaneous and visually-evoked responses of WT with Glra2−/−, Glra3−/− and Glra2/3−/− ON and OFF GCs, we found that both GlyRα2 and GlyRα3 modulate local RF interactions. In the On pathway, both receptors enhance the excitatory center response; however, the underlying inhibitory mechanisms differ. GlyRα2 participates in crossover inhibition, whereas GlyRα3 mediates serial inhibition. In the Off pathway, GlyRα2 plays a similar role again using crossover inhibition and enhancing excitatory responses within the RF center. Comparisons of single and double KOs indicate that GlyRα2 and GlyRα3 inhibition are independent and additive, consistent with the finding that they use different inhibitory circuitry. These findings are the first to define GlyR subunit specific control of visual function and GlyRα2 subunit specific control of crossover inhibition in the retina.
Introduction
The spatio-temporal interplay of excitatory and inhibitory inputs underlies both the receptive field (RF) organization and the sustained/transient nature of retinal ganglion cells (GCs). Together they provide the basis for their ability to extract information from the visual scene. Both GABA and glycine inhibition are used to modulate different aspects of GC responses and RF organization (Caldwell and Daw, 1978; Flores-Herr et al., 2001; O’Brien et al., 2003; Chen et al., 2010, 2011). Ionotropic GABA receptors (GABARs) and glycine receptors (GlyRs) are agonist-gated chloride channels that provide the majority of this modulation. Both GABARs and GlyRs are composed of subunit combinations that create inputs with diverse kinetics, agonist affinities and desensitization characteristics (Bormann, 2000; Webb and Lynch, 2007). The availability of selective antagonists have defined the roles of GABAAR and GABACR-mediated inhibition within the retinal circuit (reviewed by Eggers and Lukasiewicz, 2011). They are the receptor targets of amacrine cells (ACs) whose broad lateral processes ramify within a sublamina of the inner plexiform layer (IPL) (MacNeil et al, 1999). GABAergic ACs target GABAARs and GABACRs in reciprocal inhibitory circuits to modulate RF center excitation (Eggers et al, 2007; Grimes et al., 2010). Similarly, they target GABAARs to modulate serial inhibition (Eggers and Lukasiewicz, 2010) to amplify and refine the RF surround (Cook and McReynolds, 1998; Roska et al., 2000; O’Brien et al., 2003).
GlyRs are the targets of glycinergic ACs whose narrow lateral processes ramify across the On and Off IPL sublaminae (MacNeil & Masland, 1998; Menger et al., 1998). GlyR inputs use crossover or feedforward inhibition to modulate GC RF center excitation (Wässle et al., 1986; Stone and Pinto, 1992; MacNeil and Masland, 1998; O’Brien et al., 2003; Chen et al., 2010; Russell & Werblin, 2010). The chloride channels formed by synaptic GlyRs are heteromeric and contain two α and three β subunits (Grudzinska et al., 2005). GlyRs containing different α subunit isoforms (α1, α2, α3, or α4) display distinct IPL and neuronal subtype localization. Specifically, GlyRα1 is the predominant and perhaps only alpha subunit expressed by Off cone and rod bipolar cells (Sassoé-Pognetto et al., 1994; Enz & Bormann, 1995; Cui et al, 2003; Ivanova et al., 2006). Although GlyRα1 modulates a significant inhibitory input to A-type murine GCs, GlyRα2, α3 and α4 also contribute to sIPSCs in these cells (Majumdar et al., 2007). Given the differences in localization, as well as, current decay properties (reviewed by Wässle et al., 2009) it is likely that GlyR subunits like GABAAR and GABAcRs participate in specific inhibitory mechanisms and circuits that control retinal function. Also like GABAARs, a lack of subunit specific antagonists has prevented the definition of individual GlyR subunit specific control of visual function.
Using a molecular genetic approach and GlyRα2 and α3 subunit knockout (KO) mice we defined subunit specific inhibition in GC RF center responses. Our results define for the first time that: (1) GlyRα2 and GlyRα3 inhibition enhance GC RF excitatory center responses; (2) GlyRα2 modulates crossover inhibition in both the On and Off pathways; and (3) GlyRα2 crossover and GlyRα3 serial inhibition are additive and independent in the On pathway.
Materials and Methods
Animals
We used male and female C57BL/6J wild type (WT) mice (Jackson Laboratory) and two KO mouse lines which lacked GlyRα2 (Glra2−/−; Young-Pearse et al., 2006) or GlyRα3 (Glra3−/−; Harvey et al., 2004) subunit expression. The Glra2/3−/− double KO mice were generated by crossing and backcrossing the single KO lines. Genotypes were verified by PCR using primers and cycling conditions published previously (Harvey et al., 2004; Young-Pearse et al., 2006). All mice were maintained at the University of Louisville on a 12:12h light/dark schedule. All experimental procedures were conducted in accordance with regulations described for the ethical care and treatment of animals in the Society for Neuroscience policy on the use of animals in Neuroscience Research and in compliance with a protocol approved by the University of Louisville Institutional Animal Care and Use Committee.
Surgical preparation for electrophysiology recordings from optic nerve fibers
All surgical procedures were performed at light adapted levels and have been previously published (Sagdullaev and McCall, 2005). Briefly, anesthesia was induced with an intraperitoneal injection of a Ringer’s solution containing ketamine and xylazine. In WT mice the induction dose was 127:12 mg/kg. In Glra2−/− and Glra2/3−/− mice an increase of 12.5% was required to induce a surgical plane of anesthesia. Anesthesia was maintained throughout the experiments with supplemental subcutaneous injections (50% of initial concentration) administered every 45 min. The head was secured in a stereotaxic frame (David Kopf Instruments, Tujunga, CA) with ear cups and a bite bar. Body temperature was maintained at 37°C with a feedback controlled heating pad (TC-1000; CWE, Ardmore, PA). Topical Mydfrin (Phenylephrine hydrochloride ophthalmic solution 2.5%) and Mydriacyl (Tropicamide ophthalmic solution 1%; Alcon Labs, Inc., Fort Worth, TX) were applied to dilate the pupils and paralyze accommodation. To prevent drying of the corneas, clear zero-powered lenses (Sagdullaev et al, 2004) moistened with artificial tears (Akwa Tears, Akorn, Inc., Buffalo Grove, IL.) were placed over the eyes. A craniotomy was performed anterior to the Bregma suture and the overlying cortex was removed using suction to expose the optic nerve.
In vivo electrophysiology recordings from optic nerve fibers
Action potentials were recorded extracellularly from single optic nerve axons using sharpened tungsten electrodes (A-M Systems, Inc., Carlsborg, WA.) with a final impedance between 30–100MΩ. A reference electrode was inserted subcutaneously. Action potentials from single GC axons were isolated, amplified (X3+Cell; FHC, Bowdoinham, ME), digitized at 15 kHz (Power1401, CED, UK) and stored for offline analysis. The isolated spikes were simultaneously displayed on an oscilloscope (60MHz, Tektronix Inc., Beaverton, OR) and computer monitor (Spike2, CED, UK) and played over an audio monitor (AM7, Grass Instruments, Quincy, MA) to obtain direct feedback of the cell’s response. Responses were analyzed offline using Spike2 software v4.24 (Cambridge Electronic Design, USA). Spikes were accumulated within a 50ms bin width and displayed as post-stimulus time histograms (PSTHs). Each average PSTH was smoothed by fitting it with a raised cosine function with a 50ms smoothing interval to minimize alteration of the peak firing rate and maximize signal-to-noise ratio (Sagdullaev and McCall, 2005).
Quantitative characterization of GC visual response properties
The spatial extent and RF center sign of each GC was mapped using a handheld light source on a removable screen that covered a CRT display monitor (Eizo E120 FlexScan FXC7, Japan). The screen was located 20–25 cm from the anterior nodal point of the eye. All stimulus and RF dimensions are corrected for monitor distance and are presented in the text in degrees of visual angle.
Receptive field center analysis
Computer generated stimuli (VisionWorks; Vision Research Graphics, ME) were presented on a CRT monitor with a mean luminance of 20cd/m2. Stimulus luminance increased to 100cd/m2 for ON GCs and decreased to 3cd/m2 (67% contrast) for OFF GCs. Stationary spots of increasing outer diameter (eight steps from 4.6° to 52.7°) were centered on the RF and presented in random order with randomly interleaved blank trials. Spots were presented for 2 seconds with a 5 second inter-stimulus interval. The mean spontaneous activity (x̄SA) was measured from “Blank” trials where the monitor luminance was 20cd/m2. The ±3SEM SA was used as criteria to define thresholds for excitatory and suppressive responses.
Both peak and maintained firing rate were plotted as a function of spot diameter and formed an area response function (ARF; Figure 1A). We used the ascending limb of the ARF and its slope to evaluate spatial summation within the RF center, which results from the recruitment of excitatory BC input. The stimulus that elicited the maximum excitatory response defined the RF center diameter and is referred to as the optimal spot.
Figure 1. Representative area response function and PSTH response quantification during receptive field center stimulation.
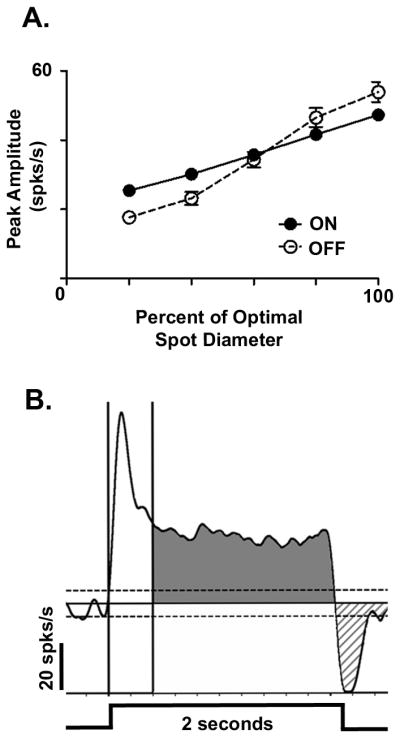
(A) Representative area response functions (ARFs) for WT ON (filled circle) and OFF (open circle) GCs. These ARFs plot the peak amplitude of the GC excitatory response as a function of the spot outer diameter up to the maximum response, which represents the spot diameter that matches the receptive field center size. This spot diameter is referred as the optimal spot. (B) A representative PSTH from a sustained ON GC to an optimal spot presented for a duration of 2 sec (stimulus profile bottom of PSTH). The excitatory response begins when the firing rate crosses above +3SEM of the mean spontaneous activity (x̄SA, upper dotted line) and ends when the response returns to the x̄SA (solid line). The vertical cursors define the transient response component (0–0.4sec). The shaded region represents the maintained response component (0.4–2.0sec). The hatched region represents response suppression at stimulus offset which begins when the spiking rate drops below −3SEM x̄SA (lower dotted line) until the response returns to the x̄SA.
Excitatory response characteristics
We quantitatively characterized several aspects of the excitatory response from the average PSTH evoked by the optimal spot (Figure 1B). Onset latency was defined as the time from stimulus onset until the time when the response rose to 3SEM above x̄SA. Excitatory response duration was defined as the duration from response onset to offset, when the response decreased below x̄SA. The total excitatory response was defined as the area that remained 3SEM above x̄SA. In WT GCs, the total excitatory response consisted of two components, a transient peak component (0–0.4 sec, Figure 1 white region), which then decayed to 37% of peak (or 1/e) and a maintained component whose duration varied (>0.4 to ≤ 2.0 sec, Figure 1 grey region). Sustained cells were defined as those whose excitatory response remained 3SEM above mean spontaneous level for the entire duration of stimulus presentation (2 seconds). Transient cells had excitatory responses that returned to the mean spontaneous level at ≤1.7 seconds. We found no ganglion cells whose response durations were between >1.7 and <2.0 seconds.
Suppressive response characteristics
Using the same average PSTH, we quantified several aspects of response suppression that occurred at stimulus offset (Figure 1B, hatched region). Onset latency of suppression was defined as the time from stimulus offset until the time when the response decreased below x̄SA. The duration of response suppression was defined as the duration from onset latency of suppression until the response rose to x̄SA. The total magnitude of suppression was defined as the area when the response remained below x̄SA.
Immunohistochemistry
We examined the morphology of both single and double KO retinas using fluorescence immunohistochemistry (Gregg et al., 2007). Retinas were removed from the eyecup, fixed 15–20 minutes in 4% paraformaldehyde in 0.1M phosphate buffer (PB), pH 7.4, cryoprotected through a graded series of sucrose (Barthel and Raymond, 1990) and embedded in OCT:20% sucrose (2:1) (Sakura Finetek, Torrence, CA). Retinas from all four genotypes were stacked together in the same mold and frozen in OCT:20% sucrose (2:1). Twenty-five micron transverse sections were cut through all four retinas on a CM 1850 cryostat (Leica, Germany) and mounted on microscope slides (Superfrost/Plus, Fischer Scientific, Pittsburgh, PA, USA). This ensured that each section was reacted under the same experimental protocol and was reacted with the exact same antibody concentration. Slides were brought to room temperature (RT), incubated in blocking solution: 10% normal goat serum (NGS), 0.5% Triton-X 100 in PBS for 60 minutes and incubated with primary antibodies (diluted in blocking solution) at RT overnight. A mouse monoclonal antibody to GlyRα1 (1:100; Synaptic Systems), goat polyclonal antibody to GlyRα2 and GlyRα3 (both1:50; Santa Cruz Biotechnology) and rabbit polyclonal antibody to GlyRα4 (1:100; Chemicon) labeled individual GlyR α subunits in WT, single and double KO retinas. A rabbit polyclonal antibody to calbindin (D-28k) (1:1000; Swant) labeled the sublamination pattern of the IPL. Sections were washed in PB and incubated in the secondary antibodies goat anti-mouse, donkey anti-goat and goat anti-rabbit Alexa 488 in blocking solution for 90 minutes. Sections were coverslipped with Immuno-Mount (Thermo Electron Corporation, Pittsburgh, PA, USA) and images were taken on an Olympus BX51WI confocal microscope equipped with a Hamamatsu CCD EM Digital Camera using a 40x PLAPO WLSM objective and FluoView v5.0 software (Olympus Corporation).
Isolation of RNA and reverse transcription
Both retinas were removed from WT and Glra3−/− mice and pooled. Total RNA was extracted from each sample using TRI Reagent® (1.0ml/2 retinas) and purified using RiboPure™ Kit (Ambion, Austin, TX). The quantity and quality of the RNA was determined using a NanoDrop 2000 spectrophotometer (Thermo Fisher Scientific, Waltham, MA). First-strand cDNA synthesis was performed by a reaction of 350 ng of total RNA from each sample using the SuperScript™ III Reverse Transcriptase (Invitrogen, Carlsbad, CA).
Real-Time PCR
Real-Time PCR was performed on a total of 20 μl of cDNA in reaction mix in 96-well plates using 7900HT Fast Real-Time PCR System (Applied Biosystems, Beverly, MA). Each 20 μl reaction mixture included: 1μl cDNA, 2 μl TaqMan® Fast Universal PCR Master Mix and 0.5μl 20X TaqMan® assay containing either GlyRα2 or 18s RNA primer sets (GlyRα2, Mm00806742_m1; 18s, Mm03928990_g1; Applied Biosystems, Beverly, MA). For each cDNA sample, three to four PCR replicates were performed using each primer set. The PCR parameters were incubation at 50°C for 2min, denaturation at 95°C for 10 min, and 40 cycles of 95°C for 15sec and 60°C for 1 min. ΔCT of GlyRα2 in each cDNA sample was normalized to the rRNA 18s as an endogenous control as follows:
Here CT is the cycle threshold. The ΔCT ratio was obtained by dividing each ΔCT by the lowest ΔCT from the results. The ΔCT ratios of WT and Glra3−/− mice were compared using a nonparametric t-test to examine differences in transcriptional level of GlyRα2.
Statistical analyses
Statistical analyses were performed using GraphPad Prism5 Software v5.04 for Windows (San Diego, CA, USA). Distributions of each response component were tested for normality using the D’Agostino and Pearson omnibus test. The distributions of our quantitative responses across GC types and mouse strains were not normal. As a consequence, wherever possible, we used non-parametric statistical analyses to test for differences. We compared each single KO to WT and double KOs to each single KO using an unpaired t-test with Welch’s correction (t-test with Welch’s). Because our sample size across spot diameter satisfies the central limit theorem we used a two-way ANOVA to compare responses across spot diameter between genotypes. A linear regression analysis was used to compare changes in the slope of the RF center summation between genotypes. We used a Chi square analysis to determine any differences in the distributions of transient versus sustained OFF GCs between genotypes. Significance is indicated as *p<0.05, **p<0.01, ***p<0.001 and data in graphs represent ± SEM.
Results
Normal inner retinal morphology is retained in the absence of GlyRα2, GlyRα3 or both receptor subunits
In the Glra3−/− mice used in these studies, the absence of GlyRα3 retinal expression has been previously demonstrated (Harvey et al., 2004). In the Glra2−/− mice used here, the absence of retinal expression was verified at the transcription level at P0 (Young-Pearse et al., 2006). We used immunostaining with subunit specific antibodies to confirm the absence of GlyRα2 and GlyRα3 expression in adult Glra2−/− (Figure 2, row 2), Glra3−/− (row 3) and Glra2/3−/− (row 4) retina sections compared to WT (Figure 2, row 1). Each single KO lacked the characteristic immunoreactivity of its deleted GlyR α subunit, and the double KO exhibited neither GlyRα2 nor GlyRα3 staining. In both the single and the double KO retinas, the expression patterns of the GlyRα1 and GlyRα4 subunits did not differ from WT (Figure 2, columns 1 and 4). Because GlyR α subunits are expressed primarily in the IPL, we examined and compared the calbindin sublamination pattern in the IPL across WT, single and double KO retinas. Retinas from all four genotypes showed three clear calbindin immunoreactive bands (Figure 2, column 5). Thus, the gross morphology of the inner retina appears intact regardless of the absence of GlyRα2, GlyRα3, or both subunit expression. The GlyRα3 antibody labels four discrete bands in the IPL (Haverkamp et al., 2003) and although moderate upregulation of GlyRα2 expression has been reported across the IPL in the absence of GlyRα3 (Heinze et al., 2007) this difference was not evident in our immunohistochemical analysis.
Figure 2. GlyR α subunit expression across WT, Glra2−/−, Glra3−/− and Glra2/3−/− retinas.

(A–T) Representative confocal images of transverse retinal sections (25 μm) reacted with one of four GlyR α subunit specific antibodies. INL= inner nuclear layer; IPL= inner plexiform layer; GCL= ganglion cell layer. Scale bar 20μm. GlyRα1 immunoreactive puncta are prominent in the outer strata of the IPL across all genotypes. (A–D) Representative confocal images of GlyRα2 immunoreactive puncta are diffuse across all IPL strata in WT and Glra3−/− retinas (E&G) and are absent in Glra2−/− and Glra2/3−/− retina (F&H). GlyRα3 immunoreactive puncta label four bands in the IPL of WT and Glra2−/− retinas (I&J) and are absent in the Glra3−/− and Glra2/3−/− retina (K&L). GlyRα4 immunoreactive puncta are localized to a distinct band within the IPL in all genotypes (M–P). Retinas of all genotypes were reacted with an antibody to calbindin (red) and illustrate that IPL sublamination patterns are similar across genotype (Q–T).
GlyRα2 transcription levels are not altered in Glra3−/− mice
We used real time PCR to examine the expression of the Glra2 gene in WT retina and to determine whether it is upregulated in Glra3−/− retina. Our results show that the level of GlyRα2 mRNA in WT (n=9) and Glra3−/− (n=8) retinas (ΔCT ratio) was similar (WT, 1.029 ± 0.01; Glra3−/−, 1.046 ± 0.016; p=0.13). The electrophysiological data presented below are consistent with this result and suggest that there is no upregulation of GlyRα2 in the absence of GlyRα3.
GlyR subunit specific inhibition enhances ON and OFF GC spontaneous activity but does not alter receptive field center size
Because little is known about the role of GlyR subunits in GC spontaneous or visually-evoked responses, we examined and compared the responses of GCs using spot stimuli of varying diameter to probe their RF center response. We divided GCs into those with ON-center (ON) or OFF-center (OFF) RFs and their responses into excitatory and suppressive phases (see Figure 1B). Representative responses of each GC class recorded from all four genotypes are shown in the average PSTHs of Figure 3. Raster plots above each PSTH indicate their individual spiking responses to individual stimulus presentations. Among our 292 WT ON GCs we found only 10 cells with transient responses. We divided the excitatory responses of OFF GCs into transient and maintained components relative to the presence of the stimulus. For each GC response characteristic, we compared WT ON or OFF GCs (Figure 3Ai, Bi and Ci) to GCs from each single KO (Figure 3Aii–Ciii). This allowed us to determine whether one or both subunits modulated the response. We used comparisons of GC responses between single (Figure 3Aii–Ciii) and double KOs (Figure 3Aiv–Civ) to evaluate whether GlyRα2 and GlyRα3 inhibition were independent. Finally, we compared changes in excitatory and suppressive responses in an attempt to determine the synaptic circuit(s) that could account for the changes observed.
Figure 3. Receptive field center excitatory responses of ON, OFFsustained and OFFtransient GCs across genotype.

Average PSTHs for ON and OFF GCs evoked by their optimal spot are shown along with the eight individual responses in raster plots (above). The stimulus profile (2 second duration) is shown at the bottom of each column. For ON GCs a bright spot (100cd/m2) was presented and for OFF GCs a dark spot (3cd/m2) was presented on a screen whose average luminance was (20 cd/m2. Scale bar=20 spikes/second). (Ai–Aiv) ON GCs of all genotypes increase spiking at the onset of a bright spot and their excitatory response remains above the mean spontaneous activity (dashed line) for the entire duration of the stimulus. (B & C) OFF GCs increase spiking at the onset of dark spot centered on their RFs and can be divided by the duration of their response compared to the stimulus. (Bi–Biv) OFFsustained GCs respond for the entire duration of the stimulus presentation. (Ci–Civ) OFFtransient GC responses declines to mean SA before stimulus offset (≤ 1.70 sec).
The spontaneous activity (SA) of OFF GCs was significantly lower than ON GCs in WT as well as all knockouts. The SA of Glra3−/− ON GCs was significantly lower than that of WT ON GCs (Figure 4A; 24.5 ± 1.2; n=94 vs. 28.5 ± 0.8 spikes/sec; n=291; p=0.005). The SA of Glra2−/− OFF GCs was significantly lower than that of WT OFF GCs (Figure 4B; 4.1 ± 0.4; n=57 vs. 6.8 ± 0.3 spikes/sec; n=174; p<0.001). The SA of Glra2/3−/− ON (27.1± 2.5 spikes/sec; n=46) and OFF (4.7 ± 0.5 spikes/sec; n=47) GCs were similar to single KO ON (Glra2−/−, p=0.70; Glra3−/−, p=0.30) and OFF GCs (Glra2−/−, p=0.47; Glra3−/−, p=0.08) (Figure 4A and B). Our results indicate that GlyRα3 and GlyRα2 subunits provide pathway specific tonic inhibition. GlyRα3 acts within the On pathway, whereas GlyRα2 acts within the Off pathway. Each serves to enhance the tonic spontaneous firing rate of GCs in the WT retina. In light of this finding in the subsequent analyses, SA was subtracted from evoked GC responses in all genotypes.
Figure 4. GlyRα3 expression selectively governs ON and GlyRα2 expression governs OFF GC spontaneous activity.
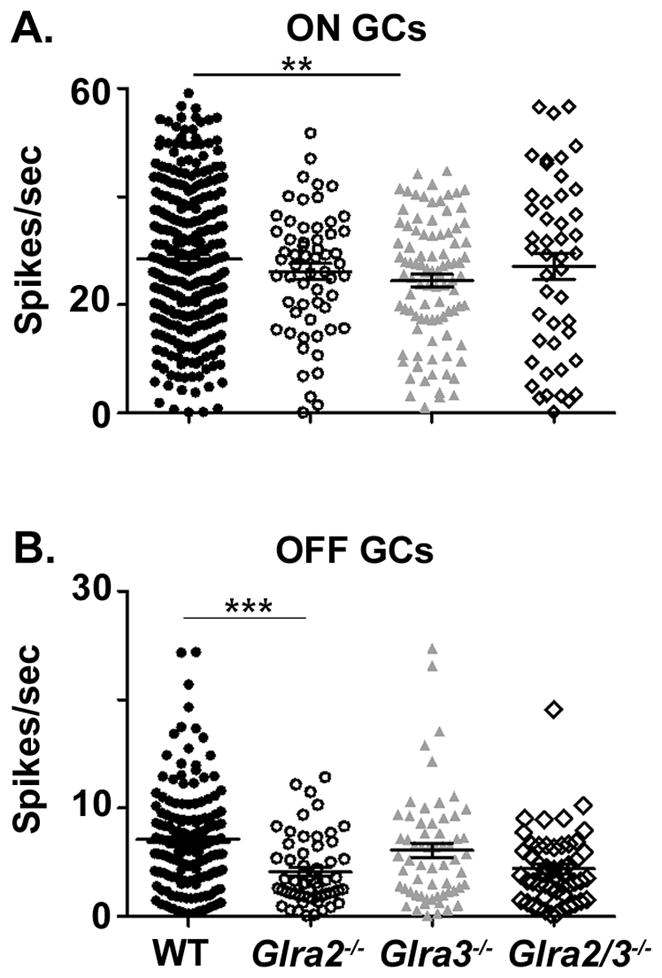
(A) ON GCs. Spontaneous activity is significantly lower in Glra3−/− ON GCs (grey triangles, n=94) compared to WT (filled circles, n=291) but is similar between WT and Glra2−/− ON GCs (open circles, n=58). The spontaneous activity levels do not differ between double KO (open diamonds, n=46) and single KOs. (B) OFF GCs. Spontaneous activity is significantly lower in Glra2−/− OFF GCs (open circles; n=57) compared to WT (filled circles, n=171) but similar between WT and Glra3−/− OFF GCs (grey triangles, n=61). The spontaneous activity levels in double KO (open diamonds, n=47) are similar to Glra2−/− OFF GCs and therefore significantly lower compared to Glra3−/− OFF GCs.
The RF center diameters of Glra2−/− and Glra3−/− ON (Figure 5A) and OFF (Figure 5B) GCs were similar to WT (Table 1; ON; p=0.11, p=0.51, OFF, p=0.56, p=0.08). The RF diameters of ON single and double KO GCs also were similar (p=0.50, p=0.95). The mean RF diameters of double KO OFF GCs while similar to Glra2−/− (p=0.44) were significantly larger than Glra3−/− (p=0.005). Our results are primarily consistent with previous studies that GlyR modulation does not contribute significantly to RF center spatial tuning (O’Brien et al., 2003; Manookin et al., 2008; van Wyk et al., 2009; Chen et al., 2010). The difference that we observe in the RF diameters of the double KO OFF GCs could be confounded with their generally low response amplitudes and more transient responses, which could lead to the need for larger spots to obtain responses significantly above SA.
Figure 5. Receptive field center diameter is not affected by the absence of either GlyRα2 or GlyRα3 expression.

(A) ON GCs. The receptive field (RF) center diameter of both single KO ON GCs (Glra2−/−, open circles, n=59; Glra3−/−, grey triangles, n=95) are similar to WT (closed circles, n=292). The RF center diameter of double KO ON GCs (open diamonds, n=47) was similar to both single KO ON GCs. (B) OFF GCs. The RF center diameter of both single KO OFF GCs (Glra2−/−, open circles, n=57; Glra3−/−, grey triangles, n=61) are similar to WT (closed circles, n=174). The RF center diameter double KO OFF GCs (open diamonds, n=51) are similar to Glra2−/− OFF GCs but are significantly larger than Glra3−/− OFF GCs.
Table 1. Receptive field center diameter (degree of visual angle).
The spot outer diameter that elicited the maximum spiking response for ON and OFF GCs is an estimate of the receptive field (RF) center diameter for each genotype. The mean RF diameter (x̄), ± standard error (±SE) and the total number (n) of cells are presented for each genotype. RF dimensions are corrected for monitor distance and are presented in degrees of visual angle.
| GC Class | WT | Glra2−/− | Glra3−/− | Glra2/3−/− | ||||||||
|---|---|---|---|---|---|---|---|---|---|---|---|---|
| x̄ | ± SE | n | x̄ | ± SE | n | x̄ | ± SE | n | x̄ | ± SE | n | |
| ON | 20.8 | 0.7 | 292 | 17.4 | 1.1 | 59 | 20.3 | 1.2 | 95 | 19.5 | 1.6 | 47 |
| OFF | 20.5 | 0.7 | 174 | 21.4 | 1.4 | 57 | 18.0 | 1.2 | 61 | 24.7 | 1.9 | 51 |
WT ON GCs receptive field center excitation is enhanced by both GlyRα2 and GlyRα3 inputs
The onset of a stationary bright spot whose dimensions are within or match the RF center evokes an excitatory response in WT ON GCs. In the overwhelming majority of WT ON GCs in our sample (282/292) this excitatory response has an initial transient peak within 0.40 sec of stimulus onset (Figure 6Ai, left) followed by a maintained excitation that is temporally matched to the stimulus (2 sec) (Figure 6Aii left). The remaining ten WT ON GCs had only a transient peak.
Figure 6. Both GlyRα2- and GlyRα3-mediated inhibition enhances the receptive field center responses of ON GCs.

(Ai–ii) Representative PSTHs of WT, single and double KO ON GCs receptive field (RF) responses. (Ai) Shaded regions represent the transient (0–0.4s) response component and (Aii) the maintained response component (0.4–2s). (Bi) The scatter plot shows the distribution of the peak amplitude responses across genotype and the differences across genotype. The peak amplitude of both Glra2−/− (open circles, n=59) and Glra3−/− ON GCs (grey triangles, n=95) is lower than WT (closed circles, n=292). Glra2/3−/− ON GCs (open diamonds, n=47) is lower than both single KOs. (Bii) The mean ARFs for each genotype. RF diameter is normalized so that optimal diameter is plotted at 100%. The slope represents the rate of change in peak amplitude during RF center summation and is similar between WT and single KO (p=0.07) but differs between single and double KOs (p=0.0009). All curves were analyzed using a linear regression and the goodness of fit for all genotypes, R2 =0.99. (Ci) The scatter plot shows the distribution of maintained firing rates across genotype and the differences across genotype. The maintained firing rates are lower in Glra2−/− (open circles, n=57) and Glra3−/− (grey triangles, n=90) compared to WT (closed circles, n=289) and lower in Glra2/3−/− (open diamonds, n=34) compared to single KO ON GCs. (Cii) The mean ARFs for each genotype. RF diameter is normalized so that optimal diameter is plotted at 100%. The slope represents the rate of change in maintained firing rate during RF center summation and is similar between WT and single KO (p=0.30) but differs between single and double KOs (p<0.0001). All curves were analyzed using a linear regression and the goodness of fit for all genotypes, R2 =0.98. Scale bar=20 spikes/second
The transient peaks of both Glra2−/− (41.0 ± 2.2 spikes/sec; n=59) and Glra3−/− ON GCs (43.0 ± 1.7 spikes/sec; n=95) were significantly lower than WT ON GCs (Figure 6Bi; 47.3 ± 1.2 spikes/sec; n=292; p=0.02 and p=0.04, respectively). The maintained firing rates of both Glra2−/− (13.4 ± 1.3 spikes/sec; n=57) and Glra3−/− ON GCs (14.7 ± 1.0 spikes/sec; n=90) also were significantly lower than WT ON GCs (Figure 6Ci; 17.8 ± 0.7 spikes/sec; n=289; p=0.005 and p=0.01, respectively). The difference in both peak and maintained firing rates are evident for both Glra2−/− and Glra3−/− GCs across spot diameters smaller than the RF center, although only the maintained rates are significantly lower (Figure 6Cii; p<0.01). These results suggest that the input of both GlyRα2 and GlyRα3 subunits augments the total excitatory response in WT ON GCs.
The peak amplitude (30.0 ± 2.3 spikes/sec; n=47) and maintained firing rates (7.0 ± 1.0 spikes/sec; n=34) of Glra2/3−/− ON GCs were significantly lower than either single KO (Figure 6Bi and Ci; p<0.001). This result indicates that GlyRα2 and GlyRα3 subunit inputs separately contribute to the RF center excitatory response of WT ON GCs. They also indicate that the two subunit inputs cooperate to enhance both RF center excitation and the sustained nature of ON GC response (See Figures 10A & C).
Figure 10. GlyRα2 and GlyRα3 mediate inhibition using different inhibitory circuits.

Schematic diagrams of the proposed roles of GlyRα2 and GlyRα3 in the WT mouse On and Off retinal pathways. Each diagram illustrates a basic retina circuit that is consistent with the results presented. The diagrams in the upper right corner illustrate the stimulus and the timing of its onset and offset. Within each circuit the numbered boxes represent the current evoked at stimulus onset and offset. N.B., currents are represented with transient time course for simplicity. The currents in the boxes do not reflect the temporal properties of the currents, as described in the results. A. GlyRα2 mediates cross-over inhibition from the Off to the On pathway. At stimulus onset (white bar), the narrow field amacrine cell (NFAC) is driven by an OFF cone bipolar cell (CBC) (Box 1), which produces a small outward current (Box 2). The NF AC, using a crossover inhibitory mechanism inverts the polarity of the current via GlyRα2 (blue), producing a current in the ON GC (Box 4) that enhances the current from its presynaptic ON CBC (Box 3). At stimulus offset (grey bar) a similar mechanism transfers an inverted polarity current from the Off to the On pathway which enhances post-stimulus suppression. The spiking response of the GC is governed by the summation of the inputs (Box 5). B. GlyRα2 mediates crossover inhibition from the On to the Off pathway. Similar to the description in A, at stimulus onset (gray bar), the NFAC is driven by an ON CBC (Box 1), which produces a small outward current (Box 2). The NF AC, using a crossover inhibitory mechanism inverts the polarity of the current via GlyRα2 (blue), producing a current in the OFF GC (Box 4) that enhances the current from its presynaptic OFF CBC (Box 3). At stimulus offset (white bar) a similar mechanism transfers an inverted polarity current from the Off to the On pathway which enhances post-stimulus suppression The spiking response of the GC is governed by the summation of the inputs (Box 5). C. GlyRα3 mediates serial inhibition in the On pathway: At stimulus onset (white bar), ON CBCs depolarize (Boxes 1a & 1b, represent currents in all CBCs). The ON CBC (far left) targets an ON AC producing an inward current (Box 2). Using GlyRα3 (green) this distal ON AC produces an outward current in the proximal ON AC (Box 4), which is summed with the inward current produced via input from its presynaptic ON CBC (Box 3). The proximal ON AC targets either the ON CBC (far right) at a GABA receptor (purple) or an ON GC at either a GABA receptor (purple) or a GlyRα1R (red). Because the proximal ON AC output is controlled by its ON AC inhibitory input the outward current (Box 5) is small. Depending on the postsynaptic target of the proximal ON AC, the GCs total current (Box 6) reflects either the input from its presynaptic CBC (Box 1b) OR from the inputs from its presynaptic CBC and ON AC (Box 5).
WT ON GC response suppression at stimulus offset is specific to GlyRα2 inputs
Like most mammalian GCs, the spiking activity of WT mouse ON GCs is suppressed below spontaneous levels at stimulus offset (post-stimulus suppression; Figure 7A left). In our WT sample, ON GCs remain suppressed on average for 0.66 sec after stimulus offset. The etiology of this suppression is not completely understood. A feedforward glycinergic input to ON GCs at stimulus offset has been shown to be generated by the Off pathway and hypothesized to use a crossover inhibitory mechanism (Chen et al., 2010).
Figure 7. Only GlyRα2-mediated inhibition modulates post-stimulus suppression in ON GCs.
(A) Representative PSTH responses of WT and single double KO ON GCs during RF center stimulation with a bright (100cd/m2) spot. The shaded regions represent post-stimulus suppression at the offset of the stimulus (background 20cd/m2). (B) A scatter plot shows the distribution of the area of post-stimulus suppression (spikes × sec) across genotype which is significantly lower in Glra2−/− (open circles, n=57) compared to WT (closed circles, n=284) but similar in Glra3−/− ON GCs (grey triangles, n=84). The area of post-stimulus suppression did not differ between and Glra2/3−/− (open diamonds, n=41) and Glra2−/− ON GCs, but was significantly lower compared to Glra3−/− ON GCs. Scale bar=20 spikes/second.
To test the hypothesis that GlyRα2 and/or GlyRα3 mediate this input, we compared total post-stimulus suppression in ON GCs in each single KO to WT. Consistent with a mechanism mediated by GlyRα2, Glra2−/− ON GCs show less post-stimulus suppression compared to WT ON GCs (Figure 7B; 3.4 ± 0.4; n=57 vs. 4.5 ± 0.3 (spikes × sec; n=284; p=0.01). Post-stimulus suppression in Glra3−/− ON GCs was similar to WT (Figure 7B; 5.4 ± 0.5 (spikes × sec; n=84; p=0.13). Post-stimulus suppression in double KO ON GCs is similar to Glra2−/− ON GCs (Figure 7B; 2.6 ± 0.4 (spikes × sec; n=41; p=0.17) and significantly lower than Glra3−/− ON GCs (p<0.001). These changes most likely do not result from differences in SA levels. Although the SA of GlyRα3 ON GCs is lower compared to WT, their post-stimulus suppression is similar to WT. In contrast, the SA of GlyRα2 ON GCs is similar to WT whereas their post-stimulus suppression is significantly less compared to WT.
In summary, both the RF center excitatory response at stimulus onset and response suppression at stimulus offset are lower in Glra2−/− ON GCs compared to WT. In Glra3−/−ON GCs only the RF center excitatory response is lower. Combined with our results for double KO ON GCs, which show an even greater change in RF excitation than either single KO suggest that GlyRα2 and GlyRα3 inputs work independently in the On pathway albeit to the same purpose, to enhance and extend RF center excitation.
WT OFF GC temporal responses are modulated by GlyRα2 input
The onset of a dark spot of standing contrast whose dimensions are within or match the RF center evokes an excitatory response in WT OFF GCs. Like their WT ON counterparts, WT OFF GCs show an initial transient peak within 0.40 sec of stimulus onset (Figure 8Ai left). In 77% of WT OFF GCs (134/174) this is followed by a maintained excitation that is temporally matched to the stimulus (see Figure 3Bi), whereas in the other 23% the excitatory response declines to SA level before stimulus offset at around 1.70 sec (see Figure 3Ci). Previous publications also have described two functional types of WT OFF mouse GCs (Pang et al., 2003; Murphy and Rieke, 2006; van Wyk et al., 2009) although the stimulus durations they used were significantly shorter than two seconds. Although the identity of the GCs sampled in our extracellular optic nerve recordings are not known, we assume that they are A-type for the following reasons. Optic nerve recordings target GCs with the largest axons (Boycott & Wässle, 1974). Optic nerve recordings only sample responses of ON- and OFF-center GCs. The GCs recorded have brisk visually-evoked responses and linear RF center summation (Kuffler, 1953; Enroth-Cugell & Robson, 1966).
Figure 8. Only GlyRα2-mediated inhibition modulates the receptive field center responses of OFF GCs.

(Ai–ii) Representative PSTH responses of WT, single and double KO ON GCs during receptive field (RF) center stimulation with a dark (3cd/m2) spot. The shaded regions represent the transient (0–0.4s) and maintained (0.4–2s) components of the excitatory response. (Bi) The scatter plot shows the distribution of peak amplitude responses across genotype and the differences across genotype. The peak amplitude of both Glra2−/− (open circles, n=57) and Glra3−/− (grey triangles, n=61) is similar compared to WT (closed circles, n=174). Glra2/3−/− OFF GCs (open diamonds, n=51) is lower compared to Glra3−/− but similar to Glra2−/− OFF GCs. (Bii) The mean ARFs for each genotype. RF diameter is normalized so that the optimal diameter is plotted at 100%. The slope represents the rate of change in peak amplitude during RF center summation and is similar between WT and single KO (p=0.35) and single and double KOs (p=0.08). All curves were analyzed using a linear regression and the goodness of fit for all genotypes, R2 =0.98. (Ci) The scatter plot shows the distribution of maintained firing rate across genotype and the differences across genotype. The maintained firing rates are lower in Glra2−/− OFF GCs (open circles, n=52) compared to WT (closed circles, n=167) but similar in Glra3−/− OFF GCs (grey triangles, n=59) compared to WT. The maintained firing rate also in Glra2/3−/− (open diamonds, n=42) is lower than Glra3−/− OFF GCs similar to Glra2−/−OFF GCs. (Cii) The mean ARFs for each genotype. RF diameter is normalized so that optimal diameter is plotted at 100%. The slope represents the rate of change in the maintained firing rate during RF center summation. The slope differs between Glra2−/− and WT OFF GCs (p=0.01) but is similar between Glra3−/− and WT (p=0.71) OFF GCs. The slopes did not differ between single and double KOs OFF GCs (p=0.07). All curves were analyzed using a linear regression and the goodness of fit for all genotypes, R2 =0.95. Scale bar=20 spikes/second.
Across Glra2−/−, Glra3−/− and Glra2/3−/− OFF GCs we found both sustained and transient GCs (Figure 3Aii–Civ) and their proportions in Glra3−/− OFF GCs were similar to WT (Table 1). In contrast, Glra2−/− and Glra2/3−/− OFF GCs had more transient than sustained responses compared to WT (Table 2; Glra2−/−, p= 0.01; Glra2/3−/−, p ≤ 0.001; Χ2). As a consequence, we did not use a sustained/transient criterion to group OFF GCs. Instead we compared all OFF GCs in KO mice to WT to define general trends in the contribution of GlyRα2 and GlyRα3 inhibition.
Table 2. Proportion of OFF GCs with sustained or transient responses across genotype.
The proportions of OFF sustained and OFF transient GCs are given for each genotype. The proportions of OFF sustained and OFF transient GCs are similar between WT and Glra3−/−. In contrast, Glra2−/− and Glra2/3−/− OFF GCs have more transient than sustained GCs compared to WT.
| Sustained | Transient | Total OFF GCs | |
|---|---|---|---|
| WT | 77% (n=134) | 23% (n=40) | 134 |
| Glra2−/−* | 60% (n=34) | 40% (n=23) | 57 |
| Glra3−/− | 75% (n=46) | 25% (n=15) | 61 |
| Glra2/3−/−* | 45% (n=23) | 55% (n=28) | 51 |
WT OFF GC receptive field center excitation is modulated by GlyRα2 input
The transient peak response of Glra3−/− and WT OFF GCs RF center responses at both the optimal and across spot diameters were similar (Figure 8Ai, Bi; 52.7 ± 4.3; n=61 vs. 47.0 ± 2.0 spikes/sec; n=174; p=0.22) as were their maintained firing rates (Figure 8Ai, Ci; 6.2 ± 0.7; n=59 vs. 6.5 ± 0.4 spikes/sec; n=167; p=0.80). These similarities were maintained across all spot diameters within the RF center (Figure 8Bii and Cii; p>0.05 for both). No other differences were noted in any aspect of the RF center response at stimulus onset or offset, leading to the conclusion that GlyRα3 input does not modulate OFF GC RF center responses.
The transient peak response of Glra2−/− OFF GCs at all spot diameters within the RF center were similar to WT (Figure 8Bi; optimal, 42.0 ± 3.0 spikes/sec; n=57; p = 0.20; all diameters, Figure 8Bii; p>0.05). The maintained firing rates of Glra2−/− OFF GC RF center excitatory responses were significantly lower than WT OFF GCs both at the optimal (Figure 8Aii, Ci; 4.5 ± 0.6; n=52 vs. 6.5 ± 0.4 spikes/sec; n=167; p=0.009) and across all spots diameters within the RF center (Figure 8Cii; p<0.001). The difference in the maintained response component causes the increase in transient GlyRα2 OFF GCs compared to WT described above.
Both the peak RF center response of double KO OFF GCs (Figure 8Ai, Bi; peak: 36.0 ± 3.1 spikes/second; n=51; p=0.17) and the maintained response were similar to Glra2−/−OFF GCs (Figure 8Ci; maintained: 3.7 ± 0.7 spikes/sec; n=42; p=0.40). Consequently, they were significantly lower compared to Glra3−/− OFF GCs (p=0.002 and p=0.02, respectively).
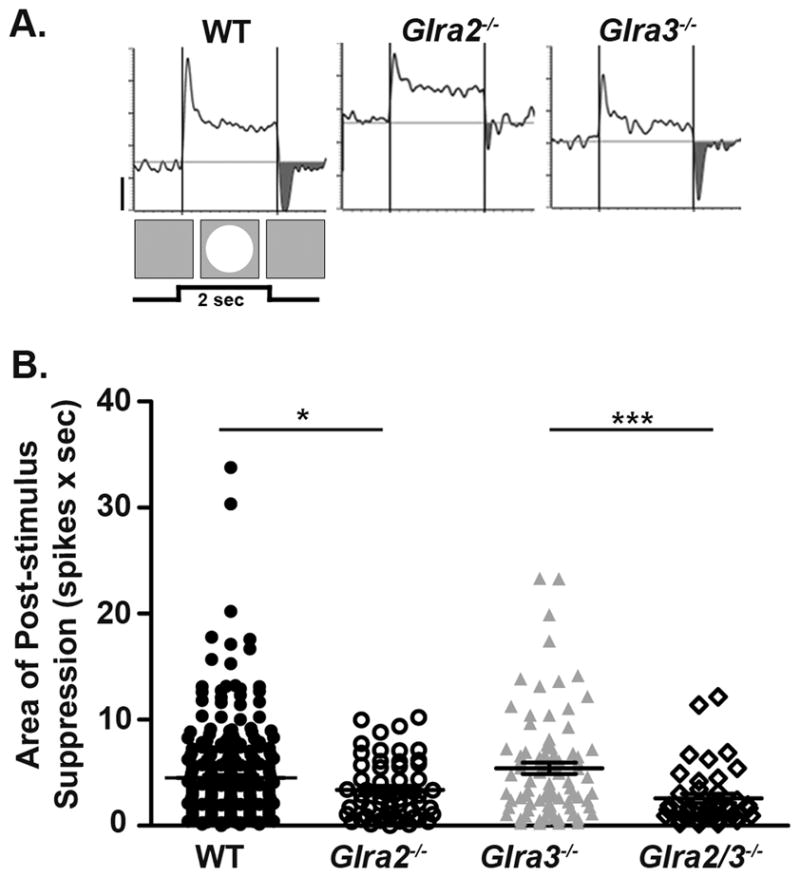
OFF GCs also exhibit response suppression at stimulus offset (Figure 9A). Glra2−/− OFF GCs had significantly less post-stimulus suppression compared to WT (Figure 9B; 0.8 ± 0.1; n=56 vs. 1.7 ± 0.1 (spikes × sec; n=168; p<0.001). Post-stimulus suppression in Glra3−/− OFF GCs was similar to WT OFF GCs (Figure 9B; 2.2 ± 0.3 (spikes × sec; n=59; p=0.06). Post-stimulus suppression in double KO OFF GCs (1.1 ± 0.2 (spikes × sec; n=50) was similar to Glra2−/− OFF GCs (p=0.10) and as a consequence lower than Glra3−/− OFF GCs (p=0.001).
Figure 9. Only GlyRα2-mediated inhibition modulates post-stimulus suppression in OFF GCs.

(A) Representative PSTH responses of WT and single KO OFF GCs during receptive field center stimulation with a dark (3cd/m2) spot. The shaded regions represent post-stimulus suppression at the offset of the stimulus (background 20cd/m2). (B) A scatter plot shows the distribution of the area of post-stimulus suppression (spikes × sec) across genotype which is lower in Glra2−/− (open circles, n=56) compared to WT OFF GCs (closed circles, n=168) but similar in Glra3−/− OFF GCs (grey triangles, n=59). The area of post-stimulus suppression in Glra2/3−/− OFF GCs (open diamonds, n=50) is lower than Glra3−/−OFF GCs but similar to Glra2−/− OFF GCs. Scale bar=20 spikes/second.
Our results demonstrate a novel role for GlyRα2-mediated inhibition in modulating the RF center response of WT OFF GCs and relative to GlyRα3-mediated inhibition the only one that modulates WT OFF GC responses. The exact role of GlyRα1 input, which is the predominant glycinergic synaptic input to mouse rod and cone Off bipolar cells as well as A-type GCs (Majumdar et al., 2007) remains to be defined and will require conditional elimination of its expression. The differences that we observed for GlyRα2 in ON GCs, namely less excitation and less suppression are the same that we observe in OFF GCs. This indicates that GlyRα2 uses a similar inhibitory mechanism in both pathways to the same end, to enhance the excitatory RF center response and match it to stimulus duration.
Discussion
GlyRα2 and GlyRα3 subunit specific modulation of ON and OFF GC RF center temporal responses
Our results show GlyRα2 subunit specific control over the maintained component of the RF center response of OFF GCs to stimulus onset and post-stimulus suppression. In this pathway, GlyRα2 functions to enhance GC RF center excitation and temporally match the excitatory response to stimulus duration. In ON GCs, temporal response components are governed by both GlyRα2 and GlyRα3 subunit inputs, which appear to contribute separately but function together to perform the same response enhancement and temporal matching. We found no evidence of either subunit input alone mediating spatial aspects of the RF response, which is consistent with an established role of glycinergic inhibition in the modulation of temporal and not spatial properties of the GC visual response (Bolz et al., 1985; Chen et al., 2010; O’Brien et al., 2003; Stone & Pinto, 1992).
GlyRα2 and GlyRα3 subunits modulate inhibition slower than receptor kinetics
In Glra2−/− OFF GCs, a lower maintained excitatory response compared to WT results in more transient responses both in Glra2−/− and Glra2/3−/− double KO mice. Spontaneous GlyRα1 and GlyRα3 IPSCs (Ivanova et al., 2006; Majumdar et al., 2007; Weiss et al., 2008) and light-evoked glycinergic IPSCs (Pang et al., 2007; Manookin et al., 2008) have been shown in cellular components of the Off pathway. Thus, our results define a new role for GlyRα2 inhibition in shaping the response of WT OFF GCs to match stimulus duration.
GlyRα2 and GlyRα3 control of the maintained response is slow (between 0.4 and 2 sec) compared to their receptor kinetics (mean decay τ: GlyRα2= ~27ms; GlyRα3= ~11ms; Weiss et al., 2008). This difference is most easily explained by a prolonged or asynchronous release of presynaptic neurotransmitter that shapes the inhibitory input controlling the maintained response, similar to the timing of inhibitory inputs that shape BC light evoked inhibition (Tachibana, 1999; Eggers & Lukasiewicz, 2006; Eggers et al., 2007).
GlyRα2 and GlyRα3 enhance ON and OFF GC RF center excitation through separate inhibitory mechanisms
GlyRα2 mediates crossover inhibition in both the On and Off pathways
The absence of GlyRα2 expression creates the same changes in ON and OFF GC RF center responses. Both the transient and sustained components of the RF center excitatory responses at stimulus onset and post-stimulus suppression are significantly lower than WT. Less excitation is inconsistent with the removal of direct inhibition. Removal of serial inhibitory input will result in less excitation at stimulus onset; however post-stimulus suppression, arising from inhibitory inputs in the opposite pathway, should be unchanged. The most parsimonious explanation for our result is that GlyRα2 meditates crossover inhibition from the Off to the On as well as the On to Off WT pathways. Glycinergic crossover inhibition has been shown to augment both excitation at stimulus onset and suppression at stimulus offset in rabbit GCs (Roska and Werblin, 2001; Roska et al., 2006; Molnar and Werblin, 2007; Molnar et al., 2009; Hsueh et al., 2008; Chen et al., 2010). In addition, mouse OFF GCs receive glycinergic inhibitory inputs from the On pathway (van Wyk et al., 2009).
Figure 10A illustrates a circuit in which GlyRα2 mediates crossover input from the Off to On pathway. The GlyRα2 receptor is positioned as the target of an OFF narrow field (NF) AC where it mediates inhibition to an ON GC. We have eliminated ON cone BCs (CBCs) as the target because they lack spontaneous and evoked glycinergic IPSCs (Ivanova et al., 2006; Eggers et al., 2007). At the onset of a bright spot stimulus (currents under white portion of stimulus profile bar) the primary inward current that governs excitation in ON GCs (Box 5) arises from ON CBCs (Box 3). In the Off pathway, stimulus onset produces a small outward current in OFF CBCs (Box 1) that provides input to the OFF NF AC. Crossover inhibition inverts this current and the OFF NF AC synaptic input produces a current in the ON GC (Box 4) the same sign as its ON CBC input (Box 3). In WT ON GCs this mechanism enhances excitation and in the absence of GlyRα2 input, only the ON CBC input drives the ON GC response and the stimulus evokes less excitation. The offset of the bright spot (currents under grey portion of stimulus profile bar) eliminates the excitatory input from the ON CBC and induces a small outward current (Box 3). At the same time OFF CBC excitation elicits a large inward current in the NF AC. Crossover inhibition inverts current polarity and the OFF NF AC input produces a current in the ON GC (Box 4) the same sign as its ON CBC input (Box 3). This enhances response suppression in WT ON GCs (Box 5) and the absence of GlyRα2 input reduces suppression.
Changes in RF center responses of OFF GCs in the absence of GlyRα2 are the same as those in ON GCs which suggests a similar GlyRα2 inhibitory mechanism in the On and Off pathways (Figure 10B). Although the receptor subunit was unknown at the time, On to Off pathway inhibition was predicted to occur via an intermediate glycinergic AC in cat GCs (Wässle et al, 1986). Given its localization throughout the IPL (Heinze et al, 2007), our results suggest that GlyRα2 is a subunit that mediates inhibitory inputs from the On to the Off pathway and vice versa.
Figure 10B illustrates GlyRα2-mediated crossover input from On to the Off pathway. Here the GlyRα2 receptor is the target of an ON NF AC for two reasons. All spontaneous and glycine evoked IPSCs in OFF CBCs are mediated by GlyRα1 (Ivanova et al., 2006). Glycinergic IPSCs with slower kinetics remain in A2-OFF GCs in the absence of their dominant GlyRα1 synaptic input (Majumdar et al., 2007). The onset of a dark spot initiates excitation in OFF CBCs (currents under grey portion of stimulus profile bar). Using a NF ON AC, the same crossover inhibitory mechanisms described for the Off to On pathway (Figure 10A) enhance the RF excitatory response as well as response suppression in WT OFF GCs. Again, the absence of GlyRα2 input lowers response excitation and suppression. It should be noted that concatenated circuits have been observed (Anderson et al., 2011). It they provide input to the NF AC that mediates crossover inhibition, then the position of the GlyRα2 receptor could differ from our placement in Figures 10A and B. What is not at question is that our observations are consistent with a role of the GlyRα2 receptor and a crossover inhibitory circuit that contributes to GC RF center response enhancement.
GlyRα3 mediates serial inhibition in the On pathway
Both RF center transient and maintained response components of Glra3−/− ON GCs are lower than WT. The absence of GlyRα3 inhibition does not affect post-stimulus suppression and therefore we predict that GlyRα3 uses a different mechanism, serial inhibition, in the On pathway. GABAergic feedback to the RF center of rabbit local edge detector GCs is controlled by serial glycinergic inhibition (Russell & Werblin, 2010) and this mechanism also governs salamander GC responses (Zhang et al., 1997).
Figure 10C illustrates GlyRα3-mediated serial inhibitory input within the On pathway. This pathway is shown separately for clarity, although GlyRα2 and GlyRα3 could work together in the same circuit. The GlyRα3 receptor is located on the ON AC most proximal to the ON GC, as the target of a distal ON AC. All AC processes are confined to the On sublaminae because Glra3−/− OFF GCs RF responses are similar to WT. ON CBCs only show GABAergic sIPSCs therefore if they are the target then the proximal ON AC is GABAergic (Eggers et al, 2007); whereas if the target is an ON GC, the proximal ON AC can be glycinergic targeting GlyRα1Rs (Ivanova et al, 2006) or GABAergic targeting GABAARs (Eggers et al, 2007). At the onset of a bright spot stimulus (currents under white stimulus profile bar) an excitatory response arises in ON CBCs (Boxes 1a & 1b) resulting in inward currents in ON ACs (Boxes 2 & 3). GlyRα3-mediated inhibition from the distal ON AC (Box 4) reduces the inward current in the proximal ON AC (Box 5). This reduces its inhibitory output to the postsynaptic target (WT ON CBC or GC). The absence of GlyRα3 expression eliminates the inhibitory input to the proximal AC and increases its inhibitory input. When its target is the ON CBC, this reduces excitatory input to the ON GC. When its target is the ON GC, excitation decreases because direct inhibition increases. Regardless, the absence of GlyRα3 expression reduces stimulus evoked spiking in the ON GC (Box 6).
Summary
Our findings extend the previous literature that demonstrated a significant role of glycinergic inhibition in shaping visual responses in the retina. Our results define novel roles of two glycine subunits not only in their selectivity within the On and Off pathways, but also in the specific inhibitory mechanisms that they employ to modulate GC visual function. One question arises whenever the role of ACs in retinal function is discussed. “Why are there so many diverse AC classes?” In light of this question, our results could be interpreted as evidence to support the idea that multiple ACs are required to target each subunit specific input within the retinal parallel pathways and that different ACs are required to modulate both the transient and sustained aspects of the visual response.
Acknowledgments
NIH (EY140701, MAMC), an unrestricted RPB grant to UofL, DOVS. We thank Drs. Heinze Wässle, Steven Mills and Erika Eggers for critical reading of the manuscript.
Footnotes
Any Conflict of Interest: No
References
- Anderson JR, Jones BW, Watt CB, Shaw MV, Yang JH, Demill D, Lauritzen JS, Lin Y, Rapp KD, Mastronarde D, Koshevoy P, Grimm B, Tasdizen T, Whitaker R, Marc RE. Exploring the retinal connectome. Molecular Vision. 2011;17:355–379. [PMC free article] [PubMed] [Google Scholar]
- Barthel LK, Raymond PA. Improved method for obtaining 3-microns cryosections for immunocytochemistry. J Histochem Cytochem. 1990;38:1383–1388. doi: 10.1177/38.9.2201738. [DOI] [PubMed] [Google Scholar]
- Bolz J, Thier P, Voigt T, Wässle H. Action and localization of glycine and taurine in the cat retina. J Physiol. 1985;362:395–413. doi: 10.1113/jphysiol.1985.sp015685. [DOI] [PMC free article] [PubMed] [Google Scholar]
- Bormann J. The ‘ABC’ of GABA receptors. Trends Pharmacol Sci. 2000;21:16–19. doi: 10.1016/s0165-6147(99)01413-3. [DOI] [PubMed] [Google Scholar]
- Boycott BB, Wässle H. The morphological types of ganglion cells of the domestic cat’s retina. J Physiol. 1974;240:397–419. doi: 10.1113/jphysiol.1974.sp010616. [DOI] [PMC free article] [PubMed] [Google Scholar]
- Caldwell JH, Daw NW. Effects of picrotoxin and strychnine on rabbit retinal ganglion cells: changes in centre surround receptive fields. J Physiol. 1978;276:299–310. doi: 10.1113/jphysiol.1978.sp012234. [DOI] [PMC free article] [PubMed] [Google Scholar]
- Chen X, Hsueh HA, Greenberg K, Werblin FS. Three forms of spatial temporal feedforward inhibition are common to different ganglion cell types in rabbit retina. J Neurophysiol. 2010;103:2618–2632. doi: 10.1152/jn.01109.2009. [DOI] [PMC free article] [PubMed] [Google Scholar]
- Chen X, Hsueh HA, Werblin FS. Amacrine-to-amacrine cell inhibition: Spatiotemporal properties of GABA and glycine pathways. Vis Neurosci. 2011;28:193–204. doi: 10.1017/S0952523811000137. [DOI] [PubMed] [Google Scholar]
- Cook PB, McReynolds JS. Modulation of sustained and transient lateral inhibitory mechanisms in the mudpuppy retina during light adaptation. J Neurophysiol. 1998;79:197–204. doi: 10.1152/jn.1998.79.1.197. [DOI] [PubMed] [Google Scholar]
- Cui J, Ma Y-P, Lipton SA, Pan Z-H. Glycine receptors and glycinergic synaptic input at the axon terminals of mammalian retinal rod bipolar cells. J Physiol. 2003;533.3:895–909. doi: 10.1113/jphysiol.2003.052092. [DOI] [PMC free article] [PubMed] [Google Scholar]
- Eggers ED, Lukasiewicz PD. Receptor and transmitter release properties set the time course of retinal inhibition. J Neurosci. 2006;26:9413–25. doi: 10.1523/JNEUROSCI.2591-06.2006. [DOI] [PMC free article] [PubMed] [Google Scholar]
- Eggers ED, Lukasiewicz PD. Interneuron circuits tune inhibition in retinal bipolar cells. J Neurophysiol. 2010;103:25–37. doi: 10.1152/jn.00458.2009. [DOI] [PMC free article] [PubMed] [Google Scholar]
- Eggers ED, Lukasiewicz PD. Multiple pathways of inhibition shape bipolar cell responses in the retina. Vis Neurosci. 2011;28:95–108. doi: 10.1017/S0952523810000209. [DOI] [PMC free article] [PubMed] [Google Scholar]
- Eggers ED, McCall MA, Lukasiewicz PD. Presynaptic inhibition differentially shapes transmission in distinct circuits in the mouse retina. J Physiol. 2007;582:569–582. doi: 10.1113/jphysiol.2007.131763. [DOI] [PMC free article] [PubMed] [Google Scholar]
- Enroth-Cugell C, Robson JG. The contrast sensitivity of retinal ganglion cells of the cat. J Physiol. 1966;187:517–552. doi: 10.1113/jphysiol.1966.sp008107. [DOI] [PMC free article] [PubMed] [Google Scholar]
- Enz R, Bormann J. Expression of glycine receptor subunits and gephyrin in single bipolar cells of the rat retina. Vis Neurosci. 1995;12:507–517. doi: 10.1017/s0952523800008403. [DOI] [PubMed] [Google Scholar]
- Flores-Herr N, Protti DA, Wässle H. Synaptic currents generating the inhibitory surround of ganglion cells in the mammalian retina. J Neurosci. 2001;21:4852–4863. doi: 10.1523/JNEUROSCI.21-13-04852.2001. [DOI] [PMC free article] [PubMed] [Google Scholar]
- Gregg RG, Kamermans M, Klooster J, Lukasiewicz PD, Peachey NS, Vessey KA, McCall MA. Nyctalopin expression in retinal bipolar cells restores visual function in a mouse model of complete X-linked congenital stationary night blindness. J Neurophysiol. 2007;98:3023–3033. doi: 10.1152/jn.00608.2007. [DOI] [PMC free article] [PubMed] [Google Scholar]
- Grimes WN, Zhang J, Graydon CW, Kachar B, Diamond JS. Retinal parallel processors: more than 100 independent microcircuits operate within a single interneuron. Neuron. 2010;65:873–85. doi: 10.1016/j.neuron.2010.02.028. [DOI] [PMC free article] [PubMed] [Google Scholar]
- Grudzinska J, Schemm R, Haeger S, Nicke A, Schmalzing G, Betz H, Laube B. The beta subunit determines the ligand binding properties of synaptic glycine receptors. Neuron. 2005;45:727–739. doi: 10.1016/j.neuron.2005.01.028. [DOI] [PubMed] [Google Scholar]
- Harvey RJ, Depner UB, Wässle H, Ahmadi S, Heindl C, Reinold H, Smart TG, Harvey K, Schutz B, bo-Salem OM, Zimmer A, Poisbeau P, Welzl H, Wolfer DP, Betz H, Zeilhofer HU, Müller U. GlyR alpha3: an essential target for spinal PGE2-mediated inflammatory pain sensitization. Science. 2004;304:884–887. doi: 10.1126/science.1094925. [DOI] [PubMed] [Google Scholar]
- Haverkamp S, Müller U, Harvey K, Harvey RJ, Betz H, Wässle H. Diversity of glycine receptors in the mouse retina: localization of the alpha3 subunit. J Comp Neurol. 2003;465:524–539. doi: 10.1002/cne.10852. [DOI] [PubMed] [Google Scholar]
- Heinze L, Harvey RJ, Haverkamp S, Wässle H. Diversity of glycine receptors in the mouse retina: localization of the alpha4 subunit. J Comp Neurol. 2007;500:693–707. doi: 10.1002/cne.21201. [DOI] [PubMed] [Google Scholar]
- Hsueh HA, Molnar A, Werblin FS. Amacrine-to-amacrine cell inhibition in the rabbit retina. J Neurophysiol. 2008;100:2077–2088. doi: 10.1152/jn.90417.2008. [DOI] [PubMed] [Google Scholar]
- Ivanova E, Müller U, Wässle H. Characterization of the glycinergic input to bipolar cells of the mouse retina. Eur J Neurosci. 2006;23:350–364. doi: 10.1111/j.1460-9568.2005.04557.x. [DOI] [PubMed] [Google Scholar]
- Kuffler SW. Discharge patterns and functional organization of mammalian retina. J Neurophysiol. 1953;16:37–68. doi: 10.1152/jn.1953.16.1.37. [DOI] [PubMed] [Google Scholar]
- MacNeil MA, Masland RH. Extreme diversity among amacrine cells: implications for function. Neuron. 1998;20:971–982. doi: 10.1016/s0896-6273(00)80478-x. [DOI] [PubMed] [Google Scholar]
- MacNeil MA, Heussy JK, Dacheux RF, Raviola E, Masland RH. The shapes and numbers of amacrine cells: matching of photofilled with Golgi-stained cells in the rabbit retina and comparison with other mammalian species. J Comp Neurol. 1999;413:305–26. [PubMed] [Google Scholar]
- Majumdar S, Heinze L, Haverkamp S, Ivanova E, Wässle H. Glycine receptors of A-type ganglion cells of the mouse retina. Vis Neurosci. 2007;24:471–487. doi: 10.1017/S0952523807070174. [DOI] [PubMed] [Google Scholar]
- Manookin MB, Beaudoin DL, Ernst ZR, Flagel LJ, Demb JB. Disinhibition combines with excitation to extend the operating range of the OFF visual pathway in daylight. J Neurosci. 2008;28:4136–4150. doi: 10.1523/JNEUROSCI.4274-07.2008. [DOI] [PMC free article] [PubMed] [Google Scholar]
- Menger N, Pow DV, Wässle H. Glycinergic amacrine cells of the rat retina. J Comp Neurol. 1998;401:34–46. doi: 10.1002/(sici)1096-9861(19981109)401:1<34::aid-cne3>3.0.co;2-p. [DOI] [PubMed] [Google Scholar]
- Molnar A, Hsueh HA, Roska B, Werblin FS. Crossover inhibition in the retina: circuitry that compensates for nonlinear rectifying synaptic transmission. J Comput Neurosci. 2009;27:569–590. doi: 10.1007/s10827-009-0170-6. [DOI] [PMC free article] [PubMed] [Google Scholar]
- Molnar A, Werblin F. Inhibitory feedback shapes bipolar cell responses in the rabbit retina. J Neurophysiol. 2007;98:3423–3435. doi: 10.1152/jn.00838.2007. [DOI] [PubMed] [Google Scholar]
- Murphy GJ, Rieke F. Network variability limits stimulus-evoked spike timing precision in retinal ganglion cells. Neuron. 2006;52:511–524. doi: 10.1016/j.neuron.2006.09.014. [DOI] [PMC free article] [PubMed] [Google Scholar]
- O’Brien BJ, Richardson RC, Berson DM. Inhibitory network properties shaping the light evoked responses of cat alpha retinal ganglion cells. Vis Neurosci. 2003;20:351–361. doi: 10.1017/s0952523803204016. [DOI] [PubMed] [Google Scholar]
- Pang JJ, Abd-El-Barr MM, Gao F, Bramblett DE, Paul DL, Wu SM. Relative contributions of rod and cone bipolar cell inputs to AII amacrine cell light responses in the mouse retina. J Physiol. 2007;580:397–410. doi: 10.1113/jphysiol.2006.120790. [DOI] [PMC free article] [PubMed] [Google Scholar]
- Pang JJ, Gao F, Wu SM. Light-evoked excitatory and inhibitory synaptic inputs to ON and OFF alpha ganglion cells in the mouse retina. J Neurosci. 2003;23:6063–6073. doi: 10.1523/JNEUROSCI.23-14-06063.2003. [DOI] [PMC free article] [PubMed] [Google Scholar]
- Roska B, Molnar A, Werblin FS. Parallel processing in retinal ganglion cells: how integration of space-time patterns of excitation and inhibition form the spiking output. J Neurophysiol. 2006;95:3810–3822. doi: 10.1152/jn.00113.2006. [DOI] [PubMed] [Google Scholar]
- Roska B, Nemeth E, Orzo L, Werblin FS. Three levels of lateral inhibition: A space-time study of the retina of the tiger salamander. J Neurosci. 2000;20:1941–1951. doi: 10.1523/JNEUROSCI.20-05-01941.2000. [DOI] [PMC free article] [PubMed] [Google Scholar]
- Roska B, Werblin F. Vertical interactions across ten parallel, stacked representations in the mammalian retina. Nature. 2001;410:583–587. doi: 10.1038/35069068. [DOI] [PubMed] [Google Scholar]
- Russell TL, Werblin FS. Retinal synaptic pathways underlying the response of the rabbit local edge detector. J Neurophysiol. 2010;103:2757–2769. doi: 10.1152/jn.00987.2009. [DOI] [PMC free article] [PubMed] [Google Scholar]
- Sagdullaev BT, DeMarco PJ, McCall MA. Improved contact lens electrode for corneal ERG recordings in mice. Doc Ophthalmol. 2004;108:181–184. doi: 10.1007/s10633-004-5734-1. [DOI] [PubMed] [Google Scholar]
- Sagdullaev BT, McCall MA. Stimulus size and intensity alter fundamental receptive-field properties of mouse retinal ganglion cells in vivo. Vis Neurosci. 2005;22:649–659. doi: 10.1017/S0952523805225142. [DOI] [PubMed] [Google Scholar]
- Sassoè-Pognetto M, Wässle H, Grünert U. Glycinergic synapses in the rod pathway of the rat retina: cone bipolar cells express the α1 subunit of the glycine receptor. J Neurosci. 1994;14:5131–5146. doi: 10.1523/JNEUROSCI.14-08-05131.1994. [DOI] [PMC free article] [PubMed] [Google Scholar]
- Stone C, Pinto LH. Receptive field organization of retinal ganglion cells in the spastic mutant mouse. J Physiol. 1992;456:125–142. doi: 10.1113/jphysiol.1992.sp019330. [DOI] [PMC free article] [PubMed] [Google Scholar]
- Tachibana M. Regulation of transmitter release from retinal bipolar cells. Prog Biophys Mol Biol. 1999;72(2):109–33. doi: 10.1016/s0079-6107(99)00003-6. [DOI] [PubMed] [Google Scholar]
- van Wyk M, Wässle H, Taylor WR. Receptive field properties of ON- and OFF-ganglion cells in the mouse retina. Vis Neurosci. 2009;26:297–308. doi: 10.1017/S0952523809990137. [DOI] [PMC free article] [PubMed] [Google Scholar]
- Wässle H, Schafer-Trenkler I, Voigt T. Analysis of a glycinergic inhibitory pathway in the cat retina. J Neurosci. 1986;6:594–604. doi: 10.1523/JNEUROSCI.06-02-00594.1986. [DOI] [PMC free article] [PubMed] [Google Scholar]
- Wässle H, Heinze L, Ivanova E, Majumdar S, Weiss J, Harvey RJ, Haverkamp S. Glycinergic transmission in the Mammalian retina. Front Mol Neurosci. 2009;2:6. doi: 10.3389/neuro.02.006.2009. [DOI] [PMC free article] [PubMed] [Google Scholar]
- Webb TI, Lynch JW. Molecular pharmacology of the glycine receptor chloride channel. Curr Pharm Des. 2007;13:2350–2367. doi: 10.2174/138161207781368693. [DOI] [PubMed] [Google Scholar]
- Weiss J, O’Sullivan GA, Heinze L, Chen HX, Betz H, Wässle H. Glycinergic input of small-field amacrine cells in the retinas of wildtype and glycine receptor deficient mice. Mol Cell Neurosci. 2008;37:40–55. doi: 10.1016/j.mcn.2007.08.012. [DOI] [PubMed] [Google Scholar]
- Young-Pearse TL, Ivic L, Kriegstein AR, Cepko CL. Characterization of mice with targeted deletion of glycine receptor alpha 2. Mol Cell Biol. 2006;26:5728–5734. doi: 10.1128/MCB.00237-06. [DOI] [PMC free article] [PubMed] [Google Scholar]
- Zhang J, Jung CS, Slaughter MM. Serial inhibitory synapses in retina. Vis Neurosci. 1997;14:553–563. doi: 10.1017/s0952523800012219. [DOI] [PubMed] [Google Scholar]