

Abstract
Sensory experience in early postnatal life shapes neuronal connections in the brain. Here we report that the local synthesis of brain-derived neurotrophic factor (BDNF) in dendrites plays an important role in this process. We found that dendritic spines of layer 2/3 pyramidal neurons of the visual cortex in mutant mice lacking dendritic Bdnf mRNA and thus local BDNF synthesis were normal at 3 weeks of age, but thinner, longer, and more closely spaced (morphological features of immaturity) at 4 months of age than in wild-type (WT) littermates. Layer 2/3 of the visual cortex in these mutant animals also had fewer GABAergic presynaptic terminals at both ages. The overall size and shape of dendritic arbors were, however, similar in mutant and WT mice at both ages. By using optical imaging of intrinsic signals and single-unit recordings, we found that mutant animals failed to recover cortical responsiveness following monocular deprivation (MD) during the critical period, although they displayed normally the competitive loss of responsiveness to an eye briefly deprived of vision. Furthermore, MD still induced a loss of responsiveness to the closed eye in adult mutant mice, but not in adult wild-type mice. These results indicate that dendritic BDNF synthesis is required for spine pruning, late-phase spine maturation, and recovery of cortical responsiveness following sensory deprivation. They also suggest that maturation of dendritic spines is required for the maintenance of cortical responsiveness following sensory deprivation in adulthood.
Keywords: brain-derived neurotrophic factor, local protein synthesis, spine maturation, spine pruning, visual cortex, ocular dominance plasticity, recovery of cortical response, GABA
Introduction
Sensory experience strongly influences maturation and refinement of neuronal connections in the cortex during postnatal development. The best studied paradigm for experience-dependent cortical development is called ocular dominance plasticity, where closing one eye for a few days during a critical period of heightened plasticity leads to marked decrease in cortical responsiveness to the deprived eye through a competitive interaction between inputs from the two eyes (Wiesel, 1982). A second manifestation of cortical plasticity is the recovery of cortical responsiveness to the closed eye when binocular vision is restored. Brain-derived neurotrophic factor (BDNF) has been proposed as a regulator of ocular dominance plasticity, as visual experience stimulates BDNF expression in the visual cortex (Castren et al., 1992; Lein and Shatz, 2000) and pharmacological interference of signaling mediated by TrkB, the receptor for BDNF, impairs the formation of ocular dominance columns (Cabelli et al., 1995; Cabelli et al., 1997). In support of this view, overexpression of brain-derived neurotrophic factor (BDNF) in the mouse visual cortex induces a precocious critical period of heightened plasticity (Hanover et al., 1999; Huang et al., 1999). This effect on plasticity appears to be secondary to the accelerated maturation of GABAergic circuits that is induced by chronically enhanced TrkB signaling (Huang et al., 1999), since intracortical inhibition is required for ocular dominance plasticity (Hensch, 2005) and precocious plasticity can be induced in WT animals by pharmacologically enhancing inhibition (Fagiolini and Hensch, 2000). A recent study using a powerful chemical-genetic approach shows that the TrkB activity during the critical period is required for recovery, but not loss, of cortical responsiveness following MD (Kaneko et al., 2008b).
In addition to ocular dominance plasticity, pruning of cortical dendritic spines, which are the postsynaptic targets for the vast majority of glutamatergic excitatory synapses, also depends on sensory experience (Grutzendler et al., 2002; Zuo et al., 2005a; Zuo et al., 2005b). Dendritic spines are overproduced in early postnatal life, followed by a reduction to mature levels. During the pruning phase, up to 40% of spines are selectively eliminated while the remaining spines become mature and change morphology from long and thin to short and stubby (Marin-Padilla, 1967; Huttenlocher, 1979; Huttenlocher et al., 1982; Galofre and Ferrer, 1987). Very little is known about the molecular mechanism underlying spine pruning. Although the critical period for ocular dominance plasticity and the time course for spine pruning overlap in the visual cortex, whether these two activity-dependent processes are related is unknown (Grutzendler et al., 2002; Kaneko et al., 2008b).
The Bdnf gene produces two populations of transcripts with either a short or long 3′ untranslated region (3′UTR) (Timmusk et al., 1993). The short 3′UTR Bdnf mRNA is restricted to cell bodies whereas the long 3′UTR Bdnf mRNA is also exported to dendrites for local translation (An et al., 2008). In adult Bdnfklox/klox mice where the long 3′UTR is truncated, hippocampal apical dendrites have denser and thinner spines, suggesting that dendritically synthesized BDNF is important for spine maturation and pruning (An et al., 2008). In the present study we examined the role of dendritically synthesized BDNF both functionally and anatomically, measuring ocular dominance plasticity and spine maturation in the visual cortex of Bdnfklox/klox mice. Our results confirm the importance of dendritic BDNF synthesis for spine maturation and implicate its action on TrkB receptors to mediate recovery of cortical responsiveness following MD in the critical period. They also reveal a role for dendritically synthesized BDNF in the maintenance of cortical responsiveness during sensory deprivation in adulthood.
Materials and Methods
Animals
All animals were given free access to food and water and housed in a 12-hour light/dark cycle. Bdnfklox/+ mice were previously described (An et al., 2008), and Bdnf+/− mice were derived from Bdnfklox/+ mice by deleting the loxP-flanked region in the germline. These mouse strains were maintained on the C57BL/6J background. Bdnfklox/klox mice and wild-type littermates were obtained from intercrosses of Bdnfklox/+ mice. TrkBF616A mice and the specific inhibitor were described previously (Chen et al., 2005). Only male mice were used for Golgi impregnation, and other studies used mice of either sex. All procedures described here were approved by the Institutional Animal Care and Use Committees at Georgetown University and University of California San Francisco and were in compliance with the NIH guide for the care and use of laboratory animals.
In situ hybridization
In situ hybridization was performed as described previously (Xu et al., 2003). In brief, brains were dissected from mice at 5 weeks of age and frozen immediately in an isopentane-dry ice bath. Brains were sectioned at 10 μm using a cryostat, and in situ hybridization was conducted on sections using a 35S-labeled antisense riboprobe derived from a Bdnf cDNA. After hybridization and washes, sections were exposed to Kodak BioMax MR Hyperfilm. For each mouse, images from eight sections were scanned at 1,200 dpi, and the optical density of in situ signal in the visual cortex was determined using NIH Image J software.
BDNF ELISA
Cerebral cortices were dissected from Bdnfklox/klox mice, Bdnf+/− mice, and WT littermates at 5-6 weeks of age, weighed, and homogenized in an ice-cold lysis buffer (100 mM Tris-HCl, 2% bovine serum albumin, 1 M NaCl, 4 mM EDTA, 2% Triton X-100, and protease inhibitors, pH 7). The lysates were kept on ice for 30 min and centrifuged at 12,500 rpm at 4 °C for 20 min. Supernatants were recovered as cortical extracts. The amount of BDNF in the extracts was measured using the BDNF ELISA kit from Millipore (Temecula, CA).
Analysis of dendritic arbors and spine density
Dendritic arbors and spine density were analyzed as described previously (Xie et al., 2010). Briefly, Golgi-impregnated layer II/III pyramidal neurons in the visual cortex were traced using Neurolucida software (MicroBrightField Inc, Williston, VT) under a Nikon Eclipse E800 microscope equipped with a motorized stage. Analysis was done blind to genotype. All of analyzed neurons were well stained and isolated, and had intact dendritic arbors.
Node numbers, dendritic length, and spine density of each traced neuron were calculated using NeuroExplorer software (MicroBrightField Inc, Williston, VT). For node numbers and dendritic length, four neurons were traced per animal, and the average of each measurement from these neurons was used as the value for the mouse during statistical analysis. To measure spine density, we selected apical dendrite and one major basal dendrite (each at least 100 μm long) from each neuron and marked the position of each dendritic spine along these dendrites using Neurolucida software. Spine density was calculated as a function of distance from the soma, at least 10 apical dendrites and 10 basal dendrites per mouse were traced for statistical analysis.
Spine length and spine head diameter
Images of Golgi-stained distal dendrites (>100 μm away from the soma) were taken using a 60x objective lens. Spine length and head diameter were measured on these images using NIH ImageJ software. Spine head diameter and spine length were defined as the maximum width of the spine head and the distance from the tip of the spine head to the interface with the dendritic stalk, respectively.
Immunohistochemistry and quantification of presynaptic sites
Fluorescent immunohistochemistry was performed as described previously (Baydyuk et al., 2011). The following primary antibodies were used: mouse anti-GAD65 (1:400, Boehringer Mannheim, Ingelheim, Germany) and guinea pig anti-VGLUT1 (1:1,000, Millipore, Billerica, MA). Alexa Fluor 488 or Alexa Fluor 594 secondary antibodies were used at a dilution of 1:1,000. Images were acquired on a Zeiss LSM5 Pascal confocal microscope using a 63X objective at 1024 × 1024 pixel resolution. Identical settings were used for all sections in a given experiment. For each experiment, 12 images were taken per mouse from 6 hemispheres containing the largest area of visual cortex. Puncta density in these images was measured using NIH ImageJ software with the custom “scripts” plug-in to set threshold values. Puncta were defined at a threshold that eliminated puncta overlap and saturation, and were held constant for each experiment. In each experiment, values were normalized to the average WT puncta density.
Monocular deprivation
MD was performed as described (Gordon and Stryker, 1996), except that 2–3% isoflurane in oxygen was used for anesthesia. For intrinsic signal imaging study, the lid of the right eye (contralateral to the imaged hemisphere) was sutured shut at P25–26 (critical period study) or at P70–85 (adult study), immediately after the first (baseline) session of intrinsic signal imaging. To examine recovery from MD, optical imaging was repeated 4 day after vision was restored to the closed eye (following MD for 5 days) by simply removing the suture. For electrophysiological single unit recordings, mice were subjected to 5 days of MD followed by 4 days of binocular vision (critical period recovery examination) or to 10-14 days of MD starting at P75–90 (adult study).
Optical imaging of intrinsic signals
Repeated optical imaging of intrinsic signals and quantification of ocular dominance were performed as described (Kaneko et al., 2008a). Briefly, during recording mice were anesthetized with 0.7% isoflurane in oxygen applied via a home-made nose mask, supplemented with a single intramuscular injection of 20-25 μg chlorprothixene. We monitored the concentration of isoflurane using an Ohmeda 5250 RGM (Datex-Ohmeda, Madison, WI) throughout each imaging session. Images were recorded transcranially; the scalp was sutured at the end of each session and re-opened at the same location in subsequent sessions. Intrinsic signal images were obtained with a Dalsa 1M30 CCD camera (Dalsa, Waterloo, Canada) with a 135×50 mm tandem lens (Nikon Inc., Melville, NY) and red interference filter (610 ± 10 nm). Frames were acquired at a rate of 30 fps, temporally binned by 4 frames, and stored as 512×512 pixel images after binning the 1024×1024 camera pixels by 2×2 pixels spatially. The visual stimulus for recording the binocular zone, presented on a 40×30 cm monitor placed 25 cm in front of the mouse, consisted of 2°-wide bars, which were presented between −5° and 15° on the stimulus monitor (0° = center of the monitor aligned to center of the mouse) and moved continuously and periodically upward or downward at a speed of 10°/sec. The phase and amplitude of cortical responses at the stimulus frequency were extracted by Fourier analysis as described (Kalatsky and Stryker, 2003). Response amplitude was an average of at least 4 measurements. Ocular dominance index was computed as (R − L)/(R + L), where R and L are the peak response amplitudes through the right eye and the left eye, respectively, as described (Kaneko et al., 2008a). All mice were kept under standard housing conditions with free access to food and water between recordings. For assessment of retinotopy, intrinsic signal images were acquired using a full-screen bar stimulus as described (Kalatsky and Stryker, 2003). Response area was calculated by selecting pixels with response amplitudes larger than 30% of the maximum value. The map scatter index was computed as described (Cang et al., 2008).
Cortical responses in TrkBF616A homozygous mutant mice treated with vehicle solution or 1NM-PP1 were measured acutely after 7–9 days of MD beginning at P65 - P75 in animals with otherwise normal visual experience. Subcutaneous infusion of vehicle solution or 1NM-PP1 via osmotic minipump was started 24h before the eyelid suture and continued throughout the duration of MD as described (Kaneko et al., 2008b). Acute imaging of intrinsic signals was performed under Nembutal anesthesia (50 mg/kg; Abbott, North Chicago, IL) supplemented with chlorprothixene (0.2 mg).
Electrophysiological recording of single unit activities in vivo
To examine recovery from MD during the critical period or ocular dominance shift after MD in adults, electrophysiological recordings were made from individual neurons in the binocular visual cortex contralateral to the deprived eye, according to Gordon and Stryker (Gordon and Stryker, 1996). Only cells with a receptive field (RF) within 20° from the vertical meridian were included. In each mouse, single units were isolated at intervals of 60 μm or more, using a standard tungsten electrode (FHC, Inc., Bowdoinham, ME). A hand-held lamp was used to project moving bars onto a tangent screen to drive neuronal responses. Optimal stimuli were presented to either eye alternately, and the relative strength of the response was determined. Each unit was scored on the 1-to-7 scale (OD score) (Hubel and Wiesel, 1962), where 1 and 7 indicate exclusive response to the contralateral and ipsilateral eyes, respectively. A score of 4 was assigned to units responding equally well to either eye, and scores 2 or 3 and 5 or 6 were to those responding better or dominated by the contralateral and ipsilateral eyes, respectively. For each mouse, a contralateral bias index (CBI) was calculated according to the formula: CBI = [(n1 - n7) + (2/3)(n2 - n6) + (1/3)(n3 - n5) + N]/ 2N, where N = total number of cells and nx = number of cells with OD scores equal to x.
Baseline response properties of visual cortical neurons were examined in mice with normal visual experience at P66–110. Data acquisition, visual stimuli, and spike analyses were performed as described (Niell and Stryker, 2008) with small modifications. Briefly, under isoflurane anesthesia (1.5–2% for surgical preparation and 0.7% for recording, supplemented with 0.2 mg of chlorprothixene), a custom stainless-steel headplate was cemented to the skull to allow head fixation and a small craniotomy (< 1 mm diameter) was made over the binocular area of the primary visual cortex (V1). A silicon multisite electrode with a tetrode configuration (model a2×2-tet-3mm-150-121, Neuronexus Technologies) was inserted to a depth of < 400 μm below the cortical surface to record cells in layer 2/3. Visual stimuli were generated in Matlab using the Psychophysics Toolbox extensions and displayed on a monitor placed 25 cm in front of the mouse. To measure the responsiveness of cells, we presented drifting sinusoidal gratings of 1.5 s duration at 100% contrast, with a temporal frequency of 2 Hz, spatial frequency of 0.01, 0.02, 0.04, 0.08, 0.16, 0.32, and 0 cycles/°, in 12 evenly spaced directions. The stimulus conditions were randomly interleaved, and a gray blank condition was included to estimate the spontaneous firing rate. Signals were acquired using a System 3 workstation (Tucker-Davis Technologies) and analyzed with custom software in Matlab (MathWorks). Unit clustering and spike waveform analysis were performed as described (Niell and Stryker, 2008). The average spontaneous firing rate for each unit was calculated by averaging the rate over all blank condition presentations. Responses to each orientation and spatial frequency were calculated by averaging the spike rate during the 1.5 s presentation and subtracting the spontaneous firing rate. The preferred orientation was determined by averaging the response across all spatial frequencies, and calculating half the complex phase of the value . Given this fixed preferred orientation θpref, the tuning curve was fitted with the sum of two Gaussians centered on θpref and θpref+π, of different amplitudes A1 and A2 but equal width θ, with a constant baseline B. From this fit, we derived an orientation selectivity index (OSI) and the width of the selectivity tuning. OSI was calculated as the depth of modulation from the preferred orientation to its orthogonal orientation θortho = θpref+π /2, as (Rpref − Rortho)/(Rpref + Rortho). Tuning width was the half-width at half-maximum of the fit above the baseline. Receptive field size was calculated from responses to full-field, 2°-thick light bars sweeping across the visual field in 16 evenly spaced directions. The responses from the 8 sweeps were binned at 100 ms and used to construct firing rate as a function of bar position. This was fitted with a two-dimensional Gaussian, with independent widths θx and θy, and RF radius was calculated by averaging the half-width at half-maximum of the two axes of the Gaussian fit.
Statistical analysis
All data are expressed as mean ± SEM except for otherwise noted. All measurements were analyzed by either Student’s t test using Excel, one- or two-way ANOVA with Bonferroni post-tests, χ2 test using GraphPad Prism software, or Kolmogorov-Smirnov test using Matlab.
Results
Levels of Bdnf mRNA and BDNF protein in the cerebral cortex
Bdnfklox/klox mice contain an insertion of multiple SV40 polyadenylation signal sequences shortly downstream of the first Bdnf polyadenylation site, which truncates the long Bdnf 3′UTR, converts long 3′UTR Bdnf mRNA to a short transcript, and abolishes export of Bdnf mRNA to dendrites of cortical and hippocampal neurons for local translation (An et al., 2008). As neuronal activity has been shown to stimulate translation of Bdnf mRNA through its long 3′UTR (Lau et al., 2010), the 3′UTR truncation in Bdnfklox/klox mice may affect Bdnf gene expression in addition to its effect on local BDNF synthesis. To test this possibility, we performed radioactive in situ hybridization on brain sections from WT and Bdnfklox/klox mice at 5 weeks of age using a probe against the Bdnf coding region. This experiment revealed no significant difference in levels of Bdnf mRNA in the visual cortex between WT and Bdnfklox/klox mice (Fig. 1A, B). Because it is difficult to dissect the visual cortex, we measured the concentration of BDNF in whole cerebral cortex using ELISA, which revealed that Bdnfklox/klox mice had a 38% reduction of total cortical BDNF compared to WT mice (Fig. 1C). These observations indicate that Bdnfklox/klox mice exhibit reduced total BDNF levels.
Figure 1.
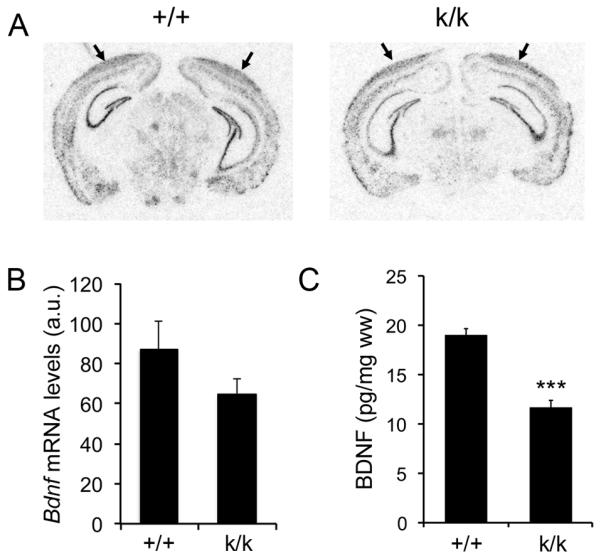
Levels of Bdnf mRNA and BDNF protein in the cerebral cortex of Bdnfklox/klox mice. A, Representative images of radioactive in situ hybridization of WT (+/+) and Bdnfklox/klox (k/k) coronal brain sections. Arrows denote the visual cortex. The sense probe did not reveal any signals. B, Quantification of radioactive in situ hybridization signal in the visual cortex of +/+ and k/k mice. Error bars indicate standard errors. Student’s t test, p = 0.253 (4 +/+ mice and 3 k/k mice). a.u. = arbitrary unit. C, ELISA analysis of cortical BDNF levels in 5-6-week-old +/+ and k/k mice (n=5 mice per genotype). Error bars indicate standard errors. Student’s t test, p < 0.001.
Normal shape and size of dendritic arbors of cortical layer 2/3 neurons in Bdnfklox/klox mice
We examined the effect of the lack of dendritic Bdnf mRNA on the dendritic arborization of cortical neurons using Golgi impregnation and software-assisted tracing of whole dendritic arbors of stained neurons. Golgi-stained layer 2/3 pyramidal neurons in the visual cortex from male WT and Bdnfklox/klox mice at 3 weeks or 4 months of age were examined under low magnification for their intactness, and all branches of a dendritic arbor were traced under high magnification using the Neurolucida software (Fig. 2A). Quantitative analysis of reconstructed neurons revealed no significant difference in number of dendritic branches and total dendritic length for both apical and basal dendrites between WT and Bdnfklox/klox mice at both ages (Fig. 2B, C). These observations indicate that BDNF synthesized in dendrites is not essential for dendritic arborization of layer 2/3 pyramidal neurons.
Figure 2.

Layer 2/3 pyramidal neurons in the Bdnfklox/klox visual cortex have normal dendritic arbors. A, Representative dendritic arbors of layer 2/3 pyramidal neurons, reconstructed with Neurolucida software from Golgi-impregnated brain sections of WT (+/+) and Bdnfklox/klox (k/k) mice at 3 weeks and 4 months of age. Scale bar: 50 μm. B, Number of dendritic branches and total length of dendrites are normal for layer 2/3 pyramidal neurons in k/k mice at 3 weeks of age. Error bars indicate standard errors. C, Number of dendritic branches and total length of dendrites are normal for layer 2/3 pyramidal neurons in k/k mice at 4 months of age. Error bars indicate standard errors. Quantification of dendritic arbors was made from 16 reconstructed neurons (4 neurons per mouse) at both ages.
Impaired maturation of dendritic spines in the visual cortex of Bdnfklox/klox mice
As dendritic spines in the cortical and subcortical regions mature during postnatal development, some spines are selectively eliminated while the remaining spines change morphology from long and thin to short and stubby in an activity-dependent manner (Marin-Padilla, 1967; Huttenlocher, 1979; Galofre and Ferrer, 1987; Grutzendler et al., 2002; Galvez and Greenough, 2005; Holtmaat et al., 2005; Zuo et al., 2005a). Adult Bdnfklox/klox mice displayed denser and thinner spines on apical dendrites of CA1 pyramidal neurons (An et al., 2008), suggesting that dendritic BDNF synthesis is required for spine maturation in the hippocampus. As activity regulates BDNF expression in the visual cortex (Lessmann et al., 2003), we reasoned that dendritically synthesized BDNF might control spine maturation there as well.
We first examined spine density by tracing all visible spines along shafts of the main apical dendrite and one major basal dendrites for a Golgi-stained layer 2/3 pyramidal neurons in the visual cortex using Neurolucida software (Fig. 2A, insert). This method allowed us to calculate spine density throughout the whole length of a dendrite. Because levels of total BDNF in the Bdnfklox/klox cerebral cortex were significantly reduced (Fig. 1C), we also analyzed Bdnf+/− mice, where BDNF levels are reduced by 46% (100 ± 10% for WT vs. 54 ± 4%, p = 0.0011, n = 6 mice per genotype) but some dendritic BDNF synthesis remains, in order to distinguish effects of a general BDNF reduction from those of a lack of dendritic BDNF synthesis. We found similar spine density at all distances away from the soma on both apical and basal dendrites between three genotypes of mice at 3 weeks of age (Fig. 3A, B). Furthermore, the average spine density for the whole apical or basal dendrite was not significantly different between three genotypes of mice at 3 weeks of age (Fig. 3C). However, the distal segments of both apical and basal dendrites did have significantly elevated spine densities in Bdnfklox/klox mice as compared with WT mice at 4 months of age (Fig. 3D, E). In addition, the average spine density on both apical and basal dendrites in Bdnfklox/klox mice was increased by 15% and 16%, respectively, compared with WT mice at 4 months of age (Fig. 3F). Importantly, spine density on both apical and basal dendrites was comparable between WT and Bdnf+/− mice (Fig. 3D-F). These observations indicate that the elevated spine density on distal dendrites in Bdnfklox/klox mice is caused by the loss of dendritic BDNF synthesis rather than the general reduction of BDNF level. Since Bdnfklox/klox mice had a smaller reduction in spine density from 3 weeks to 4 months of age (Fig. 3C, F), the elevated spine density phenotype likely results from deficits in spine pruning.
Figure 3.

Truncation of long Bdnf 3′UTR increases spine density in the mature visual cortex. A, Spine density along apical dendrites of layer 2/3 neurons in the visual cortex of WT (+/+), Bdnfklox/klox (k/k), and Bdnf+/− (+/−) mice at 3 weeks of age. There was a significant effect of genotype on spine density (two-way ANOVA: F(2, 2223) = 6.63, p = 0.0013), but Bonferroni post-tests did not found significant differences at all distances between genotypes. B, Spine density along basal dendrites of layer 2/3 neurons in the visual cortex of +/+, k/k, and +/− mice at 3 weeks of age. There was a significant effect of genotype on spine density (two-way ANOVA: F(2, 1521) = 8.01, p = 0.0003), but Bonferroni post-tests did not found significant differences at all distances between genotypes except at 10 μm away from soma between +/+ and k/k. C, Average spine density along apical and basal dendrites of layer 2/3 neurons in the visual cortex of +/+, k/k, and +/− mice at 3 weeks of age. Average spine density in k/k or +/− mice was not significantly different from +/+ mice (+/+ vs. k/k: p = 0.774 for apical dendrites and p = 0.129 for basal dendrites; +/+ vs. +/−: p = 0.209 for apical dendrites and p = 0.393 for basal dendrites; n=40 neurons from 4 mice per genotype). D, Spine density along apical dendrites of layer 2/3 neurons in the visual cortex of +/+, k/k, and +/− mice at 4 months of age. There was a significant effect of genotype on spine density (two-way ANOVA: F(2, 2223) = 62.22, p < 0.0001). Bonferroni post-tests revealed significant differences at 80 and 110-160 μm away from soma between +/+ and k/k mice (*, p < 0.05; **, p < 0.01; ***, p < 0.001). E, Spine density along basal dendrites of layer 2/3 neurons in the visual cortex of +/+, k/k, and +/− mice at 4 months of age. There was a significant effect of genotype on spine density (two-way ANOVA: F(2, 1521) = 38.37, p < 0.0001). Bonferroni post-tests revealed significant differences at 60, 80, 90, and 120 μm away from soma between +/+ and k/k mice (*, p < 0.05; **, p < 0.01; ***, p < 0.001). F, Average spine density along apical and basal dendrites of layer 2/3 neurons in the visual cortex of +/+, k/k, and +/− mice at 4 months of age. Significantly higher average spine density was found in k/k mice (apical dendrite: p = 0.0001; basal dendrite: p < 0.0001) but not in +/− mice (apical dendrite: p = 0.819; basal dendrite: p = 0.692) compared with +/+ mice (n=40 neurons from 4 mice per genotype).
We next examined spine size by taking high-magnification images of distal dendrites of Golgi-stained layer 2/3 neurons in the visual cortex and measuring head diameters and lengths of all visible spines (Fig. 4A). There were not detectable differences in lengths and head diameters of spines on either apical or basal dendrites between WT, Bdnfklox/klox, and Bdnf+/− mice at 3 weeks of age (Fig. 4B, E). Spine length decreased (Fig. 4B-D) while spine head diameter increased (Fig. 4E-G) from 3 weeks to 4 months of age in WT mice. These two morphological changes did not occur or were severely diminished in Bdnfklox/klox mice (Fig. 4B-G). These results indicate that in Bdnfklox/klox mice dendritic spines develop normally at least up to 3 weeks of age, but further spine maturation is impaired. At 4 months of age, dendritic spines in the visual cortex of Bdnf+/− mice were similar to WT mice but significantly different from Bdnfklox/klox mice in length and head diameter (Fig. 4C, D, F, G), except that the average spine head diameter of basal dendrites in Bdnf+/− mice was similar to Bdnfklox/klox mice and significantly smaller than WT mice (Fig. 4F). Therefore, the lack of dendritic BDNF synthesis rather than the reduced BDNF level in Bdnfklox/klox mice leads to longer and thinner spines in the adult visual cortex.
Figure 4.

Adult Bdnfklox/klox mice display long and thin dendritic spines in layer 2/3 neurons of the visual cortex. A, Representative apical and dendritic segments showing spine morphology of WT (+/+), Bdnfklox/klox (k/k), and Bdnf+/− (+/−) mice. B, Spine length at 3 weeks of age. Error bars indicate standard errors. C, Spine length at 4 months of age. Error bars indicate standard errors. D, Cumulative curves of spine length in +/+, k/k, and +/− mice at 4 months of age. E, Spine head diameter at 3 weeks of age. Error bars indicate standard errors. F, Spine head diameter at 4 months of age. Error bars indicate standard errors. G, Cumulative curves of spine head diameter in +/+, k/k, and +/− mice at 4 months of age. Four mice per genotype at each time point were used for examination of spine shape. Comparisons with +/+ mice by Student’s t test: *, p < 0.05; **, p < 0.01; ***, p < 0.001. Comparisons between k/k and +/− mice by Student’s t test: #, p < 0.05; ##, p < 0.01.
Taken together, these observations show that juvenile Bdnfklox/klox mice have normal dendritic spines but adult Bdnfklox/klox mice display denser, longer, and thinner spines in the visual cortex, likely due to impaired spine pruning and maturation. Since these spine phenotypes were absent or mild in Bdnf+/− mice, where total BDNF level in the cortex is reduced to a similar extent to Bdnfklox/klox mice, our observations further suggest that dendritic BDNF synthesis controls late-phase developmental spine changes, such as spine head enlargement, spine shortening, and spine pruning, in the visual cortex.
Reduced GABAergic innervation in the visual cortex of Bdnfklox/klox mice
BDNF has been shown to promote maturation of GABAergic circuitry (Huang et al., 1999; Hong et al., 2008). In order to investigate whether the GABAergic circuitry is altered in the visual cortex of Bdnfklox/klox mice, we immunostained brain sections from WT and Bdnfklox/klox mice at P21 and P60 with antibodies to the presynaptic GABA synthesizing enzyme, glutamic acid decarboxylase 65 (GAD65), or the presynaptic vesicular glutamate transporter 1, VGLUT1. We found that Bdnfklox/klox mice had a significant reduction by ~20% in density of GAD65-immunoreactive puncta at both ages (Fig. 5A, B), but normal density of VGLUT1-immunoreactive puncta in layer 2/3 of the visual cortex compared to WT controls (Fig. 5C, D). To determine whether the reduction in GABAergic presynaptic sites in Bdnfklox/klox mice is due to either the general decrease in total BDNF levels or lack of long 3′UTR Bdnf mRNA, we also immunostained brain sections from WT and Bdnf+/− mice at P28 with antibodies to GAD65 and VGLUT1. We found no differences between WT and Bdnf+/− mice either in the density of GAD65-immunoreactive puncta (100 ± 2% for WT vs. 104 ± 8% for Bdnf+/−, p = 0.69, n = 5 WT mice and 6 Bdnf+/− mice) or in the density of VGLUT1-immunoreactive puncta (100 ± 7% for WT vs. 101 ± 2% for Bdnf+/−, p = 0.92, n = 6 mice per genotype) at layer 2/3 of the visual cortex. These results indicate that GABAergic innervation in the visual cortex is deficient without dendritic Bdnf mRNA, but suggest glutamatergic innervation is normal.
Figure 5.

Density of GABA65-immunoreactive puncta is reduced in the visual cortex of Bdnfklox/klox mice. A, Representative confocal images of GAD65 immunostaining in the visual cortex of WT (+/+) and Bdnfklox/klox (k/k) mice at P21. Scale bars, 10 μm. B, Quantification of GAD65-immunoreactive puncta in the visual cortex of +/+ and k/k mice (n=6 mice per genotype). Error bars indicate standard errors. Student’s t test: *, p < 0.05. C, Representative confocal images of VGLUT1 immunostaining in the visual cortex of +/+ and k/k mice. Scale bars, 10 μm. D, Quantification of VGLUT1-immunoreactive puncta in the visual cortex of +/+ and k/k mice (n=6 per genotype). Error bars indicate standard errors.
Basal response properties of visual cortical neurons in Bdnfklox/klox mice are largely normal
To determine whether Bdnfklox/klox mutation affects the basal response properties of the primary visual cortex, we used intrinsic signal optical imaging to examine functional retinotopic organization and global responsiveness. The quality of retinotopic maps (Fig. 6A, B), the response magnitude (Fig. 6C), and the response area (Fig. 6D) were statistically indistinguishable between Bdnfklox/klox and WT mice. These observations suggest that lack of the long form of Bdnf transcripts and reduced level of BDNF protein did not affect the functional topography and overall visual responses in the primary visual cortex.
Figure 6.

Basal response properties of the visual cortex in Bdnfklox/klox mice are normal. A, Examples of topographic maps of the visual cortex in response to the horizontal stripe moving vertically (elevation map: left panels) and to the vertical bar moving horizontally (azimuth map: right panels) on the monitor, recorded using intrinsic signal imaging. The color codes on top represent positions of different elevation lines (left) or azimuth line (right) at which specific location of the visual cortex is maximally responsive to the moving stripe. Scale bar: 1 mm. B, Map scatter. To assess the quality of the map, we computed the map scatter by calculating the differences between the phase values of the individual pixels within the visual area to those of their near neighbors. These phase differences would be very small if the maps are “high quality” because of the smooth progression of phases. C, Peak response amplitude presented as fractional change in reflection. D, Response area was calculated by selecting the pixels with the threshold of 30% of the peak amplitude. Error bars represent standard errors. N=4 +/+ mice and 5 k/k mice. There was no significant difference between +/+ and k/k mice (Student’s t test).
We also examined responsiveness and receptive field properties in Bdnfklox/klox mice at the level of individual neurons in vivo. Units were recorded from L2/3 and L4 and classified as narrow-spiking or broad-spiking based on their spike waveform (Niell and Stryker, 2008), as previous studies have suggested that narrow-spiking cells correspond to inhibitory, predominantly fast-spiking interneurons (McCormick et al., 1985; Connors and Kriegstein, 1986; Bartho et al., 2004). Response magnitude (Fig. 7B) and most of other receptive field properties of putative excitatory (broad-spiking) neurons were indistinguishable between Bdnfklox/klox mice and WT littermates (Fig. 7D-F) with two exceptions. First, the spontaneous firing rate was higher in Bdnfklox/klox mice than in WT mice (Fig. 7A). Second, putative excitatory neurons in Bdnfklox/klox mice were less well tuned for orientation selectivity (OS) than those in WT littermates (Fig. 7C). Putative inhibitory (narrow-spiking) neurons showed spontaneous and evoked firing rates (Fig. 7G, H) and other receptive field properties (data now shown) that were similar between Bdnfklox/klox and WT littermates. Thus, results of single unit recording show that neurons in upper layers in Bdnfklox/klox visual cortex respond normally to visual stimuli for the most part, consistent with the observations made in intrinsic signal imaging.
Figure 7.

Basal response properties of individual neurons in the visual cortex of Bdnfklox/klox mice. A, Spontaneous firing rates in broad-spiking (putative excitatory) cells (WT: +/+, 295 cells; Bdnfklox/klox: k/k, 274 cells). B, Response rates to the optimal grating (best orientation at best spatial frequency) recorded in the same populations as those in (A). C, Orientation selectivity index (OSI) of broad-spiking cells that were responsive to the gratings stimuli (> 2 spikes/s). +/+, 240 cells; k/k, 237 cells. D, Orientation tuning width in broad-spiking units that were responsive to the gratings (same populations as in C). E, Preferred spatial frequency in broad-spiking cells responsive to the gratings (same population as in C). F, Receptive field (RF) size in broad-spiking cells. RF size was analyzed in selected cells from the population shown in A and B based on responses of > 4 spikes/s to the bar with optimal orientation. +/+, 261 cells; k/k, 234 cells. G, Spontaneous firing rates in narrow-spiking (putative inhibitory) cells. +/+, 119 cells; k/k, 88 cells. H, Response rates to the optimal grating of narrow-spiking cells (same populations as in G). All data are presented as the cumulative frequency distribution. P values derived from Kolmogorov-Smirnov tests are indicated in each panel.
Impaired recovery of cortical responses in Bdnfklox/klox mice during critical period
To determine the effect of Bdnf 3′UTR truncation on cortical plasticity in vivo during the peak of critical period, we examined changes in cortical responses after manipulations of visual input: (1) 5 days of monocular deprivation (MD) starting at P25-26 and (2) 4 additional days after re-opening the closed eye. We measured cortical responses to right- and left-eye stimulation restricted to the binocular portion of the visual field by recording intrinsic signals repeatedly in individual animals before and after manipulation of visual experiences (Fig. 8A).
Figure 8.

Bdnfklox/klox mice show impaired recovery of responsiveness after ending monocular deprivation during critical period. A, Experimental schedule. MD: monocular deprivation. B and C, Change in visual cortical responses to the closed eye (B) and to the open eye (C) measured by repeated optical imaging of intrinsic signals, after 5 days of MD followed by 4 days of binocular vision (recovery) in Bdnfklox/klox mice (k/k, n = 6) and WT littermates (+/+, n = 6). D, Ocular dominance index calculated from data shown in B and C. E and F, Change in visual cortical responses to the closed eye (E) and to the open eye (F) measured by repeated optical imaging of intrinsic signals, after 5 days of MD followed by 4 days of binocular vision (recovery) in Bdnf+/− mice (+/−, n = 4) and their +/+ littermates (n = 4). G, Ocular dominance index derived from data shown in E and F. H, Percent change from baseline in closed-eye responses, calculated from data presented in B and E. Two populations of +/+ mice were pooled as there were no significant differences between them. I, Percent change from baseline in open-eye responses, calculated from data shown in C and F. WT mice in C and F were combined. Data represent mean ± s.e.m. Response amplitude is expressed as fractional change in reflectance (ΔR/R) × 104. ‡, p < 0.01, †, p < 0.05 compared with baseline, repeated measure ANOVA followed by multiple comparisons with Bonferroni correction. *, p < 0.05 between genotypes, one-way ANOVA followed by multiple comparisons with Bonferroni correction.
MD during the critical period induces two distinct changes: a decrease in closed-eye responses and an increase in open-eye responses (Frenkel and Bear, 2004; Kaneko et al., 2008a). A robust decrease in response amplitude to closed-eye stimulation was observed both in WT and Bdnfklox/klox mice after 5 days of MD (Fig. 8B) (−29.1 ± 12.1% for WT and −27.9 ± 7.5% for Bdnfklox/klox; p > 0.05). The increase in response amplitude through the open-eye in Bdnfklox/klox mice (28.7 ± 7.4%) was also not different from that in WT mice (24.9 ± 8.6%, p > 0.05) (Fig. 8C). As a result, changes in ocular dominance index (ODI) computed from responses to two eyes after 5 days of MD in Bdnfklox/klox mice (−0.013 ± 0.040) were indistinguishable from those in WT mice (0.007 ± 0.057, p > 0.05) (Fig. 8D).
A second dramatic manifestation of cortical plasticity is the recovery of responsiveness to the closed eye when normal vision is restored. In WT mice, opening the previously closed eye to allow binocular vision (BV) restored responses to both eyes to their baseline levels measured prior to the initial MD (re-opened eye: 1.2 ± 8.6%, open eye: 5.1 ± 6.3%, from baseline) (Fig. 8B, C); as a result, ODI was shifted back to its original state (baseline: 0.27 ± 0.02, recovery: 0.23 ± 0.03, p > 0.05) (Fig. 8D). In striking contrast to its lack of effect on MD, the Bdnf 3′UTR mutation prevented this recovery (Fig. 8B, C). Both the previously closed- and open-eye responses failed to recover from the effect of MD (re-opened eye: −16.4 ± 8.6%, open eye: 19.8 ± 12.3% from baseline) (Fig. 8H, I). Thus, ODI was not restored to the baseline level in Bdnfklox/klox mice (Fig. 8D) (baseline: 0.27 ± 0.02, recovery: 0.08 ± 0.02, p < 0.01).
To determine whether the impaired recovery in Bdnfklox/klox mice results from the lack of dendritic BDNF synthesis or merely from the reduced level of BDNF protein, we examined Bdnf+/− mice in which BDNF is present in dendrites but reduced overall. Consistent with a previous report (Bartoletti et al., 2002), the ocular dominance shift following MD was normal in Bdnf+/− mice; moreover, both closed-eye responses and open-eye responses were restored to the baseline level at 4 days following BV (Fig. 8E–I). Thus, these results show that lack of dendritic BDNF synthesis, but not general reduction of BDNF level, specifically impairs restoration of responsiveness and ocular dominance in the juvenile visual cortex and are consistent with our previous observations that showed TrkB kinase activity is required acutely during the period of recovery (Kaneko et al., 2008b).
Impaired recovery at the single-cell level in Bdnfklox/klox mice
To further examine the impaired recovery in Bdnfklox/klox mice, which was revealed at a large scale by intrinsic signal imaging, we recorded extracellular single unit activities in the binocular area of the primary visual cortex 4 days after re-opening the closed eye. In WT and Bdnf+/− mice after 4d of BV, the OD score distribution was similar to that of non-deprived animals (Fig. 9A, C) (Gordon and Stryker, 1996) and the computed contralateral bias index (CBI) was returned to within the range of non-deprived wild type animals (Fig. 9D). Consistent with the observation with intrinsic signal imaging, in Bdnfklox/klox mice after the recovery period, the OD score was significantly shifted toward the open eye (p < 0.05, vs. WT and +/−, χ2 tests) (Fig. 9B) and the average CBI was significantly smaller than that of WT and Bdnf+/− mice (WT: 0.69 ± 0.05, +/−: 0.67 ± 0.04, k/k: 0.52 ± 0.05, p < 0.05, one-way ANOVA) (Fig. 9D). Thus, extracellular single unit recordings confirmed the findings from optical imaging.
Figure 9.

Impaired recovery of ocular dominance in binocular visual cortex of Bdnfklox/klox mice, examined with electrophysiological single unit recording. A-C, Distribution of ocular dominance score of individual cells in the binocular visual cortex after 4 days of binocular vision preceded by 5 days of MD in WT (+/+) mice (A) and in Bdnfklox/klox (k/k) mice (B), and in Bdnf+/− (+/−) mice (C). D, Contralateral bias index (CBI) for each animal (circles) and group averages (bars), computed from ocular dominance scores shown in A–C. The shaded area represents the range of CBI in wild type animals with normal visual experience at similar ages (taken from Gordon and Stryker, 1996). *, p < 0.05 between genotypes by one-way ANOVA followed by multiple comparisons with Bonferroni correction.
Experience-dependent plasticity in adult visual cortex
Our anatomical examinations demonstrate abnormal spine morphology in L2/3 pyramidal neurons and reduced GABA-synthesizing enzyme in the adult visual cortex of Bdnfklox/klox mice (see above). Also, a previous study showed impaired long-term potentiation, a form of activity-dependent plasticity, in hippocampal slices from adult Bdnfklox/klox mice (An et al., 2008). Therefore, we investigated whether experience-dependent plasticity in the adult visual cortex is altered in Bdnfklox/klox mice.
Experience-dependent plasticity in the adult mouse visual cortex following MD is slower and smaller than that during the critical period and consists primarily of an increase in the strength of responses through the open eye (Sawtell et al., 2003; Hofer et al., 2006; Prusky et al., 2006; Sato and Stryker, 2008). Consistent with these previous observations, open-eye responses in the binocular visual cortex of WT mice following MD were strengthened (7d: 32.8 ± 8.2%, 14d: 39.8 ± 7.3% from baseline) without significant changes in closed-eye responses (7d: 2.8 ± 2.4%, 14d: 2.1 ± 2.3% from baseline) (Fig. 10A, B), resulting in a modest but significant shift in ocular dominance (Fig. 10C). In contrast, closed-eye responses were significantly decreased in Bdnfklox/klox mice following MD (7d: −17.5 ± 4.3%, 14d: −17 ± 2.9% from baseline), while the increase in open-eye responses was in similar magnitude to that of WT littermates (7d: 26.9 ± 9.1%, 14d: 34.2 ± 6.8% from baseline) (Fig. 10A, B). As a result, the ocular dominance shift in Bdnfklox/klox mice was greater than that in WT littermates (Fig. 10C). To determine whether the greater decrease in closed-eye responses in Bdnfklox/klox mice was a result of competition between inputs from two eyes, we examined the responses of the monocular portion of visual cortex, which receives inputs exclusively from the closed eye. The monocular zone of the visual cortex did not show significant changes in responsiveness following either 7 or 14 days of MD in WT mice. In contrast, closed-eye responses in the monocular zone of Bdnfklox/klox mice were significantly decreased following MD (7d: −12.8 ± 3.3%, 14d: −19.5 ± 2.7% from baseline) (Fig. 10D). The result in the binocular zone of visual cortex would by itself suggest that plasticity in the adult is enhanced in Bdnfklox/klox mice compared to WT littermates. However, when the results in the binocular and monocular zones are combined, they reveal that it is the maintenance of cortical responsiveness following visual deprivation that is impaired in Bdnfklox/klox mice.
Figure 10.

Maintenance of cortical responsiveness following visual deprivation is impaired in adult Bdnfklox/klox mice. A and B, Change in response amplitude to the closed eye (A) and open eye (B), measured by chronic optical imaging of intrinsic signals in the binocular visual cortex of Bdnfklox/klox (k/k, n = 6) mice and wild type (+/+, n = 5) littermates. MD was started at P75-80. C, Change in the ocular dominance index (ODI) computed from data shown in A and B. D, Change in response amplitude in the monocular visual cortex contralateral to the closed eye in k/k mice (n=6) and +/+ littermates (n=5). For A-D, **, p < 0.01 and *, p < 0.05 between genotypes, two-way ANOVA followed by multiple comparisons with Bonferroni correction. E, Responses to the deprived eye and open eye in the binocular visual cortex of TrkBF616A homozygous mice treated with vehicle solution or 1NM-PP1. Responses were measured in acute experiments in mice with normal visual experience (ND, vehicle: n = 5, 1NM-PP1: n = 5) and in mice after 7-9 days of MD starting at P65–75 (MD, vehicle: n = 6, 1NM-PP1: n = 6). F, Ocular dominance index (ODI) of TrkBF616A homozygous mice computed from data shown in E. ns: not significantly different. †, p < 0.05 compared with corresponding ND mice, one-way ANOVA followed by multiple comparisons with Bonferroni correction. Data in A–F are presented as mean ± s.e.m. G and H, Distribution of the ocular dominance score in +/+ (G) and k/k (H) mice after 10–14 days of MD starting at P75–80. I, Contralateral bias index (CBI) for each animal (circles) and group averages (bars) calculated from OD scores shown in G and H. The shaded area represents the range of CBI in wild-type animals with normal visual experience. #, p < 0.05 by Student’s t test.
To determine whether the depression of cortical responses following MD in adulthood in Bdnfklox/klox mice is a direct effect of the decreased TrkB activation at the time of deprivation due to the reduced level of BDNF protein, we specifically blocked BDNF-TrkB signaling only during the deprivation period using a chemical genetic method (Chen et al., 2005; Kaneko et al., 2008b) and examined ocular dominance plasticity. Responses to the closed eye were not significantly changed after 7-9 days of MD in TrkBF616A mice treated with either vehicle solution (control) or 1NM-PP1 (TrkB inhibition). Responses to the open eye tended to be larger after MD than those in non-deprived animals, although not statistically significantly, in both groups (Fig. 9E). As a result, ocular dominance was mildly but significantly shifted in 1NM-PP1-treated mice similar to vehicle-controls (vehicle: 0.13 ± 0.03, 1NM-PP1: 0.14 ± 0.02, p > 0.05 between groups). These results revealed that acute inhibition of TrkB kinase activity did not lead to depression of closed-eye responses.
We further confirmed altered plasticity in Bdnfklox/klox mice by recording visually evoked spikes of individual neurons in L2/3 and 4 after 10–14 days of MD that started at P75–80. Consistent with observations above, Bdnfklox/klox mice showed the distribution of OD scores significantly more shifted toward the open eye compared to WT littermates (p = 0.005, χ2 test; Fig. 10G, H). As a result, average CBI was significantly lower in Bdnfklox/klox mice (0.58 ± 0.04) than WT mice (WT: 0.66 ± 0.03, k/k: 0.58 ± 0.04, p = 0.016, Student’s t-test, Fig. 10I).
The previous study demonstrated that the normal OD shift in adult Bdnf+/− mice (Bartoletti et al., 2002) and thus indicates that the generalized decrease in the BDNF protein level throughout development does not alter OD plasticity in mature visual cortex. Taken together, our observations suggest that the depression of closed-eye responses by MD in adult Bdnfklox/klox mice was the specific consequence of lack of dendritic BDNF synthesis during development, rather than its lack during adulthood.
Discussion
Sensory experience induces alterations in neuronal connections within the cerebral cortex during postnatal development that plays a key role in refinement of neural circuits and adaptation to new environment. Our results indicate that BDNF derived from long 3′UTR Bdnf mRNA is required for some of these activity-dependent synaptic modifications, both structurally and functionally. We found that lack of long 3′UTR Bdnf mRNA in Bdnfklox/klox mice led to denser and less mature dendritic spines in the adult visual cortex and diminished the capacity of the visual cortex to recover from the effects of monocular deprivation during the critical period and to maintain cortical responsiveness following MD in adulthood. As the truncation of the long 3′UTR will not affect the promoter activity of the Bdnf gene in Bdnfklox/klox mice, these findings implicate the dendritic translation of long 3′UTR Bdnf mRNA in the observed effects on synaptic structure and function.
In addition to deficient dendritic localization of Bdnf mRNA, Bdnfklox/klox mice also have a 38% reduction in total BDNF levels in the cerebral cortex compared to WT mice. As activity stimulates translation of long 3′UTR Bdnf mRNA and suppresses translation of short 3′UTR Bdnf mRNA (Lau et al., 2010), the loss of the long Bdnf 3′UTR may diminish activity-dependent translation of Bdnf mRNA in Bdnfklox/klox mice. The normal BDNF levels in Bdnfklox/klox mice, as demonstrated by Western blots in our previous study (An et al., 2008), may be due to the inclusion of nonspecific proteins at the proBDNF band. Even though Bdnfklox/klox mice have decreased total BDNF levels, the results reported here indicate that the spine and cortical plasticity phenotypes observed in Bdnfklox/klox mice result from lack of local dendritic BDNF synthesis instead of a general reduction in BDNF levels, because Bdnf+/− mice did not display these phenotypes.
Long-term in vivo imaging studies show that cortical L5 pyramidal neurons normally lose ~20% of dendritic spines on distal apical dendrites due to pruning from 4 weeks to 4 months of age (Grutzendler et al., 2002; Zuo et al., 2005a; Zuo et al., 2005b). Consistent with this observation, we found that the overall spine density at apical dendrites and basal dendrites of L2/3 neurons was reduced by 36% and 31%, respectively, in the visual cortex of WT mice from 3 weeks to 4 months of age, using Golgi staining and Neurolucida tracing. In Bdnfklox/klox mice this spine elimination process was significantly diminished, as was spine maturation as evidenced by reduced spine head diameter and increased spine length. Similarly abnormal spine shape and spine density were observed in hippocampal CA1 neurons of adult Bdnfklox/klox mice (An et al., 2008). Bdnfklox/klox mice lack dendritic Bdnf mRNA duo to a truncation of the long 3′UTR and thus dendritic BDNF synthesis (An et al., 2008). Taken together, these results indicate that dendritic BDNF synthesis is required for spine pruning and late-phase spine maturation in cortical and hippocampal areas.
BDNF is important for growth and maintenance of dendrites in the cerebral cortex, as BDNF overexpression promotes dendritic growth of L4 and L5 neurons in cultured cortical slices (McAllister et al., 1995) and deletion of either the Bdnf or TrkB gene reduces the complexity of dendritic arbors of L2/3 cortical neurons (Xu et al., 2000; Gorski et al., 2003). However, we detected normal number and length of both apical and basal dendrites for L2/3 neurons in the visual cortex of Bdnfklox/klox mice at either 3 weeks or 4 months of age. This data suggests that dendritically synthesized BDNF is not required or is redundant with somatically synthesized BDNF for the overall dendritic arborization of L2/3 cortical neurons.
Although precise mechanisms for reduced GABAergic synapses in Bdnfklox/klox cortex remain unknown, two possibilities seem likely. First, dendritically released BDNF may act retrogradely on GABAergic terminals innervating vicinity. Acute loss of the Bdnf gene in single pyramidal cells led to reduction of GABAergic terminals (Kohara et al., 2007), suggesting a retrograde trophic action of BDNF on inhibitory synapses. A small fraction of GABAergic innervation targets the dendrites (Markram et al., 2004) and thus they could be affected by lack of dendritic BDNF that would normally promote the formation of GABAergic synapses through its local actions. In addition, the immature excitatory synapses may lead to a compensatory reduction in inhibition at the circuit level. The immature spines of Bdnfklox/klox pyramidal neurons have smaller heads that are associated with reduced excitation (Harris et al., 2003; Matsuzaki et al., 2004; Noguchi et al., 2005). Prolonged weak activation of the circuit can lead to changes in excitatory to inhibitory balance through multiple difference mechanisms (Maffei and Fontanini, 2009). This idea is consistent with the present observation that visually evoked firing in both excitatory and inhibitory cells are normal in adult Bdnfklox/klox cortex; higher spontaneous firing in Bdnfklox/klox excitatory cells may reflect decreased inhibition. Note however, GABAergic synapses are already reduced at juvenile stage when spine morphology between WT and Bdnfklox/klox mice is similar, suggesting that this second possibility is not the full explanation.
This study reveals two distinct effects of lacking dendritic BDNF on experience-dependent visual cortical plasticity: first, impairment of recovery of responsiveness from depression induced by MD during the critical period; second, failure to maintain responsiveness in adult cortex when sensory input is disrupted. The underlying mechanisms for these two effects are likely different since acute blockade of BDNF-TrkB signaling inhibits recovery (Kaneko et al., 2008b) but has no effect on plasticity induced by MD in adults (present study).
Thus we propose that acute action of dendritic BDNF during the induction of recovery, but not its longer-term effects during prior developmental stages, mediates recovery. MD induces shrinkage and loss of spines of pyramidal neurons in L2/3 (Mataga et al., 2004) and functional recovery is thought to be produced by regrowth and maturation of spines. BDNF expression in the visual cortex is widely down-regulated during MD (Majdan and Shatz, 2006) while rapidly restored to the normal level following re-opening the deprived eye as afferent inputs from two eyes together effectively activate pyramidal neurons to express BDNF (Kaneko, unpublished data). This experience-dependent up-regulation of BDNF most likely includes translation of long 3′UTR transcripts in dendrites as this process depends on neuronal activities (An et al., 2008). The dendritically produced BDNF may act in an autocrine or paracrine manner locally on neighboring spines, which is consistent with the observation that presynaptically released BDNF was not required for development of spines of pyramidal neurons (Kohara et al., 2003). These ideas are also consistent with the activity- and BDNF-dependent enlargement of spines shown in vitro (Tanaka et al., 2008).
We found that MD in adult Bdnfklox/klox mice significantly decreased the closed-eye responses in both binocular and monocular visual cortex, which was not observed in WT mice, and left normal increase in open-eye responses, resulting in a larger OD shift compared to WT mice. This abnormally enhanced plasticity in the adult visual cortex is unlikely due to the small but significant reduction in the density of GAD65 puncta in Bdnfklox/klox mice. First, our results show that the reduction in GAD65 puncta remains similar in the visual cortex of Bdnfklox/klox mice from juvenile to adulthood, but MD-induced OD shift is normal in Bdnfklox/klox mice during the critical period. Second, deletion of the gene for GAD65 prevents the competitive loss of responsiveness to the closed eye (Hensch et al., 1998), which is opposite to what we observed in adult Bdnfklox/klox mice.
Then abnormal plasticity in visual cortex of Bdnfklox/klox mice is likely to be a consequence of the lack of dendritic BDNF synthesis throughout postnatal life, impairing spine maturation as shown above. In WT mice, dendritic spines continue to mature after the 3rd postnatal week, as evidenced by lower spine density, shorter spine length and larger spine heads at 4 months of age compared with 3 weeks of age. Maturation of dendritic spines in Bdnfklox/klox mice is impaired after the 3rd postnatal week, leading the spines at 4 months of age to resemble those at 3 weeks of age. The immature spine morphology correlates well with the loss of responsiveness to the closed eye induced by MD in adult and juvenile Bdnfklox/klox mice and juvenile WT mice. The loss of responsiveness that is characteristic of OD plasticity induced by MD during critical period is associated with change in synaptic properties such as long-term depression (Rittenhouse et al., 1999) and with actual loss of synapses as described above. At any given age, thin spines tend to turnover quickly and most thick spines persist for long period (Grutzendler et al., 2002; Holtmaat et al., 2005; Zuo et al., 2005b). Visual deprivation in juvenile mice in which spines are not fully mature increases spine motility, leaving spines less stable (Majewska and Sur, 2003). Therefore, immature thin spines in adult Bdnfklox/klox cortex may well be susceptible and prone to disappear without normal sensory inputs. These results suggest that spine maturation promoted by dendritically synthesized BDNF during normal development is required to maintain cortical responsiveness after a period of sensory deprivation in adulthood.
Spine pruning and stabilization are driven by normal sensory experience during development (Zuo et al., 2005b; Holtmaat et al., 2006). The impaired spine maturation beyond 3rd postnatal week in the visual cortex of Bdnfklox/klox mice suggests that dendritic BDNF participates in the activity-dependent pruning and growth of spines during normal cortical development. Dendritic BDNF is also essential for recovery of deprived-eye responsiveness in visual cortex following restoration of binocular vision. In the adult, the immature spines Bdnfklox/klox mice leave the cortex fragile, incapable of sustaining responsiveness in the face of sensory deprivation. Neurological disorders and neurodegenerative diseases are frequently associated with abnormal spine structure and plasticity in critical brain regions. Further elucidation of mechanisms underlying dendritic BDNF synthesis-dependent spine maturation and abnormal cortical plasticity caused by deficiency in dendritic BDNF synthesis will advance our understanding of such disorders.
Acknowledgments
We thank Kevin Jones for the Bdnfklox/klox mouse strain and YA Barde for sharing unpublished data regarding BDNF levels in Bdnfklox/klox mice. This work was supported by grants from the US National Institutes of Health to B.X. (R01 NS050596 and R01 NS073930) and M.P.S. (P50 MH077972 and R01 EY02874).
References
- An JJ, Gharami K, Liao GY, Woo NH, Lau AG, Vanevski F, Torre ER, Jones KR, Feng Y, Lu B, Xu B. Distinct role of long 3′ UTR BDNF mRNA in spine morphology and synaptic plasticity in hippocampal neurons. Cell. 2008;134:175–187. doi: 10.1016/j.cell.2008.05.045. [DOI] [PMC free article] [PubMed] [Google Scholar]
- Bartho P, Hirase H, Monconduit L, Zugaro M, Harris KD, Buzsaki G. Characterization of neocortical principal cells and interneurons by network interactions and extracellular features. Journal of neurophysiology. 2004;92:600–608. doi: 10.1152/jn.01170.2003. [DOI] [PubMed] [Google Scholar]
- Bartoletti A, Cancedda L, Reid SW, Tessarollo L, Porciatti V, Pizzorusso T, Maffei L. Heterozygous knock-out mice for brain-derived neurotrophic factor show a pathway-specific impairment of long-term potentiation but normal critical period for monocular deprivation. J Neurosci. 2002;22:10072–10077. doi: 10.1523/JNEUROSCI.22-23-10072.2002. [DOI] [PMC free article] [PubMed] [Google Scholar]
- Baydyuk M, Russell T, Liao GY, Zang K, An JJ, Reichardt LF, Xu B. TrkB receptor controls striatal formation by regulating the number of newborn striatal neurons. Proc Natl Acad Sci U S A. 2011;108:1669–1674. doi: 10.1073/pnas.1004744108. [DOI] [PMC free article] [PubMed] [Google Scholar]
- Cabelli RJ, Hohn A, Shatz CJ. Inhibition of ocular dominance column formation by infusion of NT-4/5 or BDNF. Science. 1995;267:1662–1666. doi: 10.1126/science.7886458. [DOI] [PubMed] [Google Scholar]
- Cabelli RJ, Shelton DL, Segal RA, Shatz CJ. Blockade of endogenous ligands of trkB inhibits formation of ocular dominance columns. Neuron. 1997;19:63–76. doi: 10.1016/s0896-6273(00)80348-7. [DOI] [PubMed] [Google Scholar]
- Cang J, Niell CM, Liu X, Pfeiffenberger C, Feldheim DA, Stryker MP. Selective disruption of one Cartesian axis of cortical maps and receptive fields by deficiency in ephrin-As and structured activity. Neuron. 2008;57:511–523. doi: 10.1016/j.neuron.2007.12.025. [DOI] [PMC free article] [PubMed] [Google Scholar]
- Castren E, Zafra F, Thoenen H, Lindholm D. Light regulates expression of brain-derived neurotrophic factor mRNA in rat visual cortex. Proc Natl Acad Sci U S A. 1992;89:9444–9448. doi: 10.1073/pnas.89.20.9444. [DOI] [PMC free article] [PubMed] [Google Scholar]
- Chen X, Ye H, Kuruvilla R, Ramanan N, Scangos KW, Zhang C, Johnson NM, England PM, Shokat KM, Ginty DD. A chemical-genetic approach to studying neurotrophin signaling. Neuron. 2005;46:13–21. doi: 10.1016/j.neuron.2005.03.009. [DOI] [PubMed] [Google Scholar]
- Connors BW, Kriegstein AR. Cellular physiology of the turtle visual cortex: distinctive properties of pyramidal and stellate neurons. The Journal of neuroscience: the official journal of the Society for Neuroscience. 1986;6:164–177. doi: 10.1523/JNEUROSCI.06-01-00164.1986. [DOI] [PMC free article] [PubMed] [Google Scholar]
- Fagiolini M, Hensch TK. Inhibitory threshold for critical-period activation in primary visual cortex. Nature. 2000;404:183–186. doi: 10.1038/35004582. [DOI] [PubMed] [Google Scholar]
- Frenkel MY, Bear MF. How monocular deprivation shifts ocular dominance in visual cortex of young mice. Neuron. 2004;44:917–923. doi: 10.1016/j.neuron.2004.12.003. [DOI] [PubMed] [Google Scholar]
- Galofre E, Ferrer I. Development of dendritic spines in the Vth’s layer pyramidal neurons of the rat’s somatosensory cortex. A qualitative and quantitative study with the Golgi method. J Hirnforsch. 1987;28:653–659. [PubMed] [Google Scholar]
- Galvez R, Greenough WT. Sequence of abnormal dendritic spine development in primary somatosensory cortex of a mouse model of the fragile X mental retardation syndrome. Am J Med Genet A. 2005;135:155–160. doi: 10.1002/ajmg.a.30709. [DOI] [PubMed] [Google Scholar]
- Gordon JA, Stryker MP. Experience-dependent plasticity of binocular responses in the primary visual cortex of the mouse. J Neurosci. 1996;16:3274–3286. doi: 10.1523/JNEUROSCI.16-10-03274.1996. [DOI] [PMC free article] [PubMed] [Google Scholar]
- Gorski JA, Zeiler SR, Tamowski S, Jones KR. Brain-derived neurotrophic factor is required for the maintenance of cortical dendrites. J Neurosci. 2003;23:6856–6865. doi: 10.1523/JNEUROSCI.23-17-06856.2003. [DOI] [PMC free article] [PubMed] [Google Scholar]
- Grutzendler J, Kasthuri N, Gan WB. Long-term dendritic spine stability in the adult cortex. Nature. 2002;420:812–816. doi: 10.1038/nature01276. [DOI] [PubMed] [Google Scholar]
- Hanover JL, Huang ZJ, Tonegawa S, Stryker MP. Brain-derived neurotrophic factor overexpression induces precocious critical period in mouse visual cortex. J Neurosci. 1999;19:RC40. doi: 10.1523/JNEUROSCI.19-22-j0003.1999. [DOI] [PMC free article] [PubMed] [Google Scholar]
- Harris KM, Fiala JC, Ostroff L. Structural changes at dendritic spine synapses during long-term potentiation. Philosophical transactions of the Royal Society of London Series B, Biological sciences. 2003;358:745–748. doi: 10.1098/rstb.2002.1254. [DOI] [PMC free article] [PubMed] [Google Scholar]
- Hensch TK. Critical period plasticity in local cortical circuits. Nature reviews Neuroscience. 2005;6:877–888. doi: 10.1038/nrn1787. [DOI] [PubMed] [Google Scholar]
- Hensch TK, Fagiolini M, Mataga N, Stryker MP, Baekkeskov S, Kash SF. Local GABA circuit control of experience-dependent plasticity in developing visual cortex. Science. 1998;282:1504–1508. doi: 10.1126/science.282.5393.1504. [DOI] [PMC free article] [PubMed] [Google Scholar]
- Hofer SB, Mrsic-Flogel TD, Bonhoeffer T, Hubener M. Prior experience enhances plasticity in adult visual cortex. Nature neuroscience. 2006;9:127–132. doi: 10.1038/nn1610. [DOI] [PubMed] [Google Scholar]
- Holtmaat A, Wilbrecht L, Knott GW, Welker E, Svoboda K. Experience-dependent and cell-type-specific spine growth in the neocortex. Nature. 2006;441:979–983. doi: 10.1038/nature04783. [DOI] [PubMed] [Google Scholar]
- Holtmaat AJ, Trachtenberg JT, Wilbrecht L, Shepherd GM, Zhang X, Knott GW, Svoboda K. Transient and persistent dendritic spines in the neocortex in vivo. Neuron. 2005;45:279–291. doi: 10.1016/j.neuron.2005.01.003. [DOI] [PubMed] [Google Scholar]
- Hong EJ, McCord AE, Greenberg ME. A biological function for the neuronal activity-dependent component of Bdnf transcription in the development of cortical inhibition. Neuron. 2008;60:610–624. doi: 10.1016/j.neuron.2008.09.024. [DOI] [PMC free article] [PubMed] [Google Scholar]
- Huang ZJ, Kirkwood A, Pizzorusso T, Porciatti V, Morales B, Bear MF, Maffei L, Tonegawa S. BDNF regulates the maturation of inhibition and the critical period of plasticity in mouse visual cortex. Cell. 1999;98:739–755. doi: 10.1016/s0092-8674(00)81509-3. [DOI] [PubMed] [Google Scholar]
- Hubel DH, Wiesel TN. Receptive fields, binocular interaction and functional architecture in the cat’s visual cortex. J Physiol. 1962;160:106–154. doi: 10.1113/jphysiol.1962.sp006837. [DOI] [PMC free article] [PubMed] [Google Scholar]
- Huttenlocher PR. Synaptic density in human frontal cortex - developmental changes and effects of aging. Brain Res. 1979;163:195–205. doi: 10.1016/0006-8993(79)90349-4. [DOI] [PubMed] [Google Scholar]
- Huttenlocher PR, de Courten C, Garey LJ, Van der Loos H. Synaptogenesis in human visual cortex--evidence for synapse elimination during normal development. Neurosci Lett. 1982;33:247–252. doi: 10.1016/0304-3940(82)90379-2. [DOI] [PubMed] [Google Scholar]
- Kalatsky VA, Stryker MP. New paradigm for optical imaging: temporally encoded maps of intrinsic signal. Neuron. 2003;38:529–545. doi: 10.1016/s0896-6273(03)00286-1. [DOI] [PubMed] [Google Scholar]
- Kaneko M, Stellwagen D, Malenka RC, Stryker MP. Tumor necrosis factor-alpha mediates one component of competitive, experience-dependent plasticity in developing visual cortex. Neuron. 2008a;58:673–680. doi: 10.1016/j.neuron.2008.04.023. [DOI] [PMC free article] [PubMed] [Google Scholar]
- Kaneko M, Hanover JL, England PM, Stryker MP. TrkB kinase is required for recovery, but not loss, of cortical responses following monocular deprivation. Nat Neurosci. 2008b;11:497–504. doi: 10.1038/nn2068. [DOI] [PMC free article] [PubMed] [Google Scholar]
- Kohara K, Yasuda H, Huang Y, Adachi N, Sohya K, Tsumoto T. A local reduction in cortical GABAergic synapses after a loss of endogenous brain-derived neurotrophic factor, as revealed by single-cell gene knock-out method. J Neurosci. 2007;27:7234–7244. doi: 10.1523/JNEUROSCI.1943-07.2007. [DOI] [PMC free article] [PubMed] [Google Scholar]
- Kohara K, Kitamura A, Adachi N, Nishida M, Itami C, Nakamura S, Tsumoto T. Inhibitory but not excitatory cortical neurons require presynaptic brain-derived neurotrophic factor for dendritic development, as revealed by chimera cell culture. J Neurosci. 2003;23:6123–6131. doi: 10.1523/JNEUROSCI.23-14-06123.2003. [DOI] [PMC free article] [PubMed] [Google Scholar]
- Lau AG, Irier HA, Gu J, Tian D, Ku L, Liu G, Xia M, Fritsch B, Zheng JQ, Dingledine R, Xu B, Lu B, Feng Y. Distinct 3′UTRs differentially regulate activity-dependent translation of brain-derived neurotrophic factor (BDNF) Proc Natl Acad Sci U S A. 2010;107:15945–15950. doi: 10.1073/pnas.1002929107. [DOI] [PMC free article] [PubMed] [Google Scholar]
- Lein ES, Shatz CJ. Rapid regulation of brain-derived neurotrophic factor mRNA within eye-specific circuits during ocular dominance column formation. J Neurosci. 2000;20:1470–1483. doi: 10.1523/JNEUROSCI.20-04-01470.2000. [DOI] [PMC free article] [PubMed] [Google Scholar]
- Lessmann V, Gottmann K, Malcangio M. Neurotrophin secretion: current facts and future prospects. Prog Neurobiol. 2003;69:341–374. doi: 10.1016/s0301-0082(03)00019-4. [DOI] [PubMed] [Google Scholar]
- Maffei A, Fontanini A. Network homeostasis: a matter of coordination. Current opinion in neurobiology. 2009;19:168–173. doi: 10.1016/j.conb.2009.05.012. [DOI] [PMC free article] [PubMed] [Google Scholar]
- Majdan M, Shatz CJ. Effects of visual experience on activity-dependent gene regulation in cortex. Nature neuroscience. 2006;9:650–659. doi: 10.1038/nn1674. [DOI] [PubMed] [Google Scholar]
- Majewska A, Sur M. Motility of dendritic spines in visual cortex in vivo: changes during the critical period and effects of visual deprivation. Proceedings of the National Academy of Sciences of the United States of America. 2003;100:16024–16029. doi: 10.1073/pnas.2636949100. [DOI] [PMC free article] [PubMed] [Google Scholar]
- Marin-Padilla M. Number and distribution of the apical dendritic spines of the layer V pyramidal cells in man. J Comp Neurol. 1967;131:475–490. doi: 10.1002/cne.901310407. [DOI] [PubMed] [Google Scholar]
- Markram H, Toledo-Rodriguez M, Wang Y, Gupta A, Silberberg G, Wu C. Interneurons of the neocortical inhibitory system. Nature reviews Neuroscience. 2004;5:793–807. doi: 10.1038/nrn1519. [DOI] [PubMed] [Google Scholar]
- Mataga N, Mizuguchi Y, Hensch TK. Experience-dependent pruning of dendritic spines in visual cortex by tissue plasminogen activator. Neuron. 2004;44:1031–1041. doi: 10.1016/j.neuron.2004.11.028. [DOI] [PubMed] [Google Scholar]
- Matsuzaki M, Honkura N, Ellis-Davies GC, Kasai H. Structural basis of long-term potentiation in single dendritic spines. Nature. 2004;429:761–766. doi: 10.1038/nature02617. [DOI] [PMC free article] [PubMed] [Google Scholar]
- McAllister AK, Lo DC, Katz LC. Neurotrophins regulate dendritic growth in developing visual cortex. Neuron. 1995;15:791–803. doi: 10.1016/0896-6273(95)90171-x. [DOI] [PubMed] [Google Scholar]
- McCormick DA, Connors BW, Lighthall JW, Prince DA. Comparative electrophysiology of pyramidal and sparsely spiny stellate neurons of the neocortex. J Neurophysiol. 1985;54:782–806. doi: 10.1152/jn.1985.54.4.782. [DOI] [PubMed] [Google Scholar]
- Niell CM, Stryker MP. Highly selective receptive fields in mouse visual cortex. The Journal of neuroscience: the official journal of the Society for Neuroscience. 2008;28:7520–7536. doi: 10.1523/JNEUROSCI.0623-08.2008. [DOI] [PMC free article] [PubMed] [Google Scholar]
- Noguchi J, Matsuzaki M, Ellis-Davies GC, Kasai H. Spine-neck geometry determines NMDA receptor-dependent Ca2+ signaling in dendrites. Neuron. 2005;46:609–622. doi: 10.1016/j.neuron.2005.03.015. [DOI] [PMC free article] [PubMed] [Google Scholar]
- Prusky GT, Alam NM, Douglas RM. Enhancement of vision by monocular deprivation in adult mice. The Journal of neuroscience: the official journal of the Society for Neuroscience. 2006;26:11554–11561. doi: 10.1523/JNEUROSCI.3396-06.2006. [DOI] [PMC free article] [PubMed] [Google Scholar]
- Rittenhouse CD, Shouval HZ, Paradiso MA, Bear MF. Monocular deprivation induces homosynaptic long-term depression in visual cortex. Nature. 1999;397:347–350. doi: 10.1038/16922. [DOI] [PubMed] [Google Scholar]
- Sato M, Stryker MP. Distinctive features of adult ocular dominance plasticity. The Journal of neuroscience: the official journal of the Society for Neuroscience. 2008;28:10278–10286. doi: 10.1523/JNEUROSCI.2451-08.2008. [DOI] [PMC free article] [PubMed] [Google Scholar]
- Sawtell NB, Frenkel MY, Philpot BD, Nakazawa K, Tonegawa S, Bear MF. NMDA receptor-dependent ocular dominance plasticity in adult visual cortex. Neuron. 2003;38:977–985. doi: 10.1016/s0896-6273(03)00323-4. [DOI] [PubMed] [Google Scholar]
- Tanaka J, Horiike Y, Matsuzaki M, Miyazaki T, Ellis-Davies GC, Kasai H. Protein synthesis and neurotrophin-dependent structural plasticity of single dendritic spines. Science. 2008;319:1683–1687. doi: 10.1126/science.1152864. [DOI] [PMC free article] [PubMed] [Google Scholar]
- Timmusk T, Palm K, Metsis M, Reintam T, Paalme V, Saarma M, Persson H. Multiple promoters direct tissue-specific expression of the rat BDNF gene. Neuron. 1993;10:475–489. doi: 10.1016/0896-6273(93)90335-o. [DOI] [PubMed] [Google Scholar]
- Wiesel TN. Postnatal development of the visual cortex and the influence of environment. Nature. 1982;299:583–591. doi: 10.1038/299583a0. [DOI] [PubMed] [Google Scholar]
- Xie Y, Hayden MR, Xu B. BDNF overexpression in the forebrain rescues Huntington’s disease phenotypes in YAC128 mice. J Neurosci. 2010;30:14708–14718. doi: 10.1523/JNEUROSCI.1637-10.2010. [DOI] [PMC free article] [PubMed] [Google Scholar]
- Xu B, Zang K, Ruff NL, Zhang YA, McConnell SK, Stryker MP, Reichardt LF. Cortical degeneration in the absence of neurotrophin signaling: dendritic retraction and neuronal loss after removal of the receptor TrkB. Neuron. 2000;26:233–245. doi: 10.1016/s0896-6273(00)81153-8. [DOI] [PubMed] [Google Scholar]
- Xu B, Goulding EH, Zang K, Cepoi D, Cone RD, Jones KR, Tecott LH, Reichardt LF. Brain-derived neurotrophic factor regulates energy balance downstream of melanocortin-4 receptor. Nat Neurosci. 2003;6:736–742. doi: 10.1038/nn1073. [DOI] [PMC free article] [PubMed] [Google Scholar]
- Zuo Y, Lin A, Chang P, Gan WB. Development of long-term dendritic spine stability in diverse regions of cerebral cortex. Neuron. 2005a;46:181–189. doi: 10.1016/j.neuron.2005.04.001. [DOI] [PubMed] [Google Scholar]
- Zuo Y, Yang G, Kwon E, Gan WB. Long-term sensory deprivation prevents dendritic spine loss in primary somatosensory cortex. Nature. 2005b;436:261–265. doi: 10.1038/nature03715. [DOI] [PubMed] [Google Scholar]