Abstract
Murine models of disease are a powerful tool for researchers to gain insight into disease formation, progression, and therapies. The biomechanical indicators of diseased tissue provide a unique insight into some of these murine models, since the biomechanical properties in scenarios such as aneurysm and Marfan syndrome can dictate tissue failure and mortality. Understanding the properties of the tissue on the macroscopic scale has been shown to be important, as one can then understand the tissue’s ability to withstand the high stresses seen in the cardiac pulsatile cycle. Alterations in the biomechanical response can foreshadow prospective mechanical failure of the tissue. These alterations are often seen on the microstructural level, and obtaining detailed information on such changes can offer a better understanding of the phenomena seen on the macroscopic level. Unfortunately, mouse models present problems due to the size and delicate features in the mechanical testing of such tissues. In addition, some smaller arteries in large-animal studies (e.g., coronary and cerebral arteries) can present the same issues, and are sometimes unsuitable for planar biaxial testing. The purpose of this paper is to present a robust method for the investigation of the mechanical properties of small arteries and the classification of the microstructural orientation and degree of fiber alignment. This occurs through the cost-efficient modification of a planar biaxial tester that works in conjunction with a two-photon nonlinear microscope. This system provides a means to further investigate how microstructure and mechanical properties are modified in diseased transgenic animals where the tissue is in small tube form. Several other hard-to-test tubular specimens such as cerebral aneurysm arteries and atherosclerotic coronary arteries can also be tested using the described modular device.
Keywords: microstructure, mechanical, collagen, elastin, mouse aorta, two-photon, multiphoton
1 Introduction
The use of genetically modified mice has proven to be a valuable addition to the study of disease etiology and treatment. Particularly, these mouse models for disease provide a means to test disease progression at several different stages without the use of postmortem/operation tissue. Mice can be created with inflictions such as aneurysms and can be tested throughout development and treatment. While development of the mouse models is a complicated task, the characterization of the tissue can also be problematic. In particular, the mechanical testing of such tissue presents an especially interesting engineering problem. Mouse tissue is often too small and delicate to be able to test via typical planar biaxial testing. Likewise, the act of splaying a vessel open can introduce unwanted stresses to the samples. Since the complete understanding of disease necessitates determining the biomechanical environment, a method to quantify biomechanical variations with disease (because mechanical properties have been shown to be altered with disease) is especially important [1–8].
Given that the mechanical properties are indicative of specific pathological states and that the underlying microstructure in the extracellular matrix (ECM) is ultimately responsible for the macromechanical response, quantification of the microstructure in conjunction with mechanical testing of tissue can provide unique insights into structure-function relationships of tissue [9–12]. Previous groups have provided investigations into combining nonlinear imaging techniques coupled to custom mechanical stimulation devices [12–18]. In particular, other groups have demonstrated dedicated devices for tubular tissue testing and, in some instances, unable to characterize the microstructure on the same sample that was quantified macroscopically (e.g., splitting a given specimen in two: one half for macroscopic testing, one for microscopic testing) [19–21]. These research teams have shown the usefulness in the quantification of the mechanical and microstructural behavior of murine models, and in particular, the testing of transgenic mouse arteries, and how this characterization provides critical information on the mechanical behavior of soft tissues [22–25].
The purpose of this paper is to demonstrate the design and use of a previously demonstrated planar microbiaxial optomechanical device (MOD) with minor modular modifications that allows for the simultaneous quantification of the macroscopic and microstructural properties of the same small tubular tissue specimen [26]. This allows for the use of a single consolidated device for which simultaneous mechanical stimulation of the same fully hydrated tissue specimen can be done while performing multiphoton microscopy (collecting second harmonic generation and two-photon emission fluorescence signal) without having to design an entirely new device based on the tissue configuration (e.g., tubular or planar). The MOD has been specifically designed for integration with the Advanced Intravital Microscope at the University of Arizona’s BIO5 Institute. Initial tests have been run on wild-type mice collecting axial stretch-pressure-diameter data to determine the macroscopic mechanical behavior, and collagen/elastin signal to determine the microstructural orientation and amounts of the microstructural constituents with respect to load.
2 Materials and Methods
Tubular specimens are cannulated and mounted in the MOD’s specimen bath. The bath is kept at a controlled 37 ± 1 °C, and the cannulated specimen is coupled to inline motion control and load measurement systems with optical systems to record macroscopic and microscopic behaviors. Through the cannulation and mounting scheme the sample can also be pressurized during data recording. For the tubular specimens, circumferential displacement is accomplished through the bath inflow tube (typically used to cycle water when planar specimens are used) and is connected to a pressure transducer (Omega Engineering, Inc., Stamford, CT) arrangement in-line with a syringe pump (New Era Pump Systems, Inc., Farmingdale, NY). Longitudinal displacement is accomplished via a stepper motor routed through a pulley and bellow scheme to allow for application of axial loading to the sample. The load is measured via load cells calibrated with precision hanging masses (McMaster-Carr, Robbinsville, NJ). Macroscopic strain is recorded automatically from underneath the sample by recording axial marker position and outer diameter, while ECM changes under macroscopic strain are obtained via multiphoton microscopy on the top surface of the sample. Outside diameter, intraluminal pressure, and two axial markers are recorded in software in biaxial tubular sample testing.
2.1 Microscope
The microscope system was manufactured in close collaboration with LaVision BioTec (Bielefeld, Germany). The microscope is capable of simultaneous two-photon excitation, second harmonic, and confocal imaging. Two-photon processes are recorded through concurrent nondescanning reverse (to allow for detection of more scattered photons than forward detection alone) and forward detection (typical detection pathway following the excitation beam back through the objective and scan mirrors) [27].
The microscope consists of an upright Olympus BX51, a confocal coupling and detection unit, and three nondescanning detection ports for reverse (epi) and two for forward (transmission) detection. For the studies conducted in this paper, transmission was not used, although the usefulness of transmission detection becomes evident for the quantification of tubular specimens with less scattering; for example, tissue engineered constructs based on biological gels [28]. An Olympus XLUMPLFL 20x water immersion objective with a numerical aperture of 0.9 was used in this particular study. The laser scanner is composed of a triple lens telescope that allows adjusting the beam diameter to the back aperture of the objective lens, a prism based chirp compensator keeping the pulse width down to 120 fs in the sample, and an x/y scanner allowing 1500 lines to be scanned per second. The laser intensity is adjusted using an electro-optical modulator.
The photomultiplier tubes (PMTs) available on our system consist of Hamamatsu H7422-40 (Ga-As), H6780-01 (blue), and H6780-20 (red) sensors. The 7422 sensors were primarily used in this study because in the visible range they have an order of magnitude better detectability compared to the multialkali cathode sensors.
We expanded our system to allow simultaneous confocal imaging with traditional fiber coupled laser sources in combination with near-infrared two-photon excitation. The optics were adapted so that light can be passed from a 568 nm argon-krypton laser through the nondescanning dichroic mirror. The optics are also able to collect confocal fluorescence emission and reflection at 568 nm. The main coupling dichroic on the reverse nondescanning port was designed to reflect 350–560 nm and to pass the titanium-sapphire (680–1060 nm) and confocal laser. Laser power on the sample for the purposes of this study was 17 mW. Excitation occurred at λ = 780 nm and ECM visualization was performed via nonlinear microscopy (no confocal microscopy). Multiphoton imaging offers advantages in our situation (hydrated ex vivo tissues) over confocal microscopy in the ability to have superior image quality, deeper optical sectioning, reduced photo damage, and lack of a need for staining to visualize the extracellular matrix, although staining can still be done and visualized should the imaging of other items of interest need to be visualized [27]. For collagen visualization, second harmonic generation (SHG) from 780 nm illumination is collected through a bandpass filter (377/50). Fluorescence emission from elastin is collected through another bandpass filter (460/80). Filters are from Semrock, Inc. (Lake Forest, IL).
2.2 Microbiaxial Optomechanical Device
Mechanical design was accomplished with the commercially available Solid-Works 2009 (Concord, MA) and all programming was done in NI LabVIEW 8.5.1 (Austin, TX). The device has been shown to be capable of applying up to 100% strain to samples of 1 cm2 for planar testing while observing ECM changes over several different strain states [26]. Through minor modular modification, the ability to test tubular specimens up to 5 mm in diameter and 50 mm in length has been added. Smaller samples can be tested as governed by the user’s capability in cannulating and mounting samples.
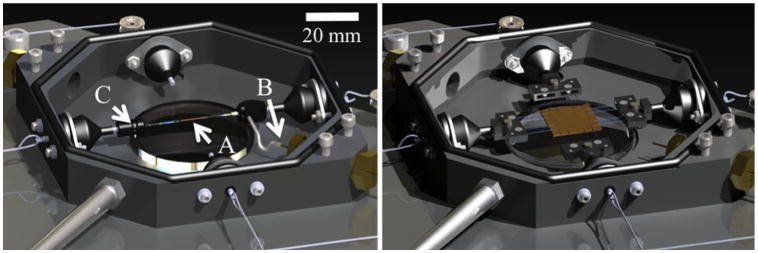
After a quick, reversible modification to the planar testing configuration, the MOD has the capabilities to test tubular samples under luminal pressure using a pump and pressure transducer, and axial loading while simultaneously imaging with the microscope or with a vision system to record macroscopic strain. The mounts for the assembly used for planar biaxial testing are replaced with custom pieces suitable for mounting and pressurizing tubular samples. The modular transformation to switch from planar to tubular testing and back is shown in Fig. 1. The tubular testing assembly is coupled to the pump typically used for cycling water in the bath, but instead reconnected to allow it to pressurize the vessel. Internal vessel pressure can be controlled by decreasing the outflow of the vessel or by increasing the inflow from the pump system (see Fig. 2). Pressure is recorded with a pressure transducer (Omega Engineering, Inc, Stamford, CT; range = 0–259 mmHg, accuracy = ±0.25%) mounted in line with the sample. The modifications take roughly 5 min to switch from the planar to tubular configuration.
Fig. 1.
Solid model renderings of the MOD in the planar (right) and tubular (left) configurations. (a) the sample, (b) inlet tube, (c) outlet flow screw. Note the preserved components in both configurations.
Fig. 2.
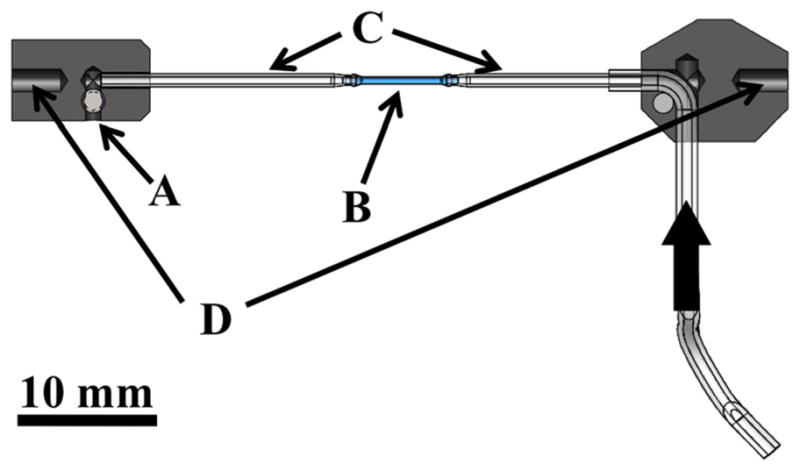
Cross section schematic of the tubular fixture pieces that fits into the testing device. (a) outlet flow screw, (b) specimen, (c) custom capillary tubes, (d) attachment pieces to push-rods in bath. Thick arrow shows the flow direction from the pump.
The samples sit in a saline solution with the bath held at a user specified temperature ranging from room temperature to 50 °C (37 ± 1 °C for this study). The thermal control system (Omega Engineering, Inc., Stamford, CT) is a first order system with a thermocouple in the bath and two Kapton heaters underneath the bath. The user sets a prompt and the temperature system operates independently from the remainder of the system.
The specimen is attached to a closed-loop flow system with a syringe pump to control fluid flow, and therefore pressure. Bellows with the pushrods couple the sample inside of the bath with the motion control system outside of the bath. The bellows allow the rods to impose axial loads/displacements to the sample within a water-sealed bath.
To apply mechanical load from the motors outside the bath to the pushrods spanning the watertight seal, we use 0.305 mm thick nylon coated braided steel line (Beadalon, Coatesville, PA) crimped and soldered to the rods. One line in a single loading direction is fed to a Microslide Linear Stage (Newmark, Inc., Chicago, IL) to allow for manual loading of the sample (if desired) while the other side is fed to a load cell. In the planar-testing configuration both motors and both load cells are used to apply biaxial load. Tubular testing utilizes only a single axis for axial loading of the sample (e.g., the other axis’s motor and load cells that are typically used for planar biaxial testing are unused).
The system has capabilities for measuring loads in two setups: high-load sensitive and low-load sensitive. In the high-load configuration (load cells from Honeywell) we can measure from 10 to 1000 gs with ±0.50% full-scale accuracy and ±0.20% full-scale repeatability. In the low-load configuration (load cells from Omega Engineering, Inc., Stamford, CT) we can measure loads up to 50 gs with ±0.20% full-scale accuracy and ±0.1% full-scale repeatability.
The two motors (Newmark, Inc., Chicago, IL) have coupled linear stages which pull the loading line and have the capabilities to microstep to 0.2 μm resolution with maximum velocity of 10 mm/s. Through an arrangement of pulleys each motor moves a single axis [26].
The entire system rests on a customized cart that has vibration dampeners to decrease not only vibration during testing but also vibration during transport around the university campus.
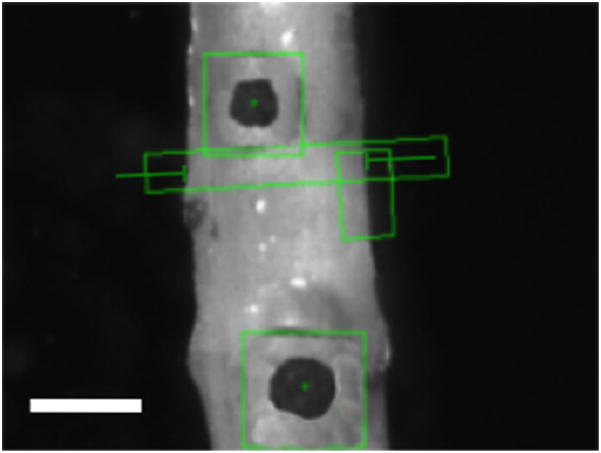
The same optical system used to track markers in the planar configuration is used to record diameter and axial stretch to calculate stress and strain. The orientation of the sample is also identified throughout the test to assure the diameter is measuring parallel to the central axis of the sample. Light is directed from underneath the sample using a λ/8 aluminized mirror (Edmund Optics, Inc., Barrington, NJ) to a telecentric lens system (Infinity, Inc., Boulder, CO) (InfiniMax™, 223 mm working distance, 5.0 mm field of view, 5 μm resolution) to a camera (Prosilica, Inc., Newburyport, MA, GC2450, 2448 × 2050, 3.45 × 3.45 μm pixel size). The light is folded because the sample is viewed through a water-sealed window in the bottom of the bath. The distance from the window to the sample is 6 mm to assure the sample does not touch the window. Image acquisition and processing is done with the LabVIEW Vision suite. A screen capture can be seen in Fig. 3.
Fig. 3.
Screenshot from the testing program. Scale is 0.5 mm. Black markers are cyanoacrylate/ceramic markers with marker tracking boxes. The diameter is recorded in the elongated rectangle shown.
A new set of control software was created to allow for testing of the tubular specimens since the protocol for testing needed to be altered. Data is acquired via a DAQ (National Instruments, Inc., Austin, TX, Instrunet i100 8 channels 14 bit analog input). All devices are connected to this board except for the strain measurement system, as it is connected through a GigE vision connection in the computer.
The system was verified via the use of precision springs and a gravity-fed pressure head. The large-load load cell reading accuracy was 0.18%, and the small-load load cells were accurate in the readings to 0.07%. The camera system measured changes of 6 μm repeatably. The large-load load cells measured to ±1.3 gs resolution, and the small-load load cells measured to ±0.5 gs resolution. The pressure transducer was accurate to 0.04%.
2.3 Data Processing
Data is reported for macroscopic and microscopic mechanical behavior. Macroscopically, the data is reported as the circumferential (θθ) and axial (ZZ) second Piola Kirchoff stresses (Sθθ, SZZ) and Green’s strains (Eθθ, EZZ). Circumferential stress is reported from Eq. (1) (where P is the intraluminal pressure, r is radius at a given point, and t is the thickness), and axial stress from Eq. (2) (where F is the axial force and A is the cross sectional vessel area) [9,29]. The circumferential strain can be seen in Eq. (3) (where ro is the initial radius), and axial strain is shown in Eq. (4) (where λZ is the axial stretch) [9,29]. Stress-strain data was fit to the Fung strain energy (W) density shown in Eq. (5), where c, A1, A2, and A3 are material constants [9,10].
| (1) |
| (2) |
| (3) |
| (4) |
| (5) |
Microscopic data is reported as the orientation of structural fibers and percent collagen/elastin through the wall thickness. The orientation is calculated from a custom Matlab routine previously shown by Kirkpatrick et al. [30]. The software overlays vectors in the direction of fibers, then organizes the vectors into a histogram. The mode of the histogram gives an indication of the preferential alignment of the fibers and the full-width at half-maximum (FWHM) provides an indication of the spread of orientation. While edge detection works well for collagen structure, the elastin structure demonstrates an issue due to the elastin folding at lower pressures. To account for this, edge detection parameters only looked at sharp edges instead of gradual changes in intensity, as is seen with elastin folding. Orientation is calculated for every image in a given imaging stack and all vector orientations added for the entire thickness. This gives a view of how all fibers cumulative through the thickness are oriented. Orientation through the depth was also quantified as the mode of the histogram produced at each slice through the thickness. Percent collagen through the wall thickness is reported as
| (6) |
and %Elastin is 1-%Collagen. The collagen and elastin pixels are counted by thresholding images and counting pixels in ImageJ corresponding to SHG or 2PEF signal. Fiber orientation and stress-strain behavior, and the corresponding fit to the data, are reported as a representative set of data. Multiple samples (n = 5, wild-type mice) were tested and average and standard deviation of the maximum tangential modulus are provided to show repeatability. To prevent processing images with fibers oriented normal to the imaging plane (as would occur primarily after optical sectioning past the thickness of the wall), image post-processing stops after reaching the intimal/luminal interface with scanning starting at the adventitia.
2.4 Sample Testing
All experimental procedures for mouse testing were performed according to the approved protocols of the University of Arizona Institutional Animal Care and Use Committee as described previously [31]. Young wild-type (129/BL-Swiss) mice at (2–3 month old) were sacrificed, and the entire thoracic aorta was dissected out in cold 1XPBS (pH 7.4) (Fig. 4). Excess fat from the aortic tissue was carefully removed under a dissecting microscope. Figure 5(a) shows an aorta after removal and cleaning. Descending aorta was immediately glued with cyanoacrylate to the custom tubular testing fixture.
Fig. 4.
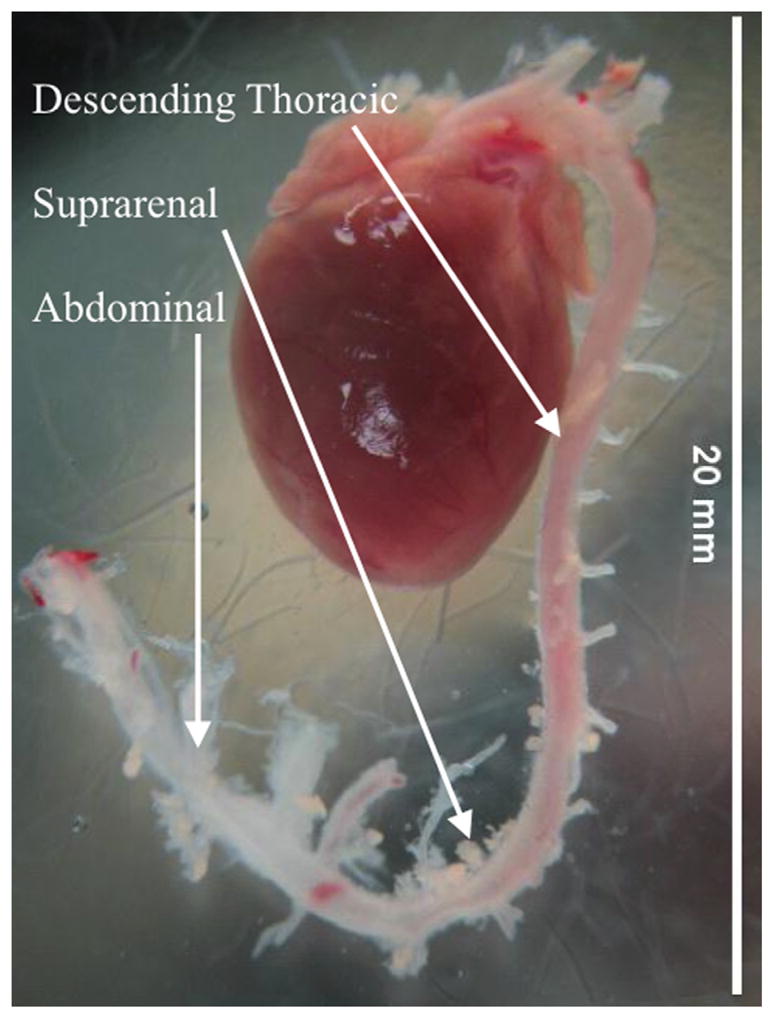
Excised heart from mouse after cleaning of extraneous tissue
Fig. 5.

(a) Vessel prior to mounting (ruler is in centimeters with millimeter submarkings). (b) Vessel mounted and placed in testing bath.
After placing the sample in the fixture shown in Fig. 2, the fixture was attached to the MOD and pulled to different axial stretches (see Fig. 5(b)). The sample was pressurized to 100 mmHg under six different axial stretches (λz = 0, 1.07, 1.15, 1.22, 1.30, 1.38) [32]. Dilatation (and subsequent circumferential strain) and axial stretch were recorded via the vision system. Correspondingly, tests were done holding the pressure constant at different pressures and applying an increasing axial strain while recording the same set of data. The same tests were run under the microscope. Obtaining a single image stack from testing of the mouse aorta took approximately 10 min with three line averages. To assure the same region is imaged between strain states the sample is repositioned under the objective exactly between the two axial markers and the central axis of the sample. This occurs in the axial direction by moving each of the axial markers into the microscope field of view sequentially then placing the objective exactly halfway between the markers by using the motorized stages location tracking. The circumferential direction is placed in the same manner, but by placing the center halfway between the outside diameter of the vessel instead of using placed markers. The microscope objective is moved up during pressurization while simultaneously imaging to keep track of the top of the sample. Samples are loaded slowly (30 s to reach maximum) and held at pressure for 5 min prior to acquiring an image to account for any viscoelastic effects. Correspondingly, the axial direction is loaded slowly and held for 5 min prior to imaging to eliminate viscoelastic effects. The test sequence may be seen in the flow chart in Fig. 6. The MOD is situated under the microscope in the exact same manner as was demonstrated previously [26]. Microscopic imaging occurs by locating the center point and performing raster scans starting at the adventitia and moving through the thickness of the aorta to the intima. Image slices were acquired every 8 μm until the entire thickness was imaged.
Fig. 6.
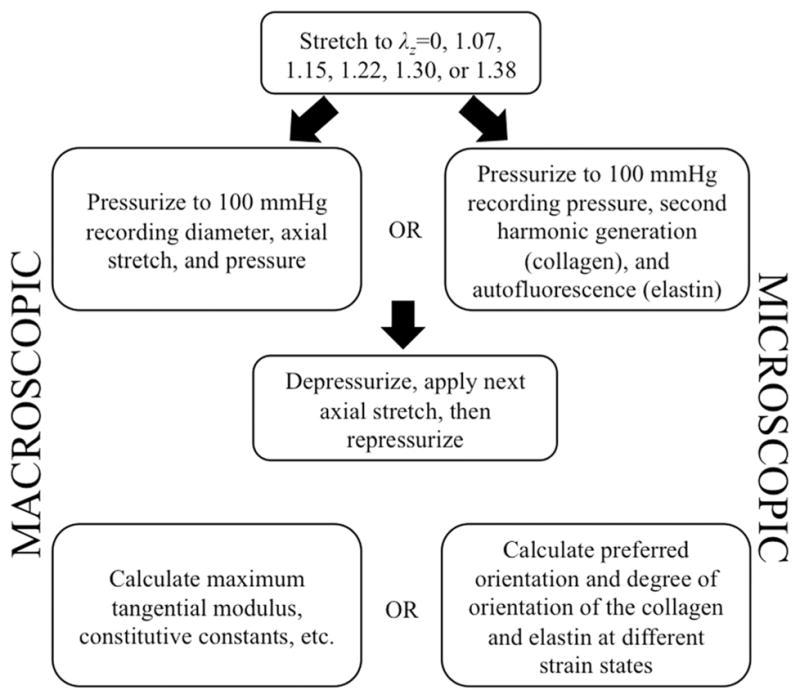
Testing procedure for macroscopic and microscopic testing
3 Results
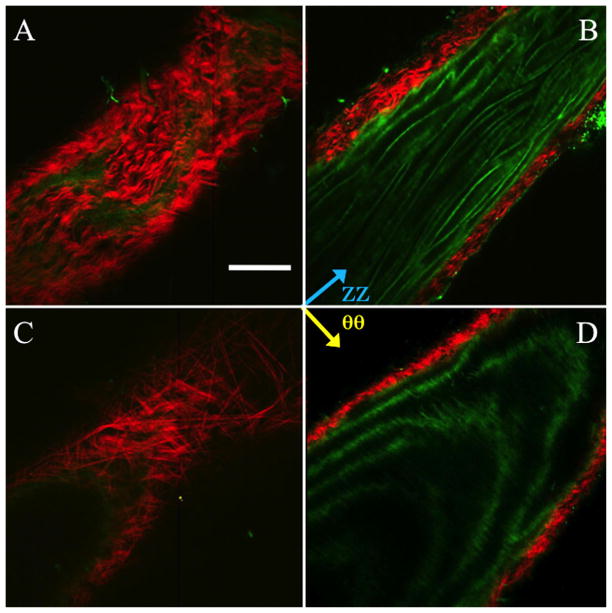
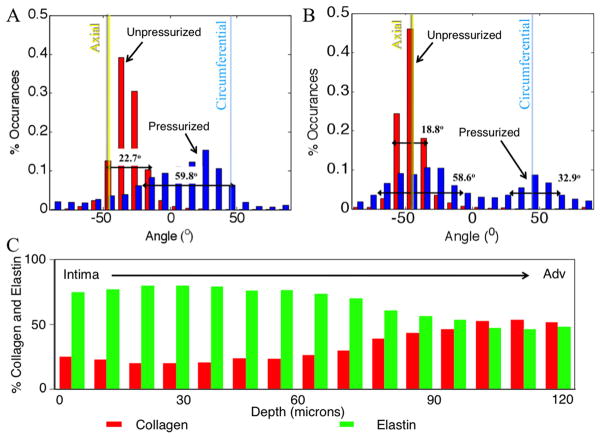
Collagen fibers in the wild-type mouse displayed a primarily axial orientation of fibers in the unpressurized state with the fibers moving more circumferentially after bringing the vessel to pressure. Qualitatively, this can be seen in Fig. 7 along with evidence of fiber-crimp straightening. Elastin showed folding at lower pressures with noticeable straightening at higher pressures. Similar to collagen, elastin demonstrated fiber directionality shifting from more axial to more circumferentially oriented. Displayed in Fig. 7 is an aorta at 0 and 100 mmHg. The mode of the collagen fiber orientation in the unloaded case is in the −30 deg to −40 deg bin with −45 deg corresponding to the axial direction and 45 deg corresponding to the circumferential direction. When the vessel was pressurized the fibers showed preferential alignment in the 20 deg to 30 deg bin. The FWHM increased from 22.7 deg to 59.8 deg, indicating a spread of orientation of the collagen fibers. The elastin fiber orientation in the unloaded case showed preferential fiber alignment in the −40 deg to −50 deg bin. Upon loading, the elastin fibers behaved similar to the collagen fibers, displaying a spread of orientation larger than in the unloaded case with a shift of the mean mode. However, unlike the collagen case, the fiber histogram showed two peaks. The elastin showed peaks (mean mode) in the −30 deg to −40 deg bin and 40 deg to 50 deg bin in the loaded case and −40 deg to −50 deg in the unpressurized case. The FWHM in the unloaded case was 18.8 deg for the single peak, and the FWHM of the two peaks in the loaded case was 58.6 deg for the major peak (−30 deg to −40 deg bin) and 32.9 deg for the minor peak.
Fig. 7.
Representative multiphoton images of the mouse aorta in the unpressurized (a and b) and pressurized (c and d) states. (a) and (c) show the vessel near the outside of the thickness, (b) and (d) show the vessel towards the intima. Red is SHG signal (collagen), green is autofluorescence (elastin). Scale bar is 100 μm.
Testing several mice (n = 5) yielded an average and standard deviation for the maximum tangential modulus of 0.29 ±0.04 MPa. Fitting to the Fung strain energy density resulted in the constants shown in Table 1, along with an overall summary of results from the mouse testing.
Table 1.
Overall results summary
| Macroscopic
| |||
|---|---|---|---|
| Fung constants | |||
| c | A1 | A2 | A3 |
| 1.18E+06 | 6.92E− 01 | 3.46E−02 | 4.53E−02 |
|
| |||
| Circumferential maximum tangential modulus | |||
| 0.29 ± 0.043 MPa | |||
| Microscopic | |||
|
| |||
| Fiber histogram mode (fiber orientation)a | |||
|
| |||
| Collagen | |||
| Unloaded | Loaded | ||
| −30 to −40° bin | 20 to 30° bin | ||
| Elastin | |||
| −40 to −50° bin | −30 to −40°, 40 to 50° bins | ||
|
| |||
| Full-width half-maximum (spread of orientation) | |||
| Collagen | |||
| Unloaded | Loaded | ||
| 22.7 | 59.8 | ||
| Elastin | |||
| 18.8 | 58.6, 32.9 | ||
−45 deg corresponds to the axial direction, +45 deg corresponds to the circumferential direction.
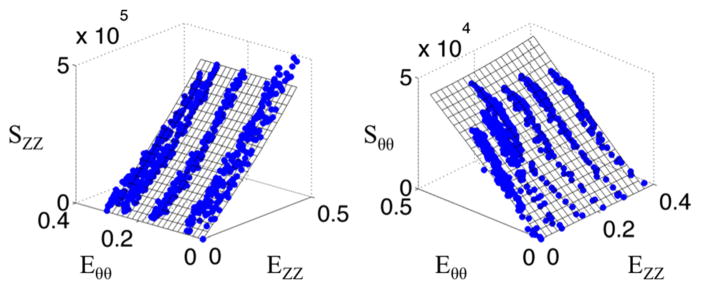
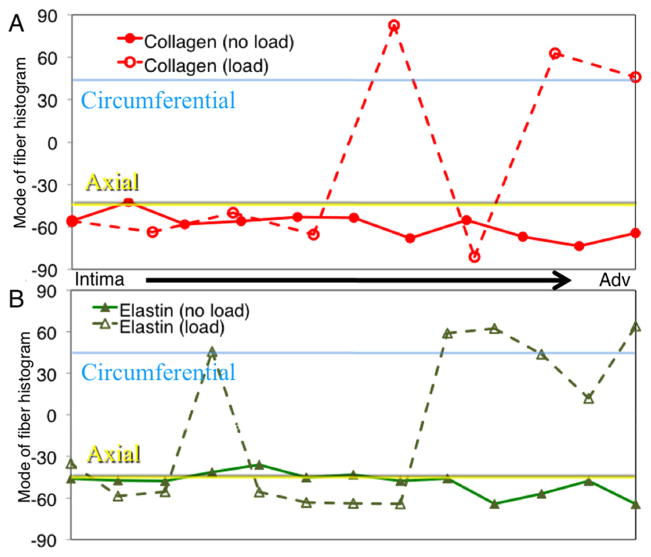
Figure 8 shows the macroscopic data along with a surface demonstrating the fit to the data. The fiber orientation histograms (Fig. 9) shows the collagen and elastin orientation analyses at the zero load and 100 mmHg points, along with percent collagen and elastin through the depth. As was expected, collagen existed in higher relative quantities more towards the adventitia, with the intima showing relatively higher amounts of elastin. This is also seen in the multiphoton images from the microscope, with relatively more green displayed, as the objective got closer to the lumen. Figure 10 shows the mean mode through the depth. This shows which fibers through the depth passively respond most to mechanical loading. The x axis is not labeled with the depth through the wall because the thickness of the pressurized vessel is smaller than the unpressurized vessel due to vessel lumen distension. The data shown here captured behavior unable to be captured in the cumulative histogram. For instance, it showed how closest to the intima the fibers did not display much passive realignment, whereas the fibers further away from the intima displayed realignment in the direction of loading. The representative microscopic data through the thickness was for the entire thickness of the aorta, intima to adventitia, of 120 μm for the unpressurized case.
Fig. 8.
Representative stress versus strain plots for tubular mechanical test of a wild-type mouse aorta. Axial stress is represented on the left, while circumferential stress is represented on the right. Blue data points represent the acquired data and the surfaces represent a Fung fit.
Fig. 9.
Representative histogram plot of collagen (a) and elastin (b) fiber angle percent occurrences for unpressurized (red) and pressurized (pink) states. The full width at half maximum is shown on the plots and increased from the unpressurized (0 ±5 mmHg) to pressurized (100 ±5 mmHg) states. (c) Representative percent collagen and elastin through the wall thickness as measured with thresholding.
Fig. 10.
Representative mode of the orientation histograms through the thickness of the aortic wall. (a) shows how collagen orientation changes and (b) shows how elastin orientation changes.
4 Discussion
This study provides a thorough description of an MOD that is capable of assessing structure-function relationships in hard to test tissues. This is done through employing modular design as opposed to more costly techniques of separate instruments for separate conformations of tissues. It is demonstrated that this technique is viable for the characterization of tissues in different forms on the macroscopic and microstructural level. While this cost-effective adaptation was designed specifically for the planar system demonstrated previously, the modular components can be easily scaled or modified to other biaxial tensile testers made for biological materials as the general components of the testers are typically unchanged from instrument to instrument: load cells, water bath, motion system, sample mounting assemblies, etc [6,33]. Modular modifications to the mounting schemes, integration of a pressure transducer, and reprogramming can be done to achieve the alternate tissue-testing configuration. Through the implementation of modular components suited for different shapes of tissues, a consolidated equipment approach can be used, saving time and money in testing and device design and fabrication.
Similar to the behavior of the planar biaxially tested samples, we expected preferential fiber alignment in the direction of the applied stress. This was confirmed as the fibers moved from an organization primarily from the axial direction for the undeformed case to the circumferential direction in the pressurized case. Investigating this behavior can prove valuable as previous studies have shown that under different disease or age states different microstructural signatures are displayed [34,35]. Interestingly, all fibers through the thickness did not respond the same way to the mechanical loading. The causes for the depth-dependent response of the fibers are currently being investigated in our laboratory.
In this study a given field of view was monitored in the middle of the aorta, but in reality the properties along the length of the aorta are known to change [5,36]. Our laboratory is currently investigating these alterations. In addition, our laboratory is beginning studies into the differences in the microstructure of tissue under different disease states through the use of transgenic mouse models. The unique ability of the MOD to test very small vessels (mouse aorta) is now being leveraged within our laboratory to investigate the coupled microstructural and macroscopic biomechanical behavior of various genetically engineered mouse models of human disease.
Scans are made in a planar fashion on a cylindrical volume; thus potentially introducing error if proper measures are not taken to ensure all fibers are captured (e.g., those fibers running concentric to the vessel wall). In this study, scans were made with a small enough resolution governed by z-depth resolution of the microscope and data was only post-processed from the adventitia to the intimal/luminal interface. This allows for the collection of a full three-dimensional dataset of a cylindrical volume reconstructed from two-dimensional slices. Higher resolution z-depth scans would provide even higher resolution volume reconstructions.
This coupled microscopic and macroscopic biomechanical behavior can also be used to develop further fiber-driven constitutive models. Microstructually based constitutive models have been derived and used to model cardiovascular tissues [37,38]. However, most of these reports utilize either assumed or back-fitted orientation values for collagen and/or elastin [39]. This leaves researchers wondering if the fibers as derived in such models are accurate. The data generated from our device will aid in development of future constitutive models where the microstructure can be imposed from our image data, and not assumed or back-fit. The authors realize that the development of such a model will be quite challenging, but also believe that the data as generated by our device will be critical in testing the developed model’s validity.
The depth dependence of orientation and relative quantities also provides researchers with the ability to compare transgenic mice with each other, or with wild-type mice. This is useful because some diseases have shown alterations in deposition of ECM proteins [40]. Quantification through the depth and how they respond to load could allow researchers to look at how deposition and response are altered with disease.
5 Conclusions
We have presented here a novel device that can examine the biomechanical behavior of tissue macroscopically and microscopically under several different conditions without the need for freezing, sectioning, or other destructive techniques that may cause physical realignment, tissue degradation, or other undesirable effects on the microstructure. In addition, the device is fit to test a variety of tissues under planar or tubular protocols and has also been designed to acquire macroscopic mechanical data on the same samples. The ability of the device to produce novel data in several shapes and sizes through minor modifications to an existing device proves a valuable proof-of-concept to assist biomechanical researchers to make discoveries previously unachievable given the current landscape (e.g., size, cost, etc.) of most biaxial testers.
Acknowledgments
This work is supported, in part, by the AHA Beginning Grant-in-Aid (0860058Z to JPVG), and the NSF CAREER award (0644570 to JPVG), Arizona Biomedical Research Commission, The Steven M. Gootter Foundation, The Stephen Michael Schneider Investigator Award for Pediatric Cardiovascular Research, and The William J. “Billy” Gieszl Endowment for Heart Research (to MA), the NIH Cardiovascular Biomedical Engineering Training Grant (T32 HL007955). The microscope (Advanced Intravital Microscope) was funded through the NIH/NCRR 1S0RR023737. MA and UU are also supported by R01 HL092508. The authors would like to acknowledge the help of Connie Gard and Rose Sivili for their assistance of the specimen preparation for the mouse aorta testing, and Stacy Borowicz for programming of the MOD. Any opinions, findings and conclusions or recommendations expressed in this material are those of the author(s) and do not necessarily reflect the views of the National Science Foundation (NSF).
Contributor Information
Joseph T. Keyes, Graduate Interdisciplinary Program in Biomedical Engineering, The University of Arizona, Tucson, AZ 85721
Darren G. Haskett, Graduate Interdisciplinary Program in Biomedical Engineering, The University of Arizona, Tucson, AZ 85721
Urs Utzinger, Graduate Interdisciplinary Program in Biomedical Engineering, BIO5 Institute for Biocollaborative Research, Department of Biomedical Engineering, The University of Arizona, Tucson, AZ 85721.
Mohamad Azhar, BIO5 Institute for Biocollaborative Research, Department of Cell Biology and Anatomy, The University of Arizona, Tucson, AZ 85721.
Jonathan P. Vande Geest, Email: jpv1@email.arizona.edu, Graduate Interdisciplinary Program in Biomedical Engineering, The Department of Aerospace and Mechanical Engineering, BIO5 Institute for Biocollaborative Research, Department of Biomedical Engineering, The University of Arizona, Tucson, AZ 85721
References
- 1.Halloran BG, Davis VA, McManus BM, Lynch TG, Baxter BT. Localization of Aortic Disease is Associated With Intrinsic Differences in Aortic Structure. J Surg Res. 1995;59(1):17–22. doi: 10.1006/jsre.1995.1126. [DOI] [PubMed] [Google Scholar]
- 2.Jani B, Rajkumar C. Ageing and Vascular Ageing. Postgrad Med J. 2006;82(968):357–362. doi: 10.1136/pgmj.2005.036053. [DOI] [PMC free article] [PubMed] [Google Scholar]
- 3.Lipman RD, Grossman P, Bridges SE, Hamner JW, Taylor JA. Mental Stress Response, Arterial Stiffness, and Baroreflex Sensitivity in Healthy Aging. J Gerontol A Biol Sci Med Sci. 2002;57(7):B279–B284. doi: 10.1093/gerona/57.7.b279. [DOI] [PubMed] [Google Scholar]
- 4.Okamoto RJ, Wagenseil JE, DeLong WR, Peterson SJ, Kouchoukos NT, Sundt TM., 3rd Mechanical Properties of Dilated Human Ascending Aorta. Ann Biomed Eng. 2002;30(5):624–635. doi: 10.1114/1.1484220. [DOI] [PubMed] [Google Scholar]
- 5.Haskett D, Johnson G, Zhou A, Utzinger U, Vande Geest J. Microstructural and Biomechanical Alterations of the Human Aorta as a Function of Age and Location. Biomech Model Mechanobiol. 2010;9(6):725–736. doi: 10.1007/s10237-010-0209-7. [DOI] [PubMed] [Google Scholar]
- 6.Vande Geest JP, Sacks MS, Vorp DA. Age Dependency of the Biaxial Biomechanical Behavior of Human Abdominal Aorta. ASME J Biomech Eng. 2004;126(6):815–822. doi: 10.1115/1.1824121. [DOI] [PubMed] [Google Scholar]
- 7.Safar ME, Blacher J, Mourad JJ, London GM. Stiffness of Carotid Artery Wall Material and Blood Pressure in Humans: Application to Antihypertensive Therapy and Stroke Prevention. Stroke. 2000;31(3):782–790. doi: 10.1161/01.str.31.3.782. [DOI] [PubMed] [Google Scholar]
- 8.Vande Geest JP, Sacks MS, Vorp DA. The Effects of Aneurysm on the Biaxial Mechanical Behavior of Human Abdominal Aorta. J Biomech. 2006;39(7):1324–1334. doi: 10.1016/j.jbiomech.2005.03.003. [DOI] [PubMed] [Google Scholar]
- 9.Fung Y. Biomechanics: Mechanical Properties of Living Tissues. Springer; New York: 1993. [Google Scholar]
- 10.Fung YC, Liu SQ. Determination of the Mechanical Properties of the Different Layers of Blood Vessels In Vivo. Proc Natl Acad Sci USA. 1995;92(6):2169–2173. doi: 10.1073/pnas.92.6.2169. [DOI] [PMC free article] [PubMed] [Google Scholar]
- 11.Humphrey JD, Vawter DL, Vito RP. Quantification of Strains in Biaxially Tested Soft Tissues. J Biomech. 1987;20(1):59–65. doi: 10.1016/0021-9290(87)90267-3. [DOI] [PubMed] [Google Scholar]
- 12.Zoumi A, Lu X, Kassab GS, Tromberg BJ. Imaging Coronary Artery Microstructure Using Second-Harmonic and Two-Photon Fluorescence Microscopy. Biophys J. 2004;87(4):2778–2786. doi: 10.1529/biophysj.104.042887. [DOI] [PMC free article] [PubMed] [Google Scholar]
- 13.Billiar KL, Sacks MS. A Method to Quantify the Fiber Kinematics of Planar Tissues Under Biaxial Stretch. J Biomech. 1997;30(7):753–756. doi: 10.1016/s0021-9290(97)00019-5. [DOI] [PubMed] [Google Scholar]
- 14.Humphrey JD, Wells PB, Baek S, Hu JJ, McLeroy K, Yeh AT. A Theoretically-Motivated Biaxial Tissue Culture System With Intravital Microscopy. Biomech Model Mechanobiol. 2008;7(4):323–334. doi: 10.1007/s10237-007-0099-5. [DOI] [PubMed] [Google Scholar]
- 15.Gleason RL, Gray SP, Wilson E, Humphrey JD. A Multiaxial Computer-Controlled Organ Culture and Biomechanical Device for Mouse Carotid Arteries. ASME J Biomech Eng. 2004;126(6):787–795. doi: 10.1115/1.1824130. [DOI] [PubMed] [Google Scholar]
- 16.Hu JJ, Humphrey JD, Yeh AT. Characterization of Engineered Tissue Development Under Biaxial Stretch Using Nonlinear Optical Microscopy. Tissue Eng Part A. 2009;15(7):1553–1564. doi: 10.1089/ten.tea.2008.0287. [DOI] [PMC free article] [PubMed] [Google Scholar]
- 17.Voytik-Harbin SL, Roeder BA, Sturgis JE, Kokini K, Robinson JP. Simultaneous Mechanical Loading and Confocal Reflection Microscopy for Three-Dimensional Microbiomechanical Analysis of Biomaterials and Tissue Constructs. Microsc Microanal. 2003;9(1):74–85. doi: 10.1017/S1431927603030046. [DOI] [PubMed] [Google Scholar]
- 18.Roeder BA, Kokini K, Sturgis JE, Robinson JP, Voytik-Harbin SL. Tensile Mechanical Properties of Three-Dimensional Type I Collagen Extracellular Matrices With Varied Microstructure. ASME J Biomech Eng. 2002;124(2):214–222. doi: 10.1115/1.1449904. [DOI] [PubMed] [Google Scholar]
- 19.Wicker BK, Hutchens HP, Wu Q, Yeh AT, Humphrey JD. Normal Basilar Artery Structure and Biaxial Mechanical Behaviour. Comput Methods Biomech Biomed Engin. 2008;11(5):539–551. doi: 10.1080/10255840801949793. [DOI] [PubMed] [Google Scholar]
- 20.Wan W, Yanagisawa H, Gleason RL., Jr Biomechanical and Microstructural Properties of Common Carotid Arteries From Fibulin-5 Null Mice. Ann Biomed Eng. 2010;38(12):3605–3617. doi: 10.1007/s10439-010-0114-3. [DOI] [PMC free article] [PubMed] [Google Scholar]
- 21.Gleason RL, Dye WW, Wilson E, Humphrey JD. Quantification of the Mechanical Behavior of Carotid Arteries From Wild-Type, Dystrophin-Deficient, and Sarcoglycan-Delta Knockout Mice. J Biomech. 2008;41(15):3213–3218. doi: 10.1016/j.jbiomech.2008.08.012. [DOI] [PMC free article] [PubMed] [Google Scholar]
- 22.Cox G, Kable E, Jones A, Fraser I, Manconi F, Gorrell MD. 3-Dimensional Imaging of Collagen Using Second Harmonic Generation. J Struct Biol. 2003;141(1):53–62. doi: 10.1016/s1047-8477(02)00576-2. [DOI] [PubMed] [Google Scholar]
- 23.Zoumi A, Yeh A, Tromberg BJ. Imaging Cells and Extracellular Matrix In Vivo by Using Second-Harmonic Generation and Two-Photon Excited Fluorescence. Proc Natl Acad Sci U S A. 2002;99(17):11014–11019. doi: 10.1073/pnas.172368799. [DOI] [PMC free article] [PubMed] [Google Scholar]
- 24.Timmins LH, Wu Q, Yeh AT, Moore JE, Jr, Greenwald SE. Structural Inhomogeneity and Fiber Orientation in the Inner Arterial Media. Am J Physiol Heart Circ Physiol. 2010;298(5):H1537–H1545. doi: 10.1152/ajpheart.00891.2009. [DOI] [PubMed] [Google Scholar]
- 25.Boulesteix T, Pena AM, Pages N, Godeau G, Sauviat MP, Beaurepaire E, Schanne-Klein MC. Micrometer Scale Ex Vivo Multi-photon Imaging of Unstained Arterial Wall Structure. Cytometry A. 2006;69(1):20–26. doi: 10.1002/cyto.a.20196. [DOI] [PubMed] [Google Scholar]
- 26.Keyes JT, Borowicz SM, Rader JH, Utzinger U, Azhar M, Vande Geest JP. Design and Demonstration of a Microbiaxial Optomechanical Device for Multiscale Characterization of Soft Biological Tissues With Two-Photon Microscopy. Microsc Microanal. 2011;17(2):167–175. doi: 10.1017/S1431927610094341. [DOI] [PMC free article] [PubMed] [Google Scholar]
- 27.Peti-Peterdi J, Bell PD. Methods in Molecular Medicine, Vol 86: Renal Disease: Techniques and Protocols. Humana Press; Totowa, NJ: 2008. Confocal and Two-Photon Microscopy; pp. 129–138. [DOI] [PubMed] [Google Scholar]
- 28.Syedain ZH, Meier LA, Bjork JW, Lee A, Tranquillo RT. Implantable Arterial Grafts From Human Fibroblasts and Fibrin Using a Multi-graft Pulsed Flow-Stretch Bioreactor With Noninvasive Strength Monitoring. Biomaterials. 2011;32(3):714–722. doi: 10.1016/j.biomaterials.2010.09.019. [DOI] [PMC free article] [PubMed] [Google Scholar]
- 29.Debes JC, Fung YC. Biaxial Mechanics of Excised Canine Pulmonary Arteries. Am J Physiol. 1995;269(2 Pt 2):H433–H442. doi: 10.1152/ajpheart.1995.269.2.H433. [DOI] [PubMed] [Google Scholar]
- 30.Kirkpatrick ND, Andreou S, Hoying JB, Utzinger U. Live Imaging of Collagen Remodeling During Angiogenesis. Am J Physiol Heart Circ Physiol. 2007;292(6):H3198–H3206. doi: 10.1152/ajpheart.01234.2006. [DOI] [PubMed] [Google Scholar]
- 31.Azhar M, Runyan RB, Gard C, Sanford LP, Miller ML, Andringa A, Pawlowski S, Rajan S, Doetschman T. Ligand-Specific Function of Transforming Growth Factor Beta in Epithelial-Mesenchymal Transition in Heart Development. Dev Dyn. 2009;238(2):431–442. doi: 10.1002/dvdy.21854. [DOI] [PMC free article] [PubMed] [Google Scholar]
- 32.Meyer JW, Flagella M, Sutliff RL, Lorenz JN, Nieman ML, Weber CS, Paul RJ, Shull GE. Decreased Blood Pressure and Vascular Smooth Muscle Tone in Mice Lacking Basolateral Na(+)-K(+)-2Cl(−) Cotransporter. Am J Physiol Heart Circ Physiol. 2002;283(5):H1846–H1855. doi: 10.1152/ajpheart.00083.2002. [DOI] [PubMed] [Google Scholar]
- 33.Zemanek MBJ, Detak M. Biaxial Tension Tests With Soft Tissues of Arterial Wall. Eng Mech. 2009;16(1):3–11. [Google Scholar]
- 34.Cattell MA, Anderson JC, Hasleton PS. Age-Related Changes in Amounts and Concentrations of Collagen and Elastin in Normotensive Human Thoracic Aorta. Clin Chim Acta. 1996;245(1):73–84. doi: 10.1016/0009-8981(95)06174-6. [DOI] [PubMed] [Google Scholar]
- 35.Sakuraoka K, Tajima S, Seyama Y, Teramoto K, Ishibashi M. Analysis of Connective Tissue Macromolecular Components in Ishibashi Rat Skin: Role of Collagen and Elastin in Cutaneous Aging. J Dermatol Sci. 1996;12 (3):232–237. doi: 10.1016/0923-1811(95)00478-5. [DOI] [PubMed] [Google Scholar]
- 36.Guo X, Kassab GS. Variation of Mechanical Properties Along the Length of the Aorta in C57bl/6 Mice. Am J Physiol Heart Circ Physiol. 2003;285(6):H2614–H2622. doi: 10.1152/ajpheart.00567.2003. [DOI] [PubMed] [Google Scholar]
- 37.Sacks MS. Incorporation of Experimentally-Derived Fiber Orientation Into a Structural Constitutive Model for Planar Collagenous Tissues. ASME J Biomech Eng. 2003;125(2):280–287. doi: 10.1115/1.1544508. [DOI] [PubMed] [Google Scholar]
- 38.Driessen NJ, Bouten CV, Baaijens FP. A Structural Constitutive Model for Collagenous Cardiovascular Tissues Incorporating the Angular Fiber Distribution. ASME J Biomech Eng. 2005;127(3):494–503. doi: 10.1115/1.1894373. [DOI] [PubMed] [Google Scholar]
- 39.Girard MJ, Suh JK, Bottlang M, Burgoyne CF, Downs JC. Scleral Biomechanics in the Aging Monkey Eye. Invest Ophthalmol Vis Sci. 2009;50(11):5226–5237. doi: 10.1167/iovs.08-3363. [DOI] [PMC free article] [PubMed] [Google Scholar]
- 40.Mata KM, Prudente PS, Rocha FS, Prado CM, Floriano EM, Elias J, Jr, Rizzi E, Gerlach RF, Rossi MA, Ramos SG. Combining Two Potential Causes of Metalloproteinase Secretion Causes Abdominal Aortic Aneurysms in Rats: A New Experimental Model. Int J Exp Pathol. 2011;92(1):26–39. doi: 10.1111/j.1365-2613.2010.00746.x. [DOI] [PMC free article] [PubMed] [Google Scholar]


