Abstract
Studying the insect visual system provides important data on the basic neural mechanisms underlying visual processing. Similar to vertebrates, the first step of visual processing in insects is through a series of retinotopic neurons. Recent studies on flies have found that these converge onto assemblies of columnar neurons in the lobula, the axons of which segregate to project to discrete optic glomeruli in the lateral protocerebrum. This arrangement is much like the fly’s olfactory system, in which afferents target uniquely identifiable olfactory glomeruli. Here, whole-cell patch recordings show that even though visual primitives are unreliably encoded by single lobula output neurons due to high synaptic noise, they are reliably encoded by the ensemble of outputs. At a glomerulus, local interneurons reliably code visual primitives, as do projection neurons conveying information centrally from the glomerulus. These observations demonstrate that in Drosophila, as in other dipterans, optic glomeruli are involved in further reconstructing the fly’s visual world. Optic glomeruli and antennal lobe glomeruli share the same ancestral anatomical and functional ground pattern enabling reliable responses to be extracted from converging sensory inputs.
Introduction
Visual processing allows animals to negotiate their environment and direct their behaviors. The optic lobes of Drosophila reconstruct salient features of the taxon’s visual ecology by processing optic flow and distinguishing static features. Although Drosophila has a less elaborate nervous system than most vertebrates, many features are shared (Sanes and Zipursky, 2010). Visual processing in Drosophila involves sequential interactions by stratified networks in the medulla, with retinotopic neurons that supply information to two deeper retinotopic neuropils, the lobula and the lobula plate. The latter is a tectum-like neuropil, in which large field tangential cells integrate signals from achromatic relays, and respond to the orientation and direction of optic flow (Schnell et al., 2010). In contrast, the lobula is a cortex-like neuropil (Cajal and Sánchez, 1915), which comprises many palisades of lobula columnar neurons (LCNs). These are comparable to pyramidal cells of the mammalian striate cortex (Strausfeld, 1970). The next level of the fly’s visual system is glomerular. Axons from each palisade of LCNs group into a unique bundle which targets a unique glomerulus in the brain’s lateral protocerebrum (Strausfeld and Bacon, 1983; Strausfeld and Lee, 1991; Otsuna and Ito, 2006; Strausfeld and Okamura, 2007). This deepest part of the visual system shares a neural organization with the glomerular antennal lobes, comprising a network of local interneurons and projection neurons (Strausfeld and Bacon, 1983; Strausfeld et al., 2007).
Such commonality raises fundamental questions about principles of sensory-system organization. Optic glomeruli, and the organization of local interneurons within them, are the protocerebral (segmental) homologues of the deutocerebral antennal lobe (Strausfeld et al., 2007), where each glomerulus receives converging inputs from olfactory sensory neurons expressing the same odorant-receptor gene (Gao et al., 2000; Vosshall et al., 2000). Noisy olfactory signals from receptors are refined through interactions among glomeruli via local interneurons, and are then relayed to higher centers by projection neurons (Laurent, 2002; Wilson, 2008). But whereas olfactory receptor neurons only encode one modality, the identities of specific molecular ligands, compound-eye photoreceptors code for many submodalities, such as intensity changes, e-vectors, and spectral properties. Features of the visual world, comparable in their specificity to the encoding of specific odorants, are not detected at the receptor level but are reconstructed by subsequent retinotopic layers relaying to palisades of lobula columnar neurons. There are as many unique palisades of these neurons as there are optic glomeruli, and organizational correspondence of optic glomeruli and antennal lobe glomeruli suggest comparable network organization, in which each glomerulus is supplied by a characteristically defined input relaying a specific sensory feature of the visual or olfactory environment.
To test whether optic glomeruli are indeed functionally comparable to antennal-lobe glomeruli, we have focused on lobula columnar neurons (LCNs) comprising clones of about 40 identical neurons, and their postsynaptic targets. Responses of single lobula outputs neurons, local interneurons (LIN) and projection neurons were obtained using whole-cell patch clamp recording methods developed for the olfactory system (Wilson and Laurent, 2005). Our results provide the first electrophysiological evidence for convergent processing in an optic glomerulus. Convergent signals at a glomerulus are disambiguated at, and enhanced by, the follower relay neuron. Our data also show the participation in this convergence by local interneurons associated with that specific glomerulus.
Materials and Methods
Flies
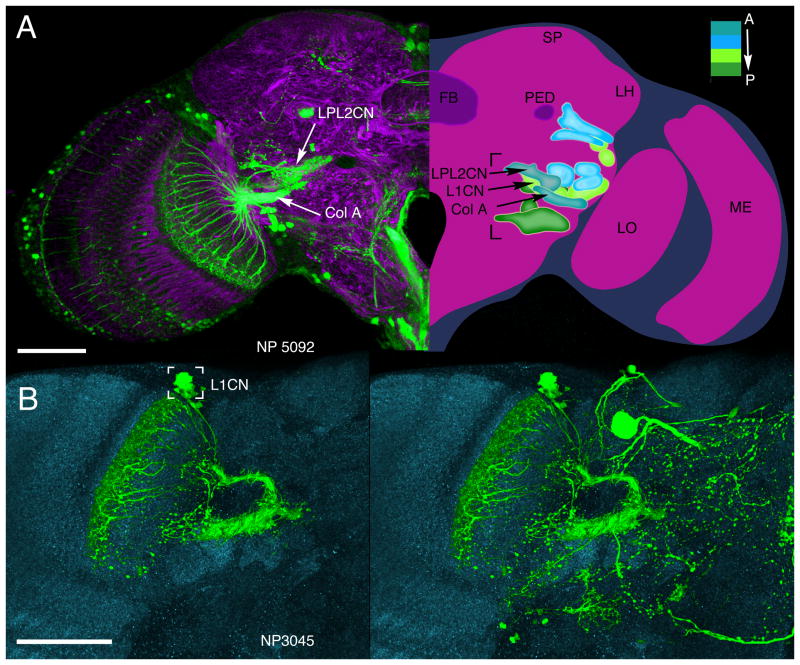
Flies were raised on standard cornmeal-agar medium. The experimental flies were 2–7 day old adult female Drosophila melanogaster of the UAS-mCD8::GFP A307 line, or the progeny of crossing GAL4 enhancer-trap lines, NP3045 (Otsuna and Ito, 2006) and NP5092, with UAS-GFP reporter lines, UAS-GFP S65T. Single neuron somata of lobula complex output clones labeled in NP3045 and NP5092 were targeted for patch-clamp recording (Fig. 1). Recordings were also obtained from a local interneuron (LIN) of the glomerulus receiving inputs from one clone in NP5092, and from the major projection neuron (the Giant Fiber (GF)) associated with this glomerulus, resolved in the GFP line UAS-mCD8::GFP A307.
Fig 1.
Ensembles of lobula complex columnar output neurons (LCNs) resolved by anti-GFP labeling of the GAL4 lines, NP5092 (A) and NP3045 (B). A, Left panel: Hemisection through the brain labeled with anti-a-tubulin and anti-GFP, showing the ensemble of type Col A LCN neurons in the lobula with converging axons to its corresponding Col A glomerulus. This lies ventral and medial to a glomerulus receiving terminals of neurons with dendrites in both the lobula plate and lobula (LPL neurons), belonging to the morphological type LPL2CN neurons resolved by anti-GFP labeling of the GAL4 line NP 5092. An individual recorded and dye-filled neuron of this ensemble is shown in Fig. 5A. Right panel: Reconstruction of 14 of the 24 glomeruli, most of which are in the inferior lateral protocerebrum (bracketed), each supplied by an ensemble of columnar output neurons from the lobula complex (lobula plate and lobula). The depth shown here, from the level of the fan-shaped body (FB), is approximately 40 microns. Glomeruli are color-coded according to depth and are identified from serial vertical sections of brains labeled by “tricolor” labeling (elav-GAL4 > UAS-DsRed, UAS-n-syb::GFP, UAS-Rdl-HA), to resolve pre- and postsynaptic densities, glia and other aspects of neuropils and their connections (see http://flybrain.iam.u-tokyo.ac.jp/flydb091226/php/flydb/index.php). Two anterior glomeruli, receiving inputs from the Col A and LPL2CN neurons, lie in front of a more posterior glomerulus supplied by L1CN neurons (see Panel B). Abbreviations for this and other confocal images shown in this paper: FB, fan-shaped body of the central complex; GF, giant fiber; L1CN, type 1 lobula columnar neuron; LH, lateral horn; LIN, local interneuron; LO, lobula; LOP, lobula plate; LPL2CN, type 2 lobula plate-lobula columnar neuron; ME, medulla; OG, optic glomerulus; PED, pedunculus of the mushroom body; SP superior protocerebrum. Abbreviations and terms follow standard nomenclature for the Drosophila brain. B, Palisade ensemble of the lobula columnar output neuron L1CN resolved by anti-GFP labeling of the GAL4 line, NP3045. Somata (bracketed), from which patch-clamp recordings were obtained, reside in a uniquely identifiable location above and medial to the lobula’s upper margin. The left panel shows just the columnar neurons after section by section image deletion of other profiles expressing GFP. The right panel shows all profiles resolved at this level before removal. Scale bars for all panels: 50 μm.
Animal Preparation
Our animal set up (Fig. 2) is adapted from that reported by Wilson and Laurent (2005). Flies were inserted into a hole located in the center of a square of aluminum foil, which was attached to the center of a Petri dish. The Petri dish was then fastened to a fixed stage underneath an Olympus BX51WI microscope. A small amount of super glue and wax was used to suspend the fly in the hole. The dorsal-ventral axis of the animal’s body was perpendicular to the horizontal plane defined by the foil. The position of the fly’s head was adjusted to a standard position (± < 2 mm) using the coordinate lines on the Petri dish and the vernier of the microscope stage. The head capsule of the fly was fixed with its posterior plane horizontal. Thus, the back of the head could be bathed in saline, while the eyes in air received unimpeded visual stimuli. The optic lobe and/or the protocerebrum of the brain was exposed by removing posterior head cuticle and then bathing in extracellular saline (103 mM NaCl, 3 mM KCl, 5 mM N-tris (hydroxymethyl) methyl-2-aminoethane-sulfonic acid, 26 mM NaHCO3, 1 mM NaH2PO4, 1.5 mM CaCl2, 4 mM MgCl2, 10 mM trehalose, 10 mM glucose, and 2 mM sucrose, adjusted to 275 mOsm, pH equilibrated around 7.3 when bubbled with 95% O2/5% CO2; Wilson and Laurent, 2005). Papain (15 units/ml, Sigma) activated by 1 mM L-cysteine (Sigma) (Gu and O’Dowd, 2007) was locally applied above the somata of the GFP labeled LCNs or GF through a blunt glass electrode for about 1 min. Then the tracheae and sheath above the target area were removed with forceps (FST 5SF), or a sharp broken glass electrode, to expose the somata of the labeled neurons. The brain was continuously perfused with the extracellular saline (95% O2/5% CO2 bubbled) throughout the recording.
Figure 2.
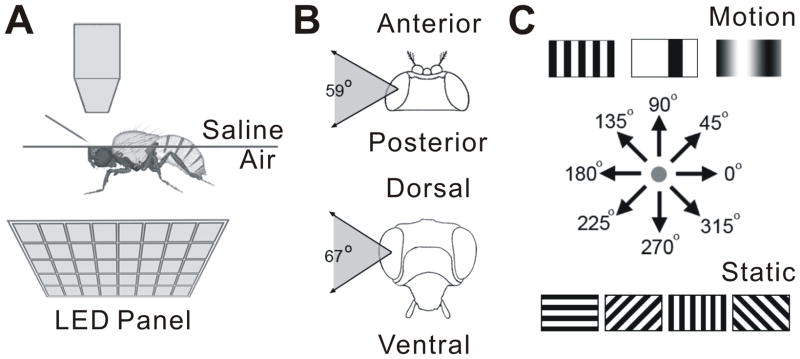
Experimental setup. A, The whole-cell patch recording setup. Flies were inserted into a square of aluminum foil attached to a Petri dish. The dorsal-ventral axis of the animal’s body was fixed perpendicular to the horizontal plane defined by the foil. The head of the fly was bent downwards until the posterior plane of its head was horizontal. The back of the head was bathed in saline, while the eyes remained in air to receive visual stimuli from LED panel beneath. B, The subtended visual field was 59° horizontally and 67° vertically. C, Visual stimuli included flicker, three types of motion pattern, square grating, single bar, and sinusoidal grating, moving in 4 or 8 different directions, and static square gratings at 4 different orientations.
Visual Stimuli
Visual stimuli were presented through a customized flat LED arena (Reiser and Dickinson, 2008) composed of 8 × 7 LED panels. Matlab 7.9 and the controller panel were used to program and execute visual stimuli on the LED arena, which was mounted at 45° under the immobilized fly. The long axis of the arena was adjusted to be parallel to the long axis of the fly thorax (Fig. 2A). The LED arena provided one eye with a 67° (vertical) by 59° (horizontal) visual field (Fig. 2B). Stimuli included full-field flicker, square wave gratings (spatial frequency of 8.4°, velocity of 29.4°/s), sinusoidal gratings (spatial frequency of 33.5°, velocity of 39°/s or 29.4°/s), moving bars (a black bar on a white background or a white bar on a black background, width of 16.7°, velocity of 39°/s or 29.4°/s), and static patterns of square wave gratings with different orientations (Fig. 2C). The Michelson contrast value of the patterns was 1. Sequences of mixed stimuli patterns were used: (1) 0.5 Hz flicker (5 s duration); (2) square wave grating motion in 8 different directions; (3) a single bar moving in 4 different directions; and (4) sinusoidal grating motion in 4 different directions. Stimuli 2, 3 and 4 were stationary for 1 s or 2 s and then moved for 2 s or 5 s. (5) an expanding (looming)/retracting square black block at the center of the LED panels (40°/s). When the recording was stable, stimuli were repeated an additional 1–4 times, either immediately before moving to the next stimulus pattern, or after cycling through the entire stimulus set. The direction and orientation of stimuli described in the results refer to the head in its normal position.
Whole-Cell Patch Clamp Recording
The somata of GFP labeled target neurons were patched under visual control through an Olympus BX51WI microscope with IR-DIC optics. We also made whole-cell patch clamp recordings of some non-GFP neurons in the brain by targeting the somata with interference optics alone. The solution within the patch-clamp electrode (10–13 MΩ) comprised: 140 mM potassium aspartate, 1 mM KCl, 4 mM MgATP, 0.5 mM Na3GTP, 10 mM HEPES, 1 mM EGTA (pH 7.3, 265 mOsm) (Wilson and Laurent, 2005). Biocytin (0.5%) was added for subsequent identification of recorded cells. Voltage was recorded with Spike2 6.0 software (Cambridge Electronic Design) in current-clamp mode through an Axopatch 200B amplifier (Molecular Devices), low-pass filtered at 5kHz, and digitized at 10kHz with a CED Power 1401 digitizer (Cambridge Electronic Design). In order to subsequently confirm the identity of a recorded cell, only one cell was patch-clamped in each animal.
Immunohistology and Anatomical Reconstruction
After recording, the fly’s brain was dissected and fixed in 4% formaldehyde in phosphate buffered saline (PBS) for 2 hr at room temperature, or overnight at 4°C. After six rinses with PBST (0.5% Triton X-1000 in PBS) for 15 min each, the brains were blocked with 10% goat serum for 2 hr at room temperature, then incubated with 1:1000 rabbit antibody to GFP (Molecular Probes) overnight at 4°C. After six rinses with PBST for 15 min each, the brains were incubated overnight at 4°C with 1:1000 goat antibody to rabbit:Cy5 (Molecular Probes) to visualize GFP-labeled neurons or 1:1000 streptavidin:Cy3 (Jackson Immuno Research) to visualize the biocytin-filled cells. After six rinses in PBST for 15 min each, brains were mounted in Vectashield on a slide. Images of brains were obtained from a Zeiss AxioPlan2 confocal microscope with a 40x oil-immersion objective. Stacks (1 to 2 μm slices) of images were used to reconstruct the anatomy of the recorded neurons in Adobe Photoshop CS2.
Data Analysis
Because electrophysiological records of the lobula output neurons revealed both fast and slow membrane potential fluctuations other than spikes, we used power-spectrum analysis to quantify the activity of the lobula output neurons. Results are only reported for neurons that had input resistance larger than 5 GΩ, which was our threshold criterion for the goodness of the seal, and therefore the quality of the electrophysiological recording. Time-frequency analysis was conducted in Matlab 7.9, using a program written by LM based on an algorithm published by Cohen et al. (2009). Time-frequency decomposition was computed through wavelet analysis, where the recording was convolved with a set of complex Morlet wavelets, defined as a Gaussian-windowed complex sine wave: ei2πtf e−t2/(2σ2). t is time and f is frequency, which ranges from 2 to 80 Hz in 20 logarithmically spaced steps. σ defines the width of each frequency band and was set according to 5/(2πf). 5 is the number of wavelet cycles that provides a balance between time and frequency resolution. After convolving the signal with the wavelets, power was defined as the modulus of the resulting complex signal z(t) (power time series: p(t) = real[z(t)]2 + imag[z(t)]2). The baseline was defined as the average power in the second prior to the beginning of each stimulus. The final power time sequences were normalized to a decibel (dB) scale, 10*log10(response/baseline), which allows a direct comparison across frequency bands. Furthermore, the averaged dB power from 2–80 Hz through a given time period can be calculated from the time-frequency analysis. We also used an alternative method to calculate time-averaged power spectra (Fig. 6C) which directly employs the discrete Fourier transform function, fft, in Matlab 7.9.
Figure 6.
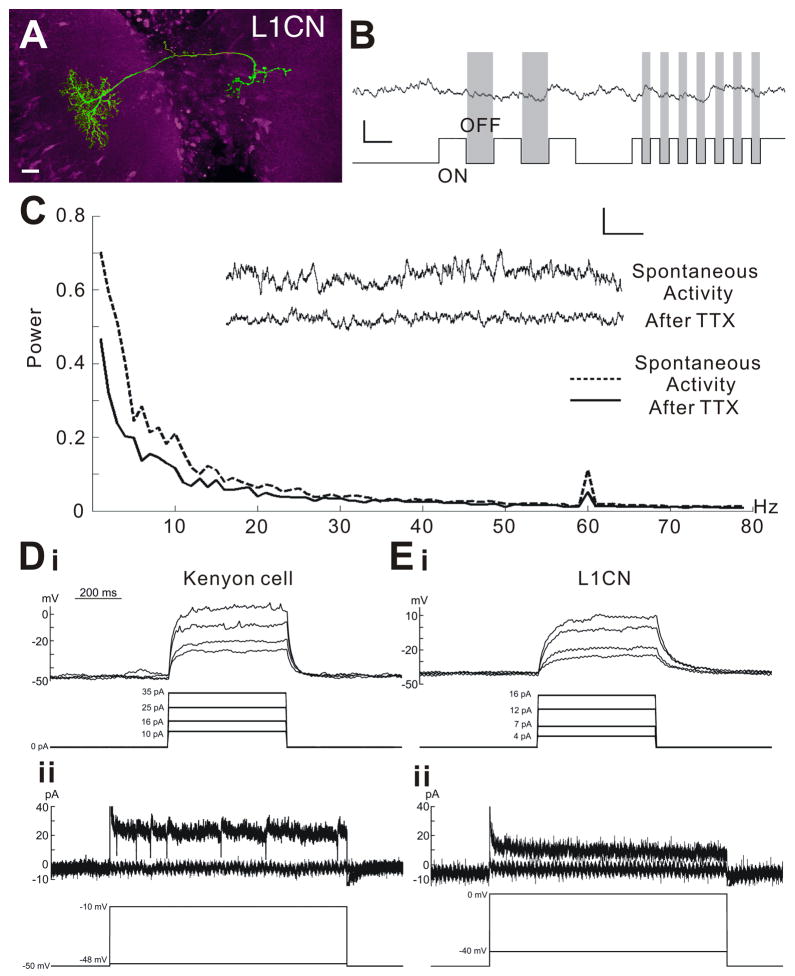
The non-spiking nature of a single L1CN labeled in the GAL4 line NP3045. A, A single recorded and biocytin-filled LCN. Scale bar: 10 μm. B, Responses of a single L1CN showing typical nonspiking fast and slow membrane potential fluctuations, which appear to be unrelated to the visual on/off stimulus. C, Plot showing averaged power fluctuations before and after applying TTX to the lobula. The inset shows the sample recordings before and after application. Applying TTX reduces both fast and slow membrane potential fluctuations. D and E: Current clamp (Di and Ei) and Voltage clamp (Dii and Eii) recordings from a Kenyon cell (D) and an L1CN cell (E). Action potentials and inward voltage active currents can be initiated in Kenyon cells, but not in L1CN cells.
The extracted power data were statistically analyzed to examine whether these neurons show selective responses to particular visual stimuli. To test the effect of flicker, one-way repeated-measure ANOVA was conducted using time (time windows a ~ e, Fig. 7) as the sole factor. If a significant effect of time was found, multiple comparisons among pairs of time windows (i.e. time window a vs b, time window b vs c, etc.) were made using the Holm step-down procedure (Holm, 1979) to control the overall Type I error level. To test the responses of motion stimuli and static patterns, data were analyzed by two-way repeated-measure ANOVA with direction/orientation and time (200 ms prior to, vs. 200 ms following the onset of the stimuli) as factors. If significant direction-by-time or orientation-by-time interaction effects were found, it indicated that the neurons did respond to the stimuli differently at the different directions (or orientations). In order to determine which direction(s) or orientation(s) caused the power of a neuron’s membrane potential fluctuations to change significantly following the onset of the stimuli, a test of the simple effect of time was conducted at each direction or orientation. For all analyses, effects were considered significant at p ≤ 0.05 and marginally significant at p ≤ 0.10.
Figure 7.
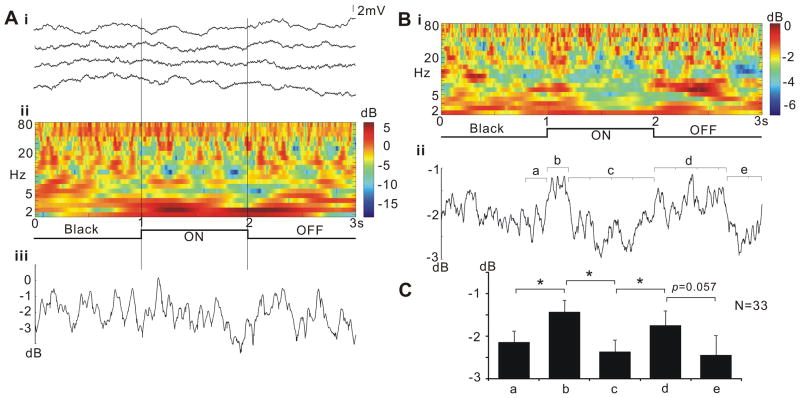
L1CNs respond to slow flicker. A, Responses of a single L1CN: (i) membrane potential recordings in 4 successive trials; (ii) time frequency plot showing the power of membrane potential oscillations during the stimulus, averaged from the 4 trials shown in (i); (iii) line plot showing averaged powers (2–80 Hz) throughout the stimulus calculated from the time frequency plot of (ii). This individual L1CN showed weak response to slow flicker. B, Time frequency plot of averaged response from grouped L1CNs (N=33). Letters indicate time windows where the averaged powers were statistically compared (a, 200 ms; b, 200 ms; c, 800 ms; d, 700 ms; e, 300 ms). C, Averaged dB power at various time windows during the stimulus (mean ± SEM). Both light on and light off initiate significantly increased power of membrane potential fluctuations. Single asterisk indicates the significance level at p ≤ 0.05.
Results
Nerve cell morphologies relate to neural coding
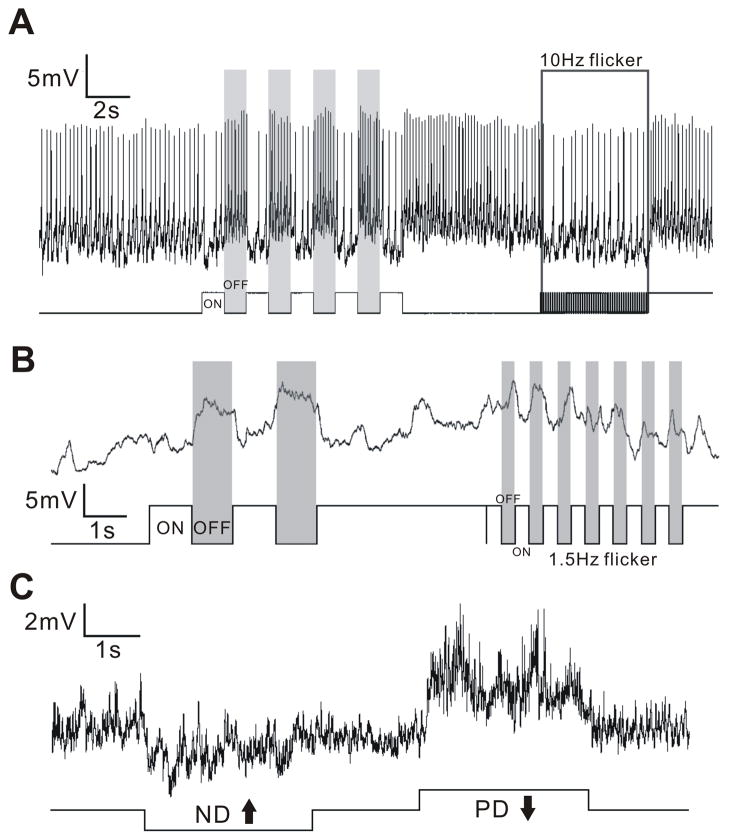
Neurons in the Drosophila brain produce spiking, nonspiking, or mixed spiking responses to visual stimuli. Fig. 3A shows a neuron responding with tonic spiking to flicker, with its firing rate increasing in response to decrements of illumination and decreasing in response to increments. In contrast, the neuron depicted in Fig. 3B responds with depolarizing membrane potentials, but not spikes, in response to intensity decrements. Similar distinctions have been routinely documented in the fly Phaenicia where the smallest neurons with the thinnest axons conduct information by graded potentials and larger neurons conduct by action potentials, or mixed graded and action potentials (Gilbert and Strausfeld, 1992; Douglass and Strausfeld, 1995, 1996; Okamura and Strausfeld, 2007). An example of a mixed response is shown by the giant vertical motion sensitive neurons (VS) in the lobula plate of Drosophila (Fig. 3C). VS neurons in larger flies display similar mixed responses to those in Drosophila (Douglass and Strausfeld, 1996; Joesch et al., 2008; Maimon et al., 2010).
Figure 3.
Visual stimuli evoke spiking, non-spiking, or mixed responses in different Drosophila neurons. A, A spiking neuron showing changes of firing rate to light on and light off. B, A nonspiking neuron showing depolarizing membrane potentials to the off component of flicker. C, A VS neuron showing direction-selective responses to vertical motion stimuli, with both graded membrane potential change and action potential spikelets. PD, preferred direction; ND, null direction.
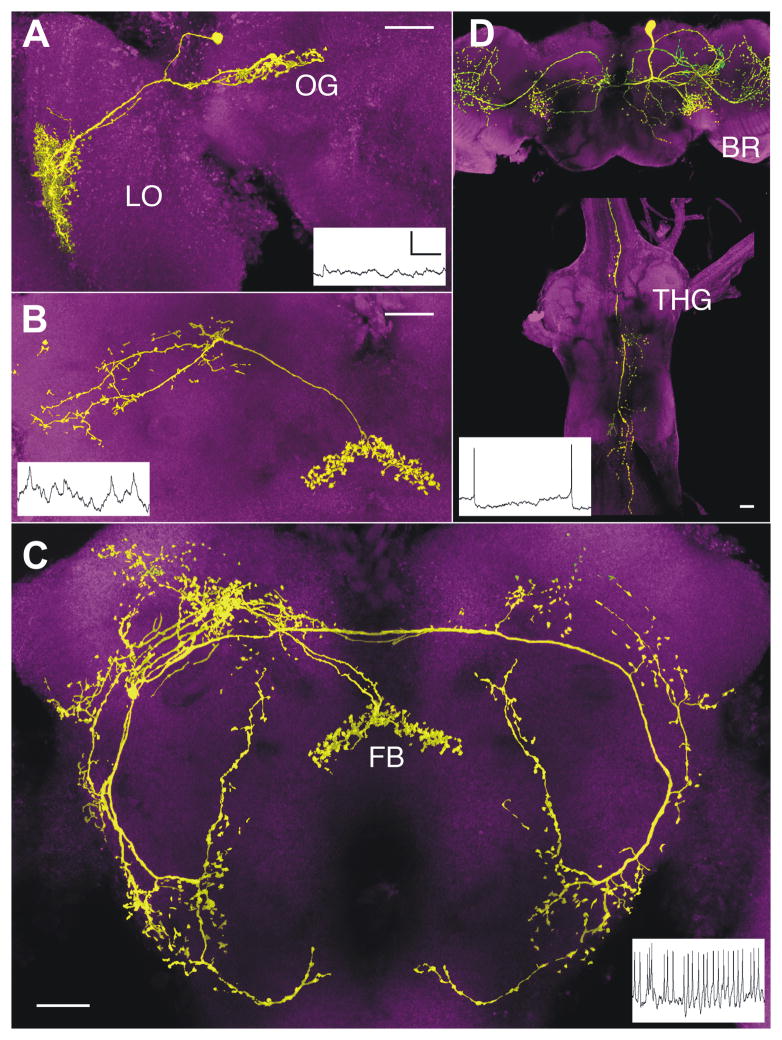
We recorded and anatomically identified different neurons in the visual system to determine whether these physiological spiking and non-spiking characteristics of individual neurons are correlated with their anatomical features. Output neurons from the lobula conduct only by electrotonic transmission; they show both fast and slow membrane potential fluctuations but never spike, even when injected with depolarizing current (Fig. 4A). These neurons have an axon length of 80 – 90 μm, and a diameter of less than 0.5 μm. In contrast, either mixed or exclusively spiking responses are elicited in neurons that occur as bilateral pairs of ‘unique’ cells, or as very small populations of 2–8 identical neurons. These neurons have axon diameters of at least 0.5 μm and axons ranging from 80 μm to 410 μm in length (Fig. 4B, 4C). Descending neurons that extend from the brain to the thoracic ganglia, and which also occur as pairs, have 500–700 μm long axons with axon diameters ranging between 1.5 and 3 μm. Such neurons conduct by action potentials (Fig. 4D).
Figure 4.
Scanning confocal micrographs of non-spiking and spiking neurons show that anatomy correlates with information transfer (shown in insets). A, A nonspiking LCN with a terminal in a dorso-anterior optic glomerulus (OG). Axon length between 80 μm–90 μm, diameter less than 0.5 μm. B, One of a bilateral pair of uniquely identifiable protocerebral interneurons associated with the fan-shaped body of the central complex, showing mixed membrane potential fluctuations and action potentials: axon lengths, 70–80 μm, diameters approximate 0.5 μm. C, One of a pair of uniquely identifiable spiking interneurons associated with the fan-shaped body (FB) of the central complex and extensions to protocerebral and deutocerebral regions: axon lengths 395–410 μm, diameters 1.0–1.5 μm. D, A spiking descending neuron linking the protocerebrum the brain (BR) to thoracic ganglia (THG): axon length 500–700 μm, diameter 1.5–3 μm. Scale bars on micrographs: 20 μm. Scale bar for recordings: 5 mV/500 ms for A–C, 10 mV/500 ms for D.
There is a clear association between anatomical and physiological characteristics of this sample of fly visual interneurons. For example, the short narrow axons of the LCNs are non-spiking. As reported by Faisal and Laughlin (2007), such small-diameter processes are subject to channel noise, which corrupts spiking transmission. Encoding of visual parameters by such thin axons may be less reliant on the efficiency of signal propagation by single neurons, and instead relies on the collaborative encoding by subsets of neurons which converge onto a common postsynaptic target. This is confirmed by findings described below.
Signal reliability and enhancement at the optic glomerulus
We focused on two clones of lobula complex columnar neurons: type 1 lobula columnar neurons (L1CNs) labeled in the GAL4 line NP3045 (Otsuna and Ito, 2006); and the type 2 lobula plate-lobula columnar neurons (LPL2CN) labeled in the Gal4 line NP5092. These neurons target two distinct optic glomeruli (Fig. 1A, B). Axons of LPL2CNs converge with terminals from a third clone, lobula Col A cells (Strausfeld and Hausen, 1977), at the giant fiber (GF) glomerulus, so called because its cluster of projection neurons includes the GF, first described by Koto et al. (1981). Physiological recordings were obtained from the LPL2CN lobula complex output neurons, the glomerular local interneuron (LIN) associated with the GF glomerulus, and the GF itself.
The LPL2CN (Fig. 5Ai) is one of an isomorphic population, which has been identified in several dipterous species (Strausfeld and Gilbert, 1992). In Drosophila, the LPL2CN clone comprises 40 identical sibling neurons spaced one to every three retinotopic columns. Typical of such ensembles, each neuron has a conical dendritic field extending through the depth of the lobula plate, and linked by a stout process to a narrow but deep dendritic field in the lobula. The dendritic processes of the LPL2CN subtend an oval configuration of six retinotopic columns from the medulla, each column representing a set of optically coherent R1–R6 photoreceptors, each of which has an acceptance angle of about 5°–6° (Heisenberg and Wolf, 1984). Each LPL2CN thus subtends a circular area of the visual panorama approximately 30° wide. Together, the 40 LPL2CNs, the neighboring cells of which have overlapping visual fields, subtend the entire retina of one eye.
Figure 5.
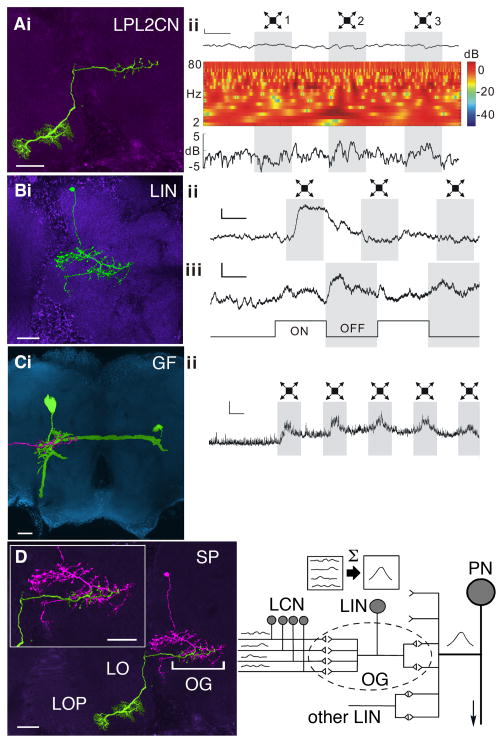
Neural integration enhances sensitivity to looming stimuli. A to C: Left column shows confocal images of recorded neurons. Scale bars: 20 μm. Right column shows corresponding recordings. Scale bars: 2 mV/500 ms. A, Power spectrum analysis (ii) illustrates the non-spiking LPL2CN responding to the looming stimulus 2 and 3. The first trace is the recording sample. The time frequency plot in the middle shows the power of membrane potential oscillations calculated from the recording sample above. The line plot at the bottom shows averaged powers (2–80 Hz) throughout the stimulus calculated from the time frequency plot above. B, The unambiguous and rapidly adapting responses to looming and full-field flicker stimuli of the local interneuron (LIN) in the giant fiber glomerulus. C, The giant fiber (GF) and its depolarizing response to looming stimuli. An image of the terminal of LPL2CN (pink) is superimposed on the GF dendrites to indicate their overlap in the GF glomerulus. D, Convergent processing in the optic glomerulus. Left main panel: Montage showing overlap at the same optic glomerulus (bracketed OG) of the recorded local interneuron (pink) and the axon terminal of a recorded LPL (green). This species of neuron, LPL2CN, belongs to the class of lobula plate-lobula neurons (LPLs) characterized by their dendrites in the lobula plate (LOP) and lobula (LO). The inset shows an enlargement of the related glomerulus. Right panel: schematic to illustrate convergence of LCNs to an optic glomerulus (OG). Responses of the LCNs are summed (Σ) and carried by the local interneuron (LIN) relaying to its cognate projection neuron (PN). Projection neurons of OG receive additional LIN inputs.
Typical of lobula complex output neurons, responses of the LPL2CN are subtle, and without power-spectrum analysis (see methods) are not clearly resolved from membrane-potential fluctuations. This typical aspect of lobula columnar neurons is considered in greater detail later. Power spectrum analysis of the LPL2CN (Fig. 5Aii) shows that the neuron usually, but not invariably, responds to a looming stimulus expanding over the retina. In contrast, the LIN of the glomerulus in which LPL2CN neurons terminate (Fig. 5Bi) shows an unambiguous and rapidly adapting response to the looming stimulus (Fig. 5Bii). Furthermore, the response of the LIN to slow full-field flicker shows that intensity decrements, such as are incurred by a looming dark stimulus, initiate a larger depolarization than do intensity increments (Fig. 5Biii). The same looming stimulus also elicits corresponding depolarization in one of this glomerulus’ major projection neurons, the GF (Fig. 5C). These findings suggest that although any single lobula complex output neuron LPL2CN unreliably encodes the looming stimulus, encoding by the LIN involves signal averaging and thus noise-reduction and the encoded signal relayed to the GF. In larger species of Diptera, and likely in Drosophila, these are integrated with signals representing other sensory modalities (Bacon and Strausfeld, 1986). We propose that encoding of a visual primitive (Marr, 1976) by an ensemble of lobula complex outputs results in the amplified LIN response, which is relayed to the projection neurons of the glomerulus (Fig. 5D). A similar functional organization has been demonstrated from recordings of the larger fly, Phaenicia serricata, in which a single LPL input to an identified glomerulus was broadly tuned to the orientation of a moving bar whereas LINs associated with that glomerulus showed narrow tuning, as did the projection neuron from this glomerulus (Strausfeld et al., 2007).
Electrophysiological properties of a single L1CN
We next asked if lobula complex neurons singly provide unreliable signals, might groups of the same neuronal clone, converging into a glomerulus, provide a more reliable signal, as suggested above. To test this, recordings were made from type 1 lobula columnar output neurons (L1CN), which have even smaller axon diameters than the LPL2CN described above, but whose cell bodies are located closer to the surface of the brain and therefore are more accessible for whole-cell patch clamp recording. Each L1CN of the clone of about 40 neurons has an axon diameter less than 0.5 μm (Fig. 6A). Such neurons show both fast and slow spontaneous membrane potential fluctuations, seemingly independent of visual stimuli (Fig. 6B), as might be expected in neurons that receive many synaptic inputs conveying a range of visual information. Indeed, L1CN dendritic ensembles in the lobula are postsynaptic to the terminals of hundreds of retinotopic relay neurons from the medulla. To test whether the origin of spontaneous signals is from active pre-synaptic inputs, TTX (1 μM) was applied to the perfusion saline. Membrane potential fluctuations decreased substantially and the averaged power of fluctuations significantly decreased (Student’s t-test, n=20, p<0.05, Fig. 6C). To confirm further that the non-spiking feature found in the lobula columnar neuron is not due to limitations of our recording technique, we compared voltage-clamp and current-clamp recordings from Kenyon cells of the mushroom bodies and L1CNs (Fig. 6D, E). Kenyon cells of Drosophila are spiking neurons with 2–3 μm diameter somata (Turner et al., 2008). Action potentials were initiated in the Kenyon cells when injecting positive current (Fig. 6Di), and inward active currents were visible in voltage clamp recordings (Fig. 6Dii). In contrast, no action potentials and inward active currents were found in L1CNs (Fig. 6Ei, 6Eii), under identical physiological conditions, confirming the non-spiking nature of L1CNs.
Responses of L1CNs to slow flicker stimuli
The electrophysiological responses of L1CNs are best resolved, like LPL2CNs, by examining membrane potential fluctuations using power spectrum analyses. L1CNs comprise an assembly of 36–40 L1CNs, the axons of which project to the same optic glomerulus. The responses of an individual L1CN to slow flicker (0.5 Hz) are ambiguous, because they are embedded within a background of synaptic activity, as shown by the 4 successive recordings in Fig. 7Ai. An averaged time frequency plot of these 4 recordings (Fig. 7Aii) and their calculated averaged power (2–80 Hz; Fig. 7Aiii) show that, for a single L1CN, low frequency oscillations mark the response of the neuron to light on and light off.
However, if sibling neurons encode the same visual primitives, the summed responses from many L1CNs might be expected to show clearer evidence of responses to a defined visual stimulus. This is confirmed by averaging the responses from 33 identical L1CNs (Fig. 7B). The averaged responses to the first cycle of stimulation shows a clear power increase to light on (from a to b, Fig. 7Bii) followed by a decrease about 200 ms thereafter (c in Fig. 7Bii). Similarly, a light off stimulus initiates a longer duration power increase for about 700 ms (from c to d, Fig. 7Bii) followed by a decrease (e, Fig. 7Bii). Such power changes during the first cycles of slow flicker are significant (N=33, p<0.05), but subsequent flicker stimulation elicited no further responses, suggesting that L1CNs quickly adapt to the full-field flicker stimuli.
Direction and orientation selectivity of L1CNs to moving and static patterns
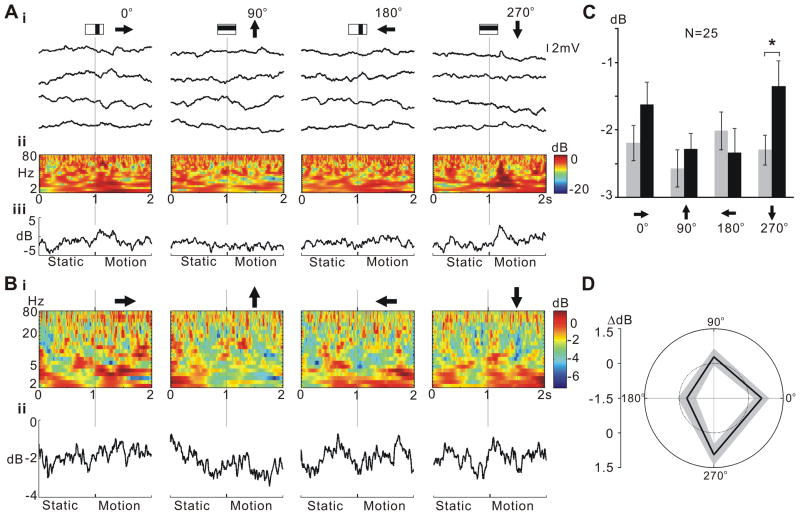
Studies of the dipteran, Phaenicia serricata, showed that specific types of LCNs selectively encode bar orientation and motion (Okamura and Strausfeld, 2007). We tested responses of individual and subsets of L1CNs to moving bar stimuli, square wave gratings, and sinusoidal gratings. L1CNs displayed directional selectivity to the oriented motion of a single bar (Fig. 8). Power spectrum analysis shows that a single L1CN has a subtle response to downward motion (270°) of a single bar (Fig. 8Ai). The averaged power spectrum of 25 L1CNs to the same stimulus sequence 200 ms before and 200ms after the onset of bar motion for 4 different directions reveals that downward (270°) motion indeed initiates a significant response (Fig. 8B, 8C; N=25, p<0.05). This shows that although a summed output signal from several L1CNs is robust, responses of a single L1CN to visual stimuli are subtle and variable. Additionally, the polar plot (Fig. 8D) suggests that the preferred direction for L1CNs is around 315°. The power spectrum analysis does not differentiate the excitatory postsynaptic potentials (EPSPs) and inhibitory postsynaptic potentials (IPSPs). Therefore, this result indicates either increased EPSPs or increased IPSPs in L1CNs at the preferred motion direction and thus the increased activities of upstream medulla inputs. Unlike the wide-field tangential cells in the lobula plate, which detect the direction of either horizontal or vertical motion, L1CNs showed no evidence of a significant “null” direction, which suggests the upstream medulla inputs were not significantly inhibited at any motion direction.
Figure 8.
L1CNs respond selectively to a single bar moving in a downward direction. A, Responses to single bar motion of an individual L1CN: (i) sample recordings in 4 successive trials for each stimulus direction; (ii) time frequency plots during the stimulus averaged from each of the 4 sets of trials shown in (i); (iii) line plots showing the mean power (2–80 Hz) change throughout the stimulus for each stimulus direction. B, Time frequency plot of averaged responses from grouped LCNs (N=25) for each direction. Line plots (ii) show the averaged power (2–80 Hz) change throughout the stimulus calculated from the time frequency plots in (i). Arrows indicate the direction of the motion pattern with respect to the head of the fly. C, Mean power during 200 ms before (grey bar) and after (black bar) motion stimulus onset for different directions (mean ± SEM). Downward (270°) motion initiated a significant response (p ≤ 0.05). D, Polar plots of mean power difference between 200 ms before and after motion stimulus onset for different directions. The grey area indicates mean ± SEM. The inner dotted line indicates the zero power change.
In contrast to the directional selectivity to the movement of a single bar stimulus, neither single L1CNs nor averaged subsets of 28 L1CNs showed significant responses (p > 0.05) to a square wave grating moving in any of 8 presented directions (Fig. 9A). Similarly, a sinusoidal grating moving in any of 4 different presented directions failed to elicit any specific response (Fig. 9B, N=26, p>0.05). Finally, we examined orientation selectivity of L1CNs to static square wave gratings orientated at 4 different angles, at increments of 45°. Recordings from individual L1CNs show no clear response to any static pattern. Furthermore, the power spectrum of the averaged response of 28 L1CNs 200 ms before and 200 ms during stimulus presentation also did not show significant response for static gratings at any specific orientation (Fig. 9C, N=28, p>0.05).
Figure 9.
L1CNs do not show significant responses to directional square wave gratings motion, sinusoidal gratings motion, and presenting static square wave gratings. The bar graphs show the mean power in 200 ms before (grey bar) and 200ms after (black bar) the beginning of the motion stimuli at different directions, or displaying static patterns at the different orientations (mean ± SEM). Arrows indicate the direction of the motion pattern with respect to the head of the fly. A, Square wave gratings moving in 8 different directions (N=28, p>0.05). B, Sinusoidal gratings moving in 4 different directions (N=26, p>0.05). C, Static square wave gratings at 4 different orientations (N=28, p>0.05).
Discussion
Axon diameters and signal reliability
Retinotopic output neurons from the lobula of Drosophila, which have axon diameters of 0.5 μm or less, do not transmit action potentials. This is typical of the many small interneurons in the insect visual system that are arranged as repeat ensembles. However, mushroom body intrinsic neurons (Kenyon cells) may be a special exception to this because very few of them, at any time, are required to accurately encode odorant identity through the mechanism of ‘sparsening’ (Wang et al., 2004).
In the dipteran Phormia, relays connecting the medulla to the lobula and lobula plate have axon diameters of between 0.5 μm and 3 μm. These neurons generally respond with graded potentials (Douglass and Strausfeld, 1995, 1996, 2003) as do the larger axon diameter (2–4 μm) lamina monopolar cells, which extend from the lamina to the medulla (Autrum et al., 1970; Zettler and Järvilehto, 1973). Even the 15 μm diameter axons of ‘giant’ motion sensitive neurons in the lobula plate can conduct by graded potentials in addition to spiking responses. However, there are some exceptions. In the hoverfly Eristalis tenax, object-detecting neurons relaying from lobula show clear spiking responses, as do neurons in Phormia that respond to moving bars (Nordström et al., 2006; Okamura and Strausfeld, 2007).
Signal reliability is also critical for neurons that occur as single pairs of uniquely identifiable neurons, or as very small populations in the brain, or small subsets of Kenyon cells, each subset encoding an odorant. In Drosophila, such neurons conduct by spikes or by mixed codes: membrane potential fluctuations and action-potentials. Examples are the wide-field directional selective tangential cells of the lobula plate which occur either as a uniquely identifiable set of 3 HS neurons, or as 11 uniquely distinct VS neurons which collaborate to mediate responses to changes in optic flow (Borst and Haag, 1996). Neurons with long axons, such as the unique pairs of interneurons linking the central body with many areas of the lateral protocerebrum and deutocerebrum, or those which carry data from the brain to thoracic ganglia also invariably conduct by spikes.
In contrast to uniquely identifiable pairs or small clones of neurons belonging to the midbrain, many neurons in the optic lobes occur as ensembles of identical, clonally related neurons. In the medulla of Drosophila and other fly species, there are about 50 types of retinotopic neurons, spaced one to each retinotopic column (Fischbach and Dittrich, 1989; Bausenwein et al., 1992). In the lobula, there are about 15 different clones of output neurons, each of which comprises an ensemble of about 40 identical neurons (Otsuna and Ito, 2006). Each neuron of an ensemble subtends 6–9 visual sampling units of the retina and has dendrites, and thus receptive fields (Okumura and Strausfeld, 2007), that overlap with a surround of at least 8–12 neurons of the same clonal identity (Strausfeld and Hausen, 1977; *****************Strausfeld and Gilbert, 1992). This anatomical arrangement ensures that 8–12 neurons of the same clone view the same part of the visual field.
In Drosophila, such outputs from the lobula have extremely thin axons and these cells conduct by graded potentials. Each LCN exhibits significant membrane-voltage fluctuations, which likely reflect the many postsynaptic sites from medulla afferents. An important finding of this study was that recordings from many single L1CNs show that none reliably encodes a visual primitive, whereas the summed responses of L1CNs show clear responses to defined visual stimuli. Thus, since any ensemble of LCNs converges at its unique glomerulus, it is expected that a subset of LCNs will respond to a given visual stimulus and that the summed responses of this subset would drive postsynaptic neurons of their target glomerulus. In larger dipterans, it has also been shown that different optic glomeruli respond to different visual primitives (Okamura and Strausfeld, 2007; Strausfeld et al., 2007).
It is conceivable that the weak responses we recorded in individual LCNs is due to the long electrotonic distance between soma and axon. However there are two major reasons to reject the idea that these non-spiking characteristics are artifactual. Firstly, using an identical recording methodology, small spiking neurons in the mid brain were also shown to have long thin neurites between their cell body and their main integrative region. Secondly, recordings of the smallest retinotopic neurons in the medulla of a larger fly species, Phaenicia sericata, consistently showed that they encode data in a non-spiking fashion, irrespective of the location of the electrode in the neuron (Douglass and Strausfeld, 2003).
Integration at the optic glomerulus
If an individual output neuron from the lobula complex can have subtle and variable responses to specific visual stimuli, but the summed responses of a subset of LCNs belonging to the same clone show a clearer response, might local interneurons post-synaptic to their terminals in their relevant optic glomerulus integrate input signals and unambiguously respond to the same visual stimuli? Recordings of a LIN in the giant fiber optic glomerulus complex suggest this is case: the LIN responds unambiguously to a looming stimulus, whereas the response of the single LPL2CN to the same stimulus can only be resolved from a power spectrum analysis. However, as shown above, when responses of many of the same type of lobula output neurons are summed, their collective response is unambiguous.
The GF glomerulus receives LPL2CN inputs and contains LIN processes as well as one major dendritic process of the GF (Bacon and Strausfeld, 1986). The GF glomerulus LIN responds to looming stimuli, and responds to intensity decrements. Looming stimuli activate the GF glomerulus’s LPL2CN inputs. Responses by the LIN are also the same as those that drive the GF. That the LIN rapidly adapts to looming stimuli whereas GF does not suggests that several LINs are associated with the glomerulus and that these may recruit signals from successive groups of activated LPL2CN afferents. Though it remains to be demonstrated that the LPL2CN clone is presynaptic to the LIN and GF, there is strong evidence in larger dipteran species that the Col A afferents, which also converge on the GF glomerulus, are directly presynaptic to the GF. For example, electromicroscopy studies have shown that in Musca domestica, Col A cells establish electrical synapses onto the GF (Strausfeld and Bassemir, 1983), and cobalt introduced into the GF passes, rather spectacularly, into the entire array of Col A afferents (Strausfeld and Bacon, 1983; Bacon and Strausfeld, 1986). Col A cells in the fly Phoenicia serricata respond with graded potentials to decrements in illumination and to movement of edges (Gilbert and Strausfeld, 1992). The convergence of Col A neurons and neurons of the LPL2CN clone at the GF glomerulus does suggest that there is a more complex control system eliciting GF responses than has been hitherto envisaged.
Evolutionary considerations: segmental correspondence with the olfactory system
The convergence of axons from a clone of optic lobe outputs to an optic glomerulus suggests a mechanism that establishes reliable downstream responses: one or more local interneurons of the glomerulus complex integrate and average inputs from members of an isomorphic population of retinotopic relay neurons from the lobula complex (Fig. 5D). Recordings from the GF glomerulus show that its LIN responds reliably to the same looming stimulus that drives the LPL2CN afferent supply to that glomerulus. The demonstration that the LIN response is relatively noise-free, suggests that one function of LINs is to disambiguate information carried by afferents to a glomerulus, from synaptic noise generated at the dendritic trees within the lobula. Noise free information could then be relayed by the LIN to the glomerulus’ projection neurons. These are of two types: premotor descending neurons, such as the GF, which project to the thoracic ganglion; and relay neurons which project to higher centers in the brain, such as the dorsal protocerebral lobes (Strausfeld and Okamura, 2007), and their connections to the central complex (Liu et al., 2006).
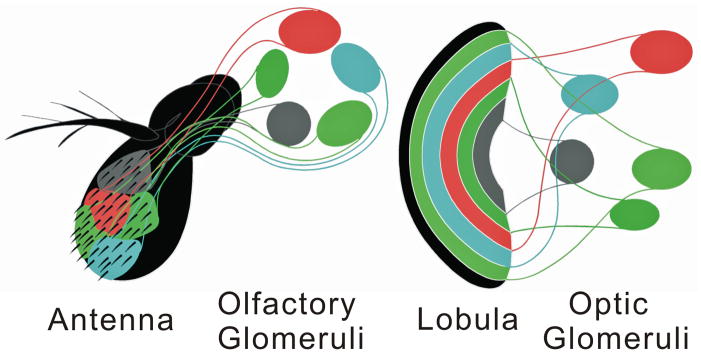
This convergence of lobula outputs to uniquely identifiable optic glomeruli in the brain’s first segment, the protocerebrum, is comparable to the convergence of olfactory sensory neurons (OSN) to antennal lobe glomeruli in the brain’s second segment, the deutocerebrum (Fig. 10), where each unique glomerulus in the fly’s antennal lobe is targeted by the axons of a specific set of olfactory sensory neurons (OSNs) on the antenna, which expresses a particular olfactory receptor protein (Vosshall et al., 2000). In the antennal lobe, noisy signals from OSNs are refined by local interneurons and then relayed to higher centers by projection neurons (Laurent, 2002; Wilson, 2008). The present results provide electrophysiological evidences that noisy signals in an isomorphic population of lobula outputs are similarly refined by local interneurons of the optic glomerular complex. Therefore reliable responses in an optic glomerulus are established through convergence and signal averaging processes.
Figure 10.
Schematic comparing central segregation of coded channels to olfactory and optic glomeruli. Olfactory receptor neurons encoding data about specific ligands segregate to unique olfactory glomeruli, 40 of which are located in the Drosophila deutocerebrum (Laissue et al., 1999). Genetically defined clones of lobula outputs with dendrites in specific layers of the lobula each encodes data about specific visual primitives. Axons from each clone segregate to unique optic glomeruli, 18 of which are found in the Drosophila protocerebrum (Otsuna and Ito, 2006).
The present studies further support the proposition that the optic glomerular complex and the antennal lobes are serially homologous neural systems having the same principle anatomical and functional organization, and with the common function of refining and integrating incoming signals (Strausfeld et al., 2007). Glomerular organization in the protocerebrum and deutocerebrum reflect a ground pattern that can be identified in every ganglion of the central nervous system (Strausfeld, 2012). Throughout, each type of receptor, representing one or another modality, sends its axon to a specific domain in the relevant ganglion. These domains, in some ganglia represented by glomerular volumes, in others by allantoid or ovoid ones, are connected by spiking and non-spiking local interneurons which integrate the sensory input and relay behaviorally meaningful information to central neuropils and to motor circuits (Burrows, 1996). Such arrangements evolutionarily derive from an ancestral ground pattern seen in archaic arthropods, each segment of which was composed of identical elements (Strausfeld, 2012). As demonstrated by the protocerebrum and deutocerebrum, present day insects reflect this ancestral ground pattern even in the brain, despite each segment having evolved its unique sensory configuration.
Acknowledgments
This work was supported by NIH NCRR RO1 08688 and AFOSR 300900. We thank Dr. Rachael Wilson for suggestions on the whole-cell patch recording set up, and Dr. Jie Pu for advice on data analysis methods.
References
- Autrum H, Zettler F, Järvilehto M. Postsynaptic potentials from a single monopolar neuron of the ganglion opticum I of the blowfly Calliphora. J Comp Physiol A. 1970;70:414–424. [Google Scholar]
- Bacon JP, Strausfeld NJ. The dipteran giant fiber pathway: neurons and signals. J Comp Physiol A. 1986;158:529–548. [Google Scholar]
- Bausenwein B, Dittrich APM, Fischbach KF. The optic lobe of Drosophila melanogaster II. Sorting of retinotopic pathways in the medulla. Cell Tissue Res. 1992;267:17–28. doi: 10.1007/BF00318687. [DOI] [PubMed] [Google Scholar]
- Borst A, Haag J. The intrinsic electrophysiological characteristics of fly lobula plate tangential cells: I. Passive membrane properties. J Computat Neurosci. 1996;3:313–336. doi: 10.1007/BF00161091. [DOI] [PubMed] [Google Scholar]
- Burrows M. The neurobiology of an insect brain. Oxford: Oxford University Press; 1996. [Google Scholar]
- Cajal SR, Sánchez D. Contribucion al conocimiento de los centros nerviosos de los insectos. Parte 1. Retina y centros opticos. Trab Lab Invest Biol Univers Madrid. 1915;13:1–168. [Google Scholar]
- Cohen MX, David N, Vogeley K, Elger CE. Gamma-band activity in the human superior temporal sulcus during mentalizing from nonverbal social cues. Psychophysiology. 2009;46:43–51. doi: 10.1111/j.1469-8986.2008.00724.x. [DOI] [PubMed] [Google Scholar]
- Douglass JK, Strausfeld NJ. Visual motion detection circuits in flies: Peripheral motion computation by identified small-filed retinotopic neurons. J Neurosci. 1995;15:5596–5611. doi: 10.1523/JNEUROSCI.15-08-05596.1995. [DOI] [PMC free article] [PubMed] [Google Scholar]
- Douglass JK, Strausfeld NJ. Visual motion-detection circuits in flies: Parallel direction- and non-direction-sensitive pathways between the medulla and lobula plate. J Neurosci. 1996;16:4551–4562. doi: 10.1523/JNEUROSCI.16-15-04551.1996. [DOI] [PMC free article] [PubMed] [Google Scholar]
- Douglass JK, Strausfeld NJ. Retinotopic pathways providing motion-selective information to the lobula from peripheral elementary motion-detecting circuits. J Comp Neurol. 2003;457:326–344. doi: 10.1002/cne.10575. [DOI] [PubMed] [Google Scholar]
- Faisal AA, Laughlin SB. Stochastic simulations on the reliability of action potential propagation in thin axons. Compt Biol. 2007;3:79–91. doi: 10.1371/journal.pcbi.0030079. [DOI] [PMC free article] [PubMed] [Google Scholar]
- Fischbach KF, Dittrich APM. The optic lobe of Drosophila melanogaster. I. A Golgi analysis of wild-type structure. Cell Tissue Res. 1989;258:441–475. [Google Scholar]
- Gao Q, Yuan B, Chess A. Convergent projections of the Drosophila olfactory neurons to specific glomeruli in the antennal lobe. Nat Neurosci. 2000;3:780–785. doi: 10.1038/77680. [DOI] [PubMed] [Google Scholar]
- Gilbert C, Strausfeld NJ. Small-field neurons associated with oculomotor and optomotor control in muscoid flies: functional organization. J Comp Neurol. 1992;316:72–86. doi: 10.1002/cne.903160107. [DOI] [PubMed] [Google Scholar]
- Gu H, O’Dowd D. Whole cell recordings from brain of adult Drosophila. J Vis Exp. 2007;6:e248. doi: 10.3791/248. [DOI] [PMC free article] [PubMed] [Google Scholar]
- Heisenberg M, Wolf R. Vision in Drosophila, genetics of microbehavior. New York: Springer-Verlag; 1984. p. 17. [Google Scholar]
- Holm S. A simple sequentially rejective multiple test procedure. Scand J Statist. 1979;6:65–70. [Google Scholar]
- Joesch M, Plett J, Borst A, Reiff DF. Response properties of motion-sensitive visual interneurons in the lobula plate of Drosophila melanogaster. Curr Biol. 2008;18:368–374. doi: 10.1016/j.cub.2008.02.022. [DOI] [PubMed] [Google Scholar]
- Koto M, Tanouye MA, Ferrus A, Thomas JB, Wyman RJ. The morphology of the cervical giant fiber neuron of Drosophila. Brain Res. 1981;221:213–217. doi: 10.1016/0006-8993(81)90772-1. [DOI] [PubMed] [Google Scholar]
- Laurent G. Olfactory network dynamics and the coding of multidimensional signals. Nat Rev Neurosci. 2002;3:884–895. doi: 10.1038/nrn964. [DOI] [PubMed] [Google Scholar]
- Laissue PP, Reiter C, Hiesinger PR, Halter S, Fischbach KF, Stocker RF. Three-dimensional reconstruction of the antennal lobe in Drosophila melanogaster. J Comp Neurol. 1999;405:543–552. [PubMed] [Google Scholar]
- Liu G, Seiler H, Wen A, Zars T, Ito K, Wolf R, Heisenberg M, Liu L. Distinct memory traces for two visual features in the Drosophila brain. Nature. 2006;439:551–556. doi: 10.1038/nature04381. [DOI] [PubMed] [Google Scholar]
- Maimon G, Straw AD, Dickinson MH. Active flight increases the gain of visual motion processing in Drosophila. Nat Neurosci. 2010;13:393–399. doi: 10.1038/nn.2492. [DOI] [PubMed] [Google Scholar]
- Marr D. Early processing of visual information. Philos Trans R Soc Lond B. 1976;275:483–519. doi: 10.1098/rstb.1976.0090. [DOI] [PubMed] [Google Scholar]
- Nordström K, Barnett PD, O’Carroll DC. Insect detection of small targets moving in visual clutter. PLoS Biol. 2006;4:e54. doi: 10.1371/journal.pbio.0040054. [DOI] [PMC free article] [PubMed] [Google Scholar]
- Okamura JY, Strausfeld NJ. Visual system of Calliphorid flies: Motion- and orientation-sensitive visual interneurons supplying dorsal optic glomeruli. J Comp Neurol. 2007;500:189–208. doi: 10.1002/cne.21195. [DOI] [PubMed] [Google Scholar]
- Otsuna H, Ito K. Systematic analysis of the visual projection neurons in Drosophila melanogaster. I. Lobula-specific pathways. J Comp Neurol. 2006;497:928–958. doi: 10.1002/cne.21015. [DOI] [PubMed] [Google Scholar]
- Reiser MB, Dickinson MH. A modular display system for insect behavioral neuroscience. J Neurosci Methods. 2008;167:127–139. doi: 10.1016/j.jneumeth.2007.07.019. [DOI] [PubMed] [Google Scholar]
- Sanes JR, Zipursky SL. Design principles of insect and vertebrate visual systems. Neuron. 2010;66:15–36. doi: 10.1016/j.neuron.2010.01.018. [DOI] [PMC free article] [PubMed] [Google Scholar]
- Schnell B, Joesch M, Forstner F, Raghu SV, Otsuna H, Ito K, Borst A, Reiff DF. Processing of horizontal optic flow in three visual interneurons of the Drosophila brain. J Neurophysiol. 2010;103:1646–1657. doi: 10.1152/jn.00950.2009. [DOI] [PubMed] [Google Scholar]
- Strausfeld NJ. Golgi studies on insect. Part II. The optic lobes of Diptera. Phil Trans R Soc Lond B. 1970;258:175–223. doi: 10.1098/rstb.1970.0033. [DOI] [PubMed] [Google Scholar]
- Strausfeld NJ. Arthropod brains: Evolution, functional elegance, and historical significance. Cambridge: Harvard University Press; 2012. [Google Scholar]
- Strausfeld NJ, Hausen K. The resolution of neural assemblies after cobalt injection into neuropil. Proc R Soc Lond B. 1977;199:463–476. doi: 10.1098/rspb.1977.0154. [DOI] [PubMed] [Google Scholar]
- Strausfeld NJ, Bacon JP. Multimodal convergence in the central nervous system of dipterous insects. Fortschr Zool. 1983;28:47–76. [Google Scholar]
- Strausfeld NJ, Bassemir UK. Cobalt-coupled neurons of a giant fibre system in Diptera. J Neurocytol. 1983;12:971–991. doi: 10.1007/BF01153345. [DOI] [PubMed] [Google Scholar]
- Strausfeld NJ, Lee JK. Neuronal basis for parallel visual processing in the fly. Vis Neurosci. 1991;7:13–33. doi: 10.1017/s0952523800010919. [DOI] [PubMed] [Google Scholar]
- Strausfeld NJ, Gilbert C. Small-field neurons associated with oculomotor control in muscoid flies: cellular organization in the lobula plate. J Comp Neurol. 1992;316:56–71. doi: 10.1002/cne.903160106. [DOI] [PubMed] [Google Scholar]
- Strausfeld NJ, Okamura JY. Visual system of calliphorid flies: Organization of optic glomeruli and their lobula complex efferents. J Comp Neurol. 2007;500:166–188. doi: 10.1002/cne.21196. [DOI] [PubMed] [Google Scholar]
- Strausfeld NJ, Sinakevitch I, Okamura JY. Organization of local interneurons in optic glomeruli of the dipterous visual system and comparisons with the antennal lobes. Dev Neurobiol. 2007;67:1267–1288. doi: 10.1002/dneu.20396. [DOI] [PubMed] [Google Scholar]
- Turner GC, Bazhenov M, Laurent G. Olfactory representations by Drosophila mushroom body neurons. J Neurophysiol. 2008;99:734–746. doi: 10.1152/jn.01283.2007. [DOI] [PubMed] [Google Scholar]
- Vosshall L, Wong A, Axel R. An olfactory sensory map in the fly brain. Cell. 2000;102:147–159. doi: 10.1016/s0092-8674(00)00021-0. [DOI] [PubMed] [Google Scholar]
- Wang Y, Guo HF, Pologruto TA, Hannan F, Hakker I, Svoboda K, Zhong Y. Stereotyped odor-evoked activity in the mushroom body of Drosophila revealed by green fluorescent protein-based Ca2+ imaging. J Neurosci. 2004;24:6507–6514. doi: 10.1523/JNEUROSCI.3727-03.2004. [DOI] [PMC free article] [PubMed] [Google Scholar]
- Wilson RI, Laurent G. Role of GABAergic inhibition in shaping odor-evoked spatiotemporal patterns in the Drosophila antennal lobe. J Neurosci. 2005;25:9069–9079. doi: 10.1523/JNEUROSCI.2070-05.2005. [DOI] [PMC free article] [PubMed] [Google Scholar]
- Wilson RI. Neural and behavioral mechanisms of olfactory perception. Curr Opin Neurobiol. 2008;18:408–412. doi: 10.1016/j.conb.2008.08.015. [DOI] [PMC free article] [PubMed] [Google Scholar]
- Zettler F, Järvilehto M. Active and passive axonal propagation of non-spike signals in the retina of Calliphora. J Comp Physiol. 1973;85:89–104. [Google Scholar]


