

Abstract
Electrical stimulation of neurons in brain slices evokes increases in cytoplasmic Ca2+ in neighboring astrocytes. The present study tests whether similar neuron-to-glial signaling occurs in the isolated rat retina in response to light stimulation. Results demonstrate that Müller cells, the principal retinal glial cells, generate transient increases in Ca2+under constant illumination. A flickering light stimulus increases the occurrence of these Ca2+transients. Antidromic activation of ganglion cell axons also increases the generation of Müller cell Ca2+transients. The increases in Ca2+transients evoked by light and antidromic stimulation are blocked by the purinergic antagonist suramin and by TTX. The addition of adenosine greatly potentiates the response to light, with light ON evoking large Ca2+increases in Müller cells. Suramin, apyrase (an ATP-hydrolyzing enzyme), and TTX substantially reduce the adenosine-potentiated response. NMDA, metabotropic glutamate, GABAB , and muscarinic receptor antagonists, in contrast, are mainly ineffective in blocking the response. Light-evoked Ca2+responses begin in Müller cell processes within the inner plexiform (synaptic) layer of the retina and then spread into cell endfeet at the inner retinal surface. These results represent the first demonstration that Ca2+increases in CNS glia can be evoked by a natural stimulus (light flashes). The results suggest that neuron-to-glia signaling in the retina is mediated by neuronal release of ATP, most likely from amacrine and/or ganglion cells, and that the response is augmented under pathological conditions when adenosine levels increase.
Keywords: calcium, astrocyte, Müller cell, glial cell, retina, ATP, adenosine, light response, ganglion cell
Introduction
A bidirectional dialogue takes place between neurons and glial cells in the CNS. In brain slices, neuron-to-glia signaling has been observed by a number of laboratories (for review, see Newman, 2003b; Schipke and Kettenmann, 2004). Electrical activation of neurons results in Ca2+ increases in astrocytes, a response mediated by neuronal release of glutamate (Porter and McCarthy, 1996; Pasti et al., 1997), GABA (Kang et al., 1998), or acetylcholine (Araque et al., 2002), and activation of metabotropic receptors on glial cells. Glia to neuron signaling has also been observed. Stimulation of astrocytes results in the release of “gliotransmitters,” primarily glutamate, and modulation of the electrical excitability of neighboring neurons (for review, see Volterra et al., 2002; Newman, 2003b; Fellin and Carmignoto, 2004; Newman, 2005). This bidirectional communication between neurons and glia enables glial cells to modulate synaptic transmission and raises the intriguing possibility that glia participate in information processing in the CNS.
Glia-to-neuron signaling also has been observed in the retina. After a rise in Ca2+, glial cells release transmitters that can either facilitate or depress the light-evoked spike activity of ganglion cells, the retinal neurons that project to the brain (Newman and Zahs, 1998). This interaction may be mediated by glial modulation of synaptic transmission onto ganglion cells (Newman, 2004). Retinal glial cells can also inhibit ganglion cells directly, a response mediated by the release of ATP from Müller cells (Newman, 2003a), the principal glial cells of the retina (Newman and Reichenbach, 1996; Newman, 2001a). ATP released from Müller cells is rapidly converted to adenosine by ectoenzymes, resulting in the activation of ganglion cell A1 receptors and to the opening of ganglion cell K+ channels.
Although robust glia-to-neuron communication is observed in the retina, it remains unclear whether the reciprocal neuron-to-glia signaling also occurs. Experimental application of agonists has been shown to evoke Ca2+ increases in retinal glial cells (Newman and Zahs, 1997; Newman, 2001b; Reifel Saltzberg et al., 2003). However, the physiological stimuli capable of activating these cells are not known.
The present study was undertaken to determine whether neurons, when stimulated by light flashes, signal retinal glial cells and elicit increases in glial Ca2+. The results demonstrate that light stimulation evokes Ca2+ increases in retinal Müller cells and indicates that neuron-to-glia signaling is mediated by a light-evoked release of ATP from neurons.
Materials and Methods
Retinal preparations
Experiments were performed on acutely isolated retinas of male Long–Evans rats (175–300 g). Two preparations were used: the whole-mount retina and everted eyecup. One of the two preparations proved technically superior for different experiments, but all results could be reproduced in both preparations. The animals used in this study were treated in accordance with the guidelines of the Institutional Animal Care and Use Committee of the University of Minnesota.
Whole-mount retina
Animals were killed and eyecups were prepared as described previously (Newman and Zahs, 1998). Retinas were gently peeled from the back of the eye so that many retinal pigment epithelium (RPE) cells adhered to the retina. These attached RPE cells permitted the isolated retina to dark adapt and remain responsive to light for several hours, even after exposure to bright illumination. The vitreous humor was removed from retinal pieces by gentle peeling with forceps. Retinas were held in place in a chamber with nylon threads attached to a platinum ring and superfused at 2–3 ml/min with bicarbonate-buffered Ringer’s solution at 24°C.
Everted eyecup
The back half of the eye was everted over a dome and held in place by an overlying plastic barrier with a hole cut into it, as described previously (Newman and Bartosch, 1999). Excess vitreous humor was then removed by suction. Eyecups were superfused at 2–3 ml/min with bicarbonate-buffered Ringer’s solution at 24°C and remained responsive to light for 4–6 h.
Calcium imaging
Retinas were incubated in the Ca2+-indicator dye Fluo-4 AM (31 μg/ml) and pluronic acid (2.6 mg/ml) for 30 min at room temperature, as described previously (Newman, 2001b). Whole-mount retinas were incubated after removal of the vitreous humor. Eyecups were incubated after they were mounted in the superfusion chamber, and the vitreous was removed. Dye incubation filled astrocytes and Müller cells efficiently. Ganglion cell somata and axons were labeled to a lesser extent and did not display Ca2+ increases in response to light stimulation. Calcium indicator dye fluorescence was monitored with 488 nm excitation, a 500 nm long-pass barrier filter, and confocal microscopy (Odyssey scanner; Noran, Middleton, WI).
Unaveraged confocal images were acquired at 30 Hz when characterizing the time course of Ca2+ transients generated in Müller cells. Time-averaged images, which had reduced noise, were acquired at 1.25 Hz and were used when characterizing the Ca2+ responses evoked by light stimulation. Unless otherwise noted, the focal plane of acquired images was between 0 and 15 μm below the vitreal surface of the retina. ΔF/F scales in the figures represent the magnitude of Ca2+ changes within Müller cells.
Light stimulation
The excitation illumination of the confocal scanner also served as the light stimulus used to evoke neuronal activity. Two stimulation protocols were used. In the flickering light protocol, the illumination was held constant at a low intensity during control periods and alternated between low and high intensities (0.8 s period, 50% duty cycle) during stimulation periods (Fig. 1, bottom trace). In the light ON protocol, the illumination was stepped from fully off to a constant, medium intensity (see Fig. 5C, bottom trace). The relative intensities of the low, medium, and high stimuli were 1:7.1:14.1.
Figure 1.

Calcium transients in Müller cells. A–C show Ca 2+fluorescence ratio images of the retina that have been thresholded. The red and yellow areas indicate retinal regions in which Ca 2+has increased transiently during the acquisition period. The red areas are regions < 12 μm 2. The yellow areas exceed this size and are scored as Ca 2+transients within Müller cells. Images in A–C were acquired before, during, and after a flickering light stimulus, respectively. The light stimulus protocol, a 16 s episode of flickering light superimposed on a dim background light, is shown at the bottom. The dashed line represents 0 intensity. The gray bars indicate the timing of the three acquisition periods, and the arrows point to the corresponding images (see Materials and Methods for details). Müller cell Ca 2+transients are shown in supplemental movie 1 (available at www.jneurosci.org as supplemental material).
Figure 5.

Adenosine potentiates the light-evoked Müller cell Ca 2+increase (100 μM adenosine in superfusate). A, B, Ca 2+fluorescence images within the ganglion cell layer. During the first 0.8 s after light ON (A), Ca 2+remains low within Müller cells. At 3.1 s after light ON (B), Müller cell Ca 2+has risen substantially. Müller cell processes surrounding ganglion cell somata (dark circles) are visible. Scale bar, 20 μm. C, Time course of Ca 2+rise in Müller cells for the experiment illustrated in A and B. The light stimulus is shown at the bottom. The dashed line represents 0 intensity. This trial is shown in supplemental movie 2 (available at www.jneurosci.org as supplemental material).
Antidromic activation of ganglion cell axons
Axons were stimulated with 1 ms, −200 to −400 μA current pulses passed through a unipolar electrode (Ringer’s-filled pipette, ~10 μm tip diameter). The stimulating electrode was positioned above bundles of axons near the optic disk.
Quantification of Ca2+ transients in Müller cells
Flickering light increased the generation of Ca2+ transients in Müller cells. The frequency of these transients was calculated using image-processing functions in MetaMorph (Universal Imaging Corporation, Downingtown, PA). A series of Ca2+ fluorescence images was acquired as a stack and was partitioned into three time periods (Fig. 1, bottom). Images within each period were merged, retaining the maximal value at each pixel. The resulting “maximum” image was divided by the mean of the images in that time period. This normalized image was thresholded, highlighting regions of the image in which Ca2+ had increased transiently sometime during the time period (Fig. 1, red and yellow regions). The same threshold level was used in all experiments and was set so that it was slightly above the Ca2+fluorescence noise. The integrated morphometry analysis function of MetaMorph was then used to count the number of thresholded regions >12 μm2 in area (Fig. 1, yellow regions).
The increase in the number of Ca2+ transients evoked by a flickering light stimulus was calculated as follows:
where transientsflicker, transientsbefore, and transientsafter are the number of transients that occurred during the three measurement periods (during, before, and after presentation) of the flickering light stimulus.
Ganglion cell action potential recording
Action potentials were recorded extracellularly with Ringer’s-filled pipettes (2–3 μm tip diameter) positioned within the ganglion cell layer (GCL). Recordings were bandpass filtered (300–1800 Hz) with a MultiClamp 700A amplifier (Molecular Devices, Union City, CA).
Solutions and statistics
The bicarbonate-buffered Ringer’s solution contained the following (in mm): 111.0 NaCl, 3.0 KCl, 2.0 CaCl2, 1.0 MgSO4, 0.5 NaH2PO4, 15.0 dextrose, and 32 NaHCO3. Reagents were purchased from Sigma (St. Louis, MO) except for (±)-1-aminocyclopentane-trans-1,3-dicarboxylic acid (trans-ACPD), (RS)-3-(2-carboxypiperazin-4-yl)-propyl-1-phosphonic acid (CPP), (RS)-a-cyclopropyl-4-phosphonophenylglycine (CPPG), (RS)-a-ethyl-4-carboxyphenylglycine (E4CPG), L-(+)-2-amino-4-phosphonobutyric acid (L-AP-4), 2,3-dioxo-6-nitro-1,2,3,4-tetrahydro-benzo[f]quinoxaline-7-sulfonamide (NBQX), 1-(6-amino-9H-purin-9-yl)-1-deoxy-N-ethyl-b-D-ribofuranuronamide 5′-N-ethylcarboxamidoadenosine (NECA), N-(4-acetylphenyl)-2-[4-(2,3,6,7-tetrahydro-2,6-dioxo-1,3-dipropyl-1H-purin-8-yl)phenoxy]acetamide (MRS 1706), 8-cyclopentyl-1,3-dipropylxanthine (DPCPX), 4-(2-[7-amino-2-(2-furyl)[1,2,4]triazolo[2,3-a][1,3,5]triazin-5-ylamino]ethyl)phenol(ZM241385),andscopolamine,which were purchased from Tocris Cookson (Ellisville, MO). All drugs were added directly to the superfusate solutions.
Numerical values are given as mean ± SEM with n in parentheses, except when otherwise noted. Statistical significance was determined by the single-tailed Student’s t test.
Results
Two types of macroglial cells are present in the mammalian retina: astrocytes and Müller cells (Newman, 2001a). Astrocytes are confined mainly to the nerve fiber layer at the inner (vitreal) border of the retina. Müller cells, the principal retinal glial cells, extend from the inner border of the retina to the photoreceptor layer in the outer retina.
Calcium transients in Müller cells
Transient increases in Ca2+ were observed in Müller cells in retinas under constant illumination (Fig. 2) (supplemental movie 1, available at www.jneurosci.org as supplemental material). The time course of the Ca2+ transients varied in different cells. For some transients, Ca2+rose rapidly from a flat baseline. In others, the rapid rise of Ca2+ was preceded by a smaller, slow Ca2+ increase (Fig. 2, arrows), suggesting that a small Ca2+ increase can trigger a larger Ca2+transient, perhaps through activation of Ca2+-induced Ca2+ release.
Figure 2.

Calcium transients in individual Müller cells in retinas under constant illumination. In some Müller cells, Ca 2+rose rapidly from a flat baseline. In others, the rapid rise in Ca 2+was preceded by a smaller, slow Ca 2+increase (arrows). The four traces were obtained in different trials. Calcium fluorescence images were acquired at 30 Hz.
The duration of the Ca2+transients ranged from 2.5 to 6 s and averaged 3.84 ± 0.82 s (mean ± SD; n = 37). The transients had a mean rise time of 0.89 ± 0.39 s (time from 10 to 90% of peak amplitude) and a decay time of 2.01 ± 0.77 s (time from 90 to 10% of peak amplitude). The amplitude of the transients ranged from 14 to 140% ΔF/F and averaged 49 ± 18% ΔF/F.
The frequency of Ca2+transient generation varied in different preparations and depended on the age of the preparation, decreasing as preparations aged. Calcium transients occurred at a rate of 1–15 transients/Müller cell/1000 s and averaged 4.6 transients/cell/1000 s. During single trials lasting 56 s, Ca2+transients were generated in 9.5 ± 2.1% (n = 12) of Müller cells imaged.
During a Ca2+ transient, Ca2+ increases were observed in Müller cell processes within the ganglion cell layer and inner plexiform layer (IPL) and in cell endfeet at the vitreal surface of the retina. Calcium increases were not seen in cell somata or in processes in deeper retinal layers. The Ca2+ transients occurred in individual cells and did not propagate from one Müller cell to another. Calcium transients were not seen in astrocytes.
Light-evoked increase in Ca2+ transients
The frequency of Müller cell Ca2+ transients increased when the retina was stimulated with a flickering light (Figs. 1, 3A), which is a particularly effective stimulus for activating neurons in the inner retina (Miller, 2001; Wassle, 2004). In the experiment illustrated in Figure 1, 33 transients occurred during the control period before stimulation (Fig. 1A), 55 transients occurred while the retina was stimulated with a flickering light (Fig. 1B), and 31 transients occurred in a second control period after cessation of the light stimulus (Fig. 1C). On average, the generation of Ca2+ transients increased 28.1 ± 5.4% (n = 10; p < 0.0005) when the retina was stimulated by flickering light. Light-evoked Ca2+ increases were not observed in astrocytes.
Figure 3.

Light-evoked Ca 2+ increases in Müller cells. A, Calcium fluorescence measured simultaneously in eight Müller cells. Calcium transients are more likely to be generated during the flickering light stimulus. B, Mean Ca 2+fluorescence increase evoked by a flickering light. The response represents transient Ca 2+increases averaged over 84 trials. The Ca 2+fluorescence from ~260 Müller cells was monitored in each trial. A linear downward slope of the trace, caused by dye bleaching, has been subtracted. The light stimulus is shown at the bottom in both A and B.
The time course of the light-evoked Müller cell Ca2+response was determined by averaging Ca2+ responses from 84 experiments. Calcium signals from all Müller cells within the field of view in each experiment (~260 cells) were included in the average. The mean light-evoked Ca2+ increase is illustrated in Figure 3B and shows that Ca2+transients are most likely to be generated in Müller cells during the first 2 s after the onset of a flickering light. However, the rate of Ca2+ transient generation remains raised for the duration of the flickering stimulus. The rise time, decay time, and amplitude of the Ca2+ transients evoked by a light stimulus did not differ significantly from Ca2+ transients observed under constant illumination.
Pharmacology of Ca2+ transient increase
Agonists
ATP has been shown previously to be an effective glial cell stimulus, evoking large Ca2+ increases in Müller cells (Newman and Zahs, 1997; Newman, 2001b; Reifel Saltzberg et al., 2003) as well as astrocytes (Finkbeiner, 1993; Bowser and Khakh, 2004). A low concentration of ATP proved to be effective in increasing the rate of Ca2+transients in Müller cells. Under steady illumination, 0.1 μm ATP increased the occurrence of Ca2+ transients 17.9 ± 11.8% (n = 10) (Fig. 4A). This is nearly as large as the 28% increase seen in response to a flickering light. Both 0.3 and 1.0 μm ATP increased the occurrence of Ca2+ transients to a greater extent, 56.5 ± 19.6% (n = 16) and 384 ± 58% (n = 4), respectively. Application of ATP increased Ca2+ in astrocytes as well as Müller cells. In astrocytes, however, sustained Ca2+ increases, rather than transient responses, were observed.
Figure 4.

Effect of agonists and antagonists on Ca 2+ transients in Müller cells. A, Both a flickering light stimulus and addition of ATP to the superfusate evoke increases in the generation of Ca 2+ transients. B, A flickering light evokes an increase in the generation of Ca 2+ transients (light stimulation; control). The response is blocked by 100 μM suramin and 200 nM TTX. Antidromic activation of ganglion cell axons evokes an increase in the occurrence of Ca 2+ transients (antidromic stimulation; control). This response is also blocked by 30 μM suramin and 200 nM TTX. Asterisks indicate a significant difference from controls (*p < 0.05). The flickering light protocol used in A and B is illustrated in Figure 1.
The mean amplitude of Müller cell Ca2+transients evoked by ATP (1 μm) was 65 ± 32 ΔF/F, somewhat larger than the amplitude of transients measured in the absence of ATP ( p < 0.005). However, the rise and the decay times of ATP-evoked transients did not differ significantly from those measured in control preparations.
Antagonists
The effectiveness of ATP in increasing the occurrence of Müller cell Ca2+transients suggests that ATP, or a related agonist, might be responsible for neuron-to-glia signaling and for eliciting light-evoked increases in Müller cell Ca2+ transients. This was tested by blocking ATP signaling with the purinergic antagonist suramin. Suramin proved effective in reducing the light-evoked Müller cell response. Suramin (100 μm) diminished the light-evoked increase in Ca2+ transients to 2.0 ± 10.7% (n = 11) of control (Fig. 4B). Additional pharmacological tests, described below, support the conclusion that neuron-to-glia signaling is mediated by ATP.
The effect of suramin was not caused by a reduction of light-evoked neuronal activity. In seven of nine ganglion cells monitored, light-evoked spiking was either unchanged or increased with the addition of 100 μm suramin, whereas in the remaining two cells, suramin reduced spiking only slightly. Suramin also increased the rate of spontaneous spiking in three of the nine ganglion cells.
The Na+ channel blocker tetrodotoxin (TTX) was also effective in blocking the light-evoked Müller cell response. TTX (200 nm) reduced the light-evoked increase in the generation of Ca2+ transients to 2.4 ± 5.9% (n = 12) of control (Fig. 4B).
Calcium increases evoked by antidromic activation of ganglion cells
TTX block of the light-evoked increase in Müller cell Ca2+ transients suggests that amacrine cells and/or ganglion cells, the only neurons in the retina that generate action potentials, are responsible for neuron-to-glia signaling. The involvement of ganglion cells in generating the Müller cell response was tested by anti-dromically stimulating these cells. Bundles of ganglion cell axons were stimulated for 16 s at 50 Hz. Ganglion cell activation produced a 49.6 ± 11.7% (n = 7) increase in the generation of Ca2+ transients in Müller cells, greater than the increase evoked by a flickering light (Fig. 4B). The increased Ca2+signaling produced by antidromic activation of ganglion cells was reduced to 5.7 ± 11.4% (n = 15) by 30 μm suramin, suggesting again that neuron to glia signaling is mediated by ATP release. The increased response produced by antidromic activation was reduced to 2.3 ± 9.9% (n = 7) by TTX, demonstrating that the increased Müller cell Ca2+ signaling was not attributable to direct stimulation of the glial cells. Antidromic stimulation did not evoke Ca2+ increases in astrocytes.
Adenosine potentiation of light-evoked Ca2+ increases
Adenosine has been reported previously to potentiate ATP-evoked Ca2+ increases in cultured astrocytes by acting synergistically with ATP in the glial cells (Alloisio et al., 2004; Nishizaki, 2004). Adenosine agonists proved effective in potentiating light-evoked Ca2+ increases in Müller cells as well. In the presence of 100 μm adenosine or 2 μm NECA (a nonselective adenosine agonist), a light stimulus evoked large Ca2+increases in Müller cells (Fig. 5) (supplemental movie 2, available at www.jneurosci.org as supplemental material). Light ON, rather than a flickering light, was sufficient to produce the response. Müller cell Ca2+ levels remained low for 1–2 s after light ON (Fig. 5A). During the next several seconds, however, Ca2+ levels increased dramatically (Fig. 5B), peaking at ~3 s after light ON (Fig. 5C). Light-evoked Ca2+increases were not observed in astrocytes in the presence of adenosine agonists.
Adenosine potentiation of light-evoked Müller cell Ca2+ responses was not a result of an adenosine-mediated increase in neuronal activity. In the presence of 100 μm adenosine, light-evoked ganglion cell spike activity was reduced. Of the six cells monitored, all six showed a decrease in light-evoked spiking in the presence of adenosine, and five showed a reduction in spontaneous activity. Similar results have been reported previously (Blazynski and Perez, 1991). This finding indicates that adenosine is acting synergistically with ATP at retinal glial cells, rather than acting by potentiating neuronal activity.
Adenosine agonists most likely potentiate Ca2+ responses by stimulating Müller cell adenosine receptors. The effect of adenosine receptor antagonists on the adenosine-potentiated Ca2+ response was assessed to determine the receptor type mediating the potentiation. In the presence of 2 μm NECA, the A2B receptor antagonist MRS 1706 (1 μm) reduced the light-evoked Müller cell response to 3.6 ± 1.2% (n = 6) of control. The A1 and A2A antagonists DPCPX and ZM 241385 were less effective in reducing the response. DPCPX (10 nm) reduced the response to 18.3 ± 2.6% (n = 5), whereas ZM 241385 (1 μm) reduced the response to 21.5 ± 3.8% (n = 5). The results are somewhat difficult to interpret, because the antagonists are not completely selective for specific receptor subtypes. However, the results suggest that adenosine potentiation of Müller cell Ca2+responses is mediated primarily by A2B receptors, in agreement with previous findings (Alloisio et al., 2004).
The light-evoked, adenosine-potentiated Müller cell response was eliminated by the addition of a combination of 100 μm l-AP-4 and 10 μm NBQX, which block synaptic transmission from photoreceptors to ON and OFF bipolar cells, respectively. The addition of l-AP-4/NBQX reduced the Müller cell response to 0.9 ± 0.2% (n = 2) of control. This result demonstrates that the Müller cell response is driven by light-evoked neuronal activity and is not attributable to an inherent light sensitivity of the glial cells.
Propagated Ca2+ waves
In the presence of an adenosine agonist, light stimulation sometimes evoked a delayed Ca2+ response in Müller cells after the large, short-latency response (Fig. 6) (supplemental movie 3, available at www.jneurosci.org as supplemental material). This delayed response had a latency of 7.5–14 s (mean, 11.4 s) and was observed infrequently (6 of 63 experiments). The remarkable feature of this response was that it originated in only one or two Müller cells and then, during the next several seconds, propagated into neighboring Müller cells. Propagated waves were never observed in the absence of a light stimulus or without adenosine potentiation.
Figure 6.

Light-evoked, propagated Ca 2+wave in Müller cells (100 μM adenosine in superfusate). Calcium florescence images in the ganglion cell layer are shown. Within the first seconds after light ON, there is a large Ca 2+increase in all Müller cells (data not shown). By 12.5 s after light ON, this Ca 2+increase has decayed (12.5 s). At 14.2 s, a secondary rise in Ca 2+occurs in two Müller cells (short arrows). This Ca 2+increase propagates into adjacent Müller cells at 15.9 and 18.4 s (long arrows). Numbers indicate elapsed time after light ON. Scale bar, 10 μm. This trial is shown in supplemental movie 3 (available at www.jneurosci.org as supplemental material).
Retinal location of Ca2+ increases
Light-evoked, adenosine-potentiated Müller cell Ca2+ responses were monitored in different retinal layers. The response originated in Müller cell processes within the inner and middle regions of the IPL. It then spread distally into processes within the outer IPL and proximally into processes in the GCL and into cell endfeet at the inner surface of the retina. Light-evoked Ca2+ increases were never observed in Müller cell somata in the inner nuclear layer.
This pattern of Müller cell Ca2+ responses was monitored in individual trials by imaging a region of the everted eyecup, where many retinal layers could be visualized in a single image (Fig. 7A). Oblique confocal sections were made by focusing on a sloping portion of the eyecup. In the first 1–2 s after light ON, no Ca2+ increases were seen (Fig. 7B). At 2.4 s, however, Ca2+ increases were observed in the inner and middle regions of the IPL and in the GCL (Fig. 7C). At 3.2 s, Ca2+increases had spread proximally into Müller cell endfeet at the surface of the retina and distally into the INL (Fig. 7D). It is not clear whether the spread of the Ca2+ response within Müller cells represents an intracel-lular propagated wave or simply a sequential activation of different Müller cell regions by external stimuli (Keirstead and Miller, 1995; Reifel Saltzberg et al., 2003).
Figure 7.
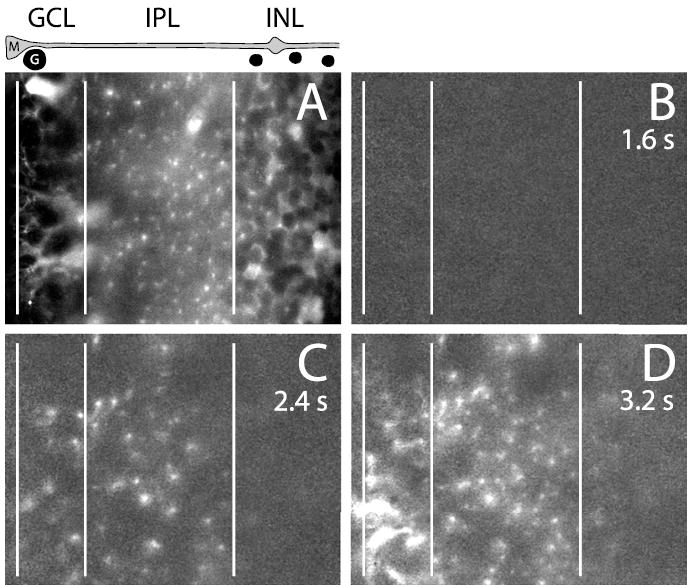
Light-evoked Müller cell Ca 2+increases within different retinal layers (5 μM NECA in superfusate). The images are from an oblique optical section through an everted eyecup and show retinal layers within the inner half of the retina. The vertical lines indicate boundaries between retinal layers. INL, Inner nuclear layer. The drawing above A shows the location of a Müller cell (M), a ganglion cell soma (G), and neuronal somata within the INL (unlabeled). A, Ca 2+fluorescence image in the unstimulated retina. Müller cells are selectively labeled. Müller cell processes surrounding ganglion cell somata in the GCL, Müller cell stalk processes in the IPL, and Müller cell processes surrounding neuronal somata in the INL are shown. B–D, Ca 2+fluorescence ratio images showing the change in Ca 2+after light ON. At 1.6 s after light ON (B), no increase in Ca 2+is seen. At 2.4 s (C), Ca 2+rises in Müller cell processes within the inner and middle IPL and, to a lesser extent, in the GCL. At 3.2 s (D), Müller cell Ca 2+increases have spread throughout the GCL and into Müller cell endfeet at the inner retinal surface (far left). Müller cell Ca 2+increases also spread throughout the IPL and into the inner portion of the INL.
Intensity–response relationship
The magnitude of the Müller cell Ca2+ response in the presence of adenosine agonists varied as a function of the intensity of the light stimulus. In the presence of 2 μm NECA, larger light-evoked Ca2+ responses were observed as the intensity of the stimulus increased. Over the range of intensities tested, the log intensity versus Ca2+ response relationship had a sigmoidal form (Fig. 8), as does the log intensity versus response relationship of retinal neurons.
Figure 8.
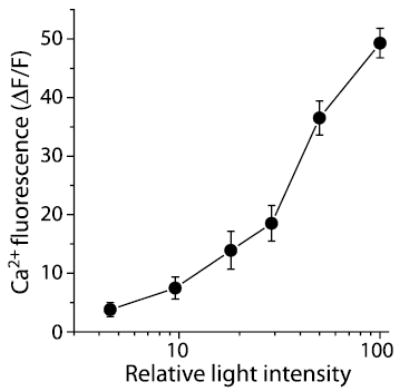
Intensity–response relationship of the light-evoked Ca 2+increase in Müller cells. The peak Ca 2+ fluorescence amplitude is plotted as a function of the intensity of the light stimulus (2 μM NECA in superfusate). Mean amplitude ±SEM is shown; n = 7.
Pharmacology of adenosine-potentiated Ca2+ increases
Agonists
ATP was effective in evoking large Ca2+ increases in Müller cells in the presence of adenosine or NECA. The addition of 0.1, 0.3, and 1.0 μm ATP evoked Ca2+ increases of 7.0 ± 3.9% (n = 5), 39.8 ± 7.7% (n = 5), and 157.3 ± 18.4% (n = 6), the magnitude of the Ca2+ increase produced by a light stimulus (Fig. 9A). In contrast, metabotropic glutamate receptors, which mediate neuron-to-glia signaling in brain slices (Schipke and Kettenmann, 2004), play little role in neuron–glia signaling in the retina. The group I/II metabotropic glutamate agonist trans-ACPD was ineffective in evoking a Müller cell Ca2+ response. The addition of 200 and 600 μm trans-ACPD evoked Ca2+ increases only 1.7 ±1.1% (n = 5) and 2.7 ±1.4% (n = 6), the magnitude of the Ca2+ increase produced by a light stimulus.
Figure 9.
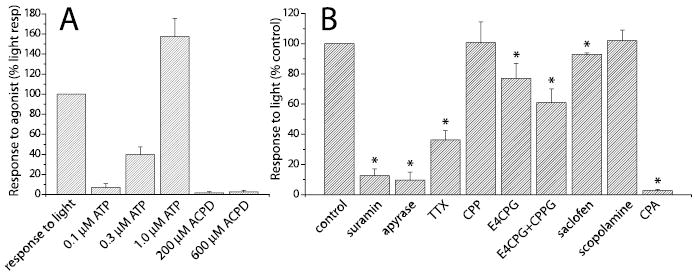
Effect of agonists and antagonists on Müller cell Ca 2+ increases potentiated by NECA (adenosine agonist) (2 μM NECA in all solutions). A, Effect of agonists. The addition of ATP but not trans-ACPD (mGluR agonist) evokes Müller cell Ca 2+ increases. Control response to light is shown at the left. B, Effect of antagonists. The addition of suramin (30 μM; purinergic antagonist) and apyrase (100 U/ml; ATP-hydrolyzing enzyme) blocks the light-evoked Ca 2+response. TTX (1 μM) reduces the light response. CPP (10 μM; NMDA antagonist) and scopolamine (10 μM; muscarinic antagonist) have no effect on the light response. E4CPG (200 μM; group I/II mGluR antagonist), E4CPG plus CPPG (2 μM; group III mGluR antagonist), and saclofen (200 μm; GABAB antagonist) have little effect on the light response. Cyclopiazonic acid (CPA; 30μM), which depletes internal Ca 2+ stores, abolishes the light response. Control response to light ON is shown at the left. Asterisks indicate significant difference from controls ( p < 0.05).
Antagonists
An ATP-mediated neuron-to-glia signaling mechanism is supported by experiments using receptor antagonists (Fig. 9B). The purinergic antagonist suramin (30 μm) reduced the light-evoked response to 12.6 ± 4.6% (n = 10) of control, whereas apyrase (100 U/ml), which selectively hydrolyzes ATP, reduced the response to 9.6 ± 5.4% (n = 4) of control. TTX reduced the light-evoked Müller cell response to 36.3 ± 6.1% (n = 13) of control.
Neuronal release of glutamate, GABA, and acetylcholine has been shown to elicit glial Ca2+increases in brain slices by activating metabotropic glial receptors (Schipke and Kettenmann, 2004). However, these transmitters do not contribute substantially to neuron–glia signaling in the retina. Antagonists to these transmitters were mainly ineffective in blocking the light-evoked Müller cell Ca2+response (Fig. 9B). In the presence of the NMDA antagonist CPP (10 μm), the group I/II metabotropic glutamate antagonist E4CPG (200 μm) and E4CPG plus the group III metabotropic glutamate antagonist CPPG (2 μm), light-evoked responses were 101 ± 14% (n = 4), 77 ± 10% (n = 6), and 61 ± 9% (n = 5) of control, respectively. GABA and ACh antagonists were similarly ineffective. In the presence of the GABAB antagonist saclofen (200 μm) and the muscarinic antagonist scopolamine (10 μm), light-evoked responses were 93 ± 1% (n = 4) and 102 ± 7% (n = 6) of control, respectively.
The role of ganglion cells in generating the adenosine-potentiated Müller cell response was tested by stimulating ganglion cells. Antidromic activation of ganglion cell axons resulted in small increases in Müller cell Ca2+ in the presence of 2 μm NECA. Ganglion cell activation evoked Ca2+responses that were 29.0 ± 4.3% (n = 7), the magnitude of responses produced by light stimulation. The addition of 100 μm suramin reduced these responses to 3.9 ± 3.9% (n = 3) of control. Responses were completely blocked by 200 nm TTX (response amplitude, 0.3 ± 0.3% of control; n = 4). In some preparations, antidromic stimulation failed to evoke Müller cell Ca2+ increases.
Cyclopiazonic acid (30 μm), which depletes internal Ca2+ stores, nearly abolished the light-evoked, NECA-potentiated Müller cell Ca2+ response (Fig. 9B) (2.7 ± 0.9% of control; n = 4). Cyclopiazonic acid also abolished Müller cell Ca2+ transients in preparations not potentiated by an adenosine agonist (1.0 ± 1.0% of control; n = 3). Calcium transients observed under both constant and flickering illumination were blocked. These results suggest that Ca2+responses in Müller cells are generated by Ca2+ release from internal stores.
Müller cell depolarization
Light-evoked neuronal activity elicits slow depolarizations in Müller cells (Karwoski and Proenza, 1977; Karwoski and Proenza, 1980). These depolarizations are evoked by K+ release from neurons and are small in amplitude, ~0.5–2 mV. Experiments were conducted to determine whether K+-mediated depolarization contributes to the light-evoked Ca2+ response observed in Müller cells. Müller cell depolarization was blocked by addition of Ba2+, which, at low concentration, selectively blocks inwardly rectifying K+channels. In the presence of 100 μm Ba2+, which blocks >90% of Müller cell K+ conductance (Newman, 1989, 1993), the amplitude of NECA-potentiated, light-evoked Müller cell Ca2+ responses was 97.0 ± 3.3% (n = 6) of control, not significantly different from responses in the absence of Ba2+. The results demonstrate that K+-mediated depolarization does not contribute significantly to the generation of Müller cell Ca2+ responses.
Discussion
Light-evoked glial Ca2+ increases
The results of this study demonstrate that a natural stimulus, light flashes, can evoke Ca2+ increases in glial cells. A flickering light evokes significant increases in the generation of Ca2+ transients in Müller cells. In the presence of adenosine, a single light flash can evoke substantially larger increases in Müller cell Ca2+. These results represent the first demonstration that a natural stimulus can evoke Ca2+ increases in CNS glial cells.
Under constant illumination, Müller cell Ca2+ transients occur at an average rate of 4.6 transients/cell/1000 s. Similar Ca2+ transients have been observed in astrocytes in unstimulated brain slices (Parri et al., 2001; Aguado et al., 2002; Nett et al., 2002) as well as in the unstimulated cortex in vivo (Hirase et al., 2004). Astrocyte Ca2+ transients in vivo occur at an average rate of 0.22 transients/cell/1000 s (Hirase et al., 2004), a somewhat lower frequency than that observed in Müller cells. Calcium transients in Müller cells and astrocytes appear to be a naturally occurring glial signal.
In control superfusate as well as in the presence of adenosine, light-evoked Ca2+increases were observed in Müller cells but not in astrocytes. This contrasts with findings in brain slices, in which neuron-evoked Ca2+ increases are observed in astrocytes (Schipke and Kettenmann, 2004). However, the present results are not surprising, because Müller cells function as astrocytes in the retina (Newman and Reichenbach, 1996). Müller cells surround neuronal somata, dendrites, and synapses in the retina. In contrast, astrocytes primarily contact ganglion cell axons and are not associated with retinal synapses. They are too distant from the synaptic layers of the retina to respond to light-evoked release of neurotransmitters.
Calcium imaging in different retinal layers demonstrates that neuron-to-glia signaling occurs primarily within the inner plexiform layer, the principal synaptic layer of the retina. In response to light ON, Ca2+ increases begin within the inner and middle portions of the inner plexiform layer, where neurons responding to light ON are located.
ATP and neuron-to-glia signaling
The results suggest that neuron-to-glia signaling in the retina is mediated by ATP release from neurons and activation of glial purinergic receptors. The addition of ATP in both control and adenosine-potentiated preparations evoked Müller cell Ca2+ increases similar to those elicited by light stimulation. In addition, the purinergic antagonist suramin effectively blocked light-evoked glial Ca2+ increases and apyrase, an ectoenzyme that selectively hydrolyzes ATP, blocked adenosine-potentiated responses.
In contrast, glutamate does not play a significant role in neuron–glial signaling in the retina. In the brain, glutamatergic signaling onto glia is mediated primarily by glial mGluRs (Schipke and Kettenmann, 2004). In the present study, mGluR agonists did not raise glial Ca2+, and mGluR antagonists had little effect on light-evoked glial responses.
Light-evoked glial Ca2+ increases were substantially reduced by TTX, suggesting that neuron-to-glia signaling is mediated by amacrine or ganglion cells, the two types of retinal neurons that generate action potentials. Amacrine cells are believed to release ATP (Santos et al., 1999). The cholinergic starburst amacrine is a likely candidate to mediate neuron–glia signaling, because it may corelease ATP along with acetylcholine (Neal and Cunningham, 1994). [TTX may also act on retinal bipolar cells, because they express TTX-sensitive Na+ channels (Zenisek et al., 2001).]
In addition to amacrine cells, ganglion cells may also release ATP and signal to glia. Antidromic activation of ganglion cells results in Müller cell Ca2+ increases, a response blocked by suramin. Although ganglion cell axons do not synapse within the retina, nonsynaptic release of ATP from neurons has been described previously (Fields and Stevens, 2000; Stevens and Fields, 2000).
However, the antidromic stimulation experiments can be interpreted in other ways. A small fraction of mammalian optic nerve axons are efferent fibers that synapse within the retina (Mikkelsen, 1992) and could activate Müller cells. Antidromic activation of ganglion cells could also result in Müller cell stimulation by depolarizing amacrine cells, because gap junctional coupling between ganglion cells and amacrine cells has been reported previously (Xin and Bloomfield, 1997; Wright and Vaney, 2004).
The results of this study provide strong, but not conclusive, evidence that neuron-to-glia signaling is mediated by ATP release from neurons. As an alternate hypothesis, retinal neurons could release a nonpurinergic transmitter that activates glia, causing a Ca2+-independent release of ATP from the glial cells. Released ATP could then act in an autocrine manner, evoking a glial Ca2+ increase.
Although neuron-to-glia signaling in the brain can be mediated by ATP (Bowser and Khakh, 2004), GABA (Kang et al., 1998), or acetylcholine (Araque et al., 2002), glutamate appears to be the principal neuron to glia transmitter in the brain (Schipke and Kettenmann, 2004). In contrast, in the retina, glutamate plays little, if any, role in neuron-to-glia signaling while ATP most likely mediates the response. It is unclear what accounts for this difference in signaling between the brain and the retina. One possible reason is that glutamate is tonically released from retinal neurons (Miller, 2001) and thus may not be well suited to function as the transmitter mediating neuron–glial communication.
Adenosine potentiation of Ca2+ responses
Light stimulation in the presence of adenosine or the adenosine agonist NECA elicits much larger Müller cell Ca2+increases than those seen in control superfusate. This observation suggests that neuron-to-glia signaling in the retina is augmented under pathological conditions, when adenosine levels can rise significantly (Cunha, 2001). During cerebral ischemia, for instance, adenosine concentration can increase up to 85-fold above basal levels (Phillis et al., 1996; Latini et al., 1999; Parkinson et al., 2000). In the retina, hypoxia produces a 300% increase in extracellular adenosine levels (Ribelayga and Mangel, 2005). Even under physiological conditions, there are circadian and light-dependent variations in retinal adenosine levels. Adenosine concentration is highest at night and in the dark (Ribelayga and Mangel, 2005). Experiments in the present study were conducted during the day and in light-adapted retinas, in which adenosine levels and, thus, neuron-to-glia signaling would be expected to be minimum.
Significance of neuron-to-glia signaling
Bidirectional communication between neurons and glial cells has been demonstrated previously in brain slices (for review, see Fellin and Carmignoto, 2004; Newman, 2005). These interactions permit glial cells to modulate synaptic transmission and to directly alter the excitability of brain neurons. We demonstrated previously that Müller cells can modulate the excitability of neurons in the retina (Newman and Zahs, 1998; Newman, 2003a). The present study provides evidence that the reciprocal interaction, neuron-to-glia signaling, also occurs. The existence of two-way signaling between neurons and glia in the retina suggests that glia play an active role in modulating neuronal behavior in the retina, as they do in the brain.
Many questions concerning neuron–glia interactions in the retina remain to be addressed. This study demonstrates that neuron-to-glia signaling occurs in the isolated retina. It must be confirmed that signaling also occurs in vivo. In addition, several predictions arise from this study. First, the results suggest that amacrine cells and perhaps ganglion cell dendrites release ATP. Second, adenosine potentiation of neuron-to-glia signaling implies that signaling is augmented under pathological conditions. Finally, the existence of bidirectional signaling suggests that retinal Müller cells influence the light-evoked activity of retinal neurons in vivo. These predictions await future tests.
Acknowledgments
This work was supported by National Institutes of Health Grant EY004077. I thank P. Ceelen for technical assistance and J. I. Gepner, M. Metea, and K. R. Zahs for helpful discussions.
References
- Aguado F, Espinosa-Parrilla JF, Carmona MA, Soriano E. Neuronal activity regulates correlated network properties of spontaneous calcium transients in astrocytes in situ. J Neurosci. 2002;22:9430–9444. doi: 10.1523/JNEUROSCI.22-21-09430.2002. [DOI] [PMC free article] [PubMed] [Google Scholar]
- Alloisio S, Cugnoli C, Ferroni S, Nobile M. Differential modulation of ATP-induced calcium signalling by A1 and A2 adenosine receptors in cultured cortical astrocytes. Br J Pharmacol. 2004;141:935–942. doi: 10.1038/sj.bjp.0705707. [DOI] [PMC free article] [PubMed] [Google Scholar]
- Araque A, Martin ED, Perea G, Arellano JI, Buno W. Synaptically released acetylcholine evokes Ca 2+ elevations in astrocytes in hippocampal slices. J Neurosci. 2002;22:2443–2450. doi: 10.1523/JNEUROSCI.22-07-02443.2002. [DOI] [PMC free article] [PubMed] [Google Scholar]
- Blazynski C, Perez MT. Adenosine in vertebrate retina: localization, receptor characterization, and function. Cell Mol Neurobiol. 1991;11:463–484. doi: 10.1007/BF00734810. [DOI] [PubMed] [Google Scholar]
- Bowser DN, Khakh BS. ATP excites interneurons and astrocytes to increase synaptic inhibition in neuronal networks. J Neurosci. 2004;24:8606–8620. doi: 10.1523/JNEUROSCI.2660-04.2004. [DOI] [PMC free article] [PubMed] [Google Scholar]
- Cunha RA. Adenosine as a neuromodulator and as a homeostatic regulator in the nervous system: different roles, different sources and different receptors. Neurochem Int. 2001;38:107–125. doi: 10.1016/s0197-0186(00)00034-6. [DOI] [PubMed] [Google Scholar]
- Fellin T, Carmignoto G. Neurone-to-astrocyte signalling in the brain represents a distinct multifunctional unit. J Physiol (Lond) 2004;559:3–15. doi: 10.1113/jphysiol.2004.063214. [DOI] [PMC free article] [PubMed] [Google Scholar]
- Fields RD, Stevens B. ATP: an extracellular signaling molecule between neurons and glia. Trends Neurosci. 2000;23:625–633. doi: 10.1016/s0166-2236(00)01674-x. [DOI] [PubMed] [Google Scholar]
- Finkbeiner SM. Glial calcium. Glia. 1993;9:83–104. doi: 10.1002/glia.440090202. [DOI] [PubMed] [Google Scholar]
- Hirase H, Qian L, Bartho P, Buzsaki G. Calcium dynamics of cortical astrocytic networks in vivo. PLoS Biol. 2004;2:494–499. doi: 10.1371/journal.pbio.0020096. [DOI] [PMC free article] [PubMed] [Google Scholar]
- Kang J, Goldman SA, Nedergaard M. Astrocyte-mediated potentiation of inhibitory synaptic transmission. Nat Neurosci. 1998;1:683–692. doi: 10.1038/3684. [DOI] [PubMed] [Google Scholar]
- Karwoski CJ, Proenza LM. Relationship between Müller cell responses, a local transretinal potential, and potassium flux. J Neurophysiol. 1977;40:244–259. doi: 10.1152/jn.1977.40.2.244. [DOI] [PubMed] [Google Scholar]
- Karwoski CJ, Proenza LM. Neurons, potassium, and glia in proximal retina of Necturus. J Gen Physiol. 1980;75:141–162. doi: 10.1085/jgp.75.2.141. [DOI] [PMC free article] [PubMed] [Google Scholar]
- Keirstead SA, Miller RF. Calcium waves in dissociated retinal glial (Müller) cells are evoked by release of calcium from intracellular stores. Glia. 1995;14:14–22. doi: 10.1002/glia.440140104. [DOI] [PubMed] [Google Scholar]
- Latini S, Bordoni F, Pedata F, Corradetti R. Extracellular adenosine concentrations during in vitro ischaemia in rat hippocampal slices. Br J Pharmacol. 1999;127:729–739. doi: 10.1038/sj.bjp.0702591. [DOI] [PMC free article] [PubMed] [Google Scholar]
- Mikkelsen JD. Visualization of efferent retinal projections by immunohistochemical identification of cholera toxin subunit B. Brain Res Bull. 1992;28:619–623. doi: 10.1016/0361-9230(92)90112-b. [DOI] [PubMed] [Google Scholar]
- Miller RF (2001) The physiology and morphology of the vertebrate retina. In: Retina (Ryan SJ, ed), pp 138–170. St. Louis: Mosby.
- Neal M, Cunningham J. Modulation by endogenous ATP of the light-evoked release of ACh from retinal cholinergic neurones. Br J Pharmacol. 1994;113:1085–1087. doi: 10.1111/j.1476-5381.1994.tb17106.x. [DOI] [PMC free article] [PubMed] [Google Scholar]
- Nett WJ, Oloff SH, McCarthy KD. Hippocampal astrocytes in situ exhibit calcium oscillations that occur independent of neuronal activity. J Neurophys. 2002;87:528–537. doi: 10.1152/jn.00268.2001. [DOI] [PubMed] [Google Scholar]
- Newman EA. Potassium conductance block by barium in amphibian Müller cells. Brain Res. 1989;498:308–314. doi: 10.1016/0006-8993(89)91109-8. [DOI] [PubMed] [Google Scholar]
- Newman EA. Inward-rectifying potassium channels in retinal glial (Müller) cells. J Neurosci. 1993;13:3333–3345. doi: 10.1523/JNEUROSCI.13-08-03333.1993. [DOI] [PMC free article] [PubMed] [Google Scholar]
- Newman EA (2001a) Glia of the retina. In: Retina (Ryan SJ, ed), pp 89–103. St. Louis: Mosby.
- Newman EA. Propagation of intercellular calcium waves in retinal astrocytes and Müller cells. J Neurosci. 2001b;21:2215–2223. doi: 10.1523/JNEUROSCI.21-07-02215.2001. [DOI] [PMC free article] [PubMed] [Google Scholar]
- Newman EA. Glial cell inhibition of neurons by release of ATP. J Neurosci. 2003a;23:1659–1666. doi: 10.1523/JNEUROSCI.23-05-01659.2003. [DOI] [PMC free article] [PubMed] [Google Scholar]
- Newman EA. New roles for astrocytes: regulation of synaptic transmission. Trends Neurosci. 2003b;26:536–542. doi: 10.1016/S0166-2236(03)00237-6. [DOI] [PubMed] [Google Scholar]
- Newman EA. Glial modulation of synaptic transmission in the retina. Glia. 2004;47:268–274. doi: 10.1002/glia.20030. [DOI] [PMC free article] [PubMed] [Google Scholar]
- Newman EA (2005) Glia and synaptic transmission. In: Neuroglia (Kettenmann H, Ransom BR, eds), Oxford: Oxford UP.
- Newman EA, Bartosch R. An eyecup preparation for the rat and mouse. J Neurosci Methods. 1999;93:169–175. doi: 10.1016/s0165-0270(99)00138-7. [DOI] [PubMed] [Google Scholar]
- Newman EA, Reichenbach A. The Müller cell: a functional element of the retina. Trends Neurosci. 1996;19:307–312. doi: 10.1016/0166-2236(96)10040-0. [DOI] [PubMed] [Google Scholar]
- Newman EA, Zahs KR. Calcium waves in retinal glial cells. Science. 1997;275:844–847. doi: 10.1126/science.275.5301.844. [DOI] [PMC free article] [PubMed] [Google Scholar]
- Newman EA, Zahs KR. Modulation of neuronal activity by glial cells in the retina. J Neurosci. 1998;18:4022–4028. doi: 10.1523/JNEUROSCI.18-11-04022.1998. [DOI] [PMC free article] [PubMed] [Google Scholar]
- Nishizaki T. ATP- and adenosine-mediated signaling in the central nervous system: adenosine stimulates glutamate release from astrocytes via A2a adenosine receptors. J Pharmacol Sci. 2004;94:100–102. doi: 10.1254/jphs.94.100. [DOI] [PubMed] [Google Scholar]
- Parkinson FE, Zhang YW, Shepel PN, Greenway SC, Peeling J, Geiger JD. Effects of nitrobenzylthioinsine on neuronal injury, adenosine levels, and adenosine receptor activity in rat forebrain ischemia. J Neurochem. 2000;75:795–802. doi: 10.1046/j.1471-4159.2000.0750795.x. [DOI] [PubMed] [Google Scholar]
- Parri HR, Gould TM, Crunelli V. Spontaneous astrocytic Ca 2+oscil-lations in situ drive NMDAR-mediated neuronal excitation. Nat Neurosci. 2001;4:803–812. doi: 10.1038/90507. [DOI] [PubMed] [Google Scholar]
- Pasti L, Volterra A, Pozzan T, Carmignoto G. Intracellular calcium oscillations in astrocytes: a highly plastic, bidirectional form of communication between neurons and astrocytes in situ. J Neurosci. 1997;17:7817–7830. doi: 10.1523/JNEUROSCI.17-20-07817.1997. [DOI] [PMC free article] [PubMed] [Google Scholar]
- Phillis JW, Smith-Barbour M, O’Regan MH. Changes in extracellular amino acid neurotransmitters and purines during and following ischemias of different durations in the rat cerebral cortex. Neurochem Int. 1996;29:115–120. doi: 10.1016/0197-0186(95)00154-9. [DOI] [PubMed] [Google Scholar]
- Porter JT, McCarthy KD. Hippocampal astrocytes in situ respond to glutamate released from synaptic terminals. J Neurosci. 1996;16:5073–5081. doi: 10.1523/JNEUROSCI.16-16-05073.1996. [DOI] [PMC free article] [PubMed] [Google Scholar]
- Reifel Saltzberg JM, Garvey KA, Keirstead SA. Pharmacological characterization of P2Y receptor subtypes on isolated tiger salamander Müller cells. Glia. 2003;42:149–159. doi: 10.1002/glia.10198. [DOI] [PubMed] [Google Scholar]
- Ribelayga C, Mangel SC. A circadian clock and light/dark adaptation differentially regulate adenosine in mammalian retina. J Neurosci. 2005;25:215–222. doi: 10.1523/JNEUROSCI.3138-04.2005. [DOI] [PMC free article] [PubMed] [Google Scholar]
- Santos PF, Caramelo OL, Carvalho AP, Duarte CB. Characterization of ATP release from cultures enriched in cholinergic amacrine-like neurons. J Neurobiol. 1999;41:340–348. [PubMed] [Google Scholar]
- Schipke CG, Kettenmann H. Astrocyte responses to neuronal activity. Glia. 2004;47:226–232. doi: 10.1002/glia.20029. [DOI] [PubMed] [Google Scholar]
- Stevens B, Fields RD. Response of Schwann cells to action potentials in development. Science. 2000;287:2267–2271. doi: 10.1126/science.287.5461.2267. [DOI] [PubMed] [Google Scholar]
- Volterra A, Magistretti PJ, Haydon PG (2002) The tripartite synapse. Glia in synaptic transmission. New York: Oxford UP.
- Wassle H. Parallel processing in the mammalian retina. Nat Rev Neurosci. 2004;5:747–757. doi: 10.1038/nrn1497. [DOI] [PubMed] [Google Scholar]
- Wright LL, Vaney DI. The type 1 polyaxonal amacrine cells of the rabbit retina: a tracer-coupling study. Vis Neurosci. 2004;21:145–155. doi: 10.1017/s0952523804042063. [DOI] [PubMed] [Google Scholar]
- Xin D, Bloomfield SA. Tracer coupling pattern of amacrine and ganglion cells in the rabbit retina. J Comp Neurol. 1997;383:512–528. doi: 10.1002/(sici)1096-9861(19970714)383:4<512::aid-cne8>3.0.co;2-5. [DOI] [PubMed] [Google Scholar]
- Zenisek D, Henry D, Studholme K, Yazulla S, Matthews G. Voltage-dependent sodium channels are expressed in nonspiking retinal bipolar-neurons. J Neurosci. 2001;21:4543–4550. doi: 10.1523/JNEUROSCI.21-13-04543.2001. [DOI] [PMC free article] [PubMed] [Google Scholar]