

Abstract
Objectives
We investigated whether introducing the rotavirus and pneumococcal vaccines, which are greatly needed in West Africa, would overwhelm existing supply chains (i.e., the series of steps required to get a vaccine from the manufacturers to the target population) in Niger.
Methods
As part of the Bill and Melinda Gates Foundation–funded Vaccine Modeling Initiative, we developed a computational model to determine the impact of introducing these new vaccines to Niger’s Expanded Program on Immunization vaccine supply chain.
Results
Introducing either the rotavirus vaccine or the 7-valent pneumococcal conjugate vaccine could overwhelm available storage and transport refrigerator space, creating bottlenecks that would prevent the flow of vaccines down to the clinics. As a result, the availability of all World Health Organization Expanded Program on Immunization vaccines to patients might decrease from an average of 69% to 28.2% (range=10%–51%). Addition of refrigerator and transport capacity could alleviate this bottleneck.
Conclusions
Our results suggest that the effects on the vaccine supply chain should be considered when introducing a new vaccine and that computational models can help assess evolving needs and prevent problems with vaccine delivery.
Both rotavirus and pneumococcal disease cause high morbidity and mortality in West African countries. In 2004, more than 65% of deaths associated with rotavirus infection occurred in 11 Asian and African countries. Of these countries, Niger had the highest under-5 mortality (392 deaths/100000 population younger than 5 years).1 Each year, Africa alone has 1 to 4 million pneumococcal pneumonia cases, contributing a substantial proportion of the 814000 annual pneumococcal deaths among children younger than 5 years worldwide.2
Although the rotavirus vaccine (RV) and the 7-valent pneumococcal conjugate vaccine (PCV-7) could meet significant needs in West Africa, it is unclear whether the supply chains (i.e., the series of steps required to get a vaccine from the manufacturers to the target population of countries such as Niger) can handle the introduction of these vaccines.3
When Merck’s RotaTeq (798 cm3/10-dose box) and GlaxoSmithKline’s Rotarix (259.8 cm3/1-dose box) were introduced in Latin America in 2006 to 2007, these bulky vaccines displaced existing Expanded Programs on Immunization (EPI) vaccines in already limited refrigerator space and forced overburdened health care workers to carry additional thermoses to transport the new vaccines.4 To help determine the potential effects on the supply chain of introducing RV or PCV-7 to Niger, the Vaccine Modeling Initiative, funded by the Bill and Melinda Gates Foundation, developed a computational model of the entire Niger vaccine supply chain. We conducted several experiments with different vaccine presentations to explore their effects on storage and transport. We did not consider such resources as buildings, personnel, or vaccine safety injection equipment. We also sought to identify modifications that vaccine policymakers, logisticians, and manufacturers may have to make to facilitate new vaccine introduction.
METHODS
Our deterministic equation-based model comprised a series of mathematical equations depicting the flow of all World Health Organization (WHO) current in-country EPI vaccines, from the vaccine manufacturers to the Niger central depot and through the various storage locations in Niger, down to the level of each clinic serving individual patients. We developed and optimized our model in C++ Visual Studio 2008 (Microsoft Corp, Redmond, WA), CPLEX version 11 (IBM Corp, Armonk, NY), and Excel 2007 (Microsoft Corp).
Figure 1 depicts the structure of the Niger vaccine supply chain. Data to construct the model came from interviews and meetings with in-country officials from the following organizations: WHO (Geneva), WHO (Niger), the United Nations Children’s Fund (UNICEF), the Niger National Geographic Institute, the Niger Ministry of Health, the EPI office in Niger, and field observations. Vaccines arrived at the central depot in Niamey, Niger’s capital, via various intermediaries, and were subsequently moved to 8 regional depots, 42 district depots, and 695 integrated health centers (IHCs) throughout the country. Vaccine administration occurred at IHCs 4 days per week. Most of the supply chain locations were near population settlements in the south, with few in the north of the country.
FIGURE 1. Vaccine supply chain network in Niger.

Note. IHC = integrated health center. The capacities (L) listed in parentheses are the ranges of available storage capacity across all locations within level.
Sources. Data to construct the model came from interviews and meetings with in-country officials from the World Health Organization in Geneva, Switzerland, and Niger; UNICEF; the Niger National Geographic Institute; the Niger Ministry of Health; the Niger office of Expanded Program on Immunization; and from field observations.
Vaccine Specifications
The model incorporated the 7 current EPI vaccines, as indicated by the WHO’s Niger immunization profile5:
bacillus Calmette-Guérin: 1 dose per person, 10 doses per vial, 1.2 cubic centimeters packed volume of vaccine per dose, 0.7 cubic centimeters packed volume of diluent per dose of vaccine, stored in refrigerators (2°C–8°C), intradermal administration;
diphtheria-tetanus-pertussis: 5 doses per person, 10 doses per vial, 3.0 cubic centimeters per dose, stored in refrigerators, intramuscular administration;
diphtheria-tetanus-pertussis-hepatitis B: 5 doses per person, 1 dose per vial, 9.7 cubic centimeters per dose, stored in refrigerators, intramuscular administration;
oral polio vaccine: 4 doses per person, 10 doses per vial, 1.0 cubic centimeters per dose, stored in freezers (0°C to −15°C), oral administration;
measles: 2 doses per person, 10 doses per vial, 3.5 cubic centimeters per dose, 4.0 cubic centimeters diluent per dose of vaccine, stored in refrigerators, subcutaneous administration;
tetanus toxoid: 1 dose per person, 10 doses per vial, 3.0 cubic centimeters per dose, stored in refrigerators, intramuscular administration;
yellow fever: 1 dose per person, 10 doses per vial, 2.5 cubic centimeters per dose, 7.0 cubic centimeters diluent per dose of vaccine, stored in refrigerators, subcutaneous administration.
Our experiments introduced different combinations of RV and PCV-7, all of which were stored in refrigerators,6 listed from smallest to largest presentation:
rotavirus (Rotarix): 2 doses per person, 1 dose per vial, 17.1 cubic centimeters per dose, oral administration;
rotavirus (RotaTeq): 3 doses per person, 1 dose per vial, 43.3 cubic centimeters per dose, oral administration;
rotavirus (RotaTeq): 3 doses per person, 1 dose per vial, 79.8 cubic centimeters per dose, oral administration;
rotavirus (Rotarix): 2 doses per person, 1 dose per vial, 156.0 cubic centimeters per dose, oral administration;
rotavirus (Rotarix): 2 doses per person, 1 dose per vial, 259.8 cubic centimeters per dose, oral administration;
PCV-7 (Prevnar): 4 doses per person, 1 dose per vial, 55.9 cubic centimeters per dose, intramuscular administration.
Vaccine Supply Chain Operations
Our equation-based model represented every storage location, refrigerator, freezer, and transport vehicle in the supply chain. For each device, the current vaccine inventory (the number of vaccines currently stored in refrigerators or freezers) was equal to the number of vaccines present the previous day minus the vaccines that were removed (either shipped or administered, if the location was an IHC) plus the number of vaccines that arrived that day:
| (1) |
Each location had a specific number of freezers and refrigerators with predefined storage capacities calculated by their size and utilization rates, that is, the percentage of physical space within the storage device that could actually be used for storage (excluding space consumed by shelves, drawers, ice boxes, etc.). The effective storage space was the storage capacity multiplied by its effective utilization rate. For instance, a 150-liter storage device with a 70% utilization rate would have only 105 liters (150 L × 0.70) available. The total vaccine volume in a storage device could never exceed its effective storage space. The total volume that vaccines occupied equaled the number of vials of each vaccine type multiplied by its volume per vial. Each refrigerator was designed to maintain temperatures of 2°C to 8°C; each freezer was designed to maintain temperatures of −15°C to −25°C. Assignment of each vaccine to freezers or refrigerators depended on its required temperature profile; nonfreezable vaccines could not be stored in freezers.
The central depot and 3 of the regional depots had walk-in refrigerators, also with storage capacities and utilization rates. The remaining regional, district, and IHC depots used conventional upright or chest refrigerators and freezers. Several IHCs did not have freezers or refrigerators, and they relied on cold boxes to maintain vaccine storage temperatures. The available storage capacity at the central depot was 45000 liters of refrigerator space. The median refrigerator storage capacity was 40769 liters (range=15094–54144 L) at regional depots, 254 liters (range=0–627 L) at district depots, and 26 liters (range=0–190 L) at IHCs.
Vaccine shipments between locations occurred at defined frequencies specific to transportation routes (e.g., monthly from districts to IHCs) and could not contain more vaccine vials than available storage space in a vehicle or in the receiving location’s refrigerator or freezer.
Vaccine Administration
Vaccine administration occurred at the periphery of the supply chain. On each IHC visit, patients received the appropriate age-specified vaccines, if available. Missed vaccination opportunities resulted when a patient arrived but the appropriate vaccines were unavailable. A population demand model governed each IHC’s vaccination session arrival rates. The population demand was a function of the age-stratified Niger population in each clinic’s catchment area multiplied by the annual national birth rate, which then generated the number of children reaching vaccination age each month. The model assumed that a child presented to each IHC for immunization when at the appropriate age. The number of IHCs per district ranged from 5 to 36, and the median number of children presenting at IHCs per month was 140 (range=0–295).
Lyophilized vaccines require reconstitution with diluents, which must be cooled to match the vaccine’s temperature the day before administration. Each diluent type has a specific volume. Each day the amount of diluent stored in an IHC refrigerator matched the expected number of vaccines required the following day, that is, the average daily IHC patient arrival rate.
Our model accounted for 3 kinds of vaccine loss: shipping loss was the percentage of vaccines lost each day during transport from temperature exposure (too hot or cold) and breakage, inventory loss was the percentage of vaccines lost each day during storage from temperature exposure and breakage, and open vial loss was the percentage of unused vaccine doses from vials that were opened but not completely consumed (e.g., only 2 doses used from a 10-dose vial). More detail on vaccine loss and waste is available elsewhere.7
The model’s overall objective was to optimize the level of vaccine availability across all locations, times, and vaccine types. Vaccine availability was the percentage of patients arriving at a clinic for vaccination who could be immunized because adequate vaccine was in stock. The following formula calculated vaccine availability:
| (2) |
Sensitivity Analyses
Sensitivity analyses systematically varied the values of the following parameters: inventory loss rate (range=0%–2%), shipping loss rate (range=0%–5%), refrigerator capacity utilization (85%), target vaccine coverage (range=25%–100%), and time to achieve vaccine coverage (range=1–10 years). Additional scenarios examined the impact of switching between monthly and quarterly shipments and between the 2 population demand types: stochastic distribution was the number of patients requiring immunization in a given month, derived from a Poisson distribution with mean λ (e.g., 20–25 children arriving each month at IHC X), and deterministic monthly distribution was the number of patients requiring immunization in a given month, according to projected population estimates from birth registries and not fluctuating from month to month (e.g., 25 children arrived each month for vaccination at IHC X).
RESULTS
Because of limited storage and transport capacities at the central, regional, district, and IHC levels, introducing RV or PCV-7 could cause bottlenecks throughout the supply chain, which in turn could inhibit established EPI vaccines from reaching patients at IHCs. The bulkier new vaccines are, the greater the resulting disruption could be. Sensitivity analyses showed that results did not change significantly when we varied population demand (deterministic vs stochastic) and inventory and shipping loss rates. Therefore, results we report here are all from scenarios that assumed 1% shipping and inventory loss, 85% refrigerator capacity utilization, and stochastic population demand.
Impact on Storage
Figure 2 delineates the additional refrigerator space needed to accommodate the introduction of each vaccine presentation to cover 100% of newborns each year. At the monthly shipping frequency at the time of our study, the central store could handle new smaller vaccine presentations but possibly not the larger RV or certain combinations of RV and PCV-7, without additional capacity (up to 32248.7 L for the largest combinations of vaccines). However, decreasing shipping frequency from monthly to quarterly (e.g., because of truck breakdowns, personnel loss, or operational policy changes) would cause vaccines to accumulate to the point where they would exceed available capacity even when smaller vaccines were introduced. Therefore, maintaining adequate vaccine flow out of the central store is important.
FIGURE 2. Extra storage capacity required at the regional, district, and integrated health center levels for (a) Expanded Program on Immunization baseline vaccines alone and for baseline vaccines plus (b) PCV-7, (c) 17.1 cm3 rotavirus and PCV-7, and (d) 259.8 cm3 rotavirus in Niger.

Note. IHC = integrated health center; PCV-7 = 7-valent pneumococcal conjugate vaccine.
At the regional level, storage locations could handle new vaccine introduction as long as shipping frequency was maintained. Any transport disruptions could jeopardize this balance. Although upper-level storage locations had enough room, this could easily change if additional buffer capacity was not added. Some district and IHC facilities did not have enough refrigerator space to handle even current EPI vaccines.
The higher the newborn vaccination coverage desired, the more additional refrigerator capacity would be needed, but slowing the rollout of new vaccines might offer more time to add capacity. To vaccinate 25% of newborns with the smallest RV and PCV-7 would require 15 liters additional cool capacity (or another 55-L refrigerator) at 1 district store and an additional median of 8 liters (i.e., 24-L refrigerator; range=0–30 L) at most IHCs. Even a gradual rollout period (i.e., taking 5–10 years to increase linearly up to the target of 25%) would incur these requirements within the first year. Vaccinating 50% of newborns would require an additional 107 liters (or two 55-L refrigerators) at a district store and an additional median of 10 liters (one 24-L refrigerator; range=0–38 L) at each IHC.
A gradual 5-year rollout (10% the first year, 20% the second year, 30% the third year, etc.) would mean that 1 additional refrigerator would have to be added by year 1 and another by year 3 at a district store and by year 1 at most IHCs. A 10-year rollout (5% the first year, 10% the second year, 15% the third year, etc.) would require 1 additional refrigerator to be added by year 1 and another by year 6 at a district store and by year 1 at most IHCs. Vaccinating 75% of newborns would require an additional 199 liters (or four 55-L refrigerators) at a single district store and an additional median of 10 liters (one 24-L refrigerator; range=0–45 L) at each IHC. Even a 5-year rollout period would necessitate 1 additional refrigerator by each of years 1, 2, 3, and 5 at a district store and by year 1 for most IHCs. A 10-year rollout would require 1 additional refrigerator by each of years 1, 3, 6, and 9 at a district store and by year 1 for most IHCs.
Impact on Transport
Limited transport cold capacity was also a constraint. Although available transport capacity could handle the existing EPI complement, adding even the smallest RV would require additional transport cold space at all levels (Figure 3). Transport limitations increased down the supply chain. Introducing any RV formulation larger than 45.9 cubic centimeters from the central depot would require an average of 3598.1 liters (range=0.0–11419.0 L) more transport cold capacity to the regional depots. Any RV formulation larger than 17.1 cubic centimeters would require an average of 547.1 liters (range=1.6–3318.6 L) more transport cold capacity to go from the regional to the district level and 32.6 liters (range=0.2–195.0 L) to go from the districts to IHCs. Decreasing shipping frequency from monthly to quarterly would further exacerbate these problems.
FIGURE 3. Extra transport capacity required at the regional, district, and integrated health center levels for (a) Expanded Program on Immunization baseline vaccines alone and for baseline vaccines plus (b) PCV-7, (c) 17.1 cm3 rotavirus and PCV-7, and (d) 259.8 cm3 rotavirus in Niger.

Note. IHC = integrated health center; PCV-7 = 7-valent pneumococcal conjugate vaccine.
As with storage locations, transport capacity requirements would increase with higher desired newborn vaccination coverage, but additional capacity might not be needed immediately if the rollout of new vaccines occurred gradually. To vaccinate 25% with the smallest RV and PCV-7 would require an additional 3339 liters cool transport capacity (two 3098-L cold trucks; range =1891–4330 L) at the central store, an additional 166 liters (two 173-L 4 × 4 trucks; range=19–478 L) for districts, and an additional 12 liters (three 5-L vaccine carriers; range=0–34 L) at IHCs. A 5-year linear rollout would require 1 additional transport device by year 1 and another by year 5 for the central store, 1 by year 1 for the district stores, and 1 by each of years 1, 3, and 5 for most IHCs. A 10-year rollout would require 1 additional device by each of years 1 and 10 for the central store, by year 1 for the district stores, and by each of years 1, 5, and 9 for most IHCs.
Vaccinating 50% of newborns would require an additional 4879 liters (two 3098-L cold trucks; range=3085–6108 L) at the central store, an additional 218 liters (two 173-L 4 × 4 trucks; range=3–634 L) at each district, and an additional 16 liters (four 5-L vaccine carriers; range=1–43 L) at each IHC. A 5-year rollout would require 1 additional device by each of years 1 and 4 for the central store, by each of years 1 and 4 for district stores, and by each of years 1, 2, 4, and 5 for most IHCs. A 10-year rollout would require 1 additional device by each of years 1 and 8 for the central store, by each of years 1 and 8 for district stores, and by each of years 1, 3, 6, 8, and 10 for most IHCs.
Vaccinating 75% of newborns would require an additional 6195 liters (two 3098-L cold trucks; range=471–7886 L) at the central store, an additional 290 liters (two 173-L 4 × 4 trucks; range=7–789 L) at each district, and 20 liters (four 5-L vaccine carriers; range=3–52 L) at each IHC. A 5-year rollout would require 1 new device by each of years 1 and 3 for the central store, by each of years 1 and 3 for district stores, and by each of years 1, 2, 3, and 4 for IHC stores. A 10-year rollout period would require 1 new device by each of years 1 and 6 for the central store, by each of years 1 and 6 for the district stores, and by each of years 1, 3, 6, and 8 for the IHC stores.
Impact on Vaccine Administration
Storage, particularly at district levels, and transport bottlenecks could reduce vaccine availability at IHCs. Figure 4 shows how introducing RV and PCV-7 could decrease vaccine availability from an average of 69% to 24% (range=10%–51%) with a monthly shipping frequency and from 57% to 16% (range=7%–42%) with a quarterly shipping frequency.
FIGURE 4. Frequency histograms of supply ratios at the integrated health center level for (a) Expanded Program on Immunization baseline vaccines alone and for baseline vaccines plus (b) PCV-7, (c) 17.1 cm3 rotavirus and PCV-7, and (d) 259.8 cm3 rotavirus in Niger.
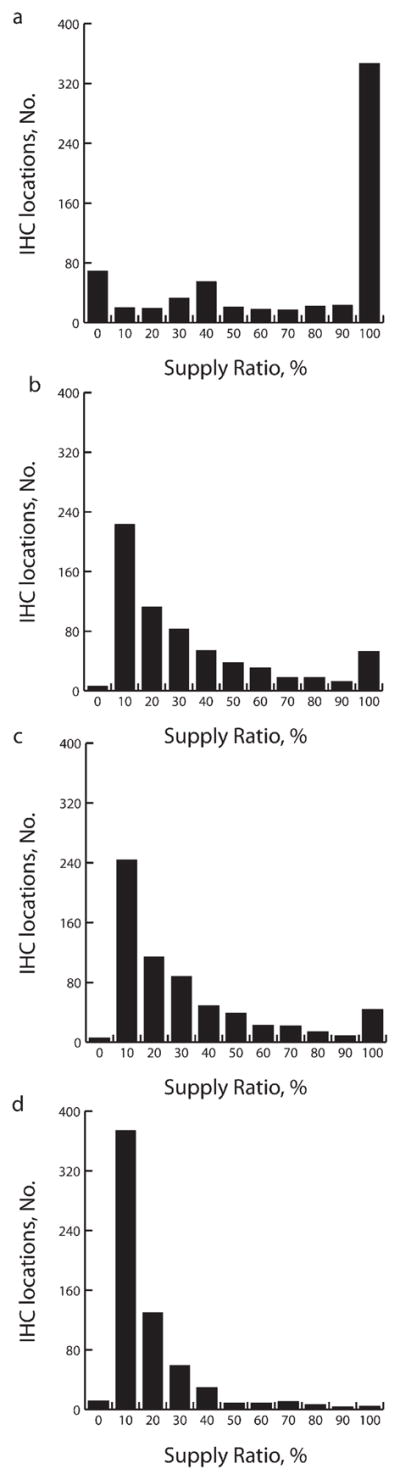
Note. IHC = integrated health center; PCV-7 = 7-valent pneumococcal conjugate vaccine.
Vaccine availability, assuming monthly shipping, after the introduction of the smallest (17.1 cm3) RV could be reduced from 69% at baseline to 51%, to 13% for the largest (259.8 cm3) RV, and to 29% for PCV-7 (55.9 cm3), if these were introduced individually. Availability of 57% on a quarterly shipping schedule would drop to 42%, 8%, and 21%, respectively, if these vaccines were introduced separately. Vaccine availability following introduction of the lowest-volume RV and PCV-7 in combination would cause baseline availability of 69% to fall to 26% with monthly shipping and from 57% to 18% with quarterly shipping.
DISCUSSION
Introducing even the smallest RV or PCV-7 to the existing immunization program in Niger could substantially disrupt the vaccine supply chain. The added volume of new vaccines could displace other EPI vaccines from storage and transport space, overwhelm transport and storage at the lower 2 levels of the supply chain, and therefore reduce the availability of all EPI vaccines at IHCs. This would be similar to the 2006 to 2007 RotaTeq and Rotarix introductions in 7 Latin American countries. RotaTeq and Rotarix were too large for many of the existing supply chains, surpassing refrigerator capacities of many IHCs and forcing health care workers to carry extra thermoses and cold boxes. Because no contingency plans were in place, these unexpected consequences resulted in the expiration of large stocks of vaccines.4 The episode also compelled manufacturers to redesign their vaccine packaging.8
Our results emphasize the importance of considering the vaccine supply chain and the complex dynamic effects of introducing new vaccines. New vaccines may not fit smoothly into supply chains, therefore failing to reach their target populations easily, and these problems may prevent other vaccines from reaching clinics as well. Manufacturers and policymakers should consider the impact of vaccine size before designing vaccines and introducing them in new areas.
Our study highlights the importance of advanced planning when introducing new vaccines to avoid last-minute temporary fixes. Capacity requirements can grow over time. Forecasting and assessing the evolving supply chain and exploring innovative solutions can preclude crises. Identifying synergies across immunization supply chains and other health program supply chains (e.g., medication, diagnostic kits, and specimen distribution) can also increase available capacity by spreading the burden. Improving and integrating information systems can help countries such as Niger better track actual stock levels. Special situations such as campaigns (e.g., for polio, measles, and meningitis immunization) can leave large amounts of vaccines at peripheral levels, further decreasing the actual space available. Streamlining the distribution system to deliver more precise quantities calculated to meet actual demand—rather than depending on inaccurate forecasts—can further improve distribution.
Computational models can assist with such planning, forecast the impact of new vaccine introduction, and identify potential bottlenecks and resulting disruptions. Models can help decision makers understand complex systems, especially when models are integrated with supply chain information systems. Although computational models have been widely used in similar logistics planning in many other industries (e.g., transportation, manufacturing, the military, aerospace), their use in public health has been comparatively limited.9–11 Computational models have helped evaluate various infectious disease control measures.12–21 Large-scale computational models assisted the US Department of Health and Human Services in its response to the 2009 H1N1 pandemic.22–26 Developing and implementing computational modeling of vaccine supply chains could save much time, expense, and effort.
Limitations
Models, by definition, are simplifications of real life and cannot capture every possible factor, relationship, or outcome.27,28 Constructing our model involved substantial data collection from a wide variety of sources. Some data (e.g., truck availability) may be less reliable because reporting does not always match reality. Moreover, our model did not account for random events such as power outages and inclement weather.
Our model did not consider additional resources needed with new vaccine introduction such as personnel, vaccine accessories (e.g., safety equipment), and potential changes in building space. These resources would all naturally increase the financial burden imposed on countries considering introducing vaccines; budgeting is a crucial element in such a decision.
Finally, our estimate of population demand for vaccines was based on birth-rate data. The actual demand at each IHC was unknown. Nonetheless, sensitivity analyses showed our results to be fairly robust to changes in parameter values. In fact, many of the limitations of our analysis (e.g., random disruptions to the supply chain) would likely further worsen vaccine availability after new vaccine introduction, so we may have underestimated the potential disruptions.
Conclusions
Without adding more cold capacity to various storage locations and transport devices, the Niger vaccine supply chain may not be able to handle the introduction of RV and PCV-7. Under current circumstances, introducing these new vaccines could create bottlenecks that would hinder the flow of all EPI vaccines to patients. As vaccination coverage increases, capacity requirements grow rapidly. Computational models can help forecast and assess the evolving needs of the supply chain and explore innovative ways to address these needs, which can preclude crises when new vaccines are introduced.
Acknowledgments
This study was supported by the Vaccine Modeling Initiative, funded by the Bill and Melinda Gates Foundation, and the National Institute of General Medical Sciences Models of Infectious Disease Agent Study (grant 1U54GM088491-0109).
Note. The funders had no role in the design and conduct of the study; collection, management, analysis, and interpretation of the data; or preparation, review, or approval of the article.
Footnotes
Reprints can be ordered at http://www.ajph.org by clicking the “Reprints/Eprints” link.
Contributors
All authors contributed substantially to the design of the study, analysis of the data, and preparation of the article.
Human Participant Protection
No protocol approval was required because the study did not include human participants.
Contributor Information
Bruce Y. Lee, University of Pittsburgh, Pittsburgh, PA.
Tina-Marie Assi, University of Pittsburgh, Pittsburgh, PA.
Jayant Rajgopal, University of Pittsburgh, Pittsburgh, PA.
Bryan A. Norman, University of Pittsburgh, Pittsburgh, PA.
Sheng-I Chen, University of Pittsburgh, Pittsburgh, PA.
Shawn T. Brown, University of Pittsburgh, Pittsburgh, PA.
Rachel B. Slayton, University of Pittsburgh, Pittsburgh, PA.
Souleymane Kone, World Health Organization, Geneva, Switzerland.
Hailu Kenea, World Health Organization, Geneva, Switzerland.
Joel S. Welling, Pittsburgh Supercomputing Center.
Diana L. Connor, University of Pittsburgh, Pittsburgh, PA.
Angela R. Wateska, University of Pittsburgh, Pittsburgh, PA.
Anirban Jana, Pittsburgh Supercomputing Center.
Ann E. Wiringa, University of Pittsburgh, Pittsburgh, PA.
Willem G. Van Panhuis, University of Pittsburgh, Pittsburgh, PA.
Donald S. Burke, University of Pittsburgh, Pittsburgh, PA.
References
- 1.Naghipour M, Nakagomi T, Nakagomi O. Issues with reducing the rotavirus-associated mortality by vaccination in developing countries. Vaccine. 2008;26(26):3236–3241. doi: 10.1016/j.vaccine.2008.04.004. [DOI] [PubMed] [Google Scholar]
- 2.Scott JAG. The preventable burden of pneumococcal disease in the developing world. Vaccine. 2007;25(13):2398–2405. doi: 10.1016/j.vaccine.2006.09.008. [DOI] [PubMed] [Google Scholar]
- 3.Clemens J, Jodar L. Introducing new vaccines into developing countries: obstacles, opportunities and complexities. Nat Med. 2005;11(4 suppl):S12–S15. doi: 10.1038/nm1225. [DOI] [PubMed] [Google Scholar]
- 4.de Oliveira LH, Danovaro-Holliday MC, Matus CR, Andrus JK. Rotavirus vaccine introduction in the Americas: progress and lessons learned. Expert Rev Vaccines. 2008;7(3):345–353. doi: 10.1586/14760584.7.3.345. [DOI] [PubMed] [Google Scholar]
- 5.World Health Organiation. [Accessed October 27, 2010];Immunization profile—Niger. Available at: http://apps.who.int/immunization_monitoring/en/globalsummary/countryprofileresult.cfm?C='ner'.
- 6.World Health Organiation. [Accessed October 27, 2010];WHO prequalified vaccines. Available at: http://www.who.int/immunization_standards/vaccine_quality/PQ_vaccine_list_en/en/index.html.
- 7.Lee BY, Norman BA, Assi T-M, et al. Single versus multi-dose vaccine vials: an economic computational model. Vaccine. 2010;28(32):5292–5300. doi: 10.1016/j.vaccine.2010.05.048. [DOI] [PMC free article] [PubMed] [Google Scholar]
- 8.Wecker J. The PATH Rotavirus Vaccine Program: Summary Report. Seattle, WA: PATH; 2009. p. 7. [Google Scholar]
- 9.Epstein JM. Generative Social Science: Studies in Agent-Based Computational Modeling. Princeton, NJ: Princeton University Press; 2006. [Google Scholar]
- 10.Trochim WM, Cabrera DA, Milstein B, Gallagher RS, Leischow SJ. Practical challenges of systems thinking and modeling in public health. Am J Public Health. 2006;96(3):538–546. doi: 10.2105/AJPH.2005.066001. [DOI] [PMC free article] [PubMed] [Google Scholar]
- 11.Leischow SJ, Milstein B. Systems thinking and modeling for public health practice. Am J Public Health. 2006;96(3):403–405. doi: 10.2105/AJPH.2005.082842. [DOI] [PMC free article] [PubMed] [Google Scholar]
- 12.Lee BY, Bailey RR, Smith KJ, et al. Universal methicillin-resistant Staphylococcus aureus (MRSA) surveillance for adults at hospital admission: an economic model and analysis. Infect Control Hosp Epidemiol. 2010;31(6):598–606. doi: 10.1086/652524. [DOI] [PMC free article] [PubMed] [Google Scholar]
- 13.Lee BY, Bailey RR, Wiringa AE, et al. Economics of employer-sponsored workplace vaccination to prevent pandemic and seasonal influenza. Vaccine. 2010;28(37):5952–5959. doi: 10.1016/j.vaccine.2010.07.003. [DOI] [PMC free article] [PubMed] [Google Scholar]
- 14.Lee BY, Bailey RR, Wiringa AE, Assi TM, Beigi RH. Antiviral medications for pregnant women for pandemic and seasonal influenza: an economic computer model. Obstet Gynecol. 2009;114(5):971–980. doi: 10.1097/AOG.0b013e3181bdbfed. [DOI] [PMC free article] [PubMed] [Google Scholar]
- 15.Lee BY, Wettstein ZS, McGlone SM, et al. Economic value of norovirus outbreak control measures in health-care settings. Clin Microbiol Infect. 2011;17(4):640–646. doi: 10.1111/j.1469-0691.2010.03345.x. [DOI] [PMC free article] [PubMed] [Google Scholar]
- 16.Ferguson NM, Cummings DA, Cauchemez S, et al. Strategies for containing an emerging influenza pandemic in Southeast Asia. Nature. 2005;437(7056):209–214. doi: 10.1038/nature04017. [DOI] [PubMed] [Google Scholar]
- 17.Ferguson NM, Cummings DA, Fraser C, Cajka JC, Cooley PC, Burke DS. Strategies for mitigating an influenza pandemic. Nature. 2006;442(7101):448–452. doi: 10.1038/nature04795. [DOI] [PMC free article] [PubMed] [Google Scholar]
- 18.Halloran ME, Ferguson NM, Eubank S, et al. Modeling targeted layered containment of an influenza pandemic in the United States. Proc Natl Acad Sci USA. 2008;105(12):4639–4644. doi: 10.1073/pnas.0706849105. [DOI] [PMC free article] [PubMed] [Google Scholar]
- 19.Holmes EC, Taubenberger JK, Grenfell BT. Heading off an influenza pandemic. Science. 2005;309(5737):989. doi: 10.1126/science.1117128. [DOI] [PubMed] [Google Scholar]
- 20.Pitzer VE, Viboud C, Simonsen L, et al. Demographic variability, vaccination, and the spatiotemporal dynamics of rotavirus epidemics. Science. 2009;325(5938):290–294. doi: 10.1126/science.1172330. [DOI] [PMC free article] [PubMed] [Google Scholar]
- 21.Tildesley MJ, Savill NJ, Shaw DJ, et al. Optimal reactive vaccination strategies for a foot-and-mouth outbreak in the UK. Nature. 2006;440(7080):83–86. doi: 10.1038/nature04324. [DOI] [PubMed] [Google Scholar]
- 22.Cooley P, Lee BY, Brown S, et al. Protecting health care workers: a pandemic simulation based on Allegheny County. Influenza Other Respi Viruses. 2010;4(2):61–72. doi: 10.1111/j.1750-2659.2009.00122.x. [DOI] [PMC free article] [PubMed] [Google Scholar]
- 23.Lee BY, Brown ST, Cooley P, et al. Vaccination deep into a pandemic wave: potential mechanisms for a “third wave” and the impact of vaccination. Am J Prev Med. 2010;39(5):e21–e29. doi: 10.1016/j.amepre.2010.07.014. [DOI] [PMC free article] [PubMed] [Google Scholar]
- 24.Lee BY, Brown ST, Cooley P, et al. Simulating school closure strategies to mitigate an influenza epidemic. J Public Health Manag Pract. 2010;16(3):252–261. doi: 10.1097/PHH.0b013e3181ce594e. [DOI] [PMC free article] [PubMed] [Google Scholar]
- 25.Lee BY, Brown ST, Cooley PC, et al. A computer simulation of employee vaccination to mitigate an influenza epidemic. Am J Prev Med. 2010;38(3):247–257. doi: 10.1016/j.amepre.2009.11.009. [DOI] [PMC free article] [PubMed] [Google Scholar]
- 26.Lee BY, Brown ST, Korch GW, et al. A computer simulation of vaccine prioritization, allocation, and rationing during the 2009 H1N1 influenza pandemic. Vaccine. 2010;28(31):4875–4879. doi: 10.1016/j.vaccine.2010.05.002. [DOI] [PMC free article] [PubMed] [Google Scholar]
- 27.Lee BY, Biggerstaff BJ. Screening the United States blood supply for West Nile Virus: a question of blood, dollars, and sense. PLoS Med. 2006;3(2):e99. doi: 10.1371/journal.pmed.0030099. [DOI] [PMC free article] [PubMed] [Google Scholar]
- 28.Lee BY. Digital decision making: computer models and antibiotic prescribing in the twenty-first century. Clin Infect Dis. 2008;46(8):1139–1141. doi: 10.1086/529441. [DOI] [PubMed] [Google Scholar]