Abstract
Stellate cells in layer II of medial entorhinal cortex (mEC) are endowed with a large hyperpolarization activated cation current (h-current: Ih). Recent work done using in vivo recordings from awake-behaving rodents demonstrate that Ih plays a significant role in regulating the characteristic spatial periodicity of ‘grid cells’ in mEC. A separate, yet related line of research demonstrates that grid fieldspacing changes as a function of behavioral context. To understand the neural mechanism(s) that could be underlying these changes in grid spacing we have conducted voltage clamp recordings of Ih in layer II stellate cells. In particular, we have studied Ih under the influence of several neuromodulators. The results demonstrate that Ih amplitude can be both up and down regulated through activation of distinct neuromodulators in mEC. Activation of muscarinic acetylcholine receptors produces a significant decrease in the Ih tail current and a hyperpolarizing shift in the activation, whereas upregulation of cAMP through application of forskolin produces a significant increase in the Ih amplitude and a depolarizing shift in Ih activation curve. In addition, there was evidence of differential modulation of Ih along the dorsal-ventral axis of mEC. Voltage clamp protocols were also used to determine whether M-current is present in stellate cells. In contrast to CA1 pyramidal neurons which express M-current, the data demonstrate that M-current is not present in stellate cells. The results provided by this study provide key insights into a potential mechanism that could be underlying changes seen in grid field spacing during distinct behavioral contexts.
Introduction
Characterizing the unique electrophysiological profile of distinct neuronal sub-types remains a central problem in neuroscience research. Understanding neuromodulation of ion channels is a problem of particular complexity since it is possible for modulation of several different biochemical pathways to all influence the activity of a single ion channel. Using whole cell voltage clamp recordings of stellate cells (SCs) in layer II of medial entorhinal cortex (mEC), we have focused attention upon neuromodulation of h-current (Ih). Ih is of particular interest in SCs due to its large amplitude and potential role in membrane potential rhythmicity (Dickson et al., 2000) and resonance (Haas and White, 2002; Erchova et al., 2004; Giocomo et al., 2007) as well as its putative role in the characteristic spatial representation shown by entorhinal neurons during extra-cellular recordings from awake, behaving rats and mice (Giocomo et al., 2011). Unit recordings studies have demonstrated that neurons in entorhinal cortex, termed ‘grid cells’, fire selectively at regular spatial intervals as the animal explores a 2D environment (Fyhn et al., 2004; Hafting et al., 2005; Moser and Moser, 2008). Together, the multiple firing fields of a single grid cell form a nearly symmetrical hexagonal grid, tiling the floor of the animal’s environment. Previous work has shown that not only does Ih physiology correlate with grid field spacing and grid field size (Giocomo et al., 2007), but recently it has been demonstrated that knock-out of the HCN1 subunit can alter the grid field spacing and grid field size (Giocomo et al., 2008; Giocomo et al., 2011). In addition to its functional role in the mEC SCs, Ih has also been shown to be particularly disposed to influences by different modulatory systems (DiFancesco and Tortora, 1991; Pian et al., 2006; Pian et al., 2007; Ma et al., 2007; Rosenkranz et al., 2006).
This work is also inspired by our previous research demonstrating cholinergic modulation of membrane potential resonance in mEC SCs (Heys et al., 2010). Similar to Ih properties that correlate to grid field spacing and grid field size, membrane potential resonance has also been found to correlate with grid spacing (Giocomo et al., 2007). The results of our previous study suggested that the decrease in membrane potential resonance frequency and resonance strength, following application of cholinergic agonists, were at least in part the result of changes in Ih. We have extended this result in the current study through pharmacological isolation of Ih in voltage clamp. The role of h-current is further supported here by our voltage clamp recordings showing that M-current (Im) is not significantly present in stellate cells. This result is in contrast to hippocampal pyramidal neurons, where Im is present and responsible for membrane potential resonance at more depolarized resting potentials (Hu et al., 2002). In addition to resolving previous claims that Im could be present in SCs and responsible for membrane potential oscillations, this result further exemplifies the distinct electrophysiological profile of SCs relative to other principal excitatory neurons in the parahippocampal region.
Methods
Slice preparation
Tissue analyzed in this study was taken from 17–21 day old male and female Long Evans rats (Charles River Laboratories, Wilmington, MA). The Institutional Animal Care and Use Committee at Boston University approved all experimental techniques. Animals were deeply anesthetized with isoflurane (Abbott Laboratories, North Chicago, IL) and decapitated. The brain was rapidly removed and placed in oxygenated 4°C artificial cerebral spinal fluid (ACSF) with the following concentrations (in mM): 125 NaCl, 2.0 CaCl, 2.5 KCl, 1.25 NaH2PO4, 25 NaHCO3, 25 D-Glucose, and 1.0 MgCl2. The brain was then blocked and glued to a platform and a vibratome (Leica VT1000s) was used to section 400μm horizontal slices of the parahippocampal formation. Slices were cut in succession from dorsal to ventral. Previous work demonstrated that slice direction does not alter cellular physiology (Giocomo et al., 2007). After the slicing procedure the tissue was incubated for 30 minutes in a heat bath set to 31°C and incubated at room temperature for 30 minutes.
Electrophysiological recordings
Slices were placed in a 20 Series infusion chamber while maintaining bath temperature at 37°C (Warner Instruments, Holliston, MA) and slices were infused with oxygenated ACSF. 2–5 MΩ borosilicate glass capillary tubes (Sutter Instruments) were made using a Sutter Instruments P-87 pipette puller. Whole cell patch clamp recordings were made in voltage clamp and current clamp. Briefly, the electrode resistance was monitored using an oscilloscope and brief pulses of inward pressure were used to obtain whole cell recordings once a ‘GIGA seal’ was formed. Series resistance was monitored over the course of each session and only recordings that maintained a series resistance of less than 10MΩ were included in the study. Pipettes were loaded with intracellular solution containing (in mM) 120 K-gluconate, 10 HEPES, 0.2 EGTA, 20 KCL, 2 MgCl, 7 diTrisPhCr, 4Na2ATP and 0.3 TrisGTP (pH adjusted to 7.3 with KOH). Recordings were made using a Multiclamp 700B amplifier (Molecular Devices, Sunnyvale, CA). The data was low-pass filtered at 10 kHz and digitized using Digidata 1320 at a sampling frequency of 20 kHz. Recorded signals were collected on a Pentium based computer running Clampex 10.0 recording software (Axon Instruments). Liquid junction potential was measured to be between 5 and 6 mV using the technique of Neher (1992) and Dickson et al (2000). All recordings are not corrected for the liquid junction potential.
Stellate cells were identified visually in the slice by laminar location, cellular morphology and through confirmation of their characteristic electrophysiological profile: large amplitude sag potential, the presence of large amplitude membrane potential oscillations, spike clustering and membrane potential resonance of 3–15Hz. Cells had an input resistance (Rin) of 25–80MΩ and a resting membrane potential (Vr) of −58 to −65mV. Data are expressed as mean ± SEM.
Solutions
All recording solutions of ACSF were bath applied and included 1μM TTX to block voltage sensitive sodium currents, 2 mM CoCl2 to block voltage sensitive calcium currents and 20mM TEA to block voltage sensitive potassium channels. Where stated, some solutions also included other agents including 10μM carbachol (CCH), 1μM atropine, 10μM XE991, 50μM forskolin or100μM ZD7288.
Data analysis
All data was recorded using P-Clamp 10.0 (Axon Instruments) and analyzed using MATLAB. All statistical comparisons between group averages were made using the Kruskal-Wallis non-parametric one way analysis of variance to avoid assumptions of normality. h-current was activated in voltage clamp using 3 second duration hyperpolarizing voltage steps. Tail currents were produced by these voltage steps starting from and returning to a holding potential of −40mV and stepping to hyperpolarized holding potentials ranging in 10mV increments from −120mV to −50mV. h-current amplitudes were measured as the difference between the instantaneous tail current response and the steady state tail current response. h-current steady state activation curves were measured by fitting the difference between instantaneous tail current and steady state tail current amplitude responses to Boltzman equations of the following form:
Where I is the normalized steady state membrane current at membrane potential V, V1/2 is the membrane potential that gives rise to the half maximal current response and k is the slope of the steady state activation curve. h-current activation time constants were measured by fitting the membrane tail current responses to single or double exponential equations.
Subthreshold membrane potential resonance was measured according to Heys et al (2010). In current clamp the membrane potential was recorded in response to an injection of a constant amplitude sinusoidal current stimulus that increased linearly from 0 to 20Hz over 20 seconds. The impedance profile was measured by taking the Fast-Fourier Transform of the voltage response divided by the Fast-Fourier Transform of the injected current and the resonance frequency was defined as the frequency of current stimulation at the peak of the impedance profile.
Results
Previous research from single cell recordings using the in vitro slice preparation have demonstrated that Ih plays an important role in the function of mEC SCs (Alonso and Llinas, 1989; Dickson et al 2000; Giocomo and Hasselmo, 2008; Giocomo and Hasselmo 2009) that may influence properties of neurons tested by unit recordings in awake-behaving animals (Hafting et al., 2005; Giocomo et al, 2011). It is also clear from previous work that it is possible to modulate Ih through regulation of several distinct neuromodulatory systems (Ma et al., 2007, Rosenkranz et al., 2006, Pian et al., 2007). However, since H-channel composition is a function of the expression of several possible combinations of HCN subunits and regulatory subunits, it is not possible to predict the effect of each modulatory system across different cells types in distinct brain regions. To this end we have used whole cell patch clamp recordings of SCs in the slice preparation and isolated Ih in voltage clamp to study the effects of activating specific neuromodulatory pathways. From an initial holding potential of −40mV cells were hyperpolarized to potentials that activate Ih (Fig. 1A). H-current amplitude was measured by comparing the difference between the instantaneous (peak) tail current amplitude and the steady state current amplitude (Figure 1A, inset). After bath application of the muscarinic acetylcholine receptor agonist, carbachol (10μM; CCh), there was a significant decrease in the h-current amplitude (Fig. 1B) as shown by a decrease in the instantaneous (peak) tail current. The population averages show that the mean maximum tail current amplitude, as measured after a step from a hyperpolarized holding potential of −120mV to a holding potential of −40mV, decreased by 250.97 ± 24.18 pA after application of CCH (p<0.01, n=25) (Fig 1C). Carbachol produced a shift in the mean V1/2 of the activation curve shifts from −79.28 ± 0.63 mV in control ACSF to −84.05 ± 0.61 mV in CCh (p<0.01, n=25) (Fig 1D) and produced a leftward shift in the normalized activation curve of Ih (Fig 1E).
Figure 1. Analysis of Ih tail current magnitude in the presence and absence of carbachol.
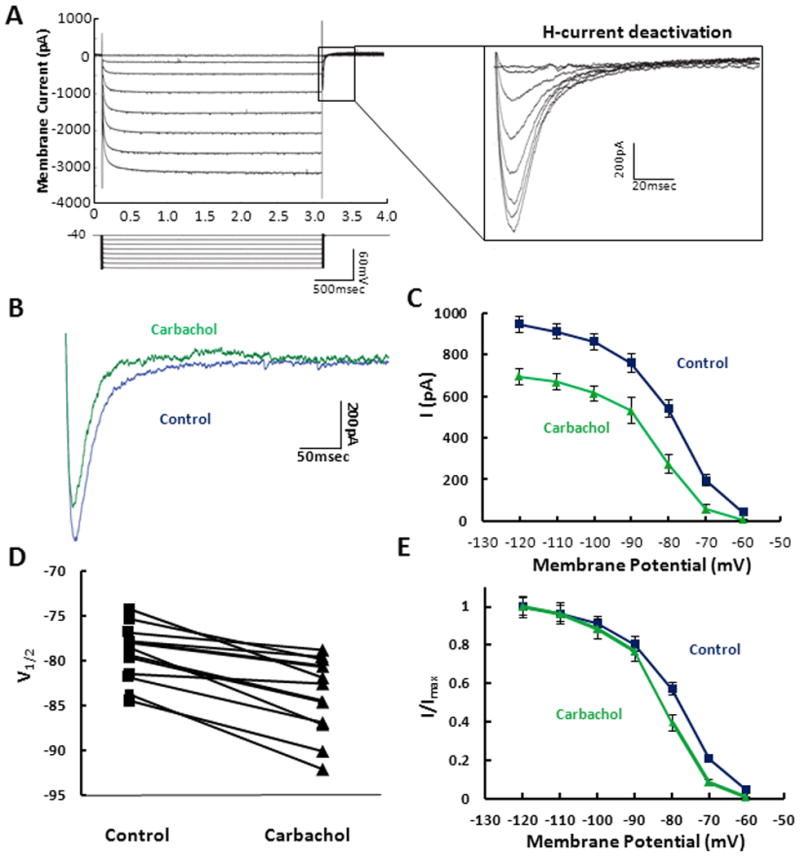
A. Ih tail currents were obtained using three second hyperpolarizing voltage steps starting from and returning to a holding potential of −40mV. Inset: For each voltage step used to activate Ih, the tail current was measured as the difference between the minimum point of the tail current, that is observed after the step back to −40mV, and the steady state current value. B. Individual example tail currents are shown in control (blue) and after 10 minute bath application of 10μM carbachol (green). C. Population averages demonstrate that carbachol significantly decreases the tail current measured at −40mV after stepping from a series of holding potentials (−120mV to −50mV). D. V1/2 values, generated using the fits in Figure 1D, are measured across individual cells for control (square) and for carbachol (triangle). E. Tail current activation curves obtained in control (blue square) and in the presence of carbachol (green triangle) are shown normalized to maximum current.
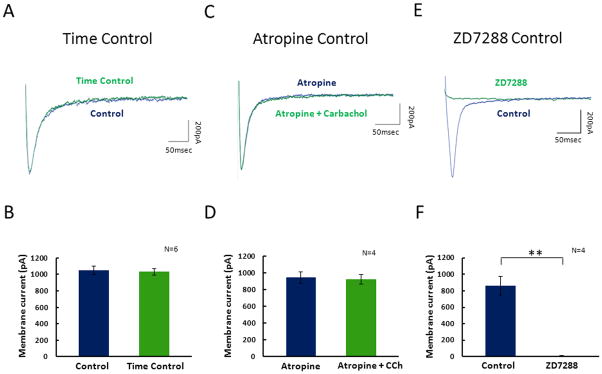
One of the primary concerns with whole cell patch clamp experiments is the electrophysiological artifacts that can be caused due to biochemical washout induced by whole cell patch clamp dialysis. To control for this potential problem a separate set of SCs were patch clamped for 1.5 times the length of the period used for drug wash experiments (15 minutes total). Ih tail current amplitudes were measured in control ACSF before the delay and in the same control ACSF after the 15 minute wait period which is referred to as the time control condition. The Ih tail current measured at steps from −120mV to −40mV in control ACSF before the delay was 1036.5±49.8pA and in control ACSF after the time control period the Ih tail current was 1025.7±48.1pA (p=0.8728, n=6) (2A & 2B). In addition to the lack of a change in the tail current measured at −120mV, there were no significant changes in the tail current amplitude measured after steps returning from other potentials ranging from −50mV to −120mV (data not shown). To ensure CCh dependent modulation of Ih is acting through activation of mAChRs, tail currents were measured in 1μM atropine, a competitive mAChR antagonist and measured after subsequent application of 1uM atropine with 10μM CCh. No significant change was observed after application of CCh with atropine, suggesting that the cholinergic effects shown in Figure 1 are in fact acting through mAChRs (2C, 2D). The average Ih tail current amplitude measured after steps from a hyperpolarized holding potential of −120mV to a holding potential of −40mV in atropine was 945.0 ± 71.8pA and after application of 10 μM CCh with atropine the Ih tail current was 927.7 ± 63.9pA (p=0.564, n=4) (2A & 2B). In addition to the lack of a change of the tail current measured after steps from −120mV, there were no significant changes in the tail current amplitude measured after steps returning from other potentials ranging from −50mV to −120mV (data not shown). To ensure that the current measured throughout this study is solely Ih, tail-currents were measured in control and after application of 100μM ZD7288. Shown in figure 2E the tail current was completely eliminated after application of ZD7288. The tail current was measured to be 859.4±114.8pA in control conditions and 0.8±11.7pA after application of ZD7288 (p<0.01; n=4) (2F).
Figure 2. Control experiments demonstrate that modulation of the Ih is caused by activation of muscarinic acetylcholine receptors and is not caused by wash-out.
A. Ih tail currents were analyzed in control ACSF before a delay (blue) and in the same control ACSF after a 15 minute holding period (green) as shown in this example. B. Averages across all cells demonstrate no significant change in the Ih tail current magnitude after application of carbachol. C. Ih tail currents were analyzed in atropine (blue) and in atropine with carbachol (green). D. Averages across all cells demonstrate no significant change in the Ih tail current magnitude after application of carbachol with atropine. E. The tail current protocol was used in control and after bath application of ZD7288. F. After application of ZD7288 the tail current amplitude is completely abolished.
Seminal work from DiFrancesco and Tortora (1991) demonstrated that the voltage dependence of Ih activation, expressed in sino-atrial node myocytes, can be significantly altered though modulation of cyclic nucleotides. As such, we tested whether increasing cAMP levels through application of forskolin could also modulate Ih in SCs of entorhinal cortex. Bath application of 50μM forskolin caused a significant increase in the Ih tail current (Fig. 3A). From the tail current measured at the maximum activation potential of −120mV, Ih amplitude increased by 109.0 ± 19.1 pA after application of forskolin (p<0.05, n=10) as shown in Fig 3B. The Boltzman fits for the steady state activation curves demonstrate that cAMP causes a shift in the V1/2 from −77.98 ± 0.92 mV in control ACSF to −71.5 ± 0.61 mV after application of forskolin (Fig. 3C) and a rightward shift in the activation curve (p<0.05, n=10) (Fig. 3D).
Figure 3. cAMP modulation of Ih tail current.
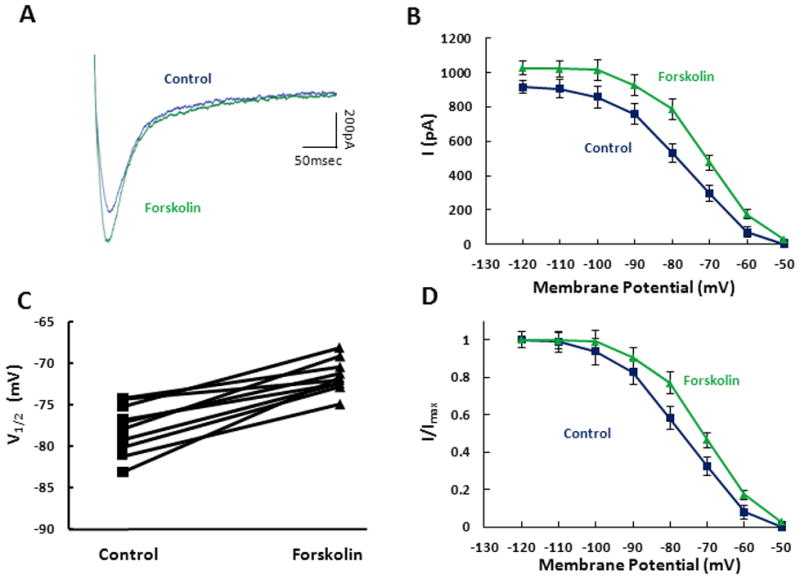
A. Individual tail currents were measured in control (blue) and after 10 minute bath application of 50μM forskolin (green). B. Population averages demonstrate that forskolin significantly increases the tail current measured at −40mV after stepping from a series of holding potentials (−120mV to −50mV). C. The V1/2 values, generated from Boltzman fits to the normalized activation curves, are measured across individual cells for control (square) and for forskolin (triangle). D. Tail current activation curves obtained in control (blue square) and in the presence of forskolin (green triangle) are shown normalized to maximum current.
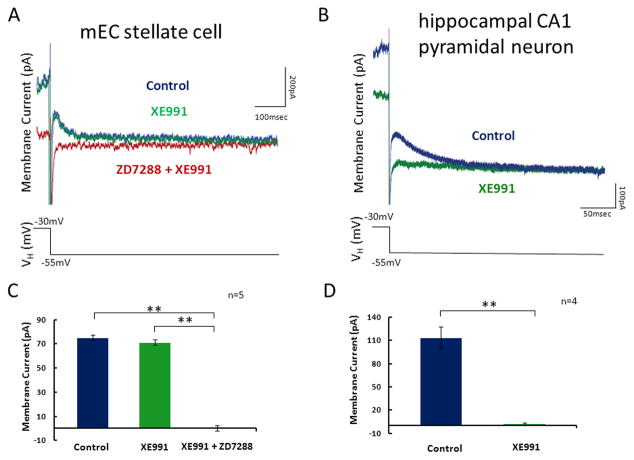
Previous work has suggested that the M-current may be responsible for subthreshold membrane potential oscillations in SCs and membrane potential resonance at more depolarized potentials (Yoshida and Alonso, 2007; Heys et al, 2010). As such we sought to provide the first direct measurement of M-current in mEC SCs in voltage clamp. Surprisingly, when using the standard deactivation protocol to identify M-current, we found no evidence to suggest M-current is expressed in SCs (Figure 4A). Compared to recordings in control ACSF, application of the selective M-current blocker XE911 does not produce a significant change in the membrane current generated during a step from −30mV to −55mV (p=0.81, n=5) (Fig. 4B). This is in contrast to subsequent application of h-current blocker ZD7288, which completely eliminates the rectifying current that is generated in the control and XE991 condition during the step from −30 mV to −55mV (p<0.01, n=5) (Fig 4A & Fig 4B). It has been previously demonstrated that M-current is present in pyramidal neurons in the CA1 region of the hippocampus (Halliwell and Adams, 1982; Storm, 1990). As a positive control, recordings were made from CA1 pyramidal neurons and results confirm the previous findings, demonstrating that M-current is present in these CA1 pyramidal neurons (Figure 4C). During a step from −30mV to −55mV, the rectifying current is completely abolished after application of XE991 (p<0.01, n=4) (Fig. 4D). It should be noted that the horizontal slices used for recordings in mEC also contain CA1 pyramidal neurons and the recordings of either SCs in mEC or CA1 pyramidal neurons were made from locations that span the dorsal-ventral extent of the hippocampus and parahippocampal region.
Figure 4. Analysis of IM in stellate neurons and CA1 pyramidal neurons in the hippocampus.
A. Whole cell patch clamp recordings were made in mEC layer II stellate cells. Tail currents measured during voltage steps to −55mV from a holding potential of −30mV in control ACSF (blue), after application of XE991 (green) and finally after application of XE991 with ZD7288 (red). B. Populations averages demonstrate that there is no significant change in the membrane current response between control ACSF and XE991. After subsequent application of ZD7288 the rectifying membrane current is completely abolished. C. Whole cell patch recordings were made in hippocampal CA1 pyramidal neurons. Tail currents were measured in control ACSF (blue) and after application of XE991. Tail currents measured during voltage steps to −55mV from a holding potential of −30mV in control ACSF (blue) and after application of XE991 (green). D. Populations averages demonstrate that application of XE991 removes the membrane current.
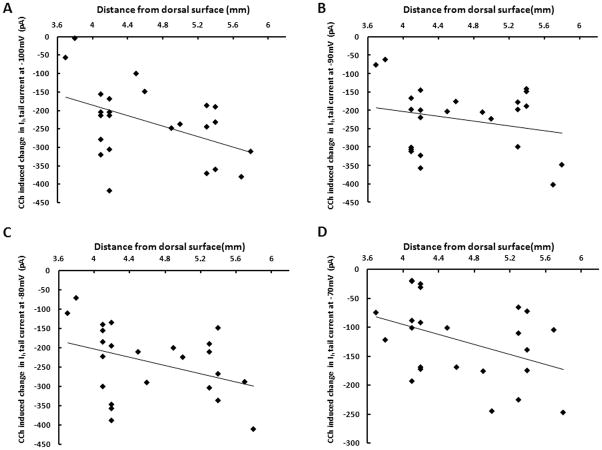
Cholinergic modulation of membrane potential resonance in mEC SCs suggested that modulation occurs differentially along the dorsal to ventral axis of mEC (Heys et al, 2010). Our new data from this current study elucidate the ionic mechanism underlying that previous result by demonstrating that Ih modulation occurs at significantly higher levels in ventral mEC (Figure 5). Figure 5A–D depicts the change in Ih tail current amplitude after application of CCh, measured at a holding potential of −40mV after steps back from −100mV, −90mV, −80mV and −70mV.
Figure 5. Cholinergic modulation of Ih tail current differs along the dorsal-ventral axis of medial entorhinal cortex.
A. Changes in tail current amplitudes induced by carbachol (CCh) at steps from a holding potential of −100mV to −40 mV, plotted against the dorsal-ventral anatomical location of the stellate cell relative to the dorsal surface of the brain. The linear fit demonstrates significantly larger cholinergic modulation of the Ih tail current in ventral mEC (p=0.024, n=24). B. For changes in tail current amplitudes induced by carbachol at steps from −90mV to −40 mV, the linear fit demonstrates a trend towards larger cholinergic modulation of the Ih tail current in ventral mEC (p=0.268, n=24). C. Changes in tail current amplitudes measured at steps from −80mV to −40mV show a significantly larger cholinergic modulation of the Ih tail current in ventral mEC (p=0.041, n=24). D. Changes in tail current amplitudes measured at steps from −70mV to −40mV show a significantly larger cholinergic modulation of the Ih tail current in ventral mEC (p=0.0467, n=24).
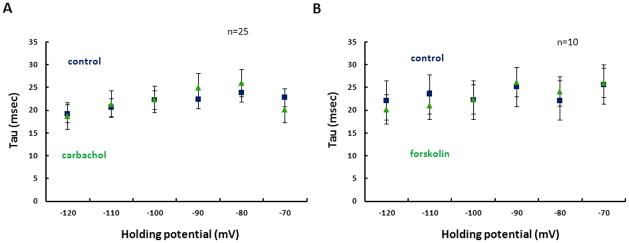
The time constant of Ih activation was measured by fitting a single exponential to the membrane current generated during hyperpolarizing steps from a holding potential of −40mV. In contrast to studies using heterologous expression of HCN1, HCN2 and muscarinic acetylcholine receptors which show a cholinergic dependent 1.5–2 fold slowing of the Ih time constant (Pian et al., 2006; Pian et al., 2007), we found no significant change in the time course of Ih activation after application of CCh at all membrane potentials measured (Fig. 6A). Similarly, there was no significant change in the Ih activation time constant after application of forskolin (Fig. 6B).
Figure 6. Time course of activation of Ih.
A. Time constants of Ih activation are shown in control (blue) and in carbachol (green) across hyperpolarized holding potentials ranging from −120mV to −70mV. B. Time constants of Ih activation are shown in control (blue) and in forskolin (green) across hyperpolarized holding potentials from −120mV to −70mV.
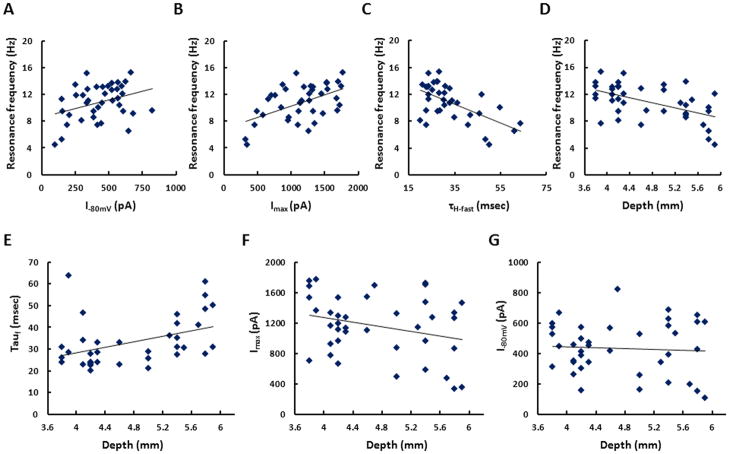
Our results demonstrate that magnitude of Ih can be both up and down regulated through neuromodulation. In order to correlate the physiological properties of Ih to the characteristic membrane potential resonance present in SCs, we performed voltage clamp and current clamp recordings in the same neurons. The h-current tail current amplitude after steps to −80mV and −120mV, where Ih is fully activated, correlate positively which membrane potential resonance frequency (p<0.05, n=39; p<0.01, n=39) (Fig 7A & 7B). These results suggest that the cholinergic dependent decrease in Ih could be responsible for the cholinergic dependent decrease in membrane potential resonance frequency show in Heys et al, 2010. This data has important implications for grid cell properties which will be discussed below. While the results do not show a neuromodulatory effect upon the time constant of Ih, the data does show a clear negative relationship between the h-current time constant and the membrane potential resonance frequency (p<0.01, n=36) (Fig. 7C). Consistent with findings from Giocomo et al 2007 and Giocomo and Hasselmo 2008, we found that resonance frequency and the Ih activation time constant differed significantly along the dorsal to ventral axis of mEC (Fig 7D & 7E). The linear fit to the data demonstrates that at a membrane potential of −75mV, the resonance frequency moves from a mean of 12.6Hz at the most dorsal aspect of mEC to 8.4Hz at the most ventral location in mEC. However, the change in amplitude of Ih along the dorsal-ventral axis is less clear. Similar to Garden et al (2008), the tail current protocol measured at steps from −120mV to −40mV suggests a trend towards larger Ih amplitude in neurons at more dorsal locations of mEC, but the trend does not reach criteria for statistical significance (p=0.081, n=39) (Fig. 7F). Furthermore, at steps from more depolarized potentials to −40mV the distribution of Ih amplitude appears to be uniform along the dorsal-ventral axis (p=.7197, n=39) (Fig. 7G).
Figure 7. Analysis of the baseline electrophysiological properties of stellate cells.
A. The magnitude of Ih tail current measured after voltage steps from −80mV to −40mV demonstrates a significant positive relationship with membrane potential resonance frequency (p=0.0354, n=39). B. Ih tail current measured at voltage steps from −120mV to −40mV demonstrates a significant positive relationship with membrane potential resonance frequency (p=0.0007, n=39). C. The time constant of Ih activation measured at voltage steps from −80mV to −40mV demonstrates a significant positive relationship with membrane potential resonance frequency (p=0.0001, n=36). D. The membrane resonance frequency decreases significantly from dorsal to ventral mEC (p=0.0117, n=36). E. The time constants of Ih activation increases significantly from dorsal to ventral mEC (p=0.0117, n=36). F. The maximum Ih tail current measure at voltage steps from −120mV to −40mV shows a trend towards larger amplitude in dorsal mEC, but this does not reach the criteria for statistical significance (p=0.081, n=39). G. There is no significant relationship between Ih tail current amplitude and dorsal-ventral location for tail currents measured at −80mV (p=0.7197, n=39).
Discussion
We have used whole cell voltage clamp recordings to isolate and pharmacologically modulate Ih, manipulating important neuromodulatory pathways. Our data shows that activation of muscarinic cholinergic receptors causes a decrease in the amplitude of the h-current and hyperpolarizing shift of the h-current activation curve. In contrast, our data shows that activation of the cAMP pathway with forskolin causes an increase in the amplitude and a depolarizing shift in the h-current activation curve. Our previous research demonstrates that activation of muscarinic cholinergic receptors produces a decrease in the membrane potential resonance frequency (Heys et al., 2010). The results from the present study resolve questions of which particular ionic mechanism(s) is responsible for this decrease in resonance. In particular Ih amplitude, and not the time course of Ih or Im, is responsible for the cholinergic dependent decrease in membrane potential resonance observed in mEC layer II SCs. Furthermore, the larger cholinergic dependent decrease in membrane potential resonance frequency in ventral SCs is likely to be caused by the larger cholinergic dependent decrease in Ih shown in ventral SCs. Since there is an increase in the Ih activation time constant along the dorsal-ventral axis of mEC and no change in the time course of Ih activation due to cholinergic modulation, it can be argued that the Ih time constant is likely to be responsible for the systematic decrease in membrane potential resonance frequency along the dorsal-ventral axis in baseline conditions whereas differential cholinergic modulation of Ih amplitude could be responsible for the differential modulation of membrane potential resonance along the dorsal-ventral axis.
In addition to testing the specific effects of key neuromodulators upon Ih, we have tested the hypothesis that there must be distinct neuromodulatory pathways that are able to both up and down regulate Ih in the medial entorhinal cortex. The results demonstrate that pathways which up regulate cAMP are able shift the h-current activation curve significantly towards more depolarized potentials. In contrast, activation of mAChRs shifts the activation curve in the opposite direction towards more hyperpolarized potentials. Seminal work in the hippocampus demonstrates that release of norepinephrine and subsequent activation of beta-adrenergic receptors increases levels of cAMP (Palmer et al., 1973; Madison and Nicoll, 1986). Furthermore, there is evidence of projections from the locus coeruleus to the entorhinal cortex (Insuasti et al., 1987) and evidence of norepinephrine release in the entorhinal cortex which is significantly decreased through ablation of locus coeruleus (Fallon et al., 1978). Together this works suggests that cAMP dependent up enhancement of Ih in stellate cells could be occurring through noradrenergic release and beta-adrenergic receptor activation.
Based upon previous studies using heterologous expression of HCN1 and HCN2 subunits to form functional h-current channels and along with expression of mAChRs, we expected to observe a cholinergic dependent increase in the h-current time constant (Pian et al., 2007). This lack of any significant mAChR dependent change in the h-current time constant in mEC SCs demonstrates the difficulty associated with predicting modulatory effects across distinct cell types and highlights the need to investigate each case individually. The recent discovery of the PEX5R/Trip8b regulatory subunit demonstrates that cAMP and adrenergic modulation of the Ih activation is reduced when PEX5R/Trip8b is co-expressed with h-current channels (Zolles et al., 2009). As such, the lack of a cholinergic effect upon the time course of Ih activation in SCs shown in the present study might be explained by co-expression of PEX5R/Trip8b with h-current channels in stellate cells.
The h-current appears to play a significant role in regulating the neuronal properties of stellate cells in entorhinal cortex layer II. Using sag percentage as an indicator of the magnitude of Ih, the h-current expressed in SCs is nearly twice as large the h-current measured in all other known principal neurons in the entorhinal cortex (Alonso and Klink, 1993; Hamam et al., 2000; Hamam et al., 2002; Tahvildari and Alonso, 2005). Ih also plays a significant role in determining steady state cellular electrophysiology such as the resting potential and input resistance and in determining the dynamic responses such as AHP, membrane potential oscillations, membrane potential resonance and temporal integration (Dickson et al., 2000; Erchova et al., 2004; Fransen et al., 2004; Garden et al., 2008). Recent in vivo data has further exemplified the importance of this current by demonstrating Ih dependent changes in grid field spacing (Giocomo et al., 2011). The resonance properties mediated by h-current in stellate cells may contribute to the influence of theta rhythm oscillations on grid cell firing in the entorhinal cortex. Recent work has shown that reductions of theta rhythm oscillations in entorhinal cortex during infusions of muscimol or lidocaine in themedial septum are associated with a loss of grid cell spatial periodicity (Brandon et al., 2011; Koenig et al., 2011). Together with previous studies this work highlights the importance to study Ih in detail in order to understand the function of mEC SCs.
The results from the data presented in this paper have particularly important implications for grid cell function as several lines research suggest that neuromodulation of Ih may control grid field spacing and grid field size. In the study conducted by Giocomo and colleagues (2011), unit recordings from awake, behaving mice show that HCN1 knock-out mice have significantly larger grid field spacing and grid field size as compared to wild type mice. Work in slice experiments demonstrates that knock-out of the HCN1 subunit produces an approximately two-fold decrease in the Ih tail current amplitude at −75mV (Nolan et al., 2007). In addition, grid field spacing and grid field size increase as rodents explore novel environments and return to baseline spacing levels after repeated explorations of the same environment (Barry et al, 2009). Related to this finding, it is thought that levels of acetylcholine increase in the hippocampus during presentation of novel stimuli (Acquas et al., 1996). More recently it has been demonstrated, using amperometry, that levels of acetylcholine increase during tail pinch of anesthetized rats (Zhang et al., 2010). Together this collection of studies and the data presented in this study suggest that the cholinergic dependent decrease in Ih occurs as animals explore novel environments and this decrease in the amplitude of Ih may be responsible for the observed expansion of the grid field spacing and grid field size in the novel environment.
A number of studies have shown that blockade of muscarinic cholinergic receptors with scopolamine impairs memory encoding in a range of different tasks (Aigner and Mishkin, 1986; Ghoneim and Mewaldt, 1977; reviewed in Barry et al., 2012) including spatial memory tasks in rats (Wishaw, 1985; Buresova et al., 1986; McGurk et al., 1988; Blokland et al., 1992). The role in learning and memory appears to involve the entorhinal cortex, as shown with selective lesions of cholinergic innervation of the entorhinal cortex (McGaughy et al., 2005) and selective infusions of scopolamine into entorhinal cortex (Esclassan et al., 2009). Understanding the detailed cellular effects of muscarinic modulation on h-current in neurons of the medial entorhinal cortex will help us to understand how cellular effects of muscarinic modulation may be important for spatial memory function.
Acknowledgments
We thank A. Bogaard for programming assistance and L. Giocomo and N. Spruston for useful advice.
References
- Acquas E, Wilson C, Fibiger HC. Conditioned and unconditioned stimuli increase frontal cortical and hippocampal acetylcholine release: effects of novelty, habituation and fear. Journal of Neuroscience. 1996;16:3089–3096. doi: 10.1523/JNEUROSCI.16-09-03089.1996. [DOI] [PMC free article] [PubMed] [Google Scholar]
- Aigner TG, Mishkin M. The effects of physostigmine and scopolamine on recognition memory in monkeys. Behavioral and Neural Biology. 1986;45:81–87. doi: 10.1016/s0163-1047(86)80008-5. [DOI] [PubMed] [Google Scholar]
- Alonso AA, Llinas RR. Subthreshold Na+-dependent theta-like rhythmicity in stellate cells of entorhinal cortex layer II. Nature. 1989;342:175–177. doi: 10.1038/342175a0. [DOI] [PubMed] [Google Scholar]
- Barry C, Heys JG, Hasselmo ME. Possible role of acetylcholine in regulating spatial novelty effects on theta rhythm and grid cells. Frontiers in Neural Circuits. 2012;6:1–13. doi: 10.3389/fncir.2012.00005. [DOI] [PMC free article] [PubMed] [Google Scholar]
- Barry C, O’Keefe J, Burgess N. Effect of novelty on grid cell firing. Soc Neurosci Abstr. 2009;35:101.24. [Google Scholar]
- Blokland A, Honig W, Raaijmakers WGM. Effects of intro-hippocampal scopolamine injections in a repeated spatial acquisition task in the rat. Psychopharmacology. 1992;109:373–376. doi: 10.1007/BF02245886. [DOI] [PubMed] [Google Scholar]
- Buresova O, Bolhuis JJ, Bures J. Differential effects of cholinergic blockade on performance of rats in the water tank navigation task and in a radial water maze. Journal of Behavioral Neuroscience. 1986;100:476–482. doi: 10.1037//0735-7044.100.4.476. [DOI] [PubMed] [Google Scholar]
- Dickson CT, Magistretti J, Shalinsky MH, Fransen E, Hasselmo ME, Alonso AA. Properties and role of Ih in the pacing of subthreshold oscillations in entorhinal cortex layer II neurons. Journal of Neurophysiology. 2000;83:2562–2579. doi: 10.1152/jn.2000.83.5.2562. [DOI] [PubMed] [Google Scholar]
- DiFancesco D, Tortora P. Direct activation of cardia pacemaker channels by intracellularcyclic AMP. Nature. 1991;315:145–147. doi: 10.1038/351145a0. [DOI] [PubMed] [Google Scholar]
- Erchova I, Kreck G, Heinemann U, Herz AVM. Dynamics of rat entorhinal cortex layer II and III cells: characteristics of membrane potential resonance at rest predict oscillation properties near threshold. Journal of Physiology. 2004;560:89–110. doi: 10.1113/jphysiol.2004.069930. [DOI] [PMC free article] [PubMed] [Google Scholar]
- Esclassan F, Coutureau E, Di Scala G, Marchand AR. A cholinergic-dependent role for the entorhinal cortex in trace fear conditioning. Journal of Neuroscience. 2009;29:8087–8093. doi: 10.1523/JNEUROSCI.0543-09.2009. [DOI] [PMC free article] [PubMed] [Google Scholar]
- Fransen E, Alonso AA, Dickson CT, Magistretti J, Hasselmo ME. Ionic Mechanisms in the Generation of Subthreshold Oscillations and Action Potential Clustering in Entorhinal Layer II Stellate Neurons. Hippocampus. 2004;14:368–384. doi: 10.1002/hipo.10198. [DOI] [PubMed] [Google Scholar]
- Fyhn M, Hafting T, Treves A, Moser MB, Moser EI. Hippocampal remapping and grid realignment in entorhinal cortex. Nature. 2007;446:190–194. doi: 10.1038/nature05601. [DOI] [PubMed] [Google Scholar]
- Garden DLF, Dodson PD, O’Donnell, White MD, Nolan MF. Tuning of Synaptic Integration in medial entorhinal cortex to organization of the grid cell firing fields. Neuron. 2008;60:875–889. doi: 10.1016/j.neuron.2008.10.044. [DOI] [PubMed] [Google Scholar]
- Ghoneim MM, Mewaldt SP. Studies on human memory: The interactions of diazepam, scopolamine, and physostigmine. Psychopharmacology. 1977;52:1–6. doi: 10.1007/BF00426592. [DOI] [PubMed] [Google Scholar]
- Giocomo LM, Zilli EA, Fransen E, Hasselmo ME. Temporal frequency of subthreshold oscillations scales with entorhinal grid cell field spacing. Science. 2007;315:1719–1722. doi: 10.1126/science.1139207. [DOI] [PMC free article] [PubMed] [Google Scholar]
- Giocomo LM, Hasselmo ME. Time constant of I(h) differs along dorsal to ventral axis of medial entorhinal cortex. Journal of Neuroscience. 2008 doi: 10.1523/JNEUROSCI.3196-08.2008. in press. [DOI] [PMC free article] [PubMed] [Google Scholar]
- Giocomo LM, Hasselmo ME. Knock-out of HCN1 subunit flattens dorsal-ventral frequency gradient of medial entorhinal neurons in adult mice. Journal of Neuroscience. 2009;29:7625–7630. doi: 10.1523/JNEUROSCI.0609-09.2009. [DOI] [PMC free article] [PubMed] [Google Scholar]
- Giocomo LM, Hussaini SA, Zheng F, Kandel ER, Moser MB, Moser EI. Grid cells use HCN1 channels for spatial scaling. Cell. 2011;147:1159–1170. doi: 10.1016/j.cell.2011.08.051. [DOI] [PubMed] [Google Scholar]
- Haas JS, White JA. Frequency selectivity of layer II stellate cells in medial entorhinal cortex. Journal of Neurophysiology. 2002;88:2422–2429. doi: 10.1152/jn.00598.2002. [DOI] [PubMed] [Google Scholar]
- Hafting T, Fyhn M, Molden S, Moser MB, Moser EI. Microstructure of a spatial map in the entorhinal cortex. Nature. 2005;436:801–806. doi: 10.1038/nature03721. [DOI] [PubMed] [Google Scholar]
- Halliwell JV, Adams PR. Voltage-Clamp Analysis of Muscarinic Excitation in Hippocampal Neurons. Brain Research. 1982;250:71–92. doi: 10.1016/0006-8993(82)90954-4. [DOI] [PubMed] [Google Scholar]
- Hamam BN, Kennedy TE, Alonso AA, Amaral DG. Morphological and electrophysiological characteristics of layer V neurons of the rat medial entorhinal cortex. Journal of Comparative Neurology. 2000;418:457–472. [PubMed] [Google Scholar]
- Hamam BN, Amaral DG, Alonso AA. Morphological and electrophysiological characteristics of layer V neurons of the rat lateral entorhinal cortex. Journal of Comparative Neurology. 2002;451:45–61. doi: 10.1002/cne.10335. [DOI] [PubMed] [Google Scholar]
- Heys JG, Giocomo LM, Hasselmo ME. Cholinergic modulation of the resonance properties of stellate cells in layer II of medial entorhinal cortex. J Neurophysiol. 104:258–270. doi: 10.1152/jn.00492.2009. [DOI] [PMC free article] [PubMed] [Google Scholar]
- Hu H, Vervaeke K, Storm JF. Two forms of electrical resonance at theta frequencies, generated by M-current, h-current and persistent Na+ current rat hippocampal pyramidal cells. Journal of Physiology. 2002;3:783–805. doi: 10.1113/jphysiol.2002.029249. [DOI] [PMC free article] [PubMed] [Google Scholar]
- Insausti R, Amaral DG, Cowan WM. The entorhinal cortex of the monkey: III. Subcortical afferents. The Journal of Comparative Neurology. 1987;264:396–408. doi: 10.1002/cne.902640307. [DOI] [PubMed] [Google Scholar]
- Klink R, Alonso A. Ionic mechanisms of muscarinic depolarization in entorhinal cortex layer II neurons. Journal of Neurophysiology. 1997;77:1813–1828. doi: 10.1152/jn.1997.77.4.1829. [DOI] [PubMed] [Google Scholar]
- Koenig J, Linder AN, Leutgeb JK, Leutgeb S. The spatial periodicity of grid cells is not sustained during reduced theta oscillations. Science. 2011;332:592–595. doi: 10.1126/science.1201685. [DOI] [PubMed] [Google Scholar]
- Ma L, Shalinsky MH, Alonso A, Dickson CT. Effects of Serotonin on the Intrinsic Membrane Properties of Layer II Medial Entorhinal Cortex Neurons. Hippocampus. 2007;17:114–129. doi: 10.1002/hipo.20250. [DOI] [PubMed] [Google Scholar]
- Madison DV, Nicoll RA. Cyclic adenosine 3′, 5′-monophosphate mediates β-receptor actions of noradrenaline in rat hippocampal pyramidal cells. Journal of Physiology. 1986;372:245–259. doi: 10.1113/jphysiol.1986.sp016007. [DOI] [PMC free article] [PubMed] [Google Scholar]
- McGaughy J, Koene RA, Eichenbaum H, Hasselmo ME. Cholinergic deafferentation of the entorhinal cortex in rats impairs encoding of novel but not familiar stimuli in a delayed nonmatch-to-sample task. Journal of Neuroscience. 2005;25:10273–10281. doi: 10.1523/JNEUROSCI.2386-05.2005. [DOI] [PMC free article] [PubMed] [Google Scholar]
- McGurk SR, Levin ED, Butcher LL. Cholinergic-dopaminergic interactions in radial-arm maze performance. Behavioral and Neural Biology. 1988;49:234–239. doi: 10.1016/s0163-1047(88)90539-0. [DOI] [PubMed] [Google Scholar]
- Moser EI, Moser MB. A metric for space. Hippocampus. 2008;18:1142–1156. doi: 10.1002/hipo.20483. [DOI] [PubMed] [Google Scholar]
- Nolan MF, Dudman JT, Dodson JT, Santor B. HCN1 channels control resting and active integrative properties of stellate cells from layer II of the entorhinal cortex. Journal of Neuroscience. 2007;27:12440–12451. doi: 10.1523/JNEUROSCI.2358-07.2007. [DOI] [PMC free article] [PubMed] [Google Scholar]
- O’Keefe J, Dostrovsky J. The hippocampus as a spatial map. Preliminary evidence from unit activity in the freely-moving rat. Brain Res. 1971;34:171–175. doi: 10.1016/0006-8993(71)90358-1. [DOI] [PubMed] [Google Scholar]
- Palmer GC, Sulser F, Robinson GA. Effects of neurohumoral and adrenergic agents on cyclic AMP levels in various areas of the rat brain in vitro. Neuropharmacology. 1973;12:327–337. doi: 10.1016/0028-3908(73)90092-0. [DOI] [PubMed] [Google Scholar]
- Pian P, Bucchi A, DeCostanzo A, Robinson RB, Siegelbaum SA. Modulation of cyclic nucleotide-regulated HCN channels by PIP2 and receptors coupled to phospholipase C. European Journal of Neuroscience. 2007;125:145–162. doi: 10.1007/s00424-007-0295-2. [DOI] [PubMed] [Google Scholar]
- Pian P, Bucchi A, Robinson RB, Siegelbaum SA. Regulation of gating and rundown of HCN hyperpolarization-activated channels by exogenous and endogenous PIP2. Journal of General Physiology. 2006;128:593–604. doi: 10.1085/jgp.200609648. [DOI] [PMC free article] [PubMed] [Google Scholar]
- Rosenkranz JA, Johnston D. Dopaminergic Regulation of Neuronal Excitability through Modulation of Ih in Layer V Entorhinal Cortex. Journal of Neuroscience. 2006;26(12):3229–3244. doi: 10.1523/JNEUROSCI.4333-05.2006. [DOI] [PMC free article] [PubMed] [Google Scholar]
- Storm JF. Potassium Currents in Hippocampal Pyramidal Cells. Progress in Brain Research. 1990;83:161–187. doi: 10.1016/s0079-6123(08)61248-0. [DOI] [PubMed] [Google Scholar]
- Tahvildari B, Alonso A. Morphological and electrophysiological properties of lateral entorhinal cortex layer II and II principal neurons. Journal of Comparative Neurology. 2005;491:123–140. doi: 10.1002/cne.20706. [DOI] [PubMed] [Google Scholar]
- Whishaw IQ. Cholinergic receptor blockade in the rat impairs locale but not taxon strategies for place navigation in a swimming pool. Behavioral Neuroscience. 1985;99:979–1005. doi: 10.1037//0735-7044.99.5.979. [DOI] [PubMed] [Google Scholar]
- Yoshida M, Alonso A. Cell-Type-Specific Modulation of Intrinsic Firing Properties and Subthreshold Membrane Oscillations by the M(Kv7)-Current in Neurons of the Entorhinal Cortex. Journal of Neurophysiology. 2007;98:2779–2794. doi: 10.1152/jn.00033.2007. [DOI] [PubMed] [Google Scholar]
- Zhang H, Shih-Chieh L, Nicolelis MAI. Spatiotemporal coupling between hippocampal acetylcholine release and theta oscillations in vivo. Journal of Neuroscience. 2010;30:13431–13440. doi: 10.1523/JNEUROSCI.1144-10.2010. [DOI] [PMC free article] [PubMed] [Google Scholar]
- Zolles G, Wenzel D, Bildl W, Schulte U, Hofmann A, Muller CS, Thumfart JO, Vlachos A, Deller T, Pfeifer A, Bernd KF, Roeper J, Fakler B, Klocker N. Associations with the Auxiliar Subunit PEX5R/Trip8b Controls Responsiveness of HCN Channels to cAMP and Adrendergic Stimulations. Neuron. 2009;62:814–825. doi: 10.1016/j.neuron.2009.05.008. [DOI] [PubMed] [Google Scholar]


