

Abstract
Objective
Test the hypotheses that humans with genotypes putatively associated with low dopamine (DA) signaling capacity, including the TaqIA A1 allele, DRD2-141C Ins/Ins genotype, DRD4 7-repeat or longer allele, DAT1 10-repeat allele, and the Met/Met COMT genotype, and with a greater number of these genotypes per a multilocus composite, show less responsivity of reward regions that primarily rely on DA-signaling.
Design
Functional magnetic resonance imaging (fMRI) paradigms were used to investigate activation in response to receipt and anticipated receipt of palatable food and monetary reward. DNA was extracted from saliva using standard methods.
Participants
One-hundred and sixty adolescents (Mean age = 15.3, SD = 1.07; Mean BMI = 20.8, SD = 1.9).
Main Outcome
Blood oxygen level dependent activation in the fMRI paradigms.
Results
Data confirmed that these fMRI paradigms activated reward, attention, somatosensory, and gustatory regions. Individuals with versus without these five genotypes did not show less activation of DA-based reward regions, but those with the Met/Met versus the Val/Val COMT genotype showed less middle temporal gyrus activation and those with the DRD4-L versus the DRD4-S genotype showed less middle occipital gyrus activation in response to monetary reward. Critically, the multilocus composite score revealed that those with a greater number of these genotypes showed less activation in reward regions, including the putamen, caudate, and insula, in response to monetary reward.
Discussion
Results suggest that the multilocus genetic composite is a more sensitive index of vulnerability for low reward region responsivity than individual genotypes.
Keywords: dopamine-related genotypes, TaqIA, DRD4, COMT, DAT1, fMRI, reward sensitivity
Introduction
Palatable food and drugs activate reward circuitry that primarily relies on DA-signaling for synaptic transmission and less responsivity of this circuitry may increase risk for overeating and substance use (Kenny, 2011). Several genotypes are associated with putatively low DA signaling. Individuals with an A1 allele versus the A2/A2 allele of the Taq1A polymorphism and those with the Ins/Ins genotype versus a Del allele of the DRD2-141C Ins/Del polymorphism show fewer D2 receptors (Jönsson et al., 1999). Those with the 7-repeat or longer allele (DRD4-L) versus shorter alleles of the DRD4 genotype show less in vitro DA functioning and poorer response to DA agonists (Asghari et al., 1995; Seeger et al., 2001). Individuals homozygous for the 10-repeat allele (DAT1-L) versus a 9-repeat allele show lower DAT1 expression (Heinz et al., 2000), which theoretically reduces synaptic DA clearance, producing higher basal DA levels and blunted phasic DA release (van Dyck et al., 2005). A single nucleotide exchange in the Catechol-O-methyltransferase (COMT val158met) gene, which causes a 4-fold reduction in COMT activity in Met homozygotes versus Val homozygotes (Grossman et al., 1992), putatively causes the former to have increased tonic DA levels in the striatum and less phasic DA release (Lachman et al., 1996).
Consistent with hypotheses, individuals with the TaqIA A1 allele showed less activation of the orbitofrontal cortex (OFC), amygdala, and hippocampus to monetary reward (Cohen et al., 2005) and less activation in the midbrain, thalamus, and OFC to food reward (Felsted et al., 2010), those with DAT1-L, DRD4-L, and Met COMT genotypes showed less smoking-induced caudate and nucleus accumbens DA release (Brody et al., 2006), and those with the DAT1-L and DRD2-141C Ins/Ins genotype showed less ventral striatum response to monetary reward (Forbes et al., 2009); individuals from this latter sample with a greater number of the TaqIA A1, DRD4-S, DAT1-L, Val COMT, and DRD2-141C Ins/Ins genotype showed less ventral striatal response to monetary reward (Nikolova et al., 2011). Yet, other findings are inconsistent with hypotheses (Brody et al., 2006; Forbes et al., 2009; Kirsch et al., 2006; London et al., 2009; Nikolova et al., 2011; Yacubian et al., 2007). For instance, individuals with the DRD4-L genotype showed greater, rather than less, ventral striatal response to monetary reward (Forbes et al., 2009) and individuals with the TaqIA A1, DRD2-141C Ins/Ins genotype, DRD4-L, DAT1-L, and COMT Met/Met genotypes did not show differential reward circuitry responsivity to monetary reward (Nikolova et al., 2011).
Given the mixed findings, we tested whether individuals with versus without these genotypes showed less neural responsivity using fMRI paradigms assessing response to receipt and anticipated receipt of an endogenous reward (palatable food) and a conditioned reward (money) in a larger sample, which should increase sensitivity. The larger sample also allowed use of whole-brain analyses, permitting a broader examination of functionality. Critically, we tested whether individuals with a greater number of the alleles associated with low DA-signaling capacity showed less reward region response as Nikolova et al. (2011) found that a multilocus genetic score was more sensitive to detecting variation in reward region responsivity than the individual genotypes.
Methods
Participants
Participants were 160 lean adolescents (Mean age = 15.3, SD = 1.07; Mean BMI = 20.8, SD = 1.9). The sample consisted of 79 males and 81 females of which 4.3% reported being Hispanic, 0.6% Asian, 77.6% European Americans, 0.6% Native American, and 16.1 mixed races. Among the 26 participants who endorsed mixed ancestry, the following combinations were reported: American Indian/Alaska Native – Caucasian (15%), African American – Caucasian (23%), Asian – Caucasian (8%), American Indian/Alaska Native – Hispanics (8%), Caucasian – Hispanics (42%), and American Indian/Alaska Native – Pacific Islander – Caucasian (4%). The COMT genotype could not be determined for 4 participants and the DRD2-141C Ins/Del polymorphism could not be determined for 5 participants; therefore analyses involving those genotypes included 156 and 155 participants, respectively. The sample’s genetic characteristics can be seen in Table 1. Parents provided written informed consent and adolescents provided written assent. Individuals who reported binge eating or compensatory behavior in the past 3 months, any current use of psychotropic medications or illicit drugs, head injury with a loss of consciousness, or Axis I psychiatric disorder in the past year (including anorexia nervosa, bulimia nervosa, or binge eating disorder), as determined by K-SADS-E screening items (Orvaschel, 1994), were excluded.
Table 1.
Descriptive Statistics for the Genotype Groups Studied
| Genotype | N | DA profile score | Ethnicity |
|---|---|---|---|
| TaqIA | |||
| A1/A1 | 5 (80% female) | Low | 80% Caucasian; 20% mixed races |
| A1/A2 | 57 (40.4% female) | Intermediate | 3.5% Hispanic; 1.8% American Indian/Alaska Native; 1.8% Asian; 70.2% Caucasian; 22.8% mixed races |
| A2/A2 | 98 (55.1% female) | High | 5% Hispanic; 79% Caucasian; 14% mixed races |
| COMT Val158 Met | |||
| Met/Met | 40 (50% female) | Low | 2.5% Hispanic; 82.5% Caucasian; 15% mixed races |
| Met/Val | 83 (53.7% female) | Intermediate | 3.6% Hispanic; 1.2% American Indian/Alaska Native; 1.2 Asian; 73.5% Caucasian; 20.5% mixed races |
| Val/Val | 33 (48% female) | High | 6.1% Hispanic; 75.8% Caucasian; 18.2% mixed races |
| DRD2 -141C Ins/Del | |||
| Ins/Ins | 117 (53.0% female) | Low | 4.3% Hispanic; 0.9% American Indian/Alaska Native; 82.1% Caucasian; 12.8% mixed races |
| Ins/Del | 36 (44.4% female) | Intermediate | 5.6% Hispanic; 69.4% Caucasian; 25.0% mixed races |
| Del/Del | 2 (0% female) | High | 50.0% Caucasian; 50% mixed races |
| DRD4 | |||
| DRD4-L | 68 (54.4% female) | Low | 5.9% Hispanic; 75% Caucasian; 13% mixed races |
| DRD4-S | 92 (47.8% female) | High | 3.3% Hispanic; 1.1% American Indian/Alaska Native; 1.1% Asian; 77.2% Caucasian; 17.4% mixed races |
| DAT1 | |||
| 10R/10R | 88 (53.4% female) | Low | 5.7% Hispanic; 1.1% Asian; 77.3% Caucasian; 15.9% mixed |
| 9R/10R | 68 (44.1% female) | Intermediate | 2.9% Hispanic; 1.5% American Indian/Alaska Native; 75% Caucasian; 20.6% mixed races |
| 9R/9R | 4 (100% female) | High | 100% Caucasian |
Genotyping
Participants were asked to provide saliva, from which epithelial cells were collected, using a commercial product, Oragene® (DNAgenotek, Ottawa, ON, Canada). DNA was extracted from the samples using standard salting-out and solvent precipitation methods, yielding an average of 45 μg of DNA.
The TaqIA (rs1800497), COMT val158met (rs4680), and DRD2-141C Ins/Del (rs1799732) assays were done using a fluorogenic 5′ nuclease (Taqman®, ABI, Foster City, CA) method (Haberstick and Smolen, 2004) on an ABI Prism® 7000 Sequence Detection System via the allelic discrimination mode (Livak, 1999). Reactions containing 20 ng of DNA were performed in 10 μl reactions with TaqMan® Universal PCR Master Mix using the standard cycling conditions. Sequences of the TaqIA primers and probes are: Forward Primer: 5′-GTGCAGCTCACTCCATCCT-3′; Reverse Primer: 5′-GCAACACAGCCATCCTCAAAG-3′; A1 Probe: 5′-VIC-CCTGCCTTGACCAGC-MGB-3′; A2 Probe: 5′-FAM-CTGCCTCGACCAGC-MGB-3′. Each 96 well plate included non-template and DNA standards of known genotype. Three genotype groups were defined for TaqIA: A1 homozygotes (n = 5), A1/A2 heterozygotes (n = 57), and A2 homozygotes (n = 98). The TaqIA site resides in exon 8 of the ANKK1 gene on the opposite strand. This SNP results in a glutamate-to-lysine (E713K) substitution within the eleventh ankyrin repeat of ANKK1, prompting the suggestion that changes in ANKK1 activity may be responsible for some of the associations attributed to this genotype (Neville et al., 2004). For the COMT val158met assay, forward and reverse primers, and allele specific probes were kindly provided by Dr. Daniel Weinberger (Mattay et al., 2003; and personal communication): Forward Primer: 5′-TCGAGATCAACCCCGACTGT-3′; Reverse Primer: 5′-AACGGG-TCAGGCATGCA-3′; Val Probe: 5′-FAM-CCTTGTCCTTCACGCCAGCGA-MGB-3′; Met Probe: 5′-VIC-ACCTTGTCCTTCATGCCAGCGAAAT-MGB-3′. We defined three genotype groups for COMT val158metassay: Met homozygotes (n = 40), Val/Met heterozygotes (n = 83), and Val homozygotes (n = 33). The DRD2-141C Ins/Del assay sequences of the primers and probes (Gemignani et al 2005) were: Forward Primer: 5′-AAACAAGGGATGGCGGAATC-3′; Reverse Primer: 5′-CACCAAAGGAGCTGTACC TC-3′; Del Probe: 5′-VIC-CAACCCCTCCTACCCGTTCAGGC-MGB-3′; Ins Probe: 5′-FAM- CCCTCCTACCCGTTCCAGGC-MGB-3′. We defined three genotype groups for DRD2-141C Ins/Delassay: Ins homozygotes (n = 117), Ins/Del (n = 36) heterozygotes, and Del homozygotes (n = 2).
The assay for the 48-base pair (bp) exon 3 VNTR polymorphism in the DRD4 gene was based on the method used by Anchordoquy et al. (2003). Primer sequences were forward: 5′-VIC-GCTCATGCTGCTGCTCTACTGGGC-3′ and reverse: 5′-CTGCGGGTCTGCGGTGGAGTCTGG-3′, which yield PCR products from 279 (2R) to 519 (7R) bp. The assay for the 40-bp DAT1 VNTR in the 3′ untranslated region of the gene was based on the method used by Anchordoquy et al. (2003). The primer sequences were: Forward, 5′-6FAM-TGTGGTGTAGGGAACGGCCTGAG-3′, and Reverse: 5′-CTTCCTGGAGGTCACGCT CAAGG-3′, which yield PCR products of (in bp) 200, 360, 400, 440 (9R), 480 (10R), and 520. PCR reactions contained 1 μl of genomic DNA (20 ng), 10% DMSO (Hybra-Max® grade; Sigma, St. Louis, MO), 1.8 mM MgCl2, 180 μM deoxynucleotides, with 7′-deaza-2′-deoxyGTP (Roche Applied Science, Indianapolis, IN) substituted for one half of the dGTP, 400 nM forward and reverse primers (IDT, Coralville, IA) and 1 unit of AmpliTaq Gold® polymerase (ABI, Foster City, CA), in a total volume of 20 μl. Amplification was performed using touchdown PCR (Don et al., 1992). A 95°C incubation for 10 min was followed by two cycles of 95°C for 30 s, 65°C for 30 s, and 72°C for 60 s. The annealing temperature was decreased every two cycles from 65°C to 57°C in 2°C increments (10 cycles total), and a final 30 cycles of 95°C for 30 s, 55°C for 30 s, and 72°C for 60 s and a final 30-min incubation at 72°C. After amplification, an aliquot of PCR product was combined with loading buffer containing size standard (Rox1000, Gel Company, San Francisco, CA) and analyzed with an ABI PRISM® 3130xl (Genetic Analyzer, Foster City, CA) using company supplied protocols. Allele sizes were scored independently by two investigators; inconsistencies were reviewed and rerun when necessary. Each plate contained three controls of known genotype and one non-template control. Based on studies suggesting that the 7 repeat allele confers a functional difference in D4 receptors (Asghari et al., 1995), participants were classified as having the DRD4 7-repeat or longer allele (DRD4-L; n = 68) versus shorter alleles (DRD4-S; n = 92). We defined three genotype groups for the DAT1 assay: 10-repeat/10-repeat homozygotes (10R/10R; n = 88), 10-repeat/9-repeat heterozygotes (9R/10R; n = 68), and 9-repeat/9-repeat homozygotes (9R/9R; n = 4).
fMRI paradigms
Participants were asked to consume their regular meals, but to refrain from eating or drinking (including caffeinated beverages) for 5 hrs immediately preceding their imaging session for standardization purposes. We selected this deprivation period to capture the hunger state that most individuals experience as they approach their next meal. Participants were familiarized with the fMRI paradigms before the imaging session and the order of presentation of the two paradigms was counterbalanced. Prior to the scanning session participants tasted a small amount of milkshake and rated pleasantness via a 20-mm cross-modal visual analog scale anchored by “not pleasant at all” at the left anchor point (−10), “neutral” in the center (0), and “extremely pleasant” at the right anchor point (10). Visual analogs scales were also used for hunger ‘−10 = not hungry at all’ to ‘10 = extremely hungry’. Visual stimuli for both paradigms were presented with a digital projector/reverse screen display system to a screen at the back end of the MRI scanner bore and were visible via a mirror mounted on the head coil. Additional details regarding these paradigms appear elsewhere (Stice et al., 2011).
The food reward paradigm examined response to receipt and anticipated receipt of palatable food. This paradigm has consistently activated reward regions in separate samples, with activation from this paradigm showing test-retest reliability for weight stable individuals, sensitivity to the effects of weight change, and predictive validity for future weight gain (Stice et al., 2011; Stice et al., 2008; Stice et al., 2010). Stimuli were presented in 5 separate randomized scanning runs. The stimuli consisted of 2 images (glasses of milkshake and water) that signaled the delivery of either 0.5 mL of a chocolate milkshake or a tasteless solution. Order of presentation was randomized. The milkshake (270 kcals, 13.5g fat, 28g sugar per 150mL) was prepared with 60g of vanilla Häagen-Dazs® ice cream, 80mL of 2% milk, and 15mL of Hershey’s® chocolate syrup. The tasteless solution, designed to mimic the natural taste of saliva, consisted of 25 mM KCl and 2.5 mM NaHCO3 in distilled water (O’Doherty et al., 2001). On 40% of the milkshake and tasteless solution trials, the taste was not delivered following the cue to allow the investigation of the neural response to anticipation of a taste that was not confounded with actual receipt of the taste (unpaired trials). Cues were presented for 2 seconds and were followed by a jitter of 1–7 seconds during which time the screen was blank. Taste delivery occurred on average 10 seconds after cue onset and lasted 5 seconds. The trial ended with a second jitter of 1–7 seconds. Each event lasted between 2–5 seconds. Tastants were delivered using programmable syringe pumps (insuring consistent timing, delivery, and volume) and tubing leading to a manifold, which fit into the participants’ mouths, delivering the taste to a consistent segment of the tongue. Participants were instructed to swallow when they saw the ‘swallow’ cue. The next cue appeared 1–7 seconds after the ‘swallow’ cue went off.
The monetary reward paradigm was developed to assess activation in response to receipt and anticipated receipt of monetary reward, based on the Monetary Incentive Delay paradigm (Knutson et al., 2001a,b). Monetary reward is a general reinforcer that has been shown to activate reward regions and has been frequently used in behavioral and fMRI paradigms assessing reward sensitivity (e.g., Bjork et al., 2008; Knutson et al., 2001a, b). Stimuli, consisting of 3 coins (heads or tail), were presented in 2 separate runs. Order of presentation of the runs was randomized. During the run, a coin on the left hand side of the screen blinked 2–4 times (duration 300ms) and then stayed on the screen. After 2 seconds, a second coin blinked 4–6 times before remaining in the middle of the screen. After 3 seconds a third coin blinked 8–10 times and then remain on the screen for 4 seconds. After all three coins stopped blinking, a 2–3 second message appeared saying whether or not the subject has won (“You win $3” or “You don’t win”). Stimulus presentations were jittered. The subject won $3 each time 3 heads or 3 tails were displayed. During each run, the total amount earned was presented below the coins (“Your total is $XX).
fMRI Acquisition, Preprocessing and Statistical Analysis
Scanning was performed by a Siemens Allegra 3 Tesla head-only MRI scanner using a standard birdcage coil. Functional scans used a T2* weighted gradient single-shot echo planar imaging (EPI) sequence (TE = 30ms, TR = 2000ms, flip angle=80°) with an in plane resolution of 3.0 × 3.0 mm2 (64 × 64 matrix; 192 × 192 mm2 field of view). To cover the whole brain, 32 interleaved, no skip, 4mm slices were acquired along the AC-PC transverse oblique plane, as determined by the midsagittal section. Prospective acquisition correction (PACE) was applied to adjust slice position and orientation, as well as to re-grid residual volume-to-volume motion in real-time during data acquisition for the purpose of reducing motion-induced effects (Thesen et al., 2000). Anatomical scans were acquired using a high-resolution inversion recovery T1 weighted sequence (MP-RAGE; FOV = 256 × 256 mm2, 256 × 256 matrix, thickness = 1.0 mm, slice number ≈ 160).
Images were manually reoriented to the AC-PC line and skull stripped using the BET function in FSL (Smith, 2002). Data were then pre-processed and analyzed using SPM8 (Functional Imaging Laboratory, Wellcome Department of Imaging Neuroscience, Institute of Neurology, University College of London) in MATLAB 7.5 (Mathworks, Inc., Natick, MA). Functional images were realigned to the mean and both the anatomical and functional images were normalized to the standard Montreal Neurological Institute (MNI) T1 template brain (ICBM152). Normalization resulted in a voxel size of 3 mm3 for functional images and a voxel size of 1 mm3 for high-resolution anatomical images. Functional images were smoothed with a 6 mm FWHM isotropic Gaussian kernel.
To identify brain regions activated by food receipt we contrasted BOLD response during receipt of milkshake versus receipt of tasteless solution. To identify regions activated by anticipated food receipt, we contrasted BOLD response during presentation of the cue signaling impending milkshake delivery versus the cue signaling impending tasteless solution delivery (unpaired cues). To identify regions activated by receipt of monetary reward we contrasted BOLD response at the time a participant “won” (third coin stopped blinking and matched previous two) versus a reward neutral coin display (the time the first coin stopped blinking [1 head or 1 tail], which conveyed no information about possible monetary reward). To identify regions activated by anticipation of monetary receipt, we contrasted BOLD response during presentation of the cue signaling a potential win (i.e., 2 heads or 2 tails in a row) versus the reward neutral coin display. Condition-specific effects at each voxel were estimated using general linear models. Vectors of the onsets for each event of interest were compiled and entered into the design matrix so that event-related responses could be modeled by the canonical hemodynamic response function, as implemented in SPM8. A 128 second high-pass filter was used to remove low-frequency noise and slow drifts in the signal.
Individual maps were constructed to compare the activations within each participant for the following: milkshake receipt, tasteless receipt, milkshake cue, tasteless cue, time of monetary win, time of a potential win, and neutral coin display. Between-group comparisons were then performed using random effect models to account for inter-participant variability. Data were entered into a mixed between and within-subjects second-level 2 × 2 ANOVA (genotype status) by (milkshake receipt – tasteless receipt or unpaired milkshake cue – unpaired tasteless cue) and (genotype status) by (win – neutral coin display or potential win – neutral coin display). Ethnicity (food and monetary paradigms) and hunger (food paradigm only) were included as covariates of no interest. Because there were five categories of ethnicity (Hispanic, Asian, European-Americans, Native-American, and mixed races), four dummy variables were created (e.g., Hispanic = 1, all others = 0; Asian = 1, all others = 0).
For the analyses focusing on the main effects of each polymorphism, we compared the following groups because they insured adequate cell sizes; TaqIA A1/A1 and A1/A2 versus A2/A2; DRD2-141C Ins/Ins versus Ins/Del and Del/Del; DRD4-L versus DRD4-S; DAT1 10R/10R versus 10R/9R or 9R/9R; COMT Met/Met versus Met/Val or Val/Val. Certain genotypes (e.g., A1/A1; n = 5) were too rare in our sample to constitute a separate group in the main effects analyses.
We calculated a multilocus genetic composite reflecting the total number of the five genotypes, paralleling the general approach used by Nikolova et al., (2011). Genotypes associated with putatively low DA signaling received a score of 1; those associated with putatively high DA signaling received a score of 0; intermediate heterozygotes received a score of 0.5. Specifically, TaqIA A1/A1, DRD2-141C Ins/Ins carriers, DRD4-L, DAT1 10R/10R, and COMT Met/Met genotypes were assigned a score of 1 (‘low’); TaqIA A2/A2, DRD2-141C Ins/Del and Del/Del carriers, DRD4-S, DAT1 9R carriers, and COMT Val/Val genotypes were assigned a score of 0 (‘high’), and TaqIA A1/A2 and COMT Met/Val genotypes received a score of 0.5. The scores were then summed to create a multilocus composite (N = 151; M multilocus composite = 2.45, SD = 0.89, range = 0–4.5) (Table 1).
Whole brain analyses were conducted throughout. Cluster level thresholds corrected for multiple comparisons were derived using a Monte Carlo simulation of random noise distribution in the present data using the 3DClustSim module in AFNI (Cox, 1996; Forman et al., 1995). The Monte Carlo simulation combines individual voxel probability threshold and minimum cluster size to estimate the probability of a false positive. The threshold for the multilocus genetic composite analyses resulted in p < 0.001 with a cluster (k) ≥ 12, which is equal to p < 0.05 corrected for multiple comparisons. For the individual genotypes analyses, we applied a more conservative Bonferroni correction that adjusted for multiple testing. This resulted in p < 0.001 with a cluster (k) ≥ 14, which is equal to p < 0.01 (p = .05/5 genotypes = .01) corrected for multiple comparisons. All contrasts were run in both directions (e.g., DRD4-L > DRD4-S and DRD4-S > DRD4-L) and only significant peaks are reported. Data presented in the Figures represent parameter estimates of the indicated peak voxel ± SEM. All stereotactic coordinates are presented in MNI space (Internet: http://mni.mcgill.ca/). Effect sizes (r) were derived from the Z-values (Z/√N).
Results
Table 1 presents the descriptive statistics of the genotype groups. Data confirm that all genotype groups were large enough to provide sufficient sensitivity of the test of differential activation across groups. Chi-square analyses indicated that there were no significant relations between genotype status and self-reported ethnicity or sex (p-values > 0.10), suggesting that ancestry and sex are not potential confounds. Except for DAT1, all of our genes are in Hardy Weinberg equilibrium (including others not examined herein), implying that our sample, although ethnically diverse is genotypically homogeneous. There were no significant differences between DRD4-L versus DRD4-S carriers, DAT1 10R homozygotes versus 9R carriers, and between COMT Met homozygotes, Met/Val heterozygotes, and Val homozygotes on hunger, fullness, and pleasantness ratings of the milkshake and tasteless solution (p-values > 0.10). The multilocus genetic composite score did not correlate with these outcomes either. TaqIA A1 homozygotes (M hunger = 2.19, SD = 3.09) reported a lower hunger level than A2 homozygotes (M hunger = 8.22, SD = 4.18, F 1,158 = 7.12, p = 0.001). The A1/A2 heterozygotes did not differ significantly from either the A1 or A2 homozygotes on hunger. There were no significant differences between the three TaqIA groups on fullness and pleasantness ratings of the tastes.
fMRI Paradigm Validation
We next investigated the brain regions activated by receipt and anticipated receipt of palatable food and monetary reward to confirm that these paradigms activated reward-related regions. The main effect of anticipated food receipt revealed significant activation in the left hemisphere in the lingual gyrus (r = 0.43), precuneus (r = 0.31), precentral gyrus (r = 0.30), and middle frontal gyrus (MFG; r = 0.30), in the right hemisphere in the putamen (r = 0.30; Figure 1A); the hippocampus (r right = 0.40, r left = 0.40), thalamus pulvinar (r right = 0.37, r left = 0.36), pallidum (r left = 0.36, r right = 0.34) were bilaterally activated (Table 2). Overall, food receipt activated bilateral postcentral gyrus (r > 0.9; extending into frontal operculum insula, thalamus, striatum, and midbrain; Figure 1B), right dorsolateral prefrontal cortex (dlPFC; r = 0.35), and right precuneus (r = 0.31) (Table 2). Main effects of anticipated receipt of money were found in the left hemisphere in the occipital lobe (r > 0.9), hippocampus (r > 0.9; extending into midbrain), and posterior insula (r = 0.32), in the right hemisphere in the fusiform gyrus (r = 0.60) and thalamus pulvinar (r = 0.32), and bilaterally in the OFC (BA47/12; r right = 0.51, r left = 0.50; Figure 1C), middle temporal gyrus (MTG; r right = 0.44, r left = 0.37), and inferior parietal lobe (IPL; r left = 0.33, r right = 0.29) (Table 2). Main effects of receipt of money were found in the left hemisphere in the cerebellum (r > 0.9; extending into lingual gyrus and midbrain; Figure 1D), OFC (BA47/12; r = 0.38), in the right hemisphere in the mid cingulate cortex (r = 0.37) and medial prefrontal cortex (medial PFC; r = 0.32); the dlPFC (r left = 0.61, r right = 0.43), superior parietal lobe (SPL; r left = 0.44, r right = 0.42), and mid insula (r right = 0.42, r left = 0.38) and were bilaterally activated (Table 2).
Figure 1.

Main effects in A) the right putamen (MNI coordinates: 27, 11, −11, Z = 3.81, k = 19) in response to milkshake cue – tasteless solution cue, B) bilateral postcentral gyrus (MNI coordinates: −42, −19, 37, Z = Inf, k = 14966; extending into frontal operculum, insula, striatum, and midbrain) in response to milkshake receipt – tasteless solution receipt, C) bilateral orbitofrontal cortex (MNI coordinates: 33, 17, −17, Z = 6.50, k = 213; −33, 17, −14, Z = 6.35, k = 150) in response to potential win – neutral coin display, and D) midbrain (MNI coordinates: 0, −28, −5, Z = 3.62, k = 15) in response to win – neutral coin display.
Table 2.
Main Effects (N = 160) for Contrasts from the Food Reward Paradigm and Monetary Reward Paradigm
| Contrast and region | k | Z value | MNI coordinates | r |
|---|---|---|---|---|
| Milkshake cue > tasteless solution cue | ||||
| Lingual gyrus | 293 | 5.39 | −15, −88, −11 | 0.43 |
| Hippocampus | 68 | 5.08 | 33, −7, −20 | 0.40 |
| 117 | 5.00 | −24, −16, −14 | 0.40 | |
| Thalamus pulvinar | 47 | 4.68 | 27, −28, −2 | 0.37 |
| 46 | 4.52 | −24, −28, −2 | 0.36 | |
| Pallidum | 54 | 4.52 | −12, −1, −5 | 0.36 |
| 56 | 4.35 | 12, −4, 4 | 0.34 | |
| Fusiform gyrus | 153 | 4.44 | 30, −67, −14 | 0.37 |
| 32 | 3.79 | −33, −46, −23 | 0.30 | |
| Putamen | 19 | 3.81 | 27, 11, −11 | 0.30 |
| Precuneus | 18 | 3.94 | −15, −52, 16 | 0.31 |
| Precentral gyrus | 18 | 3.75 | −27, −7, 49 | 0.30 |
| Milkshake receipt > tasteless solution receipt | ||||
| Postcentral gyrus | 14966 | Inf* | −42, −19, 37 | >0.9 |
| Dorsolateral prefrontal cortex | 23 | 4.43 | 33, 50, 28 | 0.35 |
| Precuneus | 32 | 3.91 | 9, −58, 61 | 0.31 |
| Winning cue > neutral cue | ||||
| Occipital lobe | 1127 | Inf* | −27, −76, −20 | >0.9 |
| Hippocampus | 110 | Inf* | −21, −28, −8 | >0.9 |
| Fusiform gyrus | 982 | 7.62 | 27, −49, −17 | 0.60 |
| Orbitofrontal cortex BA47/12 | 213 | 6.50 | 33, 17, −17 | 0.51 |
| 150 | 6.35 | −33, 17, −14 | 0.50 | |
| Middle temporal gyrus | 95 | 5.61 | 48, −22, −8 | 0.44 |
| 53 | 4.71 | −51, −28, −8 | 0.37 | |
| Inferior parietal lobe | 26 | 4.23 | −54, −34, 25 | 0.33 |
| 15 | 3.62 | 63, −22, 37 | 0.29 | |
| Thalamus pulvinar | 18 | 4.05 | 21, −31, −2 | 0.32 |
| Posterior insula | 17 | 4.02 | −39, −10, −11 | 0.32 |
| Winning > neutral coin display | ||||
| Cerebellum | 2592 | Inf* | −27, −73, −23 | >0.9 |
| Dorsolateral prefrontal cortex | 153 | 7.69 | −48, 5, 28 | 0.61 |
| 175 | 5.43 | 54, 14, 25 | 0.43 | |
| Superior parietal lobe | 80 | 5.62 | −30, −61, 43 | 0.44 |
| 83 | 5.30 | 33, −67, 43 | 0.42 | |
| Mid insula | 81 | 5.42 | 39, 17, −8 | 0.42 |
| 35 | 4.77 | −39, 17, −14 | 0.38 | |
| Orbitofrontal cortex BA47/12 | 35 | 4.77 | −30, 17, −14 | 0.38 |
| Mid cingulate | 35 | 4.71 | 3, −7, 31 | 0.37 |
| Medial prefrontal cortex | 13 | 4.04 | 3, 23, 46 | 0.32 |
Z value > 12.00. For all contrasts, activated regions, number of contiguous voxels (k), Z-values, and coordinates of the voxel of greatest activation within the Montreal Neurological Institute (MNI) coordinate system are displayed. Peaks within the regions were considered significant at k ≥ 12, p<0.05, corrected for multiple comparisons across the entire brain.
Relation of Genotypes to Neural Response to Anticipated Receipt of Palatable Food
TaqIA A1 allele carriers compared to A2 homozygotes exhibited greater activation bilaterally in the parahippocampal gyrus (r right = 0.36, r left = 0.32), extending into the midbrain (r right = 0.35, r left = 0.30; Figure 2), and in the left frontal operculum (r = 0.31). COMT Met/Val heterozygotes compared to Val homozygotes exhibited greater activation in the right dlPFC (r = 0.31) (Table 3). No significant effects were found for DRD2-141C, DRD4, and DAT1.
Figure 2.

Greater activation in the midbrain (MNI coordinates: 12, −25, −23, Z = 4.49, k = 49) in A1 carriers versus A2 homozygotes in response to milkshake cue – tasteless solution cue with the bar graphs of parameter estimates from the peak.
Table 3.
Main Effects of TaqIA, COMT, DRD2-141C, DRD4, and DAT1 for Contrasts from the Food Reward Paradigm and Monetary Reward Paradigm
| Contrasts and regions | k | Z value | MNI coordinates | r |
|---|---|---|---|---|
| Milkshake cue > tasteless solution cue | ||||
| TaqIA: A1 > A2/A2 | ||||
| Parahippocampal gyrus | 49 | 4.51 | 21, −28, −17 | 0.36 |
| Midbrain | 4.49 | 12, −25, −23 | 0.35 | |
| Parahippocampal gyrus | 51 | 4.04 | −30, −28, −17 | 0.32 |
| Midbrain | 3.76 | −6, −34, −17 | 0.30 | |
| Frontal operculum | 27 | 3.94 | −45, 23, 1 | 0.31 |
| COMT: Met/Val > Val/Val | ||||
| Dorsolateral prefrontal cortex | 52 | 3.97 | 21, 32, 28 | 0.31 |
| Winning cue > neutral cue | ||||
| DRD2 -141C Ins/Ins >Del | ||||
| Mid insula | 16 | 3.92 | 36, −1, 1 | 0.31 |
| Winning > neutral coin display | ||||
| DRD2 -141C Ins/Ins > Del | ||||
| Frontal operculum | 17 | 4.07 | 42, 26, −8 | 0.33 |
| COMT: Met/Val > Val/Val | ||||
| Postcentral gyrus | 15 | 3.67 | 42, −13, 34 | 0.29 |
| COMT: Val/Val > Met/Met | ||||
| Middle temporal gyrus | 41 | 4.41 | −48, −2, −14 | 0.35 |
| DRD4-S > DRD4-L | ||||
| Middle occipital gyrus | 14 | 3.84 | 30, −79, 13 | 0.30 |
For all contrasts, activated regions, number of contiguous voxels (k), Z-values, and coordinates within the Montreal Neurological Institute (MNI) coordinate system are displayed. Peaks within the regions were considered significant at k ≥ 14, p<0.01, corrected for multiple comparisons across the entire brain.
Relation of Genotypes to Neural Response to Receipt of Palatable Food
No significant genotype effects emerged for the contrast milkshake receipt – tasteless solution receipt.
Relation of Genotypes to Neural Response to Anticipated Receipt of Money
DRD2 -141C Ins homozygotes compared to Del carriers exhibited greater activation in the right mid insula (r = 0.31) (Table 3). No significant effects were found for TaqIA, COMT, DRD4, and DAT1.
Relation of Genotypes to Neural Response to Receipt of Money
COMT Met/Val heterozygotes compared to Val homozygotes showed greater activation in the right postcentral gyrus (r = 0.29). COMT Val homozygotes showed greater activation in the left MTG (r = 0.35) compared to Met/Met homozygotes (Table 3). DRD2 -141C Ins homozygotes compared to Del carriers exhibited greater activation in the right frontal operculum (r = 0.33) (Table 3). DRD4-S compared to DRD4-L carriers exhibited greater activation in the right middle occipital gyrus (MOG; r = 0.30) in response to win-neutral coin display (Table 3). No significant effects were found for TaqIA and DAT1.
Relation of Multilocus Genetic Composite and Neural Response to Receipt and Anticipated Receipt of Palatable Food and Money
No significant correlations emerged between the multilocus genetic composite and activation during anticipated food receipt. The multilocus genetic composite was positively correlated with activation in the left pallidum (r = 0.35), right inferior frontal gyrus (IFG; r = 0.33), left precuneus (r = 0.30), and left IPL (r = 0.28) in response to food receipt (Table 4). That is, individuals with a higher number of variants associated with low DA signaling showed a higher BOLD signal in this region during milkshake receipt minus tasteless solution receipt. The multilocus genetic composite was positively correlated with activation in the left precuneus (r = 0.35) and negatively correlated with activation in the left putamen (r = −0.35; Figure 3), left MTG (r = −0.30), right caudate (r = −0.29; Figure 3) extending in right putamen (r = −0.27), and left insula (r = −0.29) in response to receipt of money. That is, individuals with more genotypes associated with low DA signaling showed a lower BOLD signal in these latter regions during winning money minus neutral coin display.
Table 4.
Effects of Multilocus Composite (N = 151) for Contrasts from the Food Reward Paradigm and Monetary Reward Paradigm
| Contrast, correlation, and region | k | Z value | MNI coordinates | r |
|---|---|---|---|---|
| Milkshake receipt > tasteless solution receipt | ||||
| Positive correlation | ||||
| Pallidum | 13 | 4.35 | −18, −10, −8 | 0.35 |
| Inferior frontal gyrus | 15 | 4.10 | 60, 8, 16 | 0.33 |
| Precuneus | 20 | 3.70 | −3, −55, 10 | 0.30 |
| Inferior parietal lobe | 14 | 3.49 | −45, −49, 43 | 0.28 |
| Winning > neutral coin display | ||||
| Positive correlation | ||||
| Precuneus | 35 | 4.35 | −9, −67, 40 | 0.35 |
| Negative correlation | ||||
| Putamen | 19 | 4.32 | −30, −19, 10 | −0.35 |
| Middle temporal gyrus | 12 | 3.71 | −57, −7, −14 | −0.30 |
| Caudate | 19 | 3.59 | 21, 2, 19 | −0.29 |
| Putamen | 3.30 | 27, −1, 13 | −0.27 | |
| Insula | 13 | 3.54 | −39, −1, 13 | −0.29 |
For all contrasts, activated regions, number of contiguous voxels (k), Z-values, and coordinates within the Montreal Neurological Institute (MNI) coordinate system are displayed. Peaks within the regions were considered significant at k ≥ 12, p<0.05, corrected for multiple comparisons across the entire brain.
Figure 3.
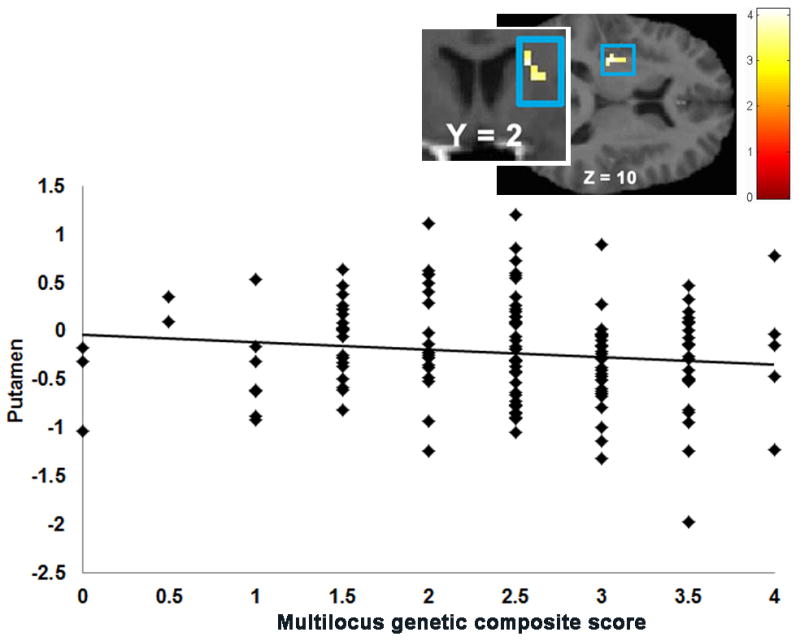
Correlation between the multilocus genetic composite and activation in the left putamen (MNI coordinates: −30, −19, 10, Z = 3.32, k = 19) plus a coronal image of activation in the caudate (MNI coordinates: 21, 2, 19, Z = 3.62, k = 20) in response to win – neutral coin display.
Given that we found an effect for the multilocus genetic composite that was used in a previous study (Nikolova et al., 2011), we thought it prudent to attempt to confirm the precise finding reported in that earlier study. For two of the loci (COMT rs4680 and DRD4 exon 3 VNTR) used in the profile, we adopted the opposite scoring as employed by Nikolova et al. (2011). Therefore, we recalculated the profile scores based on their allelic assignments. Following Nikolova’s et al. (2011) analytic approach, we then extracted parameter estimates from the ventral striatum clusters that had exhibited a main effect of the task and subsequently tested whether the multilocus genetic composite predicted these parameter estimates in regression models estimated in SPSS. Similar to Nikolova et al. (2011), we found a main effect in bilateral ventral striatum for both receipt and anticipated receipt of food. However, in contrast to the findings of Nikolova et al. (2011), the multilocus genetic composite did not significantly correlate with BOLD responses in these ventral striatum regions.
To probe the potential effects of population stratification, we tested whether the multilocus genetic composite correlated with neural activation during the food and monetary reward paradigms separately for participants reporting European-American ancestry (n = 123) and ethnic minority ancestry (n = 32). Although no effects reached significance in the smaller subsamples, the strongest correlation in the European-American sample was found in the caudate (Z = 2.93; r = 0.23) in response to anticipated receipt of milkshake and the strongest correlation in the ethnic minority sample was found in the putamen (Z = 1.97; r = 0.35), also in response to anticipated receipt of milkshake. These correlations were only slightly smaller than the effects that emerged in the full sample, which ranged from an r = .28 to an r = .35.
Discussion
The objective of this study was to test whether individuals with versus without the TaqIA A1 allele, DRD2-141C Ins/Ins genotype, DRD4-L allele, DAT1-L allele, Met/Met COMT genotype, and individuals with a greater number of these genotypes per a multilocus genetic composite, showed less responsivity of DA-based reward regions in response to receipt and anticipated receipt of palatable food and monetary reward. Preliminary analyses confirmed that on average participants showed greater activation in reward regions in response to receipt and anticipated receipt of palatable food and greater activation in regions in the mesolimbocortical pathways and attention regions when anticipating and receiving monetary reward compared to the relevant comparison events. Results also indicate that receipt and anticipated receipt of palatable food resulted in elevated activation in oral somatosensory and gustatory regions. These results converge with activation patterns observed in past fMRI studies that have used the food reward paradigm (Stice et al., 2011; Stice et al., 2008; Stice et al., 2010) and monetary reward paradigms (Bjork et al., 2008; Knutson et al., 2001a,b), suggesting that these paradigms reliably elicit robust activation in these brain regions.
Analyses testing for relations between the five genotypes and activation in response to the paradigms in DA-based reward regions (i.e., midbrain, caudate, and putamen) revealed no effects. The one effect that did emerge for a classic DA-based reward region in the individual genotype analyses was in the non-hypothesized direction; greater activation of the midbrain in response to anticipated receipt of palatable food for TaqIA A1 carriers relative to A2/A2 homozygotes. Indeed, many of the significant effects observed from individual analyses of the five genotypes were in the unhypothesized direction, albeit outside of the primary dopaminergic brain regions, but those with the Met/Met versus the Val/Val COMT genotype showed less middle temporal gyrus activation and those with the DRD4-L versus the DRD4-S genotype showed less middle occipital gyrus activation in response to monetary reward. Yet, support for the central hypothesis did emerge for the multilocus genetic composite: individuals with elevated multilocus composite scores, which theoretically identify those with low DA signaling capacity in reward regions, showed less activation in the dorsal striatum (bilateral putamen and the caudate) in response to monetary reward. The striatum is the brain complex with the greatest density of DA receptors (Waxham, 1999). A similar effect emerged for the insula, which is also considered a classic reward region (Nummenmaa et al., 2012). Although these effects were not significant in follow-up analyses involving only European-American and only ethnic minority participants, there were peaks that were similar in magnitude to those that emerged in the analyses with the entire sample, making it somewhat unclear as to whether population stratification contributed to the effects or whether there was simply insufficient power in the subgroup analyses. Nikolova et al. (2011) found that individuals with a greater number of genotypes associated with low DA signaling capacity show less ventral striatal response to monetary reward. We were unable to replicate this finding, even when we scored the multilocus profile precisely as Nikolova and colleagues, and took the same analytic approach. One possible explanation for the lack of replication is that the monetary reward paradigm employed in the current study does not recruit the ventral striatum specifically, which the task used by Nikolova et al. (2011) does. For example, in contrast to the task used by Nikolova et al. (2011), the paradigm in the current study did not include a behavioral response component. It is possible that a behavioral response component is necessary to recruit the ventral striatum in this particular task. In addition, Nikolova et al. (2011) used a somewhat uncommon analytic approach, in which the parameter estimates from the main effect of the monetary reward paradigm was correlated significantly with the multilocus genetic composite in SPSS. Most previous fMRI studies have tested whether genotypes correlate directly with activation in the paradigms (Brody et al., 2006; Cohen et al., 2005; Felsted et al.., 2010; Forbes et al., 2009; Kirsch et al., 2006; London et al., 2009). The fact that the multilocus genetic composite, but not the individual genotypes, correlated inversely with striatal responsivity to monetary reward suggests that individual genes may only exert a relatively small influence on brain activation phenotypes, but the additive effects of several genes that theoretically have a similar functional impact are more strongly related to reward circuitry responsivity. The fact that a linear summation scoring procedure was used by both Nikolova et al. (2011) and ourselves implies that the effects of the genotypes are additive. However, it is possible that these genotypes may interact, in an epistatic fashion, to influence responsivity of reward circuitry, which should be investigated in larger future studies. An important implication of the present findings and those from Nikolova et al. (2011) is that this multilocus genetic composite is a more sensitive index of vulnerability for less reward region responsivity than individual genotypes.
The multilocus genetic composite was also related to unhypothesized increased activation in the pallidum, inferior frontal gyrus, precuneus, and inferior parietal lobe in response to palatable food receipt and to increased activation in the precuneus in response to monetary receipt. The pallidum, which is a part of the basal ganglia neighboring the dorsal striatum has a similar synaptic composition and encodes receipt of palatable food (Bohon et al., 2009; Small et al., 2001; Smeets et al., 2011). Although the IFG has been implicated in inhibitory control processes (e.g., Hare et al., 2009), it also has been found to be involved in other cognitive processes. For example, activity in the IFG correlated positively with participants’ valuation of food items during a decision task (Plassman et al., 2007; Hare et al., 2008). Further, Murdaugh et al. (2012) found that greater IFG activation in response to palatable food images was associated with poor weight maintenance. Precuneus activation occurs in response to salient stimuli in general (Maddock et al., 1999) and has been associated with subjective increases and decreases in preferences of palatable food (Small et al., 2001). Finally, the IPL has found to be involved in mediating attentional processes (e.g., Pesoa et al., 2002). Therefore, our findings may suggest that individuals with a higher number of variants associated with low DA signaling may have perceived food reward and monetary reward as more salient.
It was noteworthy that the multilocus genetic composite showed inverse relations to striatal response to monetary reward but not to food reward. This may be due in part to the fact that all the participants were normal weight, and may have found money more rewarding than food. Results might have been different if obese versus normal weight participants had been studied, as the former may find food more rewarding than the latter, and the individual genotypes and the multilocus composite score may have moderated the relation of body mass to neural response to food stimuli.
In conclusion, results provided partial support for the hypotheses. On the one hand, there was evidence that individuals with a greater number of genotypes that are putatively associated with low DA signaling capacity showed less putamen, caudate, and insula activation in response to monetary reward. The fact that this key finding replicate results from the only other study to test this hypothesis (Nikolova et al., 2011) suggests that the effect is robust. Further, individuals with versus without the A1 TaqIA allele polymorphism, the 7-repeat or longer allele of the DRD4 genotype, and the Met/Met COMT genotype showed altered activation in many regions that are responsive to receipt and anticipated receipt from food and monetary reward, many of which receive projections from classic DA-based reward regions, suggesting that future research should expand the focus on regions that may be affected by these genotypes. On the other hand, the individual genotypes did not correlate inversely with activation of classic DA-based reward regions and there were no effects for the 10 repeat allele of the DAT1 genotype. In some respects, these findings converge with the mixed nature of the findings in the literature, wherein some results support the hypothesis that these genotypes were associated with less activation of reward regions (Brody et al., 2006; Cohen et al., 2005; Forbes et al., 2009; Nikolova et al., 2011), but other results have not (Forbes et al., 2009; Kirsch et al., 2006; London et al., 2009; Nikolova et al., 2011; Yacubian et al., 2007). It may be worthwhile to study additional genes that are thought to impact DA signaling, such as tyrosine hydroxylase genes involved in DA synthesis, genotypes that influence all five of the DA receptors, monoamine oxidase genotypes involved in DA metabolism, and DRD2 TaqIB, which is associated with less D2 receptor density (Jönsson et al., 1999). Collectively, results imply that it may be useful to investigate the functional significance of additive effects of genotypes that affect DA-signaling that are captured by multilocus composite scores, to investigate other genotypes the affect DA-signaling capacity, and to expand our functional focus beyond the classic DA-based reward regions to other brain areas that are activated by receipt and anticipated receipt of rewards.
Acknowledgments
Support for this work was provided by National Institutes of Health grant DK-080760. The authors would like to thank the Lewis Center for Neuroimaging at the University of Oregon for their contribution and assistance in imaging for this investigation.
Footnotes
All authors report no conflict of interest with respect to the content of this paper.
References
- Anchordoquy HC, McGeary C, Liu L, Krauter KS, Smolen A. Genotyping of three candidate genes after whole genome preamplification of DNA collected from buccal cells. Behav Genet. 2003;33:73–78. doi: 10.1023/a:1021007701808. [DOI] [PubMed] [Google Scholar]
- Asghari V, Sanyal S, Buchwaldt S, Paterson A, Jovanovic V, Van Tol HH. Modulation of intercellular cyclic AMP levels by different human dopamine D4 receptor variants. J Neurochem. 1995;65:1157–1165. doi: 10.1046/j.1471-4159.1995.65031157.x. [DOI] [PubMed] [Google Scholar]
- Bohon C, Stice E, Spoor S. Female emotional eaters show abnormalities in consummatory and anticipatory food reward: a functional magnetic resonance imaging study. Int J Eat Disord. 2009;42:210–221. doi: 10.1002/eat.20615. [DOI] [PMC free article] [PubMed] [Google Scholar]
- Bjork JM, Smith AR, Hommer DW. Striatal sensitivity to reward deliveries and omissions in substance dependent patients. Neuroimage. 2008;42:1609–1621. doi: 10.1016/j.neuroimage.2008.06.035. [DOI] [PMC free article] [PubMed] [Google Scholar]
- Brody AL, Mandelkern MA, Olmstead RE, Scheibal D, Hahn E, Shiraga S, Zamora-Paja E, Farahi J, Saxena S, London ED, McCracken JT. Gene variants of brain dopamine pathways and smoking-induced dopamine release in the ventral caudate/nucleus accumbens. Arch Gen Psychiatry. 2006;63:808–816. doi: 10.1001/archpsyc.63.7.808. [DOI] [PMC free article] [PubMed] [Google Scholar]
- Cohen MX, Young J, Baek JM, Kessler C, Ranganath C. Individual differences in extraversion and dopamine genetics predict neural reward responses. Brain Res Cogn Brain Res. 2005;25:851–861. doi: 10.1016/j.cogbrainres.2005.09.018. [DOI] [PubMed] [Google Scholar]
- Cox RW. AFNI: Software for Analysis and Visualization of Functional Magnetic Resonance Neuroimages. Comput Biomed Res. 1996;29:162–173. doi: 10.1006/cbmr.1996.0014. [DOI] [PubMed] [Google Scholar]
- Don RH, Cox PT, Wainwright BJ, Baker K, Mattick JS. “Touchdown” PCR to circumvent spurious priming during gene amplification. Nucleic Acids Res. 1992;19:4008. doi: 10.1093/nar/19.14.4008. [DOI] [PMC free article] [PubMed] [Google Scholar]
- Feldsted JA, Ren X, Chouinard-Decorte F, Small DM. Genetically determined differences in brain response to a primary food reward. J Neurosci. 2010;30:2428–2432. doi: 10.1523/JNEUROSCI.5483-09.2010. [DOI] [PMC free article] [PubMed] [Google Scholar]
- Forbes EE, Brown SM, Kimak M, Ferrel RE, Manuck SB, Hariri AR. Genetic variation in components of dopamine neurotransmission impacts ventral striatal reactivity associated with impulsivity. Mol Psychiatry. 2009;14:60–70. doi: 10.1038/sj.mp.4002086. [DOI] [PMC free article] [PubMed] [Google Scholar]
- Forman SD, Cohen JD, Fitzgerald M, Eddy WF, Mintun MA, Noll DC. Improved Assessment of Significant Activation in Functional Magnetic Resonance Imaging (fMRI): Use of a Cluster-Size Threshold. Magn Reson Med. 1995;33:636–647. doi: 10.1002/mrm.1910330508. [DOI] [PubMed] [Google Scholar]
- Gemignani F, Landi S, Moreno V, Gioia-Patricola L, Chabrier A, Guino E, Navarro M, Cambray M, Capellà G, Canzian F. Polymorphisms of the dopamine receptor gene DRD2 and colorectal cancer risk. Cancer Epidemiol Biomarkers Prev. 2005;14:1633–1638. doi: 10.1158/1055-9965.EPI-05-0057. [DOI] [PubMed] [Google Scholar]
- Grossman MH, Littrell JB, Weinstein R, Szumlanski C, Weinshilboum RM. Identification of the possible molecular basis for inherited differences in human catechol O-methyltransferase. Trans Neurosci Soc. 1992;18:70. [Google Scholar]
- Haberstick BC, Smolen A. Genotyping of three single nucleotide polymorphisms following whole genome preamplification of DNA collected from buccal cells. Behav Genet. 2004;34:541–547. doi: 10.1023/B:BEGE.0000038492.50446.25. [DOI] [PubMed] [Google Scholar]
- Hare TA, Camerer CF, Rangel A. Self-control in decision making involves modulation of the vmPFC valuation system. Science. 2009;324:646–648. doi: 10.1126/science.1168450. [DOI] [PubMed] [Google Scholar]
- Hare TA, O’Doherty J, Camerer CF, Schultz W, Rangel A. Dissociating the role of orbitofrontal cortex and the striatum in the computation of goal values and prediction errors. J Neurosci. 2008;28:5623–5630. doi: 10.1523/JNEUROSCI.1309-08.2008. [DOI] [PMC free article] [PubMed] [Google Scholar]
- Heinz A, Goldman D, Jones DW, Palmour R, Hommer D, gorey JG, Lee KS, Linnoila M, Weinberger DR. Genotype influences in vivo dopamine transporter availability in human striatum. Neuropsychopharmacology. 2000;22:133–139. doi: 10.1016/S0893-133X(99)00099-8. [DOI] [PubMed] [Google Scholar]
- Jönsson EG, Nöthen MM, Grünhage F, Farde L, Nakashima Y, Propping P, Sedvall GC. Polymorphisms in the dopamine D2 receptor gene and their relationships to striatal dopamine receptor density of healthy volunteers. Mol Psychiatry. 1999;4:290–296. doi: 10.1038/sj.mp.4000532. [DOI] [PubMed] [Google Scholar]
- Kenny P. Common cellular and molecular mechanism in obesity and drug addiction. Nat Rev Neurosci. 2011;12:638–651. doi: 10.1038/nrn3105. [DOI] [PubMed] [Google Scholar]
- Kirsch P, Reuter M, Mier D, Lonsdorf T, Stark R, Gallhofer B, Vaitl D, Hennig J. Imaging gene-substance interactions: The effect of the DRD2 TaqIA polymorphism and the dopamine agonist bromocriptine on the brain activation during the anticipation of reward. Neurosci Lett. 2006;405:196–201. doi: 10.1016/j.neulet.2006.07.030. [DOI] [PubMed] [Google Scholar]
- Knutson B, Adams CM, Fong GW, Hommer D. Anticipation of increasing monetary reward selectively recruits nucleus accumbens. J Neurosci. 2001a;21:RC159. doi: 10.1523/JNEUROSCI.21-16-j0002.2001. [DOI] [PMC free article] [PubMed] [Google Scholar]
- Knutson B, Fong GW, Adams CM, Varner JL, Hommer D. Dissociation of reward anticipation and outcome with event-related fMRI. Neuroreport. 2001b;12:3683–3687. doi: 10.1097/00001756-200112040-00016. [DOI] [PubMed] [Google Scholar]
- Livak KJ. Allelic discrimination using fluorogenic probes and the 5′ nuclease assay. Genet Anal. 1999;14:143–149. doi: 10.1016/s1050-3862(98)00019-9. [DOI] [PubMed] [Google Scholar]
- Lachman H, Papolos D, Saito T, Yu Y, Szumlanski C, Weinshilboum R. Human catechol-O-methyltransferase pharmacogenetics: Description of a functional polymorphism and its potential application to neuropsychiatric disorders. Pharmacogenetics. 1996;6:243–250. doi: 10.1097/00008571-199606000-00007. [DOI] [PubMed] [Google Scholar]
- London ED, Berman SM, Mohammadian P, Ritchie T, Mandelkern MA, Susselman MK, Schlagenhauf F, Noble EP. Effect of the TaqIA polymorphism on ethanol response in the brain. Psychiatry Res. 2009;174:163–170. doi: 10.1016/j.pscychresns.2009.07.008. [DOI] [PMC free article] [PubMed] [Google Scholar]
- Maddock RJ. The retrosplenial cortex and emotion: new insights from functional neuroimaging of the human brain. Trends Neurosci. 1999;22:310–316. doi: 10.1016/s0166-2236(98)01374-5. [DOI] [PubMed] [Google Scholar]
- Mattay VS, Goldberg TE, Fera F, Hariri AR, Tessitore A, Egan MF, Kolachana B, Callicott JH, Weinberger DR. Catechol O-methyltransferase val158-met genotype and individual variation in the brain response to amphetamine. Proc Natl Acad Sci U S A. 2003;100:6186–6191. doi: 10.1073/pnas.0931309100. [DOI] [PMC free article] [PubMed] [Google Scholar]
- Murdaugh DL, Cox JE, Cook EW, 3rd, Weller RE. fMRI reactivity to high-calorie food pictures predicts short- and long-term outcome in a weight-loss program. Neuroimage. 2012;59:2709–2721. doi: 10.1016/j.neuroimage.2011.10.071. [DOI] [PMC free article] [PubMed] [Google Scholar]
- Neville MJ, Johnstone EC, Walton RT. Identification and characterization of ANKK1: a novel kinase gene closely linked to DRD2 on chromosome band 11q23.1. Hum Mutat. 2004;23:540–545. doi: 10.1002/humu.20039. [DOI] [PubMed] [Google Scholar]
- Nikolova YS, Ferrell RE, Manuck SB, Hariri AR. Multilocus genetic profile for dopamine signaling predicts ventral striatum reactivity. Neuropsychopharmacology. 2011;36:1940–1947. doi: 10.1038/npp.2011.82. [DOI] [PMC free article] [PubMed] [Google Scholar]
- Nummenmaa L, Hirvonen J, Hannukainen JC, Immonen H, Lindroos MM, Salminen P, Nuutila P. Dorsal striatum and its limbic connectivity mediate abnormal anticipatory reward processing in obesity. Plos One. 2012;7:e31089. doi: 10.1371/journal.pone.0031089. [DOI] [PMC free article] [PubMed] [Google Scholar]
- O’Doherty J, Rolls ET, Francis S, Bowtell R, McGlone F. Representation of pleasant and aversive taste in the human brain. Journal of Neurophysiology. 2001;85:1315–1321. doi: 10.1152/jn.2001.85.3.1315. [DOI] [PubMed] [Google Scholar]
- Orvashcel H. Schedule for affective disorder and schizophrenia for school-age children epidemiologic version. 5. Ft. Lauderdale: Nova Southeastern University, Center for Psychological Studies; 1994. [Google Scholar]
- Pesoa L, Kastner S, Ungerleider LG. Attentional control of the processing of neutral and emotional stimuli. Cogn Brain Res. 2002;15:31–45. doi: 10.1016/s0926-6410(02)00214-8. [DOI] [PubMed] [Google Scholar]
- Plassman H, O’Doherty J, Rangel A. Orbitofrontal cortex encodes willingness to pay in everyday economic transactions. J Neurosci. 2007;27:9984–9988. doi: 10.1523/JNEUROSCI.2131-07.2007. [DOI] [PMC free article] [PubMed] [Google Scholar]
- Seeger G, Schloss P, Schmidt MH. Marker gene polymorphisms in hyperkinetic disorder – predictors of clinical response to treatment with methylphenidate? Neurosci Lett. 2001;313:45–48. doi: 10.1016/s0304-3940(01)02253-4. [DOI] [PubMed] [Google Scholar]
- Small DM, Zatorre RJ, Dagher A, Evens AC, Jones-Gotman M. Changes in brain activity related to eating chocolate. Brain. 2001;124:1720–1733. doi: 10.1093/brain/124.9.1720. [DOI] [PubMed] [Google Scholar]
- Smeets PAM, Weijzen P, de Graaf C, Viergever MA. Consumption of caloric and non-caloric versions of a soft drink differentially affects brain activation during tasting. Neuroimage. 2011;54:1367–1374. doi: 10.1016/j.neuroimage.2010.08.054. [DOI] [PubMed] [Google Scholar]
- Smith SM. Fast robust automated brain extraction. Hum Brain Mapp. 2002;17:143–155. doi: 10.1002/hbm.10062. [DOI] [PMC free article] [PubMed] [Google Scholar]
- Stice E, Spoor S, Bohon C, Small DM. Relation between obesity and blunted striatal response to food is moderated by TaqIA A1 allele. Science. 2008;322:449–452. doi: 10.1126/science.1161550. [DOI] [PMC free article] [PubMed] [Google Scholar]
- Stice E, Yokum S, Blum K, Bohon C. Weight gain is associated with reduced striatal response to palatable food. J Neurosci. 2010;30:13105–13109. doi: 10.1523/JNEUROSCI.2105-10.2010. [DOI] [PMC free article] [PubMed] [Google Scholar]
- Stice E, Yokum S, Burger KS, Epstein LH, Small DM. Youth at risk for obesity show greater activation of striatal and somatosensory regions to food. J Neurosci. 2011;31:4360–4366. doi: 10.1523/JNEUROSCI.6604-10.2011. [DOI] [PMC free article] [PubMed] [Google Scholar]
- Thesen S, Heid O, Mueller E, Schad LR. Prospective acquisition correction for head motion with image-based tracking for real-time fMRI. Magn Reson Med. 2000;44:457–465. doi: 10.1002/1522-2594(200009)44:3<457::aid-mrm17>3.0.co;2-r. [DOI] [PubMed] [Google Scholar]
- van Dyck C, Malison R, Jacobson L, Seibyl J, Staley J, Laruelle M, et al. Increased dopamine transporter availability associated with the 9-repeat allele of the SLC6A3 gene. J Nucl Medicine. 2005;46:745–751. [PubMed] [Google Scholar]
- Waxham M. Neurotransmitter receptors. In: Zigmond M, Zigmond F, Bloom S, Landis J, Roberts J, Squire L, editors. Fundamental Neuroscience. San Diego: Academic Press; 1999. pp. 235–267. [Google Scholar]
- Yacubian J, Sommer T, Schroeder K, Gläscher J, Kalisch R, Leuenberger B, Braus DF, Büchel C. Gene-gene interaction associated with neural reward sensitivity. Proc Natl Acad Sci U S A. 2006;104:8125–8130. doi: 10.1073/pnas.0702029104. [DOI] [PMC free article] [PubMed] [Google Scholar]