

Abstract
Neural correlates of reward prediction errors (RPEs) have been found in dorsal striatum. Such signals may be important for updating associative action representations within striatum. In order that the appropriate representations can be updated, it might be important for the RPE signal to be specific for the action that led to that error. However, RPEs signaled by midbrain dopamine neurons, which project heavily to striatum, are not action-specific. Here we tested whether RPE-like activity in dorsal striatum is action-specific; we recorded single-unit activity in posterior dorsomedial and dorsolateral striatum as rats performed a task in which the reward predictions associated with two different actions were repeatedly violated, thereby eliciting RPEs. We separately analyzed fast firing neurons (FFNs) and phasically firing neurons (PFNs) (total n = 1076). Only among FFNs recorded in posterior dorsomedial striatum did we find a population with RPE-like characteristics (19 of all 196 FFNs, 10%). This population showed a phasic increase in activity during unexpected rewards, a phasic decrease in activity during unexpected omission of rewards, and a phasic increase in activity during cues when they predicted high-value reward.. However, unlike a classical RPE signal, this signal was linked to the action that elicited the prediction error, in that neurons tended to signal RPEs only after their anti-preferred action. This action-specific RPE-like signal could provide a mechanism for updating specific associative action representations in posterior dorsomedial striatum.
INTRODUCTION
The dorsal striatum has been found to represent associations that may provide the basis for action selection. These include stimulus-response associations thought to underlie “model-free” behavioral control, as well as action-outcome or action-value associations thought to underlie “model-based” behavioral control. (Kawagoe et al., 1998; Hassani et al., 2001; Lauwereyns et al., 2002; Haruno et al., 2004; Tricomi et al., 2004; Lau and Glimcher, 2007; Pasquereau et al., 2007; Lau and Glimcher, 2008; Hori et al., 2009; Ito and Doya, 2009; Kim et al., 2009; Kimchi and Laubach, 2009; Stalnaker et al., 2010). To guide behavior appropriately, such representations must be updated when conditions change. Accordingly, striatum receives a large input from midbrain dopamine neurons, which signal reward prediction errors (RPEs) – differences between predicted and actual outcome values (Schultz et al., 1997; Clatworthy et al., 2009). However, the dopamine RPE signal does not appear to carry information about the action that led to the RPE (Schultz et al., 1993; Nakahara et al., 2004; Morris et al., 2006; Roesch et al., 2007). Although mechanisms have been proposed by which an action-agnostic dopamine signal could promote the creation or updating of action-specific associative representations (Houk, 1995; Montague et al., 1996; Centonze et al., 2001; Reynolds et al., 2001), an action-specific RPE-like signal might also be important for updating. That is, an action-specific RPE signal might allow updating of only representations related to the relevant action, rather than indiscriminately acting on all action-outcome representations that happen to be active at the time.
In the current study, we sought to test whether RPE-like signals in the dorsal striatum might be specific for the action that caused them. RPE signals have often been reported in dorsal striatum in imaging studies, although this signal is usually assumed to reflect dopamine input to the region (Delgado et al., 2000; McClure et al., 2003; O’Doherty et al., 2004; Tricomi et al., 2004; Haruno and Kawato, 2006). More recently, a subset of dorsal striatal neurons has been found to encode RPE signals in unit recording studies (Apicella et al., 2009; Kim et al., 2009; Oyama et al., 2010). Since in some of these studies it appears that RPE signals may be carried preferentially by interneurons in dorsal striatum, we examined this question separately in fast-firing neurons, thought to be interneurons, and phasically firing neurons, which are more likely to be medium spiny neurons (Kim et al., 2009). We also examined this question separately in two different striatal sub-regions, the posterior dorsomedial striatum (pDMS) and the dorsolateral striatum (DLS), which have been differentially implicated in goal-directed or model-based behavioral control and stimulus-response or model-free behavioral control (Yin and Knowlton, 2004; Yin et al., 2005a; Yin et al., 2005b; Yin and Knowlton, 2006; Balleine et al., 2007; Johnson et al., 2007).
We found that a small subset of fast-firing neurons in pDMS but not DLS exhibited prediction error correlates that were action-specific. These neurons tended to show RPE-like activity only on trials in which their anti-preferred action occurred. These data suggest that the dorsal striatal RPE signal could selectively influence particular action-outcome associative representations. This signal could complement the more global dopamine RPE signal to permit updating of action-specific outcome associations.
MATERIALS & METHODS
Subjects
Male Long-Evans rats were obtained at 175–200g from Charles River Labs, Wilmington, MA. Rats were tested at the University of Maryland School of Medicine in accordance with SOM and NIH guidelines.
Surgical procedures and histology
Surgical procedures followed guidelines for aseptic technique. Electrodes, consisting of drivable bundles of 10 25-um diameter FeNiCr wires (Stablohm 675, California Fine Wire, Grover Beach, CA) electroplated with platinum to an impedance of ~300 kOhms, were manufactured and implanted as in prior recording experiments. Electrodes were implanted in either pDMS (n = 4; 0.4 mm posterior to bregma, 2.6 mm left of midline, and 3.5 mm ventral to the brain surface) or dorsolateral striatum (n = 5; 0.7 mm anterior to bregma, 3.6 mm left of midline, and 3.5 mm ventral to the brain surface). Coordinates were identical to those used to make infusions or lesions in studies that have found functional dissociations between these two regions (Yin et al., 2004; Yin et al., 2005b). At the end of the study, the final electrode position was marked, the rats were euthanized with an overdose of isoflurane and perfused, and the brains were removed from the skulls and processed using standard techniques.
Behavioral task
Recording was conducted in aluminum chambers containing a central odor port above two adjacent fluid wells on one wall. The odor port was connected to an air flow dilution olfactometer to allow the rapid delivery of olfactory cues. Delivery of odors at the odor port and 10% sucrose solution in 0.05 ml boli at the two fluid ports were controlled by computer via solenoids, and photobeam breaks at each port were monitored by computer.
Each session consisted of a series of self-paced trials organized into four blocks. Rats could initiate a trial by poking into the odor port while the house light was illuminated. While in the odor port, an odor would be delivered for 500ms. If the rat withdrew from the odor port before the 500ms were finished, the trial would be aborted. At the end of the 500ms odor, rats could make a choice response consisting of a movement from the odor port to the left fluid well or to the right fluid well. The identity of the odor specified whether they would receive reward at the left well (forced-choice left, specified by verbena oliffac odor), the right well (forced-choice right, specified by 2-norbornane methanol, α-3,3-trimethyl odor), or either well (free-choice, specified by cedryl acetate trubek odor). Odors were presented in a pseudorandom sequence such that the free-choice odor was presented on 7/20 trials and the left/right odors were presented in equal numbers (±1 over 250 trials). In addition, the same odor could be presented on no more than 3 consecutive trials. The identity and meaning of these odors remained the same across the entire experiment.
Rewards were arranged such that during each block, a low-value reward was available at one well (a delayed reward or a small reward), while a corresponding high-value reward (an immediate reward or a large reward) was available at the opposite well. These contingencies remained the same across all trials in a block. At the beginning of each new block of trials (unsignaled to the rat), the timing of sucrose delivery was changed so that the high-value reward was replaced by a low-value reward and vice versa. Thus at each block change, positive or negative prediction errors would ensue at particular time points after each of the two choice movements (see Figure 1 for the contingencies in each block and the timing of the reward prediction errors). On free-choice trials, which were intermixed with forced-choice trials but had the same reward contingencies, rats adapted their choice behavior to meet the contingencies available on each block, so that by the end of blocks they were choosing the action leading to the higher value outcome at a high and stable rate (see Figure 2A).
Figure 1. Task.

Shown are the sequences of trial events and blocks. Each session consisted of four blocks with different action-outcome associations. Actions designated as “1” and “2” were counterbalanced across days between the leftward and rightward movements from the odor port to the left or right reward delivery well. Outcomes were short delay, long delay, big size and small size, counterbalanced across the two sides (and actions) within each session. Epochs during the reward delivery period are color-coded to indicate positive and negative prediction errors and control epochs in which reward delivery or omission was fully expected at the beginning of the block. Comparisons were made during these epochs between firing rates at the beginning of blocks (first five trials) versus the end of blocks (last 15 trials). Odors at the beginning of trials instructed whether reward would be available only on the left (forced choice), only on the right (forced choice), or on either side (free choice). Thus both forced choice odors became predictive of the associated outcome towards the end of blocks when rats had learned the action-outcome associations for that block.
Figure 2. Behavior and Single-Unit Recordings.

A. Average choice rate, collapsed across direction, for the block transition from long delay to short delay or from small size to big size. The last twenty trials of the previous block are shown in gray shading.
B. Boxes show the estimated dorsal/ventral and medial/lateral extent of recording sites, based on the final position of the electrode. The range of the estimated rostral/caudal position, relative to bregma, is labeled on the figures.
C. Waveforms are average ± SEM of those classified as fast-firing neurons or phasically firing neurons, recorded in each region.
For long-delay conditions, the length of the delay was titrated according to the rats behavior, according to the following algorithm: the side designated as long increased by 1 second every time that side was chosen until it became 3 s. If the rat continued to choose that side, the length of the delay increased by 1 s up to a maximum of 7 s. If the rat chose the side designated as long less than 8 out of the last 10 choice trials then the delay was reduced by 1 s to a minimum of 3 s. The reward delay for long forced-choice trials was yoked to the delay in free-choice trials during these blocks. In the third and fourth blocks, we held the delay preceding reward delivery constant (500 ms) while manipulating the size of the expected reward. The small reward was a single bolus of sucrose. For big reward, an additional bolus was delivered 500 ms after the first bolus. On the third and fourth block, the side with the high-value reward continued to be alternated from side to side at each block. Across the experiment, the number of trials in each block varied non-systematically around 64 trials (SD = 9.7).
Single-unit recording
Procedures were the same as described previously (Roesch et al., 2006; Roesch et al., 2007). Briefly, neural activity was recorded using two identical Plexon Multichannel Acquisition Processor systems (Dallas, TX), interfaced with odor discrimination training chambers. Signals from the electrode wires were amplified 20X by an op-amp headstage (Plexon Inc, HST/8o50-G20-GR), located on the electrode array. Immediately outside the training chamber, the signals were passed through a differential pre-amplifier (Plexon Inc, PBX2/16sp-r-G50/16fp-G50), where the single unit signals were amplified 50X and filtered at 150–9000 Hz. The single unit signals were then sent to the Multichannel Acquisition Processor box, where they were further filtered at 250–8000 Hz, digitized at 40 kHz and amplified at 1-32X. Wires were screened for activity daily; if no activity was detected, the rat was removed and the electrode assembly was advanced 40 or 80 um. Otherwise a session was conducted and the electrode was advanced by at least 40 um at the end of the session. Neural activity was recorded using Plexon Multichannel Acquisition Processor systems (Dallas, TX), interfaced with odor discrimination training chambers. Signals from the electrode wires were amplified and filtered by standard procedures described in previous studies (Stalnaker et al., 2010). Waveforms (>2.5:1 signal-to-noise) were extracted from active channels and recorded with event timestamps from the behavioral computer. Waveforms were not inverted before data analysis.
Data analysis and firing rate epochs
Units were sorted using Offline Sorter software from Plexon Inc (Dallas, TX), using a template matching algorithm. Sorted files were then processed in Neuroexplorer to extract unit timestamps and relevant event markers. These data were subsequently analyzed in Matlab (Natick, MA). We classified units according to the proportion of inter-spike intervals greater than 0.5 seconds in each neuron’s spike-train across the entire session, according to established methods (Schmitzer-Torbert and Redish, 2008). In both pDMS and DLS, this analysis revealed a somewhat bimodal distribution, as shown in Figure 3. Units with a high proportion of long interspike intervals (>40%>0.5 seconds) were classified as phasically firing and constituted 67% of all neurons recorded in each region. Our rationale for using 0.5 seconds as the criterion for this analysis (a range of values might be legitimately used for this purpose, Schmitzer-Torbert and Redish, 2008) is that it provided the best qualitative separation between the two ends of the distribution. None of the cells could be classified as tonically active neurons (TANs) according to the criteria of Schmitzer-Torbert and Redish (2008). Thus we classified all non-phasically firing neurons as fast firing but not tonically active neurons. The average waveforms of phasically firing and fast firing neurons differed from each other but were nearly identical between pDMS and DLS.
Figure 3. Classification of Neurons as Fast Firing or Phasically Firing.

Histograms in A show the proportion of interspike intervals (ISIs) that were greater than 0.5 sec, across the entire session, for each neuron recorded in dorsolateral or dorsomedial striatum. Based on the bimodality of distributions, fast firing neurons (FFNs) were classified as those with a value less than 0.4, and phasically firing neurons (PFNs), those with a value of greater than 0.4. Panels B and C show the median ISI for each neuron in the two subpopulations. Panels D and E show the coefficient of variation of ISIs for each neuron in the two subpopulations. Panels A,C and E overlay the distribution of putative prediction error-encoding neurons in red (see below).
To analyze neural correlates of reward prediction errors, we examined firing rate in the 300 ms beginning 50 ms after triggering the solenoid valve that controlled the delivery of reward. For negative reward prediction errors, we examined firing rate in the 400 ms beginning 50 ms after the solenoid controlling reward should have opened. These epochs were chosen based on a preliminary perusal of phasic increases and decreases to reward and reward omission, respectively, which revealed that phasic activity took at least 100 ms to begin to rise. We typically account for this delay by beginning analysis epochs 50 ms after the beginning of the relevant event. We performed ANOVAs (p < 0.05) on each neuron’s firing rate during each of these two epochs, including all conditions (block and direction) in which reward was newly delivered at the beginning of the block or in which reward was newly omitted at the beginning of the block, comparing early (first five trials in the block) and late (last fifteen trials in the same block). For unexpected reward, these conditions included the presentation of the second short delayed reward, the first two-bolus reward, and the second two-bolus reward. For unexpected omission, the conditions included the presentation of the first long delayed reward and the second small-size reward. We did not include the first small-size reward as an unexpected omission because the timing of the reward on that block was not changed compared to the previous block. We also analyzed similar epochs during control conditions in which reward was delivered at an unchanged time from the previous block, and in which reward was absent at an unchanged time from the previous block. Please see Figure 1 for a graphical depiction of all of these epochs and conditions. For cue-related activity, we analyzed an epoch beginning 50 ms after cue onset and ending at withdrawal from the odor port. Cue selectivity was calculated as the difference in firing rates between the high-value predicting cue and low-value predicting cue, and was compared between early trials (first three of forced-choice trials in each direction) and late trials (last five of forced-choice trials in each direction), across the last three blocks.
For analyzing the trial-by-trial evolution of prediction errors at the beginning of blocks, we examined the peak (for positive prediction error-related activity) or minimum (for negative prediction error-related activity) firing rate in 100 ms bins during the prediction error epochs described above, during each trial. We analyzed this activity using a repeated-measures ANOVA, which included the following data: average activity in the last ten trials of blocks preceding prediction error blocks, activity on the first five trials of the prediction error blocks, and average activity in the last ten trials of prediction error blocks. When a significant effect of trial was found, we performed planned comparisons comparing activity on each of the first three trials of prediction error blocks with average activity on the last ten of the previous blocks.
For correlations, we calculated the following indices: a positive prediction error index (average firing rate during positive prediction error epochs early in blocks minus late in the same blocks), a negative prediction error index (average firing rate during negative prediction error epochs early in blocks minus late in the same blocks), and a cue selectivity index (the difference in firing rate during the cue predictive of the high-value reward and the low-value reward early in blocks minus that same difference late in the same blocks). We then tested for linear correlations between the positive prediction error score and the negative prediction error score, and between the positive prediction error score and the cue-selectivity score.
Population firing rates are shown as averages using 100 ms bins and a 3-bin boxcar smoothing function. Directional selectivity was calculated by including only the last 10 forced-choice trials in each condition and taking the condition with the highest average firing rate during the epoch beginning with odor port withdrawal and ending in fluid port entry (the epoch during which rats were moving towards their chosen side). We used forced-choice trials because equal numbers of trials existed for each condition.
Bursting activity was analyzed using the Poisson surprise method as implemented by Neuroexplorer, with a surprise criterion of 4.6, defined as the negative log of the probability of finding the burst in a Poisson distribution with the same average firing rate (Legendy and Salcman, 1985). The surprise criterion was chosen based on that used in previous recordings of striatal neurons (Cayzac, et al., 2011). Interspike interval statistics (median value in each spiketrain and the coefficient of variation for each spiketrain) were calculated using Matlab.
RESULTS
In each block of this task, sucrose was delivered at precise and consistent time-points relative to the response at the fluid well, with the exception of long-delay conditions, in which reward delivery varied from 1–7 seconds after the response. At the beginning of the second, third and fourth blocks, sucrose was delivered at different time points than it had been in the block immediately before (see Figure 1). Therefore, at certain time points at the beginning of those blocks, reward was unexpectedly delivered, resulting in a positive prediction error, while at other time points, reward was unexpectedly omitted, resulting in a negative prediction error. By examining neural activity in the epoch immediately after these time points and comparing this activity at the beginning of blocks with that at the end of the same blocks (by which time reward timing could be well-predicted), we could look for reward prediction error encoding.
We recorded from a total of 489 neurons in dorsolateral striatum and 587 neurons in pDMS (see Figures 2C and 2D). We classified neurons as either fast firing neurons (FFNs) or phasically firing neurons (PFNs) according to the proportion of session-wide interspike intervals greater than 0.5 seconds, and analyzed these populations separately (Schmitzer-Torbert and Redish, 2008). FFNs typically had triphasic waveforms, with faster baseline firing rates and shorter duration waveforms than PFNs, which typically had biphasic waveforms (see Table 1 and Figures 3–4 for firing rates, interspike interval distributions, and bursting statistics for these two subpopulations in each region).
Table 1.
Characteristics of recorded units classified as fast firing interneurons (FFNs) or phasically firing neurons (PFNs).
| Classification | pDMS | DLS | ||||||
|---|---|---|---|---|---|---|---|---|
| N | Baseline Firing Rate (sp/s) | Half-Peak Width (μs) | % Spikes in Bursts | N | Baseline Firing Rate (sp/s) | Half-Peak Width (μs) | % Spikes in Bursts | |
| FFNs | 196 | 16.6 ± 0.87 | 93.2 ± 1.5 | 11.8 ± 0.9 | 159 | 13.8 ± 0.69 | 94.6 ± 2.4 | 9.5 ± 0.7 |
| PFNs | 391 | 1.78 ± 0.08 | 134.2 ± 1.8 | 28.1 ± 1.1 | 330 | 1.87 ± 0.08 | 147.6 ± 1.9 | 26.1 ± 1.1 |
Baseline firing rates were taken across all intertrial intervals in recording sessions. Burst analysis uses the Poisson surprise method with a surprise criterion of 4.6 (p < 0.01). Means ± SEMs are reported.
Figure 4. Percentage of Spikes in Bursts Among Neurons Classified as PFNs or FFNs.

Histograms show the percentage of spikes that were assigned to bursts using the Poisson surprise method (surprise criterion = 4.6), for each neuron classified as a PFN (A) or a FFN (B), and, for comparison, among the putative RPE-encoding subpopulations analyzed in Figure 5.
Reward Prediction Error Signaling
An analysis of associative encoding in this dataset has been previously published (Stalnaker et al., 2010). For the current analysis, we first examined activity during positive prediction error epochs, using the 300 ms epoch beginning 50 ms after unexpected reward delivery (see Figure 1 for the times when this occurred in the session), including every time-point at which a drop of sucrose was delivered in a block when it had not been delivered in the previous block. We compared activity across all of these epochs when reward was unexpected during the first five trials versus when it was fully expected during the last fifteen trials of the same blocks. As a population (using a t-test across neurons), FFNs in pDMS fired significantly more to unexpected than expected reward, while FFNs in dorsolateral and PFNs in both regions showed no difference in reward-evoked firing between the two conditions (pDMS: FFNs t195 = 3.1, p = 0.002; PFNs t390 = 1.2, p = 0.22; DLS: FFNs t158 = 1.6, p = 0.10; PFNs t329 = 0.7, p = 0.46). When analyzed individually, 19 pDMS FFNs fired significantly more to unexpected than expected reward on early trials vs. late trials. The proportion of neurons that met this test was significantly greater than the proportion that did the opposite (6 neurons fired significantly more to expected than unexpected; p < 0.01 by chi-square). The waveforms of these neurons were not significantly different than those of the larger FFN population (mean half-peak width of these 19 neurons was 92.1± 4.0 μs, compared to 93.2 ± 1.5 μs for FFNs in general).
We next examined these 19 neurons, constituting 10% of the FFN population, for further evidence of prediction error encoding. As shown in Figure 5, this analysis revealed features consistent with RPE signaling. First this population showed a significant suppression in firing to omission of an expected reward (Figures 5B, left panel, and 5C). We tested for this during the 400ms epoch beginning 50 ms after unexpected reward omission (this epoch was based on observation of the peri-event time histograms for each neuron). We found that as a population, these 19 neurons fired significantly less during the first five trials of blocks during unexpected reward omission (negative prediction errors) compared to the last fifteen trials of the same blocks, and the difference in firing to unexpected and expected reward omission was inversely correlated with the difference in firing to unexpected and expected reward delivery, described previously (Figure 5C, left panel). Second, this population showed a significant increase in cue-selectivity (i.e. activity that differentiated the two cues) as forced-choice cues came to fully predict rewards; this difference was statistically evident in a comparison between firing rates in the last five versus the first three forced-choice trials in each block (Figures 5C, right panel, and Figure 6). Furthermore, a cue-selectivity score capturing this difference for each neuron was positively correlated with the difference in firing to unexpected and expected reward delivery (Figure 5C, right panel). Finally, these neurons also showed a significant phasic increase in firing during unexpected reward epochs compared to the 500 ms immediately prior to reward delivery, and a significant phasic decrease during unexpected omission epochs compared to the corresponding baseline (Figure 5A and 5B, left panels). To demonstrate the reliability of positive and negative prediction error signaling across the subpopulation, the activity of each neuron is shown in Figure 7. In addition, population activity aligned to movement initiation and reward well entry is shown in Figure 8.
Figure 5. A Subset of Posterior Dorsomedial FFNs Signal Reward Prediction Errors.

Left panels show average firing rate of FFNs that respond significantly more to unexpected than expected reward, aligned to reward delivery (A) or omission (B) (n = 19, 10% of all FFNs recorded in posterior dorsomedial striatum). Inset shows average firing rate during the baseline epoch versus that during reward or reward omission (baseline epoch was the 500 ms immediately before reward delivery or omission). Asterisks indicate p < 0.01 vs. baseline. Right panels show the average peak (A) or minimum (B) firing rate during the RPE epoch on each trial after a block switch. For both positive and negative RPEs, activity was significantly different from average activity on previous blocks (solid lines) only on the second trial of the new block. Panel C shows the other criteria for reward prediction errors for each neuron in this population. The population fired significantly less during unexpected than expected reward omission (negative prediction errors) and developed significant cue-selectivity to odor cues that came to predict reward later in the block. These difference scores were each significantly correlated with the positive prediction error difference score. Black bars indicate neurons that were significantly selective on a trial-by-trial basis. Positive and negative prediction error scores were the difference in mean firing rate between first 5 trials and last 15 trials, in epochs and blocks with unexpected reward delivery or omission (see Figure 1 for timing of these epochs). Cue selectivity score was the difference in mean firing rate between the high value-associated cue and low value-associated cue in the first 3 forced-choice trials subtracted from the same difference in the last five forced-choice trials. Firing rate shown in left panels A and B show average across the two trials with the biggest RPEs (trials 2 and 3 for positive RPEs, trials 1 and 2 for negative RPEs).
Figure 6. Cue-selectivity in RPE-encoding FFNs.
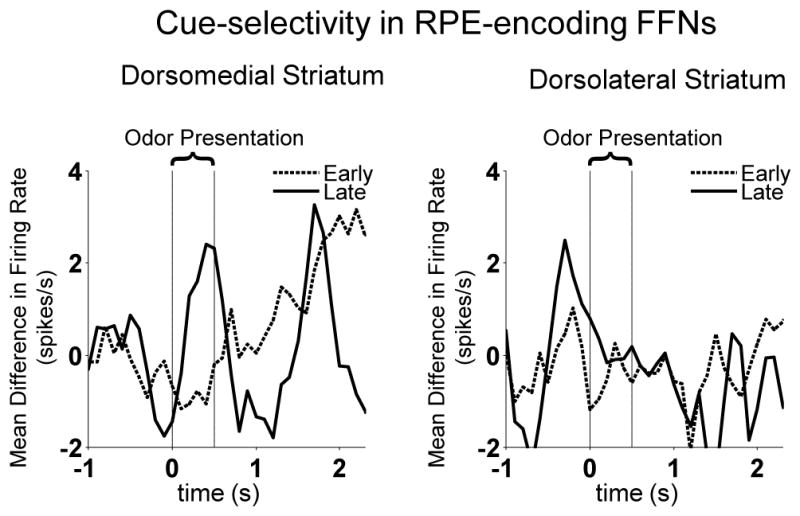
Shown is mean difference in firing rate between odor cue predicting high value reward and odor cue predicting low value reward, early in the block (first five forced-choice trials) vs. late in the block (last five forced-choice trials). Left panel illustrates that in dorsomedial striatum, neurons were cue-selective during presentation of the cue, late in the block when the meaning of cues had been learned, compared to early in the block when cue-reward relationships were new. Since the high and low value cues were presented in a pseudorandom sequence (i.e. not predicted), this difference is consistent with the encoding of prediction errors. Interestingly, this effect was not observed in dorsolateral striatal FFNs (right panel).
Figure 7. Individual Prediction Error-Encoding FFNs in Dorsomedial Striatum.

Panels A and B show activity of each neuron in the prediction error-encoding FFN population from dorsomedial striatum in the first five trials of blocks in which unexpected reward (A) or unexpected omission (B) was given. Baseline activity (average activity in the last two bins before reward or reward omission) is subtracted from each neuron so that the response to reward or reward omission can be seen.
Figure 8. Activity of RPE-encoding FFNs in Dorsomedial Striatum, Aligned to Movement Initiation and Well Entry.
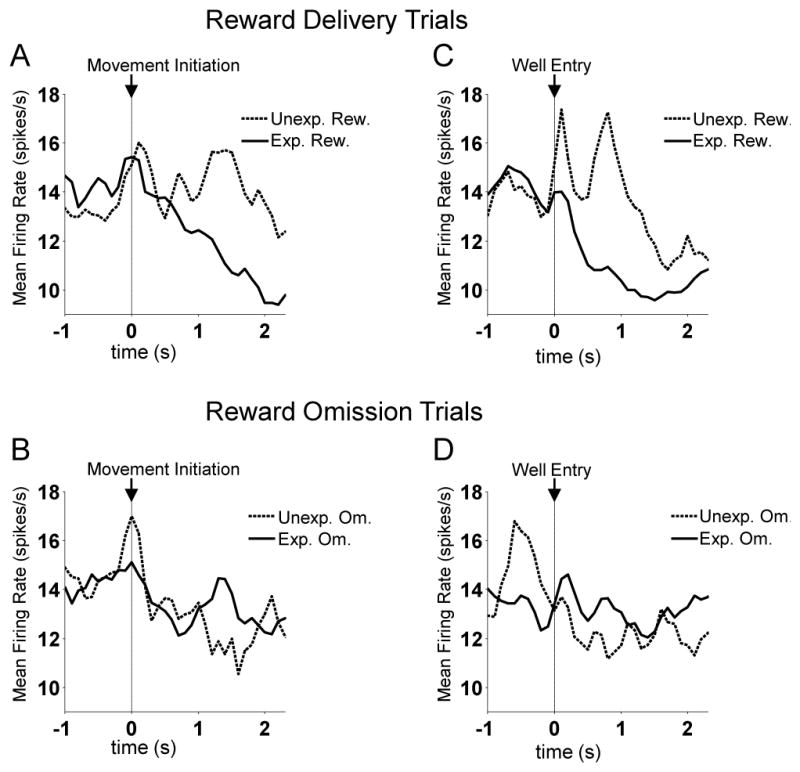
Shown are average firing rates prepared exactly like the population averages shown in Figures 5A and 5B.
Interestingly, a trial-by-trial analysis (Fig 5A and 5B, right panels) showed that both positive and negative RPEs in these neurons reached their peak on the second trial after a block switch, rather than on the first trial as occurs with a dopamine RPE signal (Roesch et al., 2007). This was confirmed using a repeated measures ANOVA on peak RPE activity across trials (see Methods; positive: F6,108 = 2.5, p < 0.05; negative: F6,108 = 2.4, p < 0.05). Planned comparisons revealed a significant difference between activity on trial 2 and that on the preceding block, but no significant difference between trial 1 and that on the preceding block (positive, 1st trial, t18 = 0.32, p = 0.75; 2nd trial: t18 = 2.2, p < 0.05; negative: 1st trial, t18 = −1.4, p = 0.17; 2nd trial, t18 = −3.0, p < 0.01).
In addition to RPE encoding, this population also fired more to fully expected reward omission compared to fully expected reward delivery (compare solid lines between Figures 5A and 5B, left panels). To test the robustness of this effect and its independence from changes in reward predictability, we performed a control analysis, which compared activity in these same neurons during reward delivery and reward omission across blocks in which reward predictability did not change. For this analysis, we chose epochs in which the reward delivered (or omitted) at the beginning of blocks occurred at the same time as that delivered (or omitted) in the previous blocks (see Figure 1 for a graphical depiction of these epochs). In parallel to the previous analysis, we compared activity during these epochs during the first five trials of these blocks with that during the last fifteen trials of the same blocks. As illustrated in Figure 9, this analysis revealed that activity did not change significantly within such blocks and did not differ between reward delivery epochs and absence of reward epochs (reward delivery early vs. late: t18 = 1.4, p = 0.19; absence of reward early vs. late: t18 = 1.3, p = 0.23; reward delivery late vs. absence of reward late: t18 = 1.5, p = 0.15). Thus the phasic increases and decreases described above are primarily influenced by the changes in the predictability of the reward delivery or omission within those blocks rather than reward delivery or omission itself.
Figure 9. Control Analysis of Dorsomedial RPE-Encoding FFNs.

Shown are the results of a control analysis of the same population as in Figure 3, but during expected reward delivery (A) and omission (B) epochs (see Figure 1 for the timing of these epochs). The population did not show any of the prediction error effects during these control epochs, indicating that it was not simply reward delivery or omission but rather the unpredictability of these events that triggered neurons to respond.
Dorsolateral striatal FFNs do not encode RPEs
As a population, FFNs in DLS did not show evidence of positive prediction error encoding. Analyzed individually, 12 neurons in this population fired significantly more to unexpected reward than fully expected reward. However this proportion was not significantly larger than the population that did the opposite (expected reward more than unexpected reward, n = 5, n.s. by chi-square). In addition, as shown in Figure 10, aside from a phasic increase to unexpected reward, this population did not meet any of the other criteria described above for RPE encoding. Thus, RPE-encoding FFNs were particular to the posterior dorsomedial region of striatum. This result is notable in light of our previous report that representations of action-outcome associations in these same neural populations did not differ between DLS and pDMS (Stalnaker et al., 2010).
Figure 10. Dorsolateral Striatal FFNs Fail to Show Reward Prediction Errors.

Left panel shows average firing rate of dorsolateral striatal FFNs that respond significantly more to unexpected than expected reward, aligned to reward delivery (A) or omission (B) (n = 12, 8% of all FFNs recorded in dorsolateral striatum). Inset shows average firing rate during the baseline epoch versus that during reward or reward omission (baseline epoch was the 0.5s immediately before the prediction error epoch). Asterisk indicates p < 0.01 vs. baseline. Right panel shows the other criteria for reward prediction errors for each neuron in this population. Although this population shows a phasic response to unexpected reward, it does not meet any of the other criteria for RPEs. Black bars indicate neurons that were significantly selective on a trial-by-trial basis.
pDMS reward prediction errors are specific for the action that caused them
We have previously reported that many dorsal striatal neurons recorded in this task, including both PFNs and FFNs, show a phasic increase in activity during execution of one of the two actions available in the task and a phasic decrease in activity during the execution of the opposite action (Stalnaker et al., 2010). The RPE-encoding striatal neurons identified above also tended to show this kind of activity. That is, 14 of the 19 RPE-encoding striatal neurons (75%) showed significant directionally selective activity for at least one of the four outcomes (short delay, long delay, large size, or small size), which is at least as high a proportion as in the total population of FFNs recorded in pDMS; indeed the RPE-encoding population shows a trend towards a greater proportion of directionally selective neurons compared to the population as a whole by chi-square, p = 0.086.
We next sought to test the relationship between the action-signaling and RPE-signaling in RPE-encoding FFNs. To do so, we defined the preferred action for each neuron as the action with the highest firing rate during its execution, between odor port exit and fluid well entry. Note that this epoch occurs well before rats receive reward, and thus is separable from, and not time-locked to, the prediction error epochs discussed earlier. Then we examined RPE-encoding activity according to whether it occurred after that neuron’s preferred or anti-preferred action. As shown in Figure 11, neurons in this population signaled prediction errors selectively after their anti-preferred action. An ANOVA on activity during the RPE epoch, with factors negative RPE/positive RPE and preferred/anti-preferred side reveals a significant interaction effect (F2,53 = 4.1; p < 0.05), such that the population fires at higher rate during positive prediction errors on the anti-preferred side versus the preferred side, and a lower rate during negative prediction errors on the anti-preferred side versus the preferred side. Similarly, after the anti-preferred action, neurons show a significant phasic increase over baseline during unexpected reward (t18 = 3.4, p < 0.01) and a significant decrease under baseline during unexpected reward omission (t12 = −2.3, p < 0.05). After the preferred action, in contrast, there is neither a significant phasic increase nor a significant phasic decrease in these conditions (positive: t18 = 0.7, p = 0.48; negative, t5 = −0.6, p = 0.58).
Figure 11. Dorsomedial Striatal RPE-Encoding FFNs Signal RPEs Selectively After their Anti-Preferred Action.

Left and right panels show average activity during performance of the action (A), unexpected reward delivery (B) or unexpected reward omission (C), separated by whether it occurred during/after the preferred action (left panel) or the anti-preferred action (right panel). Insets show the average activity during the relevant epoch, comparing activity between the preferred vs. anti-preferred action (A), or between baseline vs. RPE epoch for reward delivery (B) or reward omission (C). Only after the anti-preferred action did this population show evidence of RPE-encoding. An ANOVA revealed a significant interaction on firing rate between positive/negative RPE and preferred/anti-preferred action (p < 0.05). Asterisks indicate p < 0.01.
DISCUSSION
Here we tested whether dorsal striatal neurons signaled reward prediction errors in an odor-guided choice task. A subset of fast firing neurons in posterior dorsomedial striatum showed phasic increases and decreases in firing rate, lasting about 300–400ms, that were consistent with prediction error encoding. The positive error signals were correlated with the negative prediction error signals and also with increases in firing to the differently valued cues that occurred with learning in each block. Thus, this subpopulation showed many of the same characteristics that have been reported for midbrain dopamine neurons. However, several characteristics of these signals are markedly distinct from those of the midbrain dopamine signal. First, unlike the dopaminergic signal, the dorsal striatal error signal was not maximal on the first trial after an unexpected change in reward delivery or omission; instead it appeared to peak on the second trial. This suggests a signal that integrates across trials rather than exclusively reflecting errors on the current trial. Secondly and more central to the current study, the dorsal striatal signal was selective for the action that led to the error. Specifically, these neurons tended to signal errors only following their anti-preferred actions – the action during which they had tended to show a phasic decrease in activity. Error signaling following their preferred action, during which they had shown a phasic increase in activity, was strongly attenuated. Thus, this prediction error-like signal was integrated with information about which action had caused the prediction error. Dopamine prediction error signaling, by contrast, has been found to be independent of the action that preceded the error (Schultz et al., 1993; Nakahara et al., 2004; Morris et al., 2006; Roesch et al., 2007).
There have been several previous reports of dorsal striatal unit activity that appears to carry RPE signals. In a probabilistic maze choice task, a small subset (~15%) of primarily fast-spiking neurons in DMS showed activity that correlated with modeled trial-by-trial RPE values (Kim et al., 2009). While the activity of many units recorded in that study was also correlated with the action chosen in that trial, the authors did not report the relationship between RPE- and chosen action signaling. A second study reported that a low percentage of dorsal striatal neurons encoded positive RPEs in a Pavlovian probabilistic reward task. These neurons were likely medium spiny neurons, and were recorded in various parts of the dorsal striatum. The size of the RPE-signaling population in the current study (10% of all fast-spiking neurons recorded) is roughly consistent with the size of the populations found in these previous unit recording studies (Kim et al., 2009; Oyama et al., 2010). A number of imaging studies of human subjects have also reported BOLD activity in different parts of dorsal striatum that is correlated with RPEs (Delgado et al., 2000; McClure et al., 2003; O’Doherty et al., 2004; Tricomi et al., 2004; Haruno and Kawato, 2006). Although it is difficult to determine whether this signal derives from dopamine input or is locally generated, let alone whether different populations of neurons within striatum encode RPEs associated with different actions, these imaging data would be consistent with our results.
The RPE-like signal reported in the current paper occurred in fast firing neurons and not in phasically firing neurons. It is possible that prediction error-encoding PFNs were not detected by our analysis because they fire more slowly and hence would yield less statistical power in the small number of trials analyzed. It is also possible that the striatal RPE-like signal occurs predominantly in fast-firing interneurons, as at least one previous study has suggested (Kim et al., 2009). Although our FFN population included a much higher proportion of the total population than anatomical data suggest interneurons account for, our techniques (like those in many other published extracellular recording studies) may have biased recordings towards interneurons, which are far more likely to be detected during initial screening. Thus, with the caveat that extra-cellular recordings, at least when they are done exclusively during task engagement, are not well-suited to the unequivocal identification of specific cell-types, our FFN population is more likely to consist of interneurons than medium spiny neurons.
Striatal interneurons, which are inhibitory, are thought to shape the activity of projection neurons that may participate in the control of movement. Thus, when interneurons show a phasic decrease in activity, it may disinhibit a population of medium spiny neurons (MSNs) that select for a particular movement (Parthasarathy and Graybiel, 1997; Gage et al., 2010). This implies that each possible action within a context may be gated by a particular subpopulation of striatal interneurons, via shaping of the activity of a corresponding subpopulation of MSNs. The current data suggest that when a prediction error occurs, the same population of neurons that gated the preceding action might selectively signal the error. Thus, this RPE-like signal would be targeted to the same MSN subpopulation that represents the action that led to the error. Because it is targeted in this way, such an RPE-like signal could in theory be particularly useful for updating of action-outcome representations; it might trigger updating only in the relevant subpopulation of MSNs, leaving those that represent other actions, and other action-outcome associations, unaffected.
A growing number of studies have examined differences in neural processing in dorsomedial vs dorsolateral striatum during learning and decision-making (Thorn et al.; Yin et al., 2009). Lesions and pharmacological manipulations of these two regions suggest that dorsomedial, or associative, striatum is critical for goal-directed behavior – that based on representations of predicted outcomes – while dorsolateral striatum, or sensorimotor striatum, is critical for habitual behavior – that based on stimulus-response representations (Yin and Knowlton, 2004; Yin et al., 2005a; Yin et al., 2005b; Yin and Knowlton, 2006; Balleine et al., 2007; Johnson et al., 2007). However, it remains a mystery how a similar internal circuitry and a broadly similar dopaminergic input across these two regions could account for such different functions (Wickens et al., 2007). Indeed we reported previously that neural correlates of action-outcome and stimulus-response associative representations are present in equal proportions in both regions, suggesting that information content in the two regions may not account for their functional differences (Stalnaker et al., 2010). The current results may provide some clue as to the reasons for these functional differences. The presence of an action-specific targeted RPE signal in DMS could facilitate action-outcome encoding necessary for model-based behavioral control. Conventional theories of dopamine-based learning and updating mechanisms rely on “stamping in” representations that are merely contiguous with reward; such a mechanism might be less efficient at learning or maintaining information about causal relationships between actions and outcomes. Thus, dorsolateral striatum, in the absence of an action-specific RPE signal, might be slower to learn or update causally based action-outcome associative representations, and would instead tend to develop stimulus-response associative representations. Notably, this effect might not be revealed in our paradigm, since it did not attempt to dissociate action-outcome contiguity from action-outcome causality. Alternatively, updated action-outcome representations may spread from dorsomedial to dorsolateral striatum in well-trained rats such as ours, when both regions are functioning normally.
Because the RPE-like signals reported here are action-specific, it seems unlikely that they derive directly from dopamine input to this region. One possibility is that medial prefrontal cortex, which projects heavily to DMS and which has been found to signal prediction errors of action values (Voorn et al., 2004; Matsumoto et al., 2007), may convey prediction error information to DMS. Alternatively, RPEs could be calculated within DMS itself, since information about predicted outcomes is already encoded there along with information about actual outcomes (Kim et al., 2009; Stalnaker et al., 2010). The mechanism through which action-specific RPE-signaling striatal neurons may contribute to the updating of action-outcome associations, or action values, is unknown. Future empirical or computational modeling experiments may be able to test how a modulation of GABA-ergic input that is coincident with dopamine input during prediction errors might act to modify representations encoded by specific populations of mediodorsal striatal neurons.
Acknowledgments
This work was supported by grants from NIDA (K99DA024114, TS; R01DA015718, GS). This article was prepared in part while GS and TS were employed at UMB. The opinions expressed in this article are the author’s own and do not reflect the view of the National Institutes of Health, the Department of Health and Human Services, or the United States government.
References
- Apicella P, Deffains M, Ravel S, Legallet E. Tonically active neurons in the striatum differentiate between delivery and omission of expected reward in a probabilistic task context. Eur J Neurosci. 2009;30:515–526. doi: 10.1111/j.1460-9568.2009.06872.x. [DOI] [PubMed] [Google Scholar]
- Balleine BW, Delgado MR, Hikosaka O. The role of the dorsal striatum in reward and decision-making. J Neurosci. 2007;27:8161–8165. doi: 10.1523/JNEUROSCI.1554-07.2007. [DOI] [PMC free article] [PubMed] [Google Scholar]
- Cayzac S, Delcasso S, Paz V, Jeantet Y, Cho YH. Changes in striatal procedural memory coding corelate with learning deficits in a mouse model of Huntington disease. Proc Natl Acad Sci USA. 2011;108:9280–5. doi: 10.1073/pnas.1016190108. [DOI] [PMC free article] [PubMed] [Google Scholar]
- Centonze D, Picconi B, Gubellini P, Bernardi G, Calabresi P. Dopaminergic control of synaptic plasticity in the dorsal striatum. Eur J Neurosci. 2001;13:1071–1077. doi: 10.1046/j.0953-816x.2001.01485.x. [DOI] [PubMed] [Google Scholar]
- Clatworthy PL, Lewis SJ, Brichard L, Hong YT, Izquierdo D, Clark L, Cools R, Aigbirhio FI, Baron JC, Fryer TD, Robbins TW. Dopamine release in dissociable striatal subregions predicts the different effects of oral methylphenidate on reversal learning and spatial working memory. J Neurosci. 2009;29:4690–4696. doi: 10.1523/JNEUROSCI.3266-08.2009. [DOI] [PMC free article] [PubMed] [Google Scholar]
- Delgado MR, Nystrom LE, Fissell C, Noll DC, Fiez JA. Tracking the hemodynamic responses to reward and punishment in the striatum. J Neurophysiol. 2000;84:3072–3077. doi: 10.1152/jn.2000.84.6.3072. [DOI] [PubMed] [Google Scholar]
- Gage GJ, Stoetzner CR, Wiltschko AB, Berke JD. Selective activation of striatal fast-spiking interneurons during choice execution. Neuron. 2010;67:466–479. doi: 10.1016/j.neuron.2010.06.034. [DOI] [PMC free article] [PubMed] [Google Scholar]
- Haruno M, Kawato M. Different neural correlates of reward expectation and reward expectation error in the putamen and caudate nucleus during stimulus-action-reward association learning. J Neurophysiol. 2006;95:948–959. doi: 10.1152/jn.00382.2005. [DOI] [PubMed] [Google Scholar]
- Haruno M, Kuroda T, Doya K, Toyama K, Kimura M, Samejima K, Imamizu H, Kawato M. A neural correlate of reward-based behavioral learning in caudate nucleus: a functional magnetic resonance imaging study of a stochastic decision task. J Neurosci. 2004;24:1660–1665. doi: 10.1523/JNEUROSCI.3417-03.2004. [DOI] [PMC free article] [PubMed] [Google Scholar]
- Hassani OK, Cromwell HC, Schultz W. Influence of expectation of different rewards on behavior-related neuronal activity in the striatum. J Neurophysiol. 2001;85:2477–2489. doi: 10.1152/jn.2001.85.6.2477. [DOI] [PubMed] [Google Scholar]
- Hori Y, Minamimoto T, Kimura M. Neuronal encoding of reward value and direction of actions in the primate putamen. J Neurophysiol. 2009;102:3530–3543. doi: 10.1152/jn.00104.2009. [DOI] [PubMed] [Google Scholar]
- Houk JC, Adams JL, Barto AG. A model of how the basal ganglia generate and use reward signals that predict reinforcement. In: Houk JCJLD, Beiser DG, editors. Models of information processing in the basal ganglia. Cambridge: MIT Press; 1995. pp. 249–270. [Google Scholar]
- Ito M, Doya K. Validation of decision-making models and analysis of decision variables in the rat basal ganglia. J Neurosci. 2009;29:9861–9874. doi: 10.1523/JNEUROSCI.6157-08.2009. [DOI] [PMC free article] [PubMed] [Google Scholar]
- Johnson A, van der Meer MA, Redish AD. Integrating hippocampus and striatum in decision-making. Curr Opin Neurobiol. 2007;17:692–697. doi: 10.1016/j.conb.2008.01.003. [DOI] [PMC free article] [PubMed] [Google Scholar]
- Kawagoe R, Takikawa Y, Hikosaka O. Expectation of reward modulates cognitive signals in the basal ganglia. Nat Neurosci. 1998;1:411–416. doi: 10.1038/1625. [DOI] [PubMed] [Google Scholar]
- Kim H, Sul JH, Huh N, Lee D, Jung MW. Role of striatum in updating values of chosen actions. J Neurosci. 2009;29:14701–14712. doi: 10.1523/JNEUROSCI.2728-09.2009. [DOI] [PMC free article] [PubMed] [Google Scholar]
- Kimchi EY, Laubach M. Dynamic encoding of action selection by the medial striatum. J Neurosci. 2009;29:3148–3159. doi: 10.1523/JNEUROSCI.5206-08.2009. [DOI] [PMC free article] [PubMed] [Google Scholar]
- Lau B, Glimcher PW. Action and outcome encoding in the primate caudate nucleus. J Neurosci. 2007;27:14502–14514. doi: 10.1523/JNEUROSCI.3060-07.2007. [DOI] [PMC free article] [PubMed] [Google Scholar]
- Lau B, Glimcher PW. Value representations in the primate striatum during matching behavior. Neuron. 2008;58:451–463. doi: 10.1016/j.neuron.2008.02.021. [DOI] [PMC free article] [PubMed] [Google Scholar]
- Legendy CR, Salcman M. Burst and recurrences of bursts in the spike trains of spontaneously active striate cortex neurons. J Neurophysiology. 1985;53:926–39. doi: 10.1152/jn.1985.53.4.926. [DOI] [PubMed] [Google Scholar]
- Lauwereyns J, Watanabe K, Coe B, Hikosaka O. A neural correlate of response bias in monkey caudate nucleus. Nature. 2002;418:413–417. doi: 10.1038/nature00892. [DOI] [PubMed] [Google Scholar]
- Matsumoto M, Matsumoto K, Abe H, Tanaka K. Medial prefrontal cell activity signaling prediction errors of action values. Nat Neurosci. 2007;10:647–656. doi: 10.1038/nn1890. [DOI] [PubMed] [Google Scholar]
- McClure SM, Berns GS, Montague PR. Temporal prediction errors in a passive learning task activate human striatum. Neuron. 2003;38:339–346. doi: 10.1016/s0896-6273(03)00154-5. [DOI] [PubMed] [Google Scholar]
- Montague PR, Dayan P, Sejnowski TJ. A framework for mesencephalic dopamine systems based on predictive Hebbian learning. J Neurosci. 1996;16:1936–1947. doi: 10.1523/JNEUROSCI.16-05-01936.1996. [DOI] [PMC free article] [PubMed] [Google Scholar]
- Morris G, Nevet A, Arkadir D, Vaadia E, Bergman H. Midbrain dopamine neurons encode decisions for future action. Nat Neurosci. 2006;9:1057–1063. doi: 10.1038/nn1743. [DOI] [PubMed] [Google Scholar]
- Nakahara H, Itoh H, Kawagoe R, Takikawa Y, Hikosaka O. Dopamine neurons can represent context-dependent prediction error. Neuron. 2004;41:269–280. doi: 10.1016/s0896-6273(03)00869-9. [DOI] [PubMed] [Google Scholar]
- O’Doherty J, Dayan P, Schultz J, Deichmann R, Friston K, Dolan RJ. Dissociable roles of ventral and dorsal striatum in instrumental conditioning. Science. 2004;304:452–454. doi: 10.1126/science.1094285. [DOI] [PubMed] [Google Scholar]
- Oyama K, Hernadi I, Iijima T, Tsutsui K. Reward prediction error coding in dorsal striatal neurons. J Neurosci. 2010;30:11447–11457. doi: 10.1523/JNEUROSCI.1719-10.2010. [DOI] [PMC free article] [PubMed] [Google Scholar]
- Parthasarathy HB, Graybiel AM. Cortically driven immediate-early gene expression reflects modular influence of sensorimotor cortex on identified striatal neurons in the squirrel monkey. J Neurosci. 1997;17:2477–2491. doi: 10.1523/JNEUROSCI.17-07-02477.1997. [DOI] [PMC free article] [PubMed] [Google Scholar]
- Pasquereau B, Nadjar A, Arkadir D, Bezard E, Goillandeau M, Bioulac B, Gross CE, Boraud T. Shaping of motor responses by incentive values through the basal ganglia. J Neurosci. 2007;27:1176–1183. doi: 10.1523/JNEUROSCI.3745-06.2007. [DOI] [PMC free article] [PubMed] [Google Scholar]
- Reynolds JN, Hyland BI, Wickens JR. A cellular mechanism of reward-related learning. Nature. 2001;413:67–70. doi: 10.1038/35092560. [DOI] [PubMed] [Google Scholar]
- Roesch MR, Taylor AR, Schoenbaum G. Encoding of time-discounted rewards in orbitofrontal cortex is independent of value representation. Neuron. 2006;51:509–520. doi: 10.1016/j.neuron.2006.06.027. [DOI] [PMC free article] [PubMed] [Google Scholar]
- Roesch MR, Calu DJ, Schoenbaum G. Dopamine neurons encode the better option in rats deciding between differently delayed or sized rewards. Nat Neurosci. 2007;10:1615–1624. doi: 10.1038/nn2013. [DOI] [PMC free article] [PubMed] [Google Scholar]
- Schmitzer-Torbert NC, Redish AD. Task-dependent encoding of space and events by striatal neurons is dependent on neural subtype. Neuroscience. 2008;153:349–360. doi: 10.1016/j.neuroscience.2008.01.081. [DOI] [PMC free article] [PubMed] [Google Scholar]
- Schultz W, Apicella P, Ljungberg T. Responses of monkey dopamine neurons to reward and conditioned stimuli during successive steps of learning a delayed response task. J Neurosci. 1993;13:900–913. doi: 10.1523/JNEUROSCI.13-03-00900.1993. [DOI] [PMC free article] [PubMed] [Google Scholar]
- Schultz W, Dayan P, Montague PR. A neural substrate of prediction and reward. Science. 1997;275:1593–1599. doi: 10.1126/science.275.5306.1593. [DOI] [PubMed] [Google Scholar]
- Stalnaker TA, Calhoon GG, Ogawa M, Roesch MR, Schoenbaum G. Neural correlates of stimulus-response and response-outcome associations in dorsolateral versus dorsomedial striatum. Front Integr Neurosci. 2010;4:12. doi: 10.3389/fnint.2010.00012. [DOI] [PMC free article] [PubMed] [Google Scholar]
- Thorn CA, Atallah H, Howe M, Graybiel AM. Differential dynamics of activity changes in dorsolateral and dorsomedial striatal loops during learning. Neuron. 66:781–795. doi: 10.1016/j.neuron.2010.04.036. [DOI] [PMC free article] [PubMed] [Google Scholar]
- Tricomi EM, Delgado MR, Fiez JA. Modulation of caudate activity by action contingency. Neuron. 2004;41:281–292. doi: 10.1016/s0896-6273(03)00848-1. [DOI] [PubMed] [Google Scholar]
- Voorn P, Vanderschuren LJ, Groenewegen HJ, Robbins TW, Pennartz CM. Putting a spin on the dorsal-ventral divide of the striatum. Trends Neurosci. 2004;27:468–474. doi: 10.1016/j.tins.2004.06.006. [DOI] [PubMed] [Google Scholar]
- Wickens JR, Budd CS, Hyland BI, Arbuthnott GW. Striatal contributions to reward and decision making: making sense of regional variations in a reiterated processing matrix. Ann N Y Acad Sci. 2007;1104:192–212. doi: 10.1196/annals.1390.016. [DOI] [PubMed] [Google Scholar]
- Yin HH, Knowlton BJ. Contributions of striatal subregions to place and response learning. Learn Mem. 2004;11:459–463. doi: 10.1101/lm.81004. [DOI] [PMC free article] [PubMed] [Google Scholar]
- Yin HH, Knowlton BJ. The role of the basal ganglia in habit formation. Nat Rev Neurosci. 2006;7:464–476. doi: 10.1038/nrn1919. [DOI] [PubMed] [Google Scholar]
- Yin HH, Knowlton BJ, Balleine BW. Lesions of dorsolateral striatum preserve outcome expectancy but disrupt habit formation in instrumental learning. Eur J Neurosci. 2004;19:181–189. doi: 10.1111/j.1460-9568.2004.03095.x. [DOI] [PubMed] [Google Scholar]
- Yin HH, Knowlton BJ, Balleine BW. Blockade of NMDA receptors in the dorsomedial striatum prevents action-outcome learning in instrumental conditioning. Eur J Neurosci. 2005a;22:505–512. doi: 10.1111/j.1460-9568.2005.04219.x. [DOI] [PubMed] [Google Scholar]
- Yin HH, Ostlund SB, Knowlton BJ, Balleine BW. The role of the dorsomedial striatum in instrumental conditioning. Eur J Neurosci. 2005b;22:513–523. doi: 10.1111/j.1460-9568.2005.04218.x. [DOI] [PubMed] [Google Scholar]
- Yin HH, Mulcare SP, Hilario MR, Clouse E, Holloway T, Davis MI, Hansson AC, Lovinger DM, Costa RM. Dynamic reorganization of striatal circuits during the acquisition and consolidation of a skill. Nat Neurosci. 2009;12:333–341. doi: 10.1038/nn.2261. [DOI] [PMC free article] [PubMed] [Google Scholar]