Abstract
The ventromedial prefrontal cortex (vmPFC) is thought to be related to emotional experience and to the processing of stimulus and action values. However, little is known about how single vmPFC neurons process the prediction and reception of rewards and punishments. We recorded from monkey vmPFC neurons in an experimental situation with alternating blocks, one in which rewards were delivered and one in which punishments were delivered. Many vmPFC neurons changed their activity between blocks. Importantly, neurons in ventral vmPFC were persistently more active in the appetitive “reward” block, whereas neurons in dorsal vmPFC were persistently more active in the aversive “punishment” block. Furthermore, within ventral vmPFC, posterior neurons phasically encoded probability of reward, whereas anterior neurons tonically encoded possibility of reward. We found multiple distinct nonlinear valuation mechanisms within the primate prefrontal cortex. Our findings suggest that different subregions of vmPFC contribute differentially to the processing of valence. By conveying such multidimensional and nonlinear signals, the vmPFC may enable flexible control of decisions and emotions to adapt to complex environments.
Introduction
Ventromedial prefrontal cortex (vmPFC) has been implicated in regulation of emotions and in pathological disorders of mood by clinical and neuroimaging studies in humans (Bechara et al., 1996, 2000; Drevets et al., 1997; O'Doherty et al., 2001; Koenigs et al., 2007; Mayberg, 2009; Price and Drevets, 2010; Plassmann et al., 2010; Murray et al., 2011; Rush-worth et al., 2011; Winckler et al., 2011; Lin et al., 2012). Anatomical studies of primate vmPFC show that vmPFC is connected with subcortical regulators of emotion, known for their involvement in motivating and suppressing action, such as the amygdala (Stefanacci and Amaral, 2000, 2002), nucleus accumbens (Haber et al., 1995), and hypothalamus (Ongür et al., 1998; Rempel-Clower and Barbas, 1998; Ongür and Price, 2000; Myers-Schulz and Koenigs, 2012). However, its role in the processing of emotionally salient events, such as the reception of rewards and punishments, has not been examined at the single-neuron level.
In humans, brain imaging studies have linked changes in blood oxygenation in vmPFC to the processing of rewards (O'Doherty et al., 2001; Noonan et al., 2011; Lin et al., 2012) and suggest that vmPFC is involved in the encoding of the expected values of outcomes (Plassmann et al., 2010; Noonan et al., 2011). However, whether and how single neurons in vmPFC encode values is unknown. For example, it is unknown whether they transmit reward prediction errors, a signal believed to be crucial for learning (Schultz, 2006; Bromberg-Martin et al., 2010c).
Understanding how vmPFC processes appetitive and aversive events is also important to properly target therapeutic interventions for persistent and excessive mood disorders linked to vmPFC abnormalities, such as depression. Although vmPFC has been separated into several anatomical subregions (Carmichael and Price, 1994; Ongür et al., 2003), some of which have been the target of successful deep brain stimulation therapy of major depression (Mayberg, 2009; Holtzheimer and Mayberg, 2011), whether aversive and appetitive events are processed separately in different subregions of vmPFC remains unclear.
To answer these important questions, we recorded from monkey vmPFC neurons in an experimental situation with alternating blocks, one block in which rewards were delivered and one in which punishments were delivered.
Materials and Methods
Two adult male rhesus monkeys (Macaca mulatta) were used for the experiments. All procedures for animal care and experimentation were approved by the Animal Care and Use Committee of the National Eye Institute and complied with the Public Health Service Policy on the humane care and use of laboratory animals. A plastic head holder and plastic recording chamber were fixed to the skull under general anesthesia and sterile surgical conditions. The chambers were tilted laterally by 35° and aimed at the vmPFC and the anterior portion of the caudate nucleus. Two search coils were surgically placed under the conjunctiva of the eyes. The head holder, the recording chamber, and the eye coil connectors were all embedded in dental acrylic that covered the top of the skull and were connected to the skull using ceramic screws. After the monkeys fully recovered from surgery, they were conditioned using a two-block pavlovian procedure with an appetitive unconditioned stimulus (US) (liquid reward) and an aversive US (air puff). During the pavlovian procedure, we recorded the activity of single neurons over a wide area of vmPFC (see Fig. 3). The position of vmPFC was estimated by magnetic resonance imaging (MRI) and by the extent and/or presence of the caudate nucleus above vmPFC. The recording sites were determined using a grid system, which allowed recordings at 1 mm spacing. The recording sites were later reconstructed using an MRI-based method. The accuracy of MRI reconstruction was confirmed by histology in both monkeys. Single-neuron recording was performed using tungsten electrodes (FHC) that were inserted through a stainless-steel guide tube and advanced by an oil-driven micromanipulator (MO-97A; Narishige). Action potential waveforms were digitized and saved using a computer-based data acquisition system (Plexon).
Two-block pavlovian procedure
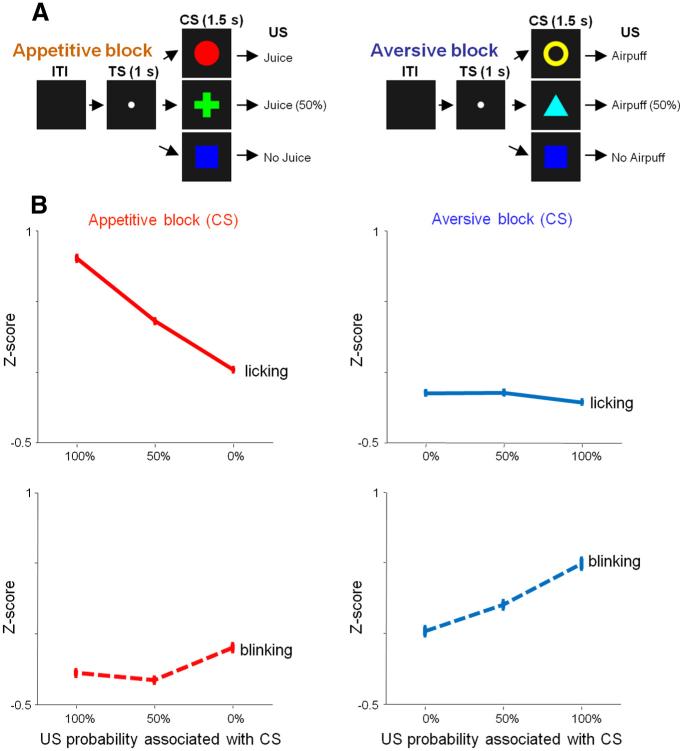
The pavlovian procedure consisted of two blocks: an appetitive block and an aversive block (Fig. 1A) (Matsumoto and Hikosaka, 2009a). In the appetitive block, three conditioned stimuli (CSs) were followed by a liquid reward (apple juice) as an US with 100, 50, and 0% probability, respectively. In the aversive block, three CSs were followed by an air puff directed at the monkey's face as a US with 100, 50, and 0% probability, respectively. The liquid reward was delivered through a spout that was positioned in front of the monkey's mouth. The air puff (35 psi) was delivered through a narrow tube placed 6–8 cm from the face. In either block, each trial started with the presentation of a white dot, hereafter referred to as the trial start cue (TS). After 1 s, the TS disappeared and one of the three CSs was presented pseudorandomly. After 1.5 s, the CS disappeared, and the US (if scheduled for that trial) was delivered. On a subset of sessions, uncued trials were included in which a reward alone (free reward) was delivered during the appetitive block and an air puff alone (free air puff) was delivered during the aversive block. All trials were presented with a random intertrial interval (ITI) that averaged ~7.5 s (5–10 s). One block consisted of 22 trials with fixed proportions of trial types (100%, seven to eight trials; 50%, seven to eight trials; 0%, seven to eight trials; or during sessions in which we included free US the proportions were 100%, six trials; 50%, six trials; 0%, six trials, and four uncued trials). The block changed without any external cue. For each neuron, we collected data by repeating the appetitive and aversive blocks two or more times. We monitored anticipatory mouth movements (licking and lip-ping) and blinking of the monkeys.
Figure 1.
Two-block pavlovian task and behavioral responses. A, In the appetitive block (left), juice was delivered as US. In the aversive block (right), airpuff was delivered as US. In each block, three visual stimuli were used as CS, which predicted US with the probabilities of 100, 50, and 0%. B, Normalized (z-scored) magnitude of licking (top) and blinking (bottom) during the CS epoch in the appetitive (left) and aversive (right) blocks. Vertical bars indicate the mean ± SEM (from single trial z-scores across 152 recording sessions). Licking was correlated to the probability of reward during the appetitive block (ρ = 0.33; p < 0.01). Blinking was correlated to the probability of punishment during the aversive block (ρ = 0.25; p < 0.01). The correlations were performed on single trial z-scores across 152 recording sessions.
To monitor anticipatory mouth movements (licking the juice spout with the tongue or touching it with the lips), we attached a strain gauge to the reward spout and measured strains on the spout resulting from licking and anticipatory lip movements. For simplicity, hereafter we refer to anticipatory mouth movements as licking. To monitor blinking, a magnetic search coil technique was used. A small Teflon-coated stainless-steel wire (<5 mm in diameter, five or six turns) was taped to an eyelid. Eye closure was identified by the vertical component of the eyelid-coil signal.
Data analysis
We studied the responses of single vmPFC neurons during the CS, US, TS, and ITI epochs. To study the activity of single neurons, we generated spike density functions (SDFs) for each trial by convolving spike times with a Gaussian filter (σ = 50 ms, unlessotherwisespecified).Themagnitudeofthe neuronal responses to trial events were expressed intheformofnormalizedtobaselinespikingrate. Baseline was defined as the last 3 s of the ITI be fore the presentation of the TS.
All statistical tests in this study were two tailed. Paired sign-rank tests were used for all across-population comparisons of the magnitude of neuronal responses to task events (i.e., TS response during aversive vs appetitive block). Wilcoxon's rank-sum test was used to test significance across task conditions for single neurons. All correlations were evaluated using Spearman's rank correlations. Correlation significance was tested using a permutation test (20,000 permutations).
To examine the relationship between CS responses and outcome probability, we computed Spearman's rank correlation coefficient for a particular neuronal population. Each neuron contributed three data points, which were the three average responses to the 100, 50, and 0% CSs.
To summarize the differences in neuronal activity across the appetitive and aversive blocks (see Figs. 3, 10), we calculated area under the receiver operating characteristic (ROC) curve (Green and Swets, 1968). ROC areas of 0 and 1 are equivalent statistically; both indicate that the two distributions are completely separate. The analysis was structured so that ROC area values >0.5 indicate that the activity during appetitive block was greater than the activity during aversive block; values <0.5 indicate that the activity was higher in aversive blocks than the appetitive block. Significance of the difference between the two distributions was tested using Wilcoxon's rank-sum test.
To verify that the subjects understood the meanings of the CSs, we measured the magnitude of their licking and blinking during the CS period. During the CS presentation (a period of 1500 ms), we counted the number of milliseconds during which the signal was >3 SDs away from baseline. Baseline was defined as a 1 s period before the presentation of the TS. The vertical component of the eyelid signal obtained from that eye coil was used to evaluate the frequency of blinking. We counted the number of milliseconds during which the signal was >3 SDs away from baseline (same parameters as used to assess anticipatory licking). Licking and blinking measures were normalized within each session by transforming them to z-scores. Anticipatory behavior was assessed across all sessions in which neurons were recorded (n = 152).
TS-related neuronal responses were measured during the first 500 ms unless otherwise specified. CS responses were analyzed during the entire CS epoch (1.5 s). US delivery responses were analyzed in a 1.5 s time window after US delivery unless otherwise specified. ITI analyses were done on activity in a 3 s time window before the presentation of TS unless otherwise specified.
Because the 0% reward CS and 0% air puff CS were physically identical, they could only be distinguished by the block context (appetitive block or aversive block). Therefore, to analyze responses to 0% reward CS and 0% air puff CS, we excluded all trials with the 0% reward CS or the 0% air puff CS that were presented before the block context could be known, that is, before the first presentation of the block of 100% CS, 50% CS, or free outcome.
Verification of recording locations and details of recording-depth analyses
After the end of some recording sessions, we made electrolytic microlesions at the recording sites (15 μA and 30 s) in which we encountered typical ventral and dorsal vmPFC activity. After the conclusion of experiments, the monkeys were deeply anesthetized using sodium pentobarbital and perfused with 10% formaldehyde. The brain was blocked and equilibrated with 10% sucrose. Frozen sections were cut every 50 μm in the coronal plane. The sections were stained with cresyl violet.
We used MRI reconstruction to visualize and localize the locations of the recorded vmPFC neurons. In each recording session, the location of recoded neurons was measured using readings from the micromanipulator calibrated to a reference depth (the bottom of the recording grid). To enable accurate mapping of these recording depths onto MRI, the recording chamber and grid were visualized using MRI by filling them with a solution containing saline and gadolinium. The accuracy of this method was verified by testing that the electrophysiologically measured recording depths of several brain structures [including caudate nucleus, globus pallidus, and anterior commissure (AC)] were mapped accurately onto their locations on the MRIs and that the estimated depths and locations of those structures, and of all marking lesions, matched their actual locations in histology. Therefore, coordinates of each neuron in Figure 3 were confirmed with histology, by electrophysiology, and MRI-based reconstruction.
The depths in Figure 3 are estimated from the bottom of vmPFC along the dorsal–ventral vmPFC axis using MRI. The location of each neuron was estimated in MRI (and verified histologically, as described above). For each coronal MRI slice, we estimated the location of the bottom of vmPFC. Then, for each neuron, we calculated the distance along the dorsal–ventral axis from the bottom of vmPFC. Accuracy of the location of the neuron was checked as described in the previous paragraph.
Results
To study the role of vmPFC in the processing of aversive and appetitive events, we conditioned two male macaque monkeys with a pavlovian procedure with two distinct and persistent situations (from here on referred to as blocks) of opposite valences: one in which rewards (juice) were delivered (appetitive block) and one in which punishments (air puffs) were delivered (aversive block) (Fig. 1A). Each block consisted of discrete trials in which a visual CS cued a rewarding or punishing US with one of three probabilities (100, 50, and 0%). We monitored responses of vmPFC neurons to the CSs that conveyed the probability of the US and to the reception of the US. We also monitored neuronal activity during the ITI and presentation of the TS. During these periods, the animal knew whether to expect rewards (in the appetitive block) or punishments (in the aversive block) but did not know the probability with which they would be delivered (Fig. 1A).
While monkeys participated in the pavlovian procedure, we recorded 152 neurons (37 in monkey T and 115 in monkey S) over a large extent of vmPFC (see Fig. 3A, yellow area). During the recordings, monkeys clearly understood the meaning of the CSs, making anticipatory oral movements (licking) in proportion to reward probability during the appetitive block and anticipatory blinks in proportion to air-puff probability during the aversive block (Fig. 1B).
Regionally distinct coding of valence within vmPFC
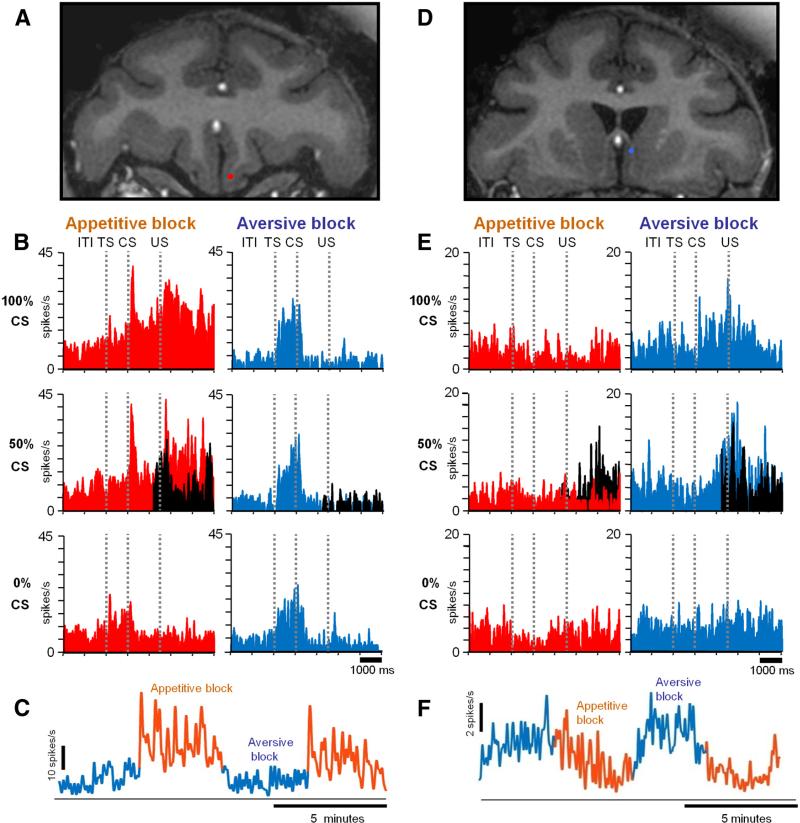
Many vmPFC neurons changed their activity in relation to appetitive/aversive blocks. Two example neurons are shown in Figure 2, A–C and D–F. The first neuron was recorded in the ventral part of the vmPFC (Fig. 2A, red dot) and preferred the appetitive block (Fig. 2B). In the appetitive block, the neuron was excited by CSs, indicating that an upcoming reward was probable (i.e., 100% CS and 50% CS). It was also excited by the delivery of the reward (US). In the aversive block, the neuron was less active except for the period after TS. The activity of the neuron during ITI (measured during a 3 s period before TS) was higher in the appetitive block than in the aversive block (ITI activity after nonrewarded trials vs aversive block ITI; Wilcoxon's rank-sum test; p < 0.01). Overall, the activity of this neuron was related to the possibility and reception of reward; thus, we term the neuron “positive neuron.”
Figure 2.
Two example neurons in the vmPFC. A–C, A neuron that preferred the appetitive block (positive neuron). D–F, A neuron that preferred the aversive block (negative neuron). A, D, Recording sites plotted on coronal MR images (red, positive neuron; blue, negative neuron). B, E, Average spike activity shown separately for different CSs in the appetitive and aversive blocks. Shown in black is the activity in trials when US was omitted. The spike activity is shown by SDFs (σ = 50 ms). C, F, Across-block changes in spike activity (σ = 2000 ms).
The second example neuron was recorded in the dorsal part of the vmPFC (Fig. 2D, blue dot) and preferred the aversive block (Fig. 2E). In the aversive block, the activity of the neuron increased after CSs, indicating that an upcoming punishment was probable (i.e., 100% CS and 50% CS), and the increase in activity was maintained until sometime after the delivery of the punishment. In the appetitive block, the neuron was less active except after the omission of the reward in 50% CS trials (black SDF). Thus, we term this neuron “negative neuron.”
The distinct response properties of these two neurons can also be appreciated in Figure 2, C and F, in which their activity is shown continuously across repeated changes in appetitive/aversive blocks. These graphs confirm that the activity of the positive neuron was higher in the appetitive than aversive block, whereas the activity of the negative neuron was higher in the aversive than appetitive block. Notably, the activity of both neurons changed during one block. This indicates that the activity of these neurons was not solely determined by individual events (TS, CS, US) but was also influenced by the progress of the current context (i.e., appetitive or aversive block) and/or the nearing of the alternate context.
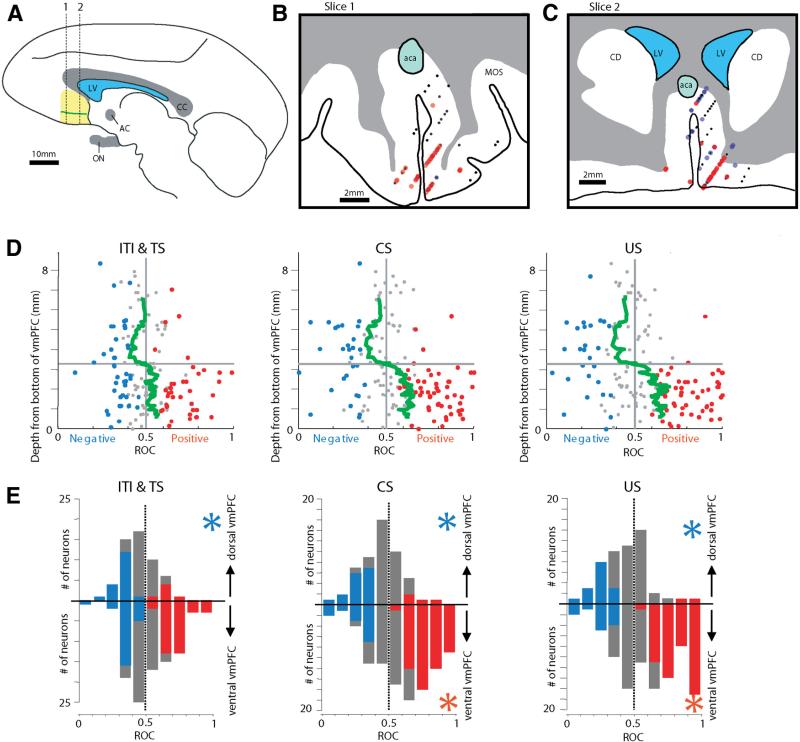
We found that positive and negative neurons were distributed differently in the vmPFC. In two coronal sections in Figure 3, B and C, red dots indicate the locations of neurons preferring the appetitive block (positive neurons) (n = 55), whereas blue dots indicate the locations of neurons preferring the aversive block (negative neurons) (n = 29). The classification was based on ROC analysis that compared activity during the CS period (50% and 100% CSs) between the appetitive and aversive blocks. If the ROC value was significantly larger or smaller than 0.5 (Wilcox-on's rank-sum test; p < 0.05), the neuron was classified as a positive or negative neuron, respectively. Small black dots indicate neurons that were not significantly different from 0.5. A majority of positive neurons were located in the ventral part of the vmPFC, whereas negative neurons were abundant in the dorsal vmPFC.
Figure 3.
Regionally differential encoding of appetitive and aversive blocks within vmPFC. A, Single neuronal activity was recorded in the vmPFC (yellow area) from 7 to 15 mm anterior to the anterior commissure (AC). The green line demarcates the dorsal and ventral vmPFC defined physiologically (see D). CC, Corpus callosum; ON, optic nerve; LV, lateral ventricle. This drawing is based on a parasagittal MR image through the vmPFC. B, C, Recording sites of positive neurons (red dots) and negative neurons (blue dots) plotted on two coronal sections. The positions of the sections are indicated by dotted lines in A. Small black dots indicate non-modulated neurons. The anterior recording sites (12–15 mm from AC) are included in B; the posterior recording sites (7–11 mm from AC) are included in C. CD, Caudate nucleus; aca, anterior cerebral artery; MOS, medial orbital sulcus. D, The magnitudes of the differential encoding of appetitive and aversive blocks in individual neurons (abscissa) plotted against the depth from the bottom of the vmPFC (ordinate). The magnitudes of the differential block encoding are expressed as ROC areas (see Materials and Methods). They are shown separately for three epochs: ITI and TS (neuronal activity compared in the last 3 s of ITI and first 500 ms of the TS period), after CS (neuronal activity compared during the entire CS epoch; data pooled for 100 and 50% CSs), and after US (neuronal activity compared in the first 1 s after US). The green line indicates the smoothed ROC areas at individual depths. It was obtained by computing a running average of ROC areas of 20 neurons moving one neuron at each step. E, Differential distributions of the state preference magnitudes between the dorsal vmPFC (top) and the ventral vmPFC (bottom) for the individual periods. The dorsal–ventral border was demarcated at the 3.3 mm transition point shown in D. Neurons that displayed significant preference for appetitive or aversive blocks are shown in red or blue, respectively. A blue asterisk indicates that the mean preference magnitude was significantly smaller than 0.5 (p < 0.05; sign test), meaning that the population preferred the aversive block. A red asterisk indicates that the mean preference magnitude was significantly larger than 0.5 (p < 0.05; sign test), meaning a preference for the appetitive block.
The dorsal–ventral difference in the appetitive/aversive preference is also illustrated in Figure 3D, separately for three epochs: (1) during ITI and TS epochs (left); (2) for 100 and 50% CS responses (middle); and (3) for US delivery responses (right). The regional difference is summarized by running averages of ROC areas for each epoch (green line). In the dorsal-to-ventral direction, the averaged appetitive/aversive block preference shifted from the negative side to the positive side. For all epochs, the estimated transition point was 3.3 mm from the bottom of the vmPFC.
In the dorsal vmPFC (above the transition point), most appetitive/aversive block-coding neurons were negative (n = 16 of 20). In the ventral vmPFC, a majority of block-coding neurons were positive (n = 51 of 64), but a small number of neurons were negative (n = 13 of 64).
The results of Figure 3D indicate that neurons in vmPFC encode appetitive/aversive blocks persistently during all trial epochs and that the preference for appetitive and aversive blocks was roughly segregated along the dorsal–ventral axis of vmFPC. This is also illustrated in Figure 3E, which compares the distributions of the appetitive/aversive preference magnitudes between the dorsal and ventral vmPFC.
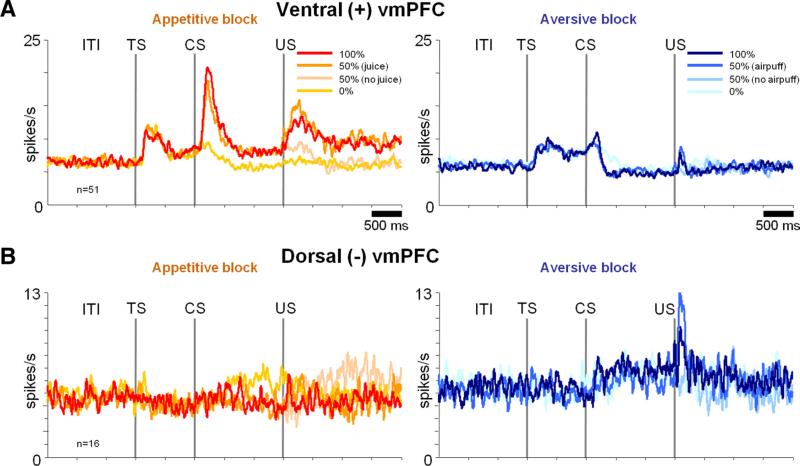
Figure 3 suggests differences in the processing of the possibility (during the ITI and TS), probability (during the CS), and reception of rewards and punishments (after the US) in dorsal and ventral vmPFC. In the following analyses, we examine the details of CS, US, and TS responses in dorsal and ventral vmPFC (see Figs. 4 – 8). We mostly concentrated on the dominant group of modulated neurons in each region: positive neurons in the ventral region [Fig. 4A, hereafter denoted as ventral (+) vmPFC neurons] and negative neurons in the dorsal region [Fig. 4B, hereafter denoted as dorsal (–) vmPFC neurons].
Figure 4.
Dorsal and ventral vmPFC neurons were sensitive to rewards and punishments in different manners. A, Average activity of positive neurons in the ventral vmPFC in the appetitive (left) and aversive (right) block. B, Average activity of negative neurons in the dorsal vmPFC activity in the appetitive (left) and aversive (right) block. The classification of neurons into positive and negative types was based on their responses to CSs (100 and 50% appetitive CSs vs 100 and 50% aversive CSs).
Responses to CSs
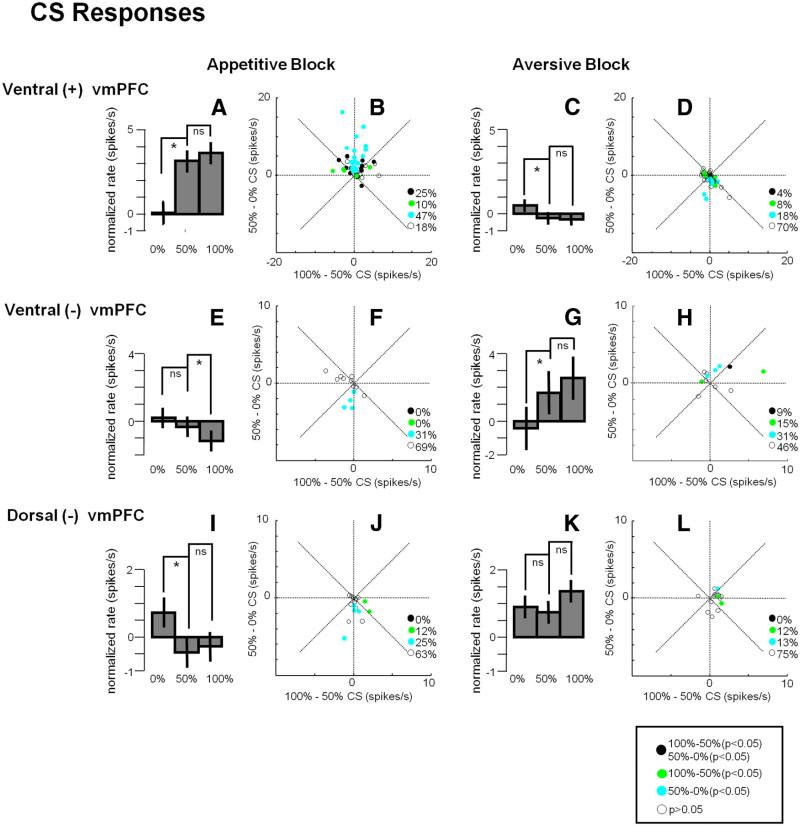
Ventral (+) vmPFC neurons responded to reward-predicting CSs phasically and tonically (Fig. 4A, left). Overall, their CS responses were correlated to the probability of the reward US (ρ = 0.22; p = 0.005). However, the encoding of reward probability was highly nonlinear: they responded to the 100 and 50% reward CSs similarly (see Fig. 6A; p > 0.05) but only weakly to the 0% reward CS (see Fig. 6A; 50% CS response compared with 0% CS response: p < 0.001). As shown in Figure 6B, a large proportion of ventral (+) vmPFC neurons (47%) differentiated between the 50 and 0% CSs but not between the 100 and 50% CSs. Therefore, many ventral vmPFC neurons did not accurately encode reward probability. In the aversive block, ventral (+) vmPFC neurons showed little response to the punishment predicting CSs (Fig. 4A, right; see also Fig. 6D).
Dorsal (–) vmPFC neurons responded to CSs in the aversive block with tonic increases in activity (p < 0.001) (Fig. 4B, right). However, these tonic responses were overall unrelated to the probability of the punishment US (ρ = 0.05; p = 0.7). A majority of them (75%) discriminated neither between the 0 and 50% punishment CSs nor between the 50 and 100% punishment CSs (see Fig. 6K). In the appetitive block, the dorsal (–) vmPFC neurons showed little response to the reward predicting CSs (50 and 100% reward CSs; p > 0.05) but were tonically excited by the 0% reward CS (Fig. 4B, left; see also Fig. 6I; p < 0.05). The latter response can be observed in Figure 6J at the level of single neurons. In short, dorsal (–) vmPFC neurons were excited by the CS, denying a good outcome in the appetitive block, but were not sensitive to the relative values of the CSs in the aversive block.
We found a small number of negative neurons (n = 13) in the ventral vmPFC (hereafter denoted as ventral (–) vmPFC neurons; Figs. 3D, 5). In the aversive block, the negative neurons were equally excited by the 100 and 50% air-puff CS (p > 0.5; Fig. 6G) and less so by the 0% air-puff CS (p < 0.01). Thus, the ventral (–) vmPFC neurons encoded the US probability nonlinearly, similarly to the ventral (+) vmPFC neurons (Fig. 6F,H).
Figure 5.
Negative neurons in the ventral vmPFC. Same conventions as in Figure 4.
Figure 6.
A–L, CS responses in three groups of vmPFC neurons. Top, Ventral (+); middle, ventral (–); bottom, dorsal (–). Bar graphs show the average ± SEM CS responses in the appetitive block (left) and the aversive block (right). Asterisks indicate significant differences between conditions (paired sign-rank test; p < 0.05); ns indicates not significant. All responses were normalized relative to baseline in each block. Scatter plots show, for individual neurons, the difference between 100–50% CS responses (x-axis) and 50–0% CS responses (y-axis). Filled circles indicate neurons with significant variance (Wilcoxon's rank-sum test; p < 0.05). Black circles, Neurons showing significant differences in CS response in both 100–50% comparison and 50–0% comparison. Green circles, Neurons showing significant differences in only 100–50% comparison. Cyan circles, Neurons showing significant differences in only 50–0% comparison. White circles, neurons showing no significant differences. Percentages of these groups are indicated in each scatter plot.
Responses to USs
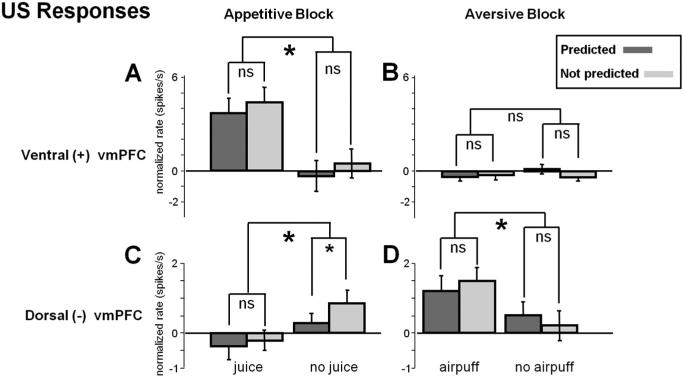
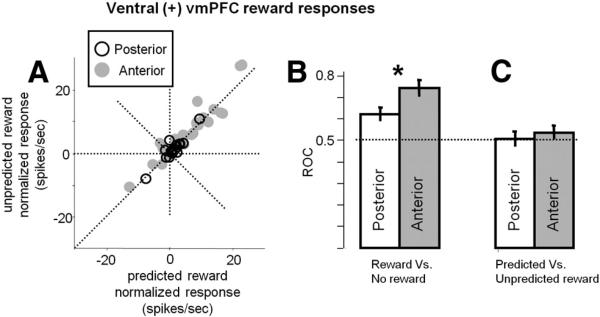
The ventral (+) vmPFC neurons were excited by the delivery of reward (juice) (Fig. 4A, left) (p < 0.001) but not by the delivery of punishment (airpuff) (Fig.4A, right). But their averaged response to the reward (Fig. 4A, left) was not strongly influenced by the expectation of the reward. The magnitude of the response was not significantly different whether the reward was fully expected (i.e., 100%) or the reward was half expected (i.e., 50%) (Fig. 7A, left). Also, the neurons showed no clear change in activity in response to the omission of the reward (Fig.4A, left), regardless of whether the omission was fully expected (i.e., 0%) or half expected (i.e., 50%) (Fig. 7A, right).
Figure 7.
A–D, US responses in two groups of vmPFC neurons. Top, Ventral (+); bottom, dorsal (–). The average ± SEM US responses are shown for the appetitive block (left) and the aversive block (right). All responses were normalized relative to baseline in each block. Small asterisks indicate a significant difference between predicted and not predicted outcomes; large asterisks indicate significant difference between outcome delivery and omission (paired sign-rank test; p < 0.05); ns indicates not significant.
Their features were different from neurons that encode reward prediction errors that are found in the subcortical motivation network, including dopamine neurons (Schultz et al., 1997; Bromberg-Martin et al., 2010c) and some frontal cortical structures, such as the anterior cingulate (Wallis and Kennerley, 2011).
The dorsal (–) vmPFC neurons were phasically excited by the delivery of punishment (air puff) (Fig. 4B, right) (p < 0.05). The responses were not significantly influenced by the expectation of the punishment (p > 0.1) (Fig. 7D, left). Thus, the dorsal (–) vmPFC neurons did not encode punishment prediction errors. However, they did encode reward prediction errors: they were tonically excited by the omission of the reward (Figs. 4B, left, 7C, right).
Responses to TS
The TS indicates the possibility and nearing of an outcome (i.e., juice in the appetitive block, air puff in the aversive block) and is known to evoke strong phasic responses in neurons encoding motivational value or salience (Belova et al., 2008; Bromberg-Martin et al., 2010a,b; Hong et al., 2011). We found that vmPFC neurons also responded to the TS.
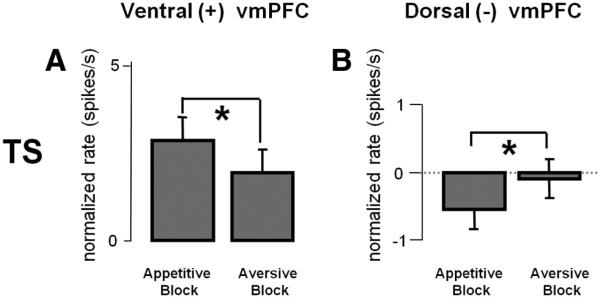
In Figure 8 we analyze the response to TS separately for the ventral (+) vmPFC neurons and the dorsal (–) vmPFC neurons. For the ventral (+) vmPFC neurons, the activity during the TS was higher in the appetitive block than in the aversive block (p < 0.01; Fig. 8A). The dorsal (–) vmPFC neurons were inhibited by TS in the appetitive block, in the way opposite to the positive neurons in the ventral vmPFC (p < 0.05; measured across the entire TS period; Fig. 8B).
Figure 8.
A, B, TS responses in two groups of vmPFC neurons. Left, Ventral (+); right, dorsal (–). The averaged ± SEM TS responses are shown for the appetitive and aversive blocks. All responses were normalized relative to baseline in each block. Asterisks indicate a significant difference between the aversive and appetitive blocks (paired sign-rank test; p < 0.05). Because dorsal (–) neurons had a slow tonic response to the TS, for this analysis of dorsal (–) TS responses, the entire TS period was used.
These data indicate that vmPFC neurons display a preference for an appetitive or aversive context in a manner consistent with the expected outcome: a positive outcome (juice) in the appetitive block and a negative outcome (air puff) in the aversive block.
Anterior and posterior functional organization in the ventral vmPFC
We have so far shown that the vmPFC contains positive and negative neurons and that they are segregated more or less separately in the ventral and dorsal regions. Among positive neurons in the ventral vmPFC, we found functional differences along the anterior–posterior axis.
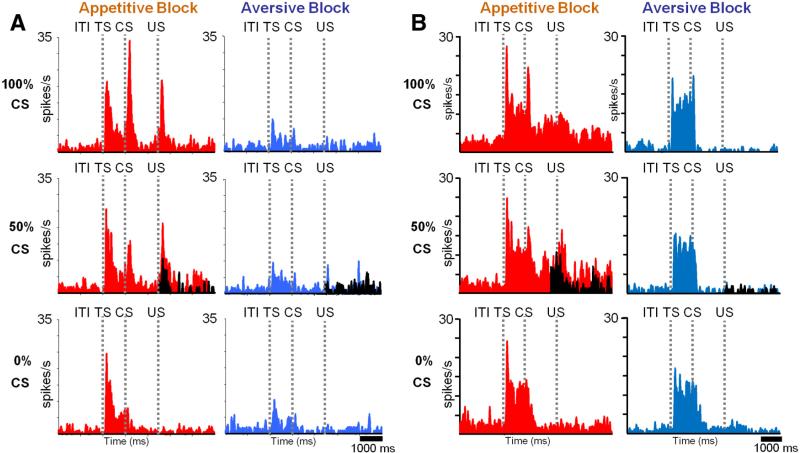
Figure 9 shows activity of two neurons in the ventral vmPFC, one that displayed phasic responses (A) and one with both phasic and tonic responses (B). The tonic neuron continuously preferred the appetitive block, even during the ITI (ITI activity after nonrewarded trials vs aversive block ITI; Wilcoxon's rank-sum test; p < 0.05). The phasic neuron responded to the TS more strongly in the appetitive block than in the aversive block but did not prefer the appetitive block during the ITI period (p > 0.1).
Figure 9.
Examples of phasic (A) and tonic (B) neurons in the ventral vmPFC. Conventions are the same as in Figure 2.
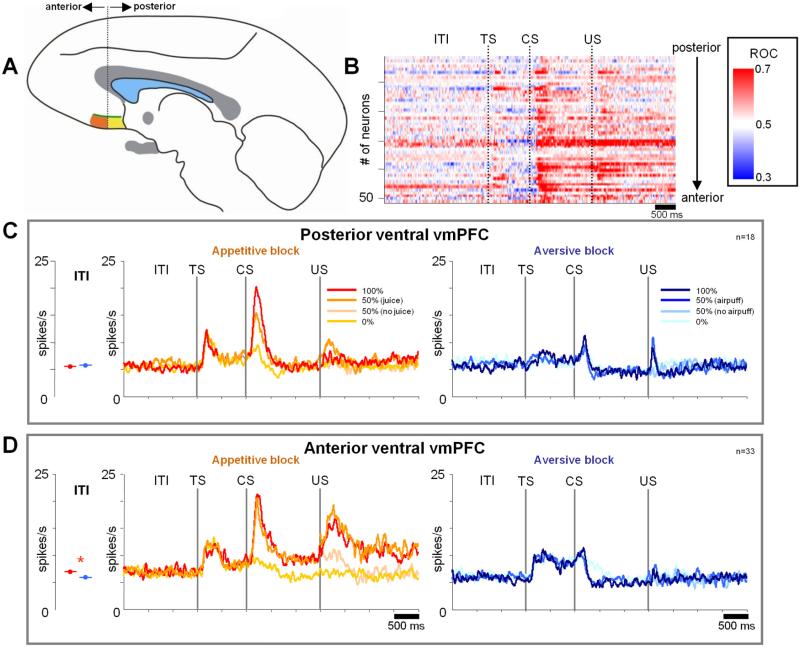
We found more phasic neurons in the posterior regions of ventral vmPFC and more tonic neurons in the anterior regions of ventral vmPFC. This can be observed in Figure 10B for individual neurons. This difference became clear when we split these positive ventral neurons into posterior and anterior groups (division shown in Fig. 10A) and averaged their activity separately (Fig. 10C vs D). This analysis revealed more differences. First, the nonlinear nature of their responses to the reward CSs (Fig. 6A) was more prominent among the anterior neurons: their responses to the 100 and 50% reward CSs were very similar (500 ms time window from CS presentation: p = 0.0525; 1000 ms time window from 500 ms after CS presentation to US: p = 0.89; entire CS period: p > 0.27). Second, the response to reward delivery was stronger and more tonic among the anterior neurons (Figs. 10C vs D, 11). Note, however, that at the population level neither the anterior nor posterior neurons strongly signaled reward prediction errors (Fig. 11A, C). Finally, the block differential activity during the ITI period was frequently observed among the anterior neurons (p = 0.004) but not among the posterior neurons (p = 0.68).
Figure 10.
Subregional organization within the ventral vmPFC. A, The regions of recording within the posterior (yellow) and anterior (orange) region of the ventral vmPFC. Posterior region, 7–11 mm from AC; anterior region, 12–15 mm from AC. B, Within-trial changes in the appetitive/aversive differential coding shown for individual vmPFC neurons. Each line indicates the data from a single neuron. The magnitudes of the differential encoding are expressed as ROC areas (derived by a running ROC analysis comparing single trial SDFs in the appetitive and aversive blocks at every millisecond) and are color coded. Neurons are sorted according to their locations along the posterior–anterior axis. Only positive neurons are shown. C, D, Average activity of positive neurons in the posterior region (C) and the anterior region (D) of the ventral vmPFC. The same convention as in Figure 4. Average ITI activity in appetitive (red) and aversive (blue) blocks is shown to the left of the SDFs. An asterisk indicates a significant difference (paired sign-rank test; p < 0.05).
Figure 11.
Comparison of ventral vmPFC responses to predicted and unpredicted reward delivery. A, Each data point indicates the responses of a single ventral vmPFC neuron to the predicted reward US (x-axis) and the unpredicted reward US ( y-axis). The data are shown separately for the anterior (gray) and posterior (black) regions in the ventral vmPFC. B, Differential coding of ventral vmPFC neurons between reward delivery (after 100 and 50% reward cues) and reward omission (after 0 or 50% reward cues). The magnitude of the differential encoding was measured by ROC areas. The average ± SEM ROC area is shown separately for the anterior and posterior regions of the ventral vmPFC. Values above 0.5 indicate stronger responses to reward delivery than to reward omission. C, Differential coding of ventral vmPFC neurons between the predicted reward delivery (after 100% reward cues) and the unpredicted reward delivery (after 50% reward cues). Same conventions as in B. Values above 0.5 indicate stronger responses to the unpredicted than predicted reward delivery. Asterisk indicates significant difference in the average ROC area between the posterior and anterior regions of the ventral vmPFC (Wilcoxon's rank-sum test; p < 0.05).
Tonic TS activity in anterior ventral (+) vmPFC activity is correlated to the possibility of reward
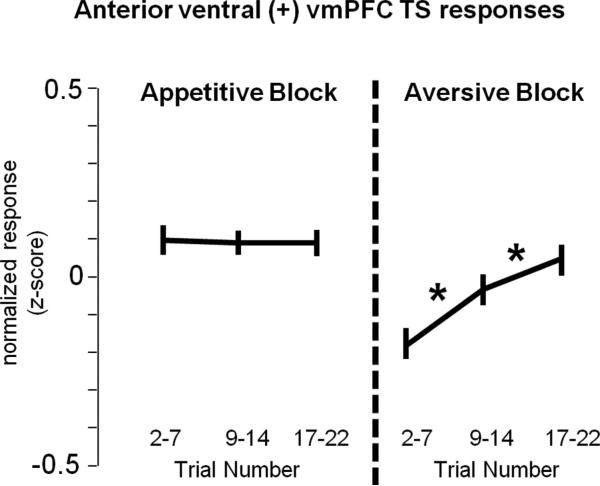
Ventral (+) neurons responded more strongly to the TS in the appetitive block than aversive block (p < 0.05). This difference was especially clear for the posterior ventral neurons because the anterior ventral neurons displayed a tonic elevation during the TS period in the aversive block (Fig. 10C vs 10D). This tonic elevation was immediately suppressed when an aversive block CS appeared, indicating 0% chance of reward and potential punishment. Because during the TS the monkeys did not always know which block they were in (especially during the latter part of each block when the block switch was nearing), we hypothesized that this tonic aversive block TS activity was related to the possibility of the appetitive block. To test this hypothesis, we performed a correlation between trial number and TS activity (Fig. 12). Across the population of anterior ventral (+) neurons, there were no significant changes in TS activity during the appetitive block (although some single neurons did show decreasing TS activity in the appetitive block as time of block-switch approached). However, there was a clear positive correlation between TS activity and trial number in the aversive block (ρ = 0.11; p < 0.001; correlation across 33 anterior ventral (+) neurons was performed on single-trial TS responses that were first converted to z-scores; Fig. 12), indicating that the anterior ventral TS responses during the aversive block increased as the possibility of the appetitive block increased.
Figure 12.
Within-block changes in TS response in the anterior region of the ventral vmPFC. One block of trials was separated into the early, middle, and late sub-blocks, and single-trial TS responses were obtained for each sub-block for all 33 anterior ventral (+) vmPFC neurons. For each neuron, single-trial responses were converted to z-scores (normalized relative to the average TS response across both the aversive and appetitive blocks). Asterisks indicate significant differences in activity between adjacent sub-blocks (Wilcoxon's rank-sum test; p < 0.05). Because anterior ventral aversive block TS responses were tonic and continued until the presentation of the aversive CSs, for this analysis, TS responses were measured for the entire TS period.
Background activity of anterior ventral vmPFC is related to valence context
The ITI block preference was especially prominent in the dorsal (–) vmPFC (ITI activity was higher in the aversive than appetitive block; p < 0.05) and in the ventral anterior vmPFC (ITI activity was higher in the appetitive block than aversive block; p = 0.004).
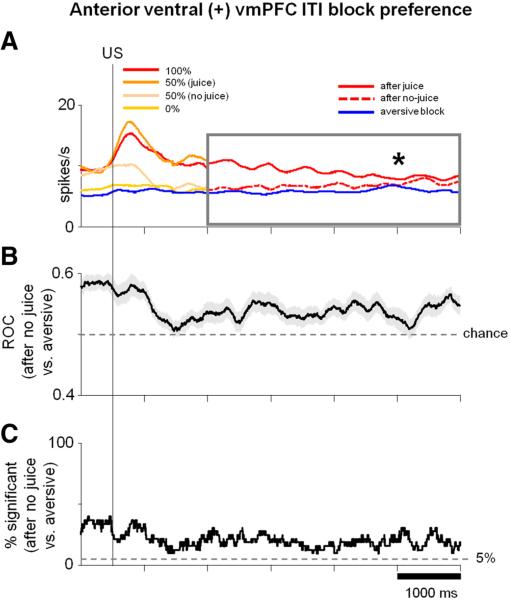
However, ventral anterior vmPFC neurons responded tonically to rewards. Therefore, we tested whether their ITI block preference can be explained by the outcome of the previous trial. We found that they cannot. Figure 13 shows that the activity of anterior ventral positive neurons was persistently higher in the appetitive than aversive block regardless of the outcome of the previous trial.
Figure 13.
Anterior ventral vmPFC ITI activity is related to valence context. A, SDFs of aver-age activity of positive neurons in the anterior region of ventral vmPFC (σ = 300ms) aligned on US in the appetitive and aversive blocks. Colors of SDFs in the appetitive block for the first 1.5 s after US are the same as in Figure 10D. Reward delivery and omission responses after 100, 50, and 0% CSs are shown separately. Because these neurons were not strongly modulated by punishment delivery and omission (Fig.10 D; right), all trials in the aversive block are combined (blue SDF). ITI activity after 1.5 s after the US (shown in the gray box) is sorted into three categories: ITI after rewards (solid red line), ITI after no rewards (dotted red line), and ITI during aversive block (blue line). Asterisk indicates significant difference between the level of ITI activity after no-reward trials and aversive block trials (paired sign-rank test; p < 0.01; comparison made for activity in the time window indicated by the gray box). B, Average ± SEM ROC (shaded region). For each neuron, a running ROC analysis (at each millisecond of the SDFs in A) compared ITI activity after no-reward trials in the appetitive block with ITI activity in the aversive block (blue line in A). C, Percentage of neurons in time with significant differences in ITI activity after no-reward trials in the appetitive block versus ITI activity during the aversive block (tested at each millisecond of the SDFs in A; two-tailed rank-sum test; p < 0.05).
Therefore, the background activity of many vmPFC neurons, like the activity during the TS epoch, displays a preference for the appetitive or aversive context in a manner consistent with the expected outcome: a positive outcome in the appetitive block and a negative outcome in the aversive block.
Histological confirmation of recording sites in ventral and dorsal vmPFC
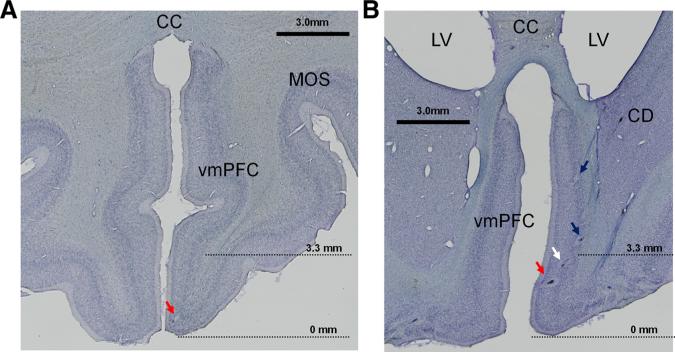
We performed histological analyses to verify the accuracy of our reconstruction method. Electrolytic marks were placed in regions in which appetitive- and aversive-preferring activity were observed. Some of them can be observed in two histological slices in Figure 14. In both monkeys, aversive preference and appetitive preference were largely segregated in vmPFC tissue to dorsal and ventral vmPFC regions. The dorsal regions roughly correspond to area 25 (A25), whereas the ventral regions corresponded to A14 (Carmichael and Price, 1994; Saleem, 2007). Anterior dorsal vmPFC regions in which we did not find much modulation (Fig. 3B) correspond to regions anterior to A25.
Figure 14.
Histological confirmation of recording sites within the vmPFC. A, A coronal section 14 mm anterior to the anterior commissure (AC) showing an electrolytic mark at which a positive neuron was recorded. B, A coronal section of the vmPFC 10 mm anterior to the AC. Three electrolytic marks (shown by 3 arrows) along a recording track indicate the recording sites of a positive neuron (red arrow), nonsignificant neuron (white arrow), and negative neuron (blue arrow). A fourth mark (blue arrow dorsal to the 3 marks) indicates the recording site of a negative neuron. The positive neurons in A and B were judged to be in the ventral vmPFC (because they were below the 3.3 mm transition point), whereas the negative neurons were judged to be in the dorsal vmPFC. Locations of the two histological slices are shown on a drawing from a parasagittal MR image through the vmPFC in Figure 3A and correspond to coronal MR images shown in Figure 3, B and C. The transition point between the ventral-positive region and the dorsal-negative region (3.3 mm from the bottom; see Fig. 3) is indicated by dotted lines. CD, Caudate nucleus; CC, corpus callosum; LV, lateral ventricle; MOS, medial orbital sulcus.
Discussion
We found that many neurons in monkey vmPFC are sensitive to valence. Within the vmPFC, rewards are overwhelmingly encoded by neurons in its ventral part, whereas punishments are preferentially encoded by neurons in its dorsal part. Dorsal vmPFC neurons were more active during the aversive block, but their activity was not strongly related to trial events that conveyed the probabilities of punishments. In contrast, ventral vmPFC neurons were more active during the appetitive block and were sensitive to the prediction and reception of rewards. The ventral vmPFC was further divided into posterior and anterior divisions: posterior neurons tended to encode the probability of reward phasically, whereas anterior neurons tended to encode the possibility of reward tonically.
Differential valence coding along dorsal–ventral axis of vmPFC
Ventral vmPFC approximately matches the location of A14 (Carmichael and Price, 1994; Saleem, 2007). A14 is located in the gyrus rectus (GR), a highly developed structure in primates. Our data help explain the observations that, in humans, lesions of GR interfere with the subject's ability to feel pleasure (Winckler et al., 2011) and that reductions in the volume of GR is correlated with major depression (Bremner et al., 2002). Our data also provide important information for interpreting lesion studies of monkey A14, which also suggest that it is involved in the processing of reward-related information (Noonan et al., 2010; Rudebeck and Murray, 2011; Rushworth et al., 2011). Based on our findings and clinical studies, we hypothesize that the ventral vmPFC signals pleasure and excitement, which may then promote actions to bias monkeys and humans to seek appetitive blocks.
Dorsal vmPFC in which we found predominantly negative-preferring neurons approximately matches the location of A25 (Carmichael and Price, 1994; Saleem, 2007), a region that is thought to play a major role in human depression (Drevets et al., 1997; Ressler and Mayberg, 2007), is suppressed by action and attention and excited by sleep (Rolls et al., 2003), and is connected with a variety of structures involved in emotional processing, such as nucleus accumbens, the limbic hippocampus, and the amygdala (Haber et al., 1995; Stefanacci and Amaral, 2002). Our findings help to understand the striking fact that the electrical stimulation of human A25 relieves symptoms of severe unipolar depression (Mayberg, 2009). This continuous stimulation may inhibit dorsal vmPFC and thus reduce its negative signal. It is possible that A25 may provide a general mechanism to slow down action, particularly when adverse consequences are likely.
Nonlinear value coding in the ventral vmPFC
Choosing an action aiming at an optimal goal requires accurate coding that is proportional to expected outcome values (Schultz, 2006) in appetitive or aversive contexts, as seen in some dopamine neurons (Schultz et al., 1997; Matsumoto and Hikosaka, 2009b). The ventral vmPFC was heterogeneous in this respect. On average, positive neurons in its posterior division encoded the expected reward values in an approximately linear manner. In contrast, on average, positive neurons in the anterior division encoded the expected reward values in a highly nonlinear manner, responding almost as strongly when an outcome was possible but uncertain (50% CS) as when the outcome was entirely certain (100% CS). They were also persistently active during the ITI in the appetitive block, when upcoming rewards were possible but uncertain. Thus, whereas posterior ventral vmPFC neurons are suitable for choosing an action to obtain the best reward, anterior ventral vmPFC neurons are suitable for promoting general readiness to obtain a reward regardless of its likelihood, which may be particularly important in uncertain situations.
Comparison with the dopaminergic system
Outcome values are encoded by neurons in many brain areas (O'Doherty et al., 2002; Burke et al., 2008; Hikosaka et al., 2008; Rushworth et al., 2009; Salzman and Fusi, 2010; Bromberg-Martin et al., 2010c; Litt et al., 2011; Wallis and Kennerley, 2011). Perhaps the most well documented are midbrain dopamine neurons (Schultz et al., 1997), particularly those located in ventromedial substantia nigra pars compacta and ventral tegmental area (Matsumoto and Hikosaka, 2009b). Neurons in vmPFC were different from the “value-coding” dopamine neurons in several respects.
First, the value-coding dopamine neurons linearly encoded the relative values of the CSs in both appetitive and aversive blocks (Matsumoto and Hikosaka, 2009b), whereas many vmPFC neurons did not (discussed above; Fig. 6).
Second, value-coding dopamine neurons strongly encoded reward prediction errors (Schultz et al., 1997), whereas many vmPFC neurons did not (Fig. 7). Dopamine neurons are therefore well suited to update action–reward expectations. In contrast, vmPFC neurons are more strongly linked to the processing of the reception of their preferred outcomes (O'Doherty et al., 2001; Bouret and Richmond, 2010; Noonan et al., 2010; Rudebeck and Murray, 2011; Rushworth et al., 2011).
Third, many vmPFC neurons were sensitive to the valence of blocks during all trial epochs. Even their background (ITI) activity and TS responses often changed across appetitive and aversive blocks. In contrast, dopamine neurons showed no difference in their ITI activity or TS responses between the appetitive and aversive blocks (Matsumoto and Hikosaka, 2009b).
We suggest that vmPFC activity is well suited for regulating internal states (e.g., excitement to seek reward) based on overall context, whereas the dopaminergic system participates in biasing future actions based on action–reward mappings.
Comparison with the orbitofrontal cortex
It is thought that orbitofrontal cortex (OFC; A13 and A11), situated laterally to vmPFC, and vmPFC both contribute to motivation and emotion related to valence (Rempel-Clower, 2007). What then is the difference between these neighboring regions?
First, although both vmPFC and OFC have extensive projections to some limbic structures, such as the amygdala (Ongür and Price, 2000; Price and Drevets, 2010), vmPFC has particularly strong projections to the hypothalamus (Ongür et al., 1998; Rempel-Clower and Barbas, 1998). Second, OFC receives inputs from sensory systems (Cavada et al., 2000), whereas vmPFC does not (Barbas et al., 1999). Third, OFC and vmPFC project to different regions of the striatum. vmPFC has particular dense projections to nucleus accumbens (Haber et al., 1995; Ongür and Price, 2000), whereas OFC does not (Haber et al., 1995).
Based on imaging, lesion, and anatomical studies, we hypothesize that OFC may be important for stimulus–value learning that is critical for motivating action to reward (Noonan et al., 2010; Tsuchida et al., 2010; Walton et al., 2010; Rudebeck and Murray, 2011; Schoenbaum et al., 2011), whereas dorsal and ventral vmPFC may be well situated to control emotional states that may also influence action but in a different manner than OFC (Noonan et al., 2010; Rudebeck and Murray, 2011).
Indeed, a study that recorded neurons from vmPFC and OFC in a task in which neuronal activity could be linked to external (stimulus value) or internal motivational factors (e.g., satiety) (Bouret and Richmond, 2010) found that vmPFC encodes internal motivational processes, whereas OFC encodes stimulus values (e.g., external environment-centered value information).
Behavioral and mental manifestations of vmPFC dysfunctions
Our findings may help promote better understanding and treatment of persistent disorders of mood associated with vmPFC. For example, we found that many ventral vmPFC neurons encoded possible but risky rewards similarly to certain rewards, suggesting that overactivation of this area may be related to risky behavior, such as compulsive gambling (Clark, 2010). Many dorsal vmPFC neurons were persistently more active in the aversive block, regardless of the likelihood of punishments. Therefore, an overly active dorsal vmPFC may induce depressive emotional states (Drevets et al., 1998; Price and Drevets, 2010; Holtzheimer and Mayberg, 2011; Murray et al., 2011).
Because both action and mood are known to be at least partially controlled by dopamine and serotonin systems, an important future direction will be to understand how vmPFC and the dopamine and serotonin systems interact.
Flexibility of multiple valuation mechanisms in vmPFC
Our study suggested that valence or value is represented in vmPFC in heterogeneous forms. The representations are multidimensional, including categorical (i.e., contingent on appetitive or aversive state), quantitative (i.e., correlated with outcome probability), and hopeful (i.e., related to outcome possibility). By conveying such multidimensional signals, the vmPFC may enable flexible adaptation to complex environments based on one's needs and previous experience. For example, in a familiar environment, “quantitative” coding (as seen in the posterior region of ventral vmPFC) would be useful for choosing an optimal behavior. Conversely, in a novel environment, “hopeful” coding (as seen in the anterior region of the ventral vmPFC) could be useful because uncertain reward outcomes often indicate an opportunity for new learning (Schultz et al., 2008).
Alternatively (or at the same time), valence signals in the vmPFC may also contribute to the control of emotion. Emotions are not scalar quantities and are characterized by multidimensional features (Salzman and Fusi, 2010), such as “pleasantness” and “certainty” (Smith and Ellsworth, 1985). Different combinations of these features characterize heterogeneous emotions. Therefore, it is conceivable that emotions emerge partly from the multidimensional signals in vmPFC. However, it is unknown whether these multidimensional valence signals are integrated inside the vmPFC (Padoa-Schioppa, 2011) or are transmitted to other brain areas in parallel to affect decision making and modulate emotional states in a context-dependent manner.
Acknowledgments
We thank Ethan Bromberg-Martin, Yoshihisa Tachibana, Hyoung Kim, Shinya Yamamoto, Masaharu Yasuda, Ali Ghazizadeh, Simon Hong, Peter Rudebeck, Richard Krauzlis, and Bruce Cumming for valuable discussions, David Leopold, Frank Ye, and Charles Zhu for excellent MRI services and advice, Mitchell Smith for histological expertise and service, and Arthur Hays, John McClurkin, Beth Nagy, Nick Nichols, Denise Parker, and Tom Ruffner for technical support.
Footnotes
Author contributions: I.E.M. and O.H. designed research; I.E.M. performed research; I.E.M. analyzed data; I.E.M. and O.H. wrote the paper.
References
- Barbas H, Ghashghaei H, Dombrowski SM, Rempel-Clower NL. Me-dial prefrontal cortices are unified by common connections with superior temporal cortices and distinguished by input from memory-related areas in the rhesus monkey. J Comp Neurol. 1999;410:343–367. doi: 10.1002/(sici)1096-9861(19990802)410:3<343::aid-cne1>3.0.co;2-1. [DOI] [PubMed] [Google Scholar]
- Bechara A, Tranel D, Damasio H, Damasio AR. Failure to respond autonomically to anticipated future outcomes following damage to prefrontal cortex. Cereb Cortex. 1996;6:215–225. doi: 10.1093/cercor/6.2.215. [DOI] [PubMed] [Google Scholar]
- Bechara A, Damasio H, Damasio AR. Emotion, decision making and the orbitofrontal cortex. Cereb Cortex. 2000;10:295–307. doi: 10.1093/cercor/10.3.295. [DOI] [PubMed] [Google Scholar]
- Belova MA, Paton JJ, Salzman CD. Moment-to-moment tracking of state value in the amygdala. J Neurosci. 2008;28:10023–10030. doi: 10.1523/JNEUROSCI.1400-08.2008. [DOI] [PMC free article] [PubMed] [Google Scholar]
- Bouret S, Richmond BJ. Ventromedial and orbital prefrontal neurons differentially encode internally and externally driven motivational values in monkeys. J Neurosci. 2010;30:8591–8601. doi: 10.1523/JNEUROSCI.0049-10.2010. [DOI] [PMC free article] [PubMed] [Google Scholar]
- Bremner JD, Vythilingam M, Vermetten E, Nazeer A, Adil J, Khan S, Staib LH, Charney DS. Reduced volume of orbitofrontal cortex in major depression. Biol Psychiatry. 2002;51:273–279. doi: 10.1016/s0006-3223(01)01336-1. [DOI] [PubMed] [Google Scholar]
- Bromberg-Martin ES, Hikosaka O, Nakamura K. Coding of task reward value in the dorsal raphe nucleus. J Neurosci. 2010a;30:6262–6272. doi: 10.1523/JNEUROSCI.0015-10.2010. [DOI] [PMC free article] [PubMed] [Google Scholar]
- Bromberg-Martin ES, Matsumoto M, Hikosaka O. Distinct tonic and phasic anticipatory activity in lateral habenula and dopamine neurons. Neuron. 2010b;67:144–155. doi: 10.1016/j.neuron.2010.06.016. [DOI] [PMC free article] [PubMed] [Google Scholar]
- Bromberg-Martin ES, Matsumoto M, Hikosaka O. Dopamine in motivational control: rewarding, aversive, and alerting. Neuron. 2010c;68:815–834. doi: 10.1016/j.neuron.2010.11.022. [DOI] [PMC free article] [PubMed] [Google Scholar]
- Burke KA, Franz TM, Miller DN, Schoenbaum G. The role of the orbitofrontal cortex in the pursuit of happiness and more specific rewards. Nature. 2008;454:340–344. doi: 10.1038/nature06993. [DOI] [PMC free article] [PubMed] [Google Scholar]
- Carmichael ST, Price JL. Architectonic subdivision of the orbital and medial prefrontal cortex in the macaque monkey. J Comp Neurol. 1994;346:366–402. doi: 10.1002/cne.903460305. [DOI] [PubMed] [Google Scholar]
- Cavada C, Compañy T, Tejedor J, Cruz-Rizzolo RJ, Reinoso-Suárez F. The anatomical connections of the macaque monkey orbitofrontal cortex. A review. Cereb Cortex. 2000;10:220–242. doi: 10.1093/cercor/10.3.220. [DOI] [PubMed] [Google Scholar]
- Clark L. Decision-making during gambling: an integration of cognitive and psychobiological approaches. Philos Trans R Soc Lond B Biol Sci. 2010;365:319–330. doi: 10.1098/rstb.2009.0147. [DOI] [PMC free article] [PubMed] [Google Scholar]
- Drevets WC, Price JL, Simpson JR, Jr, Todd RD, Reich T, Vannier M, Raichle ME. Subgenual prefrontal cortex abnormalities in mood disorders. Nature. 1997;386:824–827. doi: 10.1038/386824a0. [DOI] [PubMed] [Google Scholar]
- Drevets WC, Ongür D, Price JL. Neuroimaging abnormalities in the subgenual prefrontal cortex: implications for the pathophysiology of familial mood disorders. Mol Psychiatry. 1998;3:220–226. 190–191. doi: 10.1038/sj.mp.4000370. [DOI] [PubMed] [Google Scholar]
- Green DM, Swets JA. Signal detection theory and psychophysics. Wiley; New York: 1968. [Google Scholar]
- Haber SN, Kunishio K, Mizobuchi M, Lynd-Balta E. The orbital and medial prefrontal circuit through the primate basal ganglia. J Neurosci. 1995;15:4851–4867. doi: 10.1523/JNEUROSCI.15-07-04851.1995. [DOI] [PMC free article] [PubMed] [Google Scholar]
- Hikosaka O, Bromberg-Martin E, Hong S, Matsumoto M. New insights on the subcortical representation of reward. Curr Opin Neurobiol. 2008;18:203–208. doi: 10.1016/j.conb.2008.07.002. [DOI] [PMC free article] [PubMed] [Google Scholar]
- Holtzheimer PE, Mayberg HS. Deep brain stimulation for psychiatric disorders. Annu Rev Neurosci. 2011;34:289–307. doi: 10.1146/annurev-neuro-061010-113638. [DOI] [PMC free article] [PubMed] [Google Scholar]
- Hong S, Jhou TC, Smith M, Saleem KS, Hikosaka O. Negative reward signals from the lateral habenula to dopamine neurons are mediated by rostromedial tegmental nucleus in primates. J Neurosci. 2011;31:11457–11471. doi: 10.1523/JNEUROSCI.1384-11.2011. [DOI] [PMC free article] [PubMed] [Google Scholar]
- Koenigs M, Young L, Adolphs R, Tranel D, Cushman F, Hauser M, Damasio A. Damage to the prefrontal cortex increases utilitarian moral judgements. Nature. 2007;446:908–911. doi: 10.1038/nature05631. [DOI] [PMC free article] [PubMed] [Google Scholar]
- Lin A, Adolphs R, Rangel A. Social and monetary reward learning engage overlapping neural substrates. Soc Cogn Affect Neurosci. 2012;7:274–281. doi: 10.1093/scan/nsr006. [DOI] [PMC free article] [PubMed] [Google Scholar]
- Litt A, Plassmann H, Shiv B, Rangel A. Dissociating valuation and saliency signals during decision-making. Cereb Cortex. 2011;21:95–102. doi: 10.1093/cercor/bhq065. [DOI] [PubMed] [Google Scholar]
- Matsumoto M, Hikosaka O. Representation of negative motivational value in the primate lateral habenula. Nature Neurosci. 2009a;12:77–84. doi: 10.1038/nn.2233. [DOI] [PMC free article] [PubMed] [Google Scholar]
- Matsumoto M, Hikosaka O. Two types of dopamine neuron distinctly convey positive and negative motivational signals. Nature. 2009b;459:837–841. doi: 10.1038/nature08028. [DOI] [PMC free article] [PubMed] [Google Scholar]
- Mayberg HS. Targeted electrode-based modulation of neural circuits for depression. J Clin Invest. 2009;119:717–725. doi: 10.1172/JCI38454. [DOI] [PMC free article] [PubMed] [Google Scholar]
- Murray EA, Wise SP, Drevets WC. Localization of dysfunction in major depressive disorder: prefrontal cortex and amygdala. Biol Psychiatry. 2011;69:e43–e54. doi: 10.1016/j.biopsych.2010.09.041. [DOI] [PMC free article] [PubMed] [Google Scholar]
- Myers-Schulz B, Koenigs M. Functional anatomy of ventromedial prefrontal cortex: implications for mood and anxiety disorders. Mol Psychiatry. 2012;17:132–141. doi: 10.1038/mp.2011.88. [DOI] [PMC free article] [PubMed] [Google Scholar]
- Noonan MP, Walton ME, Behrens TE, Sallet J, Buckley MJ, Rushworth MF. Separate value comparison and learning mechanisms in macaque medial and lateral orbitofrontal cortex. Proc Natl Acad Sci U S A. 2010;107:20547–20552. doi: 10.1073/pnas.1012246107. [DOI] [PMC free article] [PubMed] [Google Scholar]
- Noonan MP, Mars RB, Rushworth MF. Distinct roles of three frontal cortical areas in reward-guided behavior. J Neurosci. 2011;31:14399–14412. doi: 10.1523/JNEUROSCI.6456-10.2011. [DOI] [PMC free article] [PubMed] [Google Scholar]
- O'Doherty J, Kringelbach ML, Rolls ET, Hornak J, Andrews C. Abstract reward and punishment representations in the human orbitofrontal cortex. Nat Neurosci. 2001;4:95–102. doi: 10.1038/82959. [DOI] [PubMed] [Google Scholar]
- O'Doherty JP, Deichmann R, Critchley HD, Dolan RJ. Neural responses during anticipation of a primary taste reward. Neuron. 2002;33:815–826. doi: 10.1016/s0896-6273(02)00603-7. [DOI] [PubMed] [Google Scholar]
- Ongür D, Price JL. The organization of networks within the orbital and medial prefrontal cortex of rats, monkeys and humans. Cereb Cortex. 2000;10:206–219. doi: 10.1093/cercor/10.3.206. [DOI] [PubMed] [Google Scholar]
- Ongür D, An X, Price JL. Prefrontal cortical projections to the hypothalamus in macaque monkeys. J Comp Neurol. 1998;401:480–505. [PubMed] [Google Scholar]
- Ongür D, Ferry AT, Price JL. Architectonic subdivision of the human orbital and medial prefrontal cortex. J Comp Neurol. 2003;460:425–449. doi: 10.1002/cne.10609. [DOI] [PubMed] [Google Scholar]
- Padoa-Schioppa C. Neurobiology of economic choice: a good-based model. Annu Rev Neurosci. 2011;34:333–359. doi: 10.1146/annurev-neuro-061010-113648. [DOI] [PMC free article] [PubMed] [Google Scholar]
- Plassmann H, O'Doherty JP, Rangel A. Appetitive and aversive goal values are encoded in the medial orbitofrontal cortex at the time of decision making. J Neurosci. 2010;30:10799–10808. doi: 10.1523/JNEUROSCI.0788-10.2010. [DOI] [PMC free article] [PubMed] [Google Scholar]
- Price JL, Drevets WC. Neurocircuitry of mood disorders. Neuropsychopharmacology. 2010;35:192–216. doi: 10.1038/npp.2009.104. [DOI] [PMC free article] [PubMed] [Google Scholar]
- Rempel-Clower NL. Role of orbitofrontal cortex connections in emotion. Ann N Y Acad Sci. 2007;1121:72–86. doi: 10.1196/annals.1401.026. [DOI] [PubMed] [Google Scholar]
- Rempel-Clower NL, Barbas H. Topographic organization of connections between the hypothalamus and prefrontal cortex in the rhesus monkey. J Comp Neurol. 1998;398:393–419. doi: 10.1002/(sici)1096-9861(19980831)398:3<393::aid-cne7>3.0.co;2-v. [DOI] [PubMed] [Google Scholar]
- Ressler KJ, Mayberg HS. Targeting abnormal neural circuits in mood and anxiety disorders: from the laboratory to the clinic. Nat Neurosci. 2007;10:1116–1124. doi: 10.1038/nn1944. [DOI] [PMC free article] [PubMed] [Google Scholar]
- Rolls ET, Inoue K, Browning A. Activity of primate subgenual cingu-late cortex neurons is related to sleep. J Neurophysiol. 2003;90:134–142. doi: 10.1152/jn.00770.2002. [DOI] [PubMed] [Google Scholar]
- Rudebeck PH, Murray EA. Dissociable effects of subtotal lesions within the macaque orbital prefrontal cortex on reward-guided behavior. J Neurosci. 2011;31:10569–10578. doi: 10.1523/JNEUROSCI.0091-11.2011. [DOI] [PMC free article] [PubMed] [Google Scholar]
- Rushworth MF, Mars RB, Summerfield C. General mechanisms for making decisions? Curr Opin Neurobiol. 2009;19:75–83. doi: 10.1016/j.conb.2009.02.005. [DOI] [PubMed] [Google Scholar]
- Rushworth MF, Noonan MP, Boorman ED, Walton ME, Behrens TE. Frontal cortex and reward-guided learning and decision-making. Neuron. 2011;70:1054–1069. doi: 10.1016/j.neuron.2011.05.014. [DOI] [PubMed] [Google Scholar]
- Saleem KS, Logothetis NK. A combined MRI and histology atlas of the rhesus monkey brain in stereotaxic coordinates. Academic; Sydney: 2007. [Google Scholar]
- Salzman CD, Fusi S. Emotion, cognition, and mental state representation in amygdala and prefrontal cortex. Annu Rev Neurosci. 2010;33:173–202. doi: 10.1146/annurev.neuro.051508.135256. [DOI] [PMC free article] [PubMed] [Google Scholar]
- Schoenbaum G, Takahashi Y, Liu TL, McDannald MA. Does the orbitofrontal cortex signal value? Ann N Y Acad Sci. 2011;1239:87–99. doi: 10.1111/j.1749-6632.2011.06210.x. [DOI] [PMC free article] [PubMed] [Google Scholar]
- Schultz W. Behavioral theories and the neurophysiology of reward. Annu Rev Psychol. 2006;57:87–115. doi: 10.1146/annurev.psych.56.091103.070229. [DOI] [PubMed] [Google Scholar]
- Schultz W, Dayan P, Montague PR. A neural substrate of prediction and reward. Science. 1997;275:1593–1599. doi: 10.1126/science.275.5306.1593. [DOI] [PubMed] [Google Scholar]
- Schultz W, Preuschoff K, Camerer C, Hsu M, Fiorillo CD, Tobler PN, Bossaerts P. Explicit neural signals reflecting reward uncertainty. Philos Trans R Soc Lond B Biol Sci. 2008;363:3801–3811. doi: 10.1098/rstb.2008.0152. [DOI] [PMC free article] [PubMed] [Google Scholar]
- Smith CA, Ellsworth PC. Patterns of cognitive appraisal in emotion. J Pers Soc Psychol. 1985;48:813–838. [PubMed] [Google Scholar]
- Stefanacci L, Amaral DG. Topographic organization of cortical inputs to the lateral nucleus of the macaque monkey amygdala: a retrograde tracing study. J Comp Neurol. 2000;421:52–79. doi: 10.1002/(sici)1096-9861(20000522)421:1<52::aid-cne4>3.0.co;2-o. [DOI] [PubMed] [Google Scholar]
- Stefanacci L, Amaral DG. Some observations on cortical inputs to the macaque monkey amygdala: an anterograde tracing study. J Comp Neurol. 2002;451:301–323. doi: 10.1002/cne.10339. [DOI] [PubMed] [Google Scholar]
- Tsuchida A, Doll BB, Fellows LK. Beyond reversal: a critical role for human orbitofrontal cortex in flexible learning from probabilistic feedback. J Neurosci. 2010;30:16868–16875. doi: 10.1523/JNEUROSCI.1958-10.2010. [DOI] [PMC free article] [PubMed] [Google Scholar]
- Wallis JD, Kennerley SW. Contrasting reward signals in the orbito-frontal cortex and anterior cingulate cortex. Ann N Y Acad Sci. 2011;1239:33–42. doi: 10.1111/j.1749-6632.2011.06277.x. [DOI] [PubMed] [Google Scholar]
- Walton ME, Behrens TE, Buckley MJ, Rudebeck PH, Rushworth MF. Separable learning systems in the macaque brain and the role of orbitofrontal cortex in contingent learning. Neuron. 2010;65:927–939. doi: 10.1016/j.neuron.2010.02.027. [DOI] [PMC free article] [PubMed] [Google Scholar]
- Winckler C, Magezi D, Croquelois A. Restricted left gyrus rectus hemorrhage with unusual frontal syndrome presentation. Eur Neurol. 2011;65:129–131. doi: 10.1159/000324305. [DOI] [PubMed] [Google Scholar]


