

Abstract
Objectives
Personal belief exemptions (PBEs) from mandated school entry vaccinations have increased in California over the past decade. Infectious disease outbreaks in the state may be associated with the aggregation of intentionally unvaccinated children within schools. We sought to quantify the exposure of California kindergartners to children with PBEs at school.
Methods
We used cross-sectional California Department of Public Health data on 3 kindergarten cohorts to define and calculate multiple measures of exposure to children with exemptions, including interaction and aggregation indices, for the state as a whole (2008–2010) and by county (2010).
Results
In 2010, the PBE rate in California was 2.3 per 100 students, and the school PBE rate for the average kindergartner with a PBE was 15.6 per 100. More than 7000 kindergartners in California attend schools with PBE rates greater than 20 per 100, including 2700 kindergartners with PBEs. Exposure measures vary considerably across counties.
Conclusions
Our results suggest increasing levels of exposure among kindergarten students in California to other kindergartners with PBEs. Our data provide a concrete set of metrics through which public health and education officials can identify high-risk areas as targets for policy and programmatic interventions.
As a result of widespread vaccination coverage among children, vaccine-preventable childhood diseases that once caused substantial disease burden and mortality in the United States are now rare occurrences. Measles, for example, once infected 4 million and killed 4000 people each year, mostly young children.1 Thanks to high measles vaccine coverage over several decades, endemic measles was eliminated in the United States as of 2000.2 Overall, the current routine childhood immunization schedule is estimated to prevent 42 000 deaths and 20 million cases of disease and to save $14 billion in direct medical costs per US birth cohort.3
Despite these successes, controversy over the safety of childhood immunizations has resulted in an increasing number of parents being hesitant regarding vaccines or even refusing to have their children vaccinated.4–7 A recent national poll8 showed that 31% of parents are concerned about vaccine safety, and 1 in 4 believe that vaccines are linked to autism. Among parents whose opinions about vaccines have changed recently, 60% report that their opinion has become less favorable.8 Even parents who do decide to vaccinate their children express serious safety concerns.8
One manifestation of parents’ hesitancy regarding vaccines is rising rates of exemptions from school entry immunization mandates. Historically, high rates of adherence to the recommended immunization schedule have been achieved in part through these state-level mandates. In California, the focus of this study, school entry immunizations have been mandated since 1977.9 To enroll a child in kindergarten, parents in California must provide documentation of immunization against 10 vaccine-preventable diseases10 or file a personal belief exemption (PBE) from the immunization requirements.11 California is one of 20 states that allow personal belief or philosophical exemptions.12
Under California’s immunization law, a parent may file an exemption from one or more mandated immunizations by filing a letter or affidavit stating that the immunization is contrary to the parent’s beliefs.11 (It is important to note that children with PBEs may be partially or even fully vaccinated.) A 2-sentence affidavit is preprinted on the official California School Immunization Record (Figure A, available as a supplement to the online version of this article at http://www.ajph.org).
Although rising PBE rates at the state level are a concern (the rate in California climbed from approximately 0.5% in 1996 to 1.5% in 200713), a potentially more pressing problem is the aggregation of intentionally unvaccinated children within social and spatial units such as schools. Pockets of unvaccinated children threaten herd immunity, the protection created when most members of a population are vaccinated or otherwise immune.14 Herd immunity against vaccine-preventable childhood diseases is particularly important for the protection of vulnerable individuals, including infants too young to be vaccinated and people with compromised immune function or medical conditions that contraindicate vaccination.
Even among fully vaccinated children, there is a slight risk of infection. For example, a single dose of the measles–mumps–rubella (MMR) vaccine is estimated to confer immunity in 95% to 98% of children, and 2 doses confer immunity in 99% of children.15 Maintaining herd immunity requires high rates of vaccine coverage: 80% to 95% of the population, depending on the disease.16,17 Although coverage exceeds this threshold for most diseases in most states, the aggregation of intentionally unvaccinated children in a small number of schools may lead to local coverage rates that are much lower, creating outbreak opportunities.18
Recent outbreaks of vaccine-preventable diseases in California and elsewhere suggest that vaccine refusal and the density of children with PBEs are already playing a role in vaccine-preventable childhood disease epidemiology in the United States.4,19–22 For example, an outbreak of measles in San Diego, CA, in 2008 started with an intentionally unvaccinated child who contracted measles during travel in Europe.23 The child attended a school with a high PBE rate–11% of enrolled children had a PBE on file for the MMR vaccine–and 2 additional children from the school contracted measles.4 This example and others of localized disease outbreaks despite adequate population-level herd immunity demonstrate the importance of heterogeneity in vaccination coverage.24–26
Despite concerns about spatial patterns of vaccine refusal, to our knowledge, no studies to date have quantified school-aged children’s exposure to students with PBEs with respect to both the prevalence and aggregation of PBEs within schools. Thus, we sought to calculate statewide kindergarten PBE prevalence rates in California from 2008 to 2010 and across counties in 2010, to quantify children’s exposure to kindergartners with PBEs within schools, and to identify counties in California that are vulnerable to disease outbreaks, measured according to enrollments at schools with high PBE rates.
METHODS
We used publicly available data from the California Department of Public Health for 3 school years: 2008–2009, 2009–2010, and 2010–2011 (hereafter referred to as 2008, 2009, and 2010, respectively, given that data are reported by schools during the fall of the academic year). In the fall, each California school offering kindergarten provides data to the California Department of Public Health including total kindergarten enrollment in the current school year and the number of kindergartners in each of the following vaccination categories: up to date on mandated vaccines, conditional acceptance, permanent medical exemption, or PBE for one or more mandated immunizations.
Conditional acceptance is offered to students who are not up to date on mandated vaccinations but plan to complete the required schedule in the near future. In this study, we defined adherents as all kindergartners who had not filed a PBE. The adherent category therefore included children who were up to date, those with conditional acceptance, and those with permanent medical exemptions. The average school-level prevalence of conditional acceptance increased from 6.8% in 2008 to 7.6% in 2010. The average school-level prevalence of permanent medical exemptions was 0.2% in all 3 years. The pooled 3-year data set included more than 7000 public and private schools and approximately 500 000 kindergartners in each of the 3 years (Table 1 ).
TABLE 1.
Exposure to Students With Personal Belief Exemptions From Mandated School Entry Vaccinations: California Kindergartners, 2008–2010
| Characteristic or Measure | Fall 2008 | Fall 2009 | Fall 2010 | % Change, 2008–2010 |
|---|---|---|---|---|
| Schools, no. | 7173 | 7174 | 7163 | −0.2 |
| Kindergartners, no. | 496 027 | 502 286 | 505 015 | 1.8 |
| Prevalence | ||||
| Crude PBE counta | 9201 | 9916 | 11 503 | 25.0 |
| PBE rateb per 100 | 1.9 | 2.0 | 2.3 | 22.8 |
| Exposure | ||||
| Interaction indexc | 1.6 | 1.7 | 2.0 | 25.0 |
| Aggregation indexd | 14.7 | 14.6 | 15.6 | 6.1 |
| Vulnerability, no. (%) | ||||
| Schools with crude PBE counta > 20 | 26 (0.4) | 29 (0.4) | 35 (0.5) | 34.6 |
| Schools with PBE rateb per 100 > 20 | 159 (2.2) | 163 (2.3) | 187 (2.6) | 17.6 |
| Kindergartners enrolled in schools with crude PBE counta > 20 |
1937 (0.4) | 2675 (0.5) | 3675 (0.7) | 89.7 |
| Kindergartners enrolled in schools with PBE rateb per 100 > 20 |
5322 (1.1) | 5728 (1.1) | 7251 (1.4) | 36.2 |
| Kindergartners with PBEs enrolled in schools with crude PBE counta > 20 |
887 (9.6) | 1055 (10.6) | 1416 (12.3) | 59.6 |
| Kindergartners with PBEs enrolled in schools with PBE rateb per 100 > 20 |
2044 (22.2) | 2170 (21.9) | 2715 (23.6) | 32.8 |
Note. PBE = personal belief exemption. Values reflect school-level data from the California Department of Public Health. Schools with fewer than 10 kindergartners were not included in the department’s data set and were excluded from our analyses. Exemptions are reported in December of each school year.
Number of kindergartners with one or more PBEs on file.
Number of kindergartners with one or more PBEs per 100 kindergartners per year.
Average school-level PBE rate among adherent kindergartners (those without a PBE).
Average school-level PBE rate among kindergartners with PBEs.
Measures
We used measures of prevalence, exposure, and vulnerability to describe PBE patterns in the 3 kindergarten cohorts. Lacking a direct measure of intentional undervaccination in this population, we used PBEs as a proxy, acknowledging that children with a PBE may have received some or all of the mandated immunizations.
Prevalence measures
We defined crude PBE prevalence as the number of kindergartners who had one or more PBEs on file. We calculated the PBE rate per 100 as the crude PBE prevalence divided by the total number of kindergartners and multiplied by 100. The prevalence measures allowed us to track the number and proportion of PBEs over time and by county.
Exposure measures
We used the interaction and aggregation indices, 2 measures of exposure adopted from the residential racial segregation literature, to quantify the likelihood that kindergartners would encounter students with PBEs at school.27 These measures are often used to assess the exposure of a racial minority population to a majority population, but they are not specific to race or place of residence and can be generalized to the measurement of exposure of any subpopulation to another mutually exclusive subpopulation.27
Conceptually, the interaction index measures between-group contact. We defined the interaction index as the probability that kindergartners without exemptions (adherent children) would encounter kindergartners with PBEs (exempted children) at school. We calculated the index as the proportion of exempted kindergartners in each school weighted by the school’s proportion of adherent children, summed across all schools:
| (1) |
where ai is the number of adherent kindergartners in school i, A is the total number of adherent kindergartners, xi is the number of exempted kindergartners in school i, ki is the total kindergarten enrollment in school i, and N is the number of schools in the area for which the index is being calculated (i.e., the state or county).
The maximum value for the interaction index is the proportion of exempted kindergartners in the population, and the index can be interpreted as the average school PBE rate among adherent students. A higher interaction index indicates that adherent kindergartners are more likely to encounter exempted kindergartners. Although adherents are for the most part vaccinated (some may have medical exemptions or be awaiting a scheduled immunization), they are still at risk (albeit a small risk) for contracting a vaccine-preventable disease. The interaction index is therefore a measure of disease risk for the adherent population.
The related aggregation index, also taken from the residential racial segregation literature, captures the extent of within-group contact.27 The index, which measured the probability that a kindergartner with a PBE would encounter another such student at school, was calculated as the proportion of exempted kindergartners in each school weighted by the school’s proportion of all exempted kindergartners, summed across all schools:
| (2) |
where xi is the number of exempted kindergartners in school i, X is the total number of exempted kindergartners, ki is the total kindergarten enrollment in school i, and N is the number of schools in the area for which the index is being calculated.
The index runs from asymptotically near 0 to 100 and can be interpreted as the average school PBE rate for exempted kindergartners. A high aggregation index indicates that exempted kindergartners are likely to attend school with other such students. Because exempted kindergartners are less likely to be vaccinated than adherent kindergartners, the risk of an outbreak is greater under conditions of high aggregation.
Vulnerability measures
Finally, we defined the criteria for high-PBE schools (through threshold values for crude PBE counts and PBE rates) and calculated kindergarten enrollments in these vulnerable schools over time and across counties. We defined a high crude PBE threshold as 20 exempted kindergartners in a single school and a high PBE rate as 20 exempted kindergartners per 100 kindergartners. These thresholds were intended to be conservative measures of epidemiologically significant exposures to exempted kindergartners in the case of measles, which has an established threshold for immunization coverage of 87% to 98% to maintain herd immunity.28–30 Given that threshold, a PBE rate of 20% would be worrisome, even if as many as half of exempted kindergartners had in fact received a measles vaccination. We focused on measles because of the 2008 outbreak in California and the considerable media attention given to the purported link between the MMR vaccine and autism that has contributed to hesitancy among parents to have their children vaccinated.
We used these thresholds to calculate the number and proportion of high-PBE schools, the number and proportion of all kindergartners attending high-PBE schools, and the number and proportion of exempted kindergartners attending high-PBE schools. These measures offered a simple way to quantify the extent of disease outbreak risk due to compromised herd immunity.
Data Analysis
We first calculated all of the prevalence, exposure, and vulnerability measures for the state of California for the 3 school years beginning in fall 2008, fall 2009, and fall 2010 to evaluate trends over time. We next calculated prevalence, exposure, and vulnerability by county for 2010 to identify counties at particular risk for a vaccine-preventable disease outbreak.
We do not provide confidence intervals for these descriptive measures because our analysis was conducted on the full population of California schools with 10 or more kindergartners. Stata version 11.0 (StataCorp LP, College Station, Tex) was used to calculate all measures.
RESULTS
The results of our statewide and county-level analyses were as follows.
Statewide Trends, 2008–2010
Prevalence
State-level results for 2008 to 2010 are shown in Table 1. Crude PBE counts rose from 9201 in 2008 to 11 503 in 2010, a 25% increase. The PBE rate per 100 kindergartners also increased, from 1.9 to 2.3.
Exposure
The interaction index tracked the PBE rate closely, increasing from 1.6 to 2.0 over the 2-year period. In other words, the average adherent kindergartner in California in 2010 was enrolled in a school where the kindergarten PBE rate was 2 per 100. The aggregation index increased from 14.7 to 15.6 over the study period, meaning that exempted kindergartners were in schools with, on average, a PBE rate of 15.6 per 100 in 2010, or about 1 exempted kindergartner per 100 higher than in 2008.
Vulnerability
Table 1 shows increases in vulnerability measures at the state level. In 2008, only 26 (0.4%) schools in the state had more than 20 students with PBEs in the kindergarten cohort; this number had increased to 35 (0.5%) by 2010. The number of schools with high PBE rates also increased, from 159 (2.2%) in 2008 to 187 (2.6%) in 2010.
The number of students attending high-PBE schools increased faster than the number of high-PBE schools. The number of kindergartners attending schools in which there were more than 20 exempted kindergartners almost doubled (from 1937 in 2008 to 3675 in 2010). Enrollment at schools with high PBE rates also rose, from 5322 to 7251, a 36% increase. By 2010, 1.4% of all California kindergartners were enrolled in schools where the kindergarten PBE rate exceeded 20 per 100.
Kindergartners with PBEs–who may be at elevated risk for contracting a vaccine-preventable disease as a result of their exposure to intentionally unvaccinated children–also had increased exposures to other kindergartners with PBEs within their schools. The number of exempted kindergartners enrolled in schools with more than 20 exempted kindergartners rose from 887 in 2008 to 1416 in 2010, a 60% increase. The number of exempted kindergartners enrolled in schools with high PBE rates increased by 33%, to 2715. Almost one quarter of exempted kindergartners in 2010 were enrolled in schools with high PBE rates.
Statewide, these results suggest a trend toward a higher prevalence of PBEs, continued exposure to exempted kindergartners within schools, and rising numbers of kindergartners, both adherent and exempted, attending high-PBE schools.
County-Level Measures
California’s large population is distributed across 58 heterogeneous counties. Table 2 presents county-level PBE prevalence and exposure statistics for 2010; these data highlight the between-county variability in the distribution of PBEs. Counties are ranked from 1 (highest prevalence or exposure) to 58 (lowest prevalence or exposure), with the table sorted according to PBE rate per 100 students. (Table A, available as a supplement to the online version of this article at http://www.ajph.org, provides the same data sorted alphabetically by county.)
TABLE 2.
County-Level Measures of Exposure to Students With Personal Belief Exemptions From Mandated School Entry Vaccinations: California Kindergartners, Fall 2010
| County PBE Measure, Prevalence |
County PBE Measure, Exposure |
County Ranke in State, Prevalence |
County Ranke in State, Exposure |
|||||||
|---|---|---|---|---|---|---|---|---|---|---|
| County | No. of Schools |
No. of Kindergartners |
Crude PBE Counta |
PBE Rateb per 100, % |
Interaction Index,c% |
Aggregation Index,d% |
Crude PBE Counta |
PBE Rateb per 100 |
Interaction Indexc |
Aggregation Indexe |
| Nevada | 19 | 758 | 132 | 17.4 | 11.8 | 44.2 | 22 | 1 | 2 | 2 |
| Trinity | 6 | 116 | 20 | 17.2 | 13.8 | 33.6 | 44 | 2 | 1 | 7 |
| Siskiyou | 15 | 452 | 52 | 11.5 | 8.2 | 36.8 | 34 | 3 | 4 | 4 |
| Tuolumne | 12 | 435 | 43 | 9.9 | 9.4 | 14.4 | 35 | 4 | 3 | 22 |
| Humboldt | 38 | 1458 | 142 | 9.7 | 6.9 | 36.2 | 21 | 5 | 6 | 6 |
| Santa Cruz | 55 | 3416 | 326 | 9.5 | 6.5 | 38.8 | 10 | 6 | 9 | 3 |
| El Dorado | 40 | 2512 | 191 | 7.6 | 6.8 | 16.9 | 17 | 7 | 7 | 14 |
| Sierra | 1 | 28 | 2 | 7.1 | 7.1 | 7.1 | 55 | 8 | 5 | 44 |
| Del Norte | 9 | 309 | 22 | 7.1 | 6.5 | 14.6 | 42 | 9 | 8 | 21 |
| Marin | 65 | 3270 | 231 | 7.1 | 5.9 | 22.2 | 13 | 10 | 11 | 10 |
| Sutter | 28 | 1729 | 120 | 6.9 | 4.0 | 46.3 | 26 | 11 | 18 | 1 |
| Mendocino | 21 | 1087 | 70 | 6.4 | 4.4 | 36.8 | 32 | 12 | 16 | 5 |
| Plumas | 4 | 162 | 10 | 6.2 | 6.0 | 8.9 | 49 | 13 | 10 | 39 |
| Shasta | 44 | 2078 | 125 | 6.0 | 5.4 | 15.7 | 24 | 14 | 12 | 15 |
| Sonoma | 106 | 5915 | 354 | 6.0 | 4.3 | 32.0 | 8 | 15 | 17 | 8 |
| Calaveras | 11 | 394 | 22 | 5.6 | 5.0 | 15.5 | 42 | 16 | 13 | 17 |
| San Luis Obispo | 51 | 2659 | 132 | 5.0 | 4.7 | 10.6 | 22 | 17 | 14 | 33 |
| Butte | 49 | 2497 | 120 | 4.8 | 4.4 | 12.4 | 26 | 18 | 15 | 27 |
| Placer | 84 | 5289 | 226 | 4.3 | 3.9 | 11.7 | 15 | 19 | 19 | 28 |
| Amador | 6 | 311 | 12 | 3.9 | 3.7 | 7.4 | 46 | 20 | 20 | 43 |
| Tehama | 18 | 915 | 35 | 3.8 | 3.6 | 8.8 | 37 | 21 | 21 | 40 |
| Stanislaus | 112 | 8321 | 274 | 3.3 | 2.7 | 20.9 | 12 | 22 | 27 | 11 |
| Santa Barbara | 96 | 5901 | 189 | 3.2 | 2.7 | 17.9 | 18 | 23 | 25 | 13 |
| Sacramento | 280 | 19 216 | 614 | 3.2 | 2.8 | 14.6 | 4 | 24 | 23 | 20 |
| San Diego | 562 | 41 492 | 1296 | 3.1 | 2.8 | 12.9 | 2 | 25 | 24 | 24 |
| Mariposa | 7 | 293 | 9 | 3.1 | 3.0 | 5.2 | 50 | 26 | 22 | 51 |
| Ventura | 182 | 11 830 | 350 | 3.0 | 2.5 | 18.4 | 9 | 27 | 29 | 12 |
| Yolo | 39 | 2423 | 69 | 2.8 | 2.6 | 11.4 | 33 | 28 | 28 | 29 |
| Mono | 4 | 145 | 4 | 2.8 | 2.7 | 4.3 | 52 | 29 | 26 | 53 |
| Lake | 12 | 751 | 20 | 2.7 | 2.5 | 10.1 | 44 | 30 | 30 | 34 |
| Orange | 571 | 41 113 | 1078 | 2.6 | 2.4 | 11.3 | 3 | 31 | 31 | 31 |
| Napa | 31 | 1700 | 41 | 2.4 | 2.1 | 14.0 | 36 | 32 | 33 | 23 |
| Yuba | 21 | 1214 | 28 | 2.3 | 2.2 | 8.7 | 39 | 33 | 32 | 41 |
| Contra Costa | 204 | 13 868 | 289 | 2.1 | 1.9 | 10.0 | 11 | 34 | 35 | 36 |
| San Mateo | 154 | 9110 | 186 | 2.0 | 1.8 | 15.1 | 19 | 35 | 36 | 19 |
| Inyo | 4 | 199 | 4 | 2.0 | 2.0 | 3.9 | 52 | 36 | 34 | 55 |
| Riverside | 354 | 31 953 | 586 | 1.8 | 1.7 | 10.1 | 5 | 37 | 38 | 35 |
| Santa Clara | 356 | 25 314 | 452 | 1.8 | 1.6 | 12.8 | 7 | 38 | 39 | 25 |
| Modoc | 3 | 114 | 2 | 1.8 | 1.7 | 5.9 | 55 | 39 | 37 | 49 |
| San Bernardino | 387 | 31 718 | 556 | 1.8 | 1.5 | 15.2 | 6 | 40 | 40 | 18 |
| Kern | 163 | 14 406 | 229 | 1.6 | 1.4 | 10.9 | 14 | 41 | 41 | 32 |
| Los Angeles | 1699 | 122 736 | 1898 | 1.5 | 1.4 | 12.8 | 1 | 42 | 42 | 26 |
| Solano | 71 | 5183 | 71 | 1.4 | 1.3 | 4.0 | 31 | 43 | 44 | 54 |
| Colusa | 6 | 369 | 5 | 1.4 | 1.3 | 2.6 | 51 | 44 | 43 | 56 |
| San Benito | 12 | 855 | 11 | 1.3 | 1.2 | 6.4 | 47 | 45 | 45 | 47 |
| Kings | 35 | 2612 | 33 | 1.3 | 1.1 | 15.7 | 38 | 46 | 48 | 16 |
| Alameda | 286 | 17 721 | 216 | 1.2 | 1.2 | 6.4 | 16 | 47 | 46 | 48 |
| San Francisco | 130 | 6516 | 78 | 1.2 | 0.9 | 22.6 | 29 | 48 | 53 | 9 |
| Fresno | 202 | 15 689 | 184 | 1.2 | 1.1 | 8.1 | 20 | 49 | 47 | 42 |
| Monterey | 81 | 6585 | 75 | 1.1 | 1.0 | 9.5 | 30 | 50 | 49 | 37 |
| San Joaquin | 166 | 10 997 | 124 | 1.1 | 1.0 | 9.1 | 25 | 51 | 50 | 38 |
| Madera | 31 | 2280 | 25 | 1.1 | 1.0 | 11.3 | 40 | 52 | 52 | 30 |
| Lassen | 8 | 292 | 3 | 1.0 | 1.0 | 5.2 | 54 | 53 | 51 | 50 |
| Tulare | 101 | 8323 | 80 | 1.0 | 0.9 | 6.5 | 28 | 54 | 54 | 46 |
| Merced | 57 | 4478 | 24 | 0.5 | 0.5 | 6.7 | 41 | 55 | 55 | 45 |
| Imperial | 42 | 2880 | 11 | 0.4 | 0.4 | 2.5 | 47 | 56 | 56 | 57 |
| Glenn | 9 | 464 | 1 | 0.2 | 0.2 | 4.8 | 57 | 57 | 57 | 52 |
| Alpine | 1 | 13 | 0 | 0.0 | 0.0 | 0.0 | 58 | 58 | 58 | 58 |
Note. PBE = personal belief exemption. Values reflect school-level data from the California Department of Public Health. Schools with fewer than 10 kindergartners are not included in the department’s data set and were excluded from our analyses. Exemptions are reported in December of each school year.
Number of kindergartners with ≥ 1 PBE on file.
Number of kindergartners with ≥ 1 PBE/100 kindergartners per year.
Average school-level PBE rate among adherent kindergartners (those without a PBE).
Average school-level PBE rate among kindergartners with PBEs.
Rankings range from 1 (highest exposure) to 58 (lowest exposure). Tied statistics are assigned the same rank.
Prevalence
Crude PBE counts ranged from 0 in Alpine County to 1898 in Los Angeles County. Nevada County had the highest PBE rate in the state (17.4).
Exposure
The interaction index was highest in Trinity County, where the average adherent kindergartner was enrolled in a school with a PBE rate of 13.8 per 100. The aggregation index was highest in Sutter County (46.3). This index highlights the differences between counties in exposures of exempted kindergartners to other such students, even in the case of counties with similar crude PBE counts and PBE rates. For example, Sutter County’s aggregation index of 46.3 suggests that the probability that a kindergartner with a PBE in that county will encounter another such student at school is 46%. By contrast, El Dorado County, with a comparable number of schools and kindergartners, crude PBE counts, and PBE rate, has a much lower aggregation index (16.9). This indicates that the exempted kindergartners in El Dorado are more evenly distributed across schools, whereas they are aggregated in fewer schools in Sutter County.
Vulnerability
Table 3 ranks counties according to the same vulnerability measures shown in Table 1 and lists the top 10 counties with respect to each measure. The lists highlight the contrast between large counties (e.g., Los Angeles and San Diego), with large numbers of high-PBE schools and large enrollments in high-PBE schools, and smaller counties (e.g., Nevada, Trinity, Sutter), with large proportions of high-PBE schools and large proportions of students enrolled at such schools.
TABLE 3.
Top 10 Counties on Vulnerability Measures of Exposure to Personal Belief Exemptions From Mandated School Entry Vaccinations: California, Fall 2010
| Schools With Crude PBE Counta > 20 |
Schools With PBE Rateb > 20 |
Kindergarteners Enrolled in Schools With Crude PBE Counta > 20 |
Kindergarteners Enrolled in Schools With PBE Rateb > 20 |
Kindergarteners With PBEs Enrolled in Schools With Crude PBE Counta > 20 |
Kindergarteners With PBEs Enrolled in Schools With PBE Rateb > 20 |
||||||
|---|---|---|---|---|---|---|---|---|---|---|---|
| County | No. or % | County | No. or % | County | No. or % | County | No. or % | County | No. or % | County | No. or % |
| Rank by number | |||||||||||
| 1. San Diego | 6 | 1. Los Angeles | 25 | 1. San Diego | 704 | 1. Los Angeles | 1050 | 1. Los Angeles | 191 | 1. Los Angeles | 369 |
| 2. Los Angeles | 5 | 2. San Diego | 16 | 2. Los Angeles | 584 | 2. San Diego | 933 | 2. San Diego | 189 | 2. San Diego | 285 |
| 3. Sacramento | 4 | 3. Orange | 14 | 3. Sacramento | 475 | 3. Sacramento | 561 | 3. Sacramento | 159 | 3. Sacramento | 185 |
| 4. Sonoma | 3 | 4. Ventura | 11 | 4. Riverside | 457 | 4. Riverside | 468 | 4. Riverside | 123 | 4. Santa Cruz | 170 |
| 5. (tie) Santa Cruz | 2 | 5. (tie) Santa Cruz | 10 | 5. Stanislaus | 197 | 5. Orange | 414 | 5. Santa Cruz | 119 | 5. Sonoma | 160 |
| 5. (tie) Stanislaus | 2 | 5. (tie) Sonoma | 10 | 6. Orange | 197 | 6. Ventura | 380 | 6. San Bernardino | 98 | 6. Riverside | 131 |
| 5. (tie) Orange | 2 | 7. Marin | 8 | 7. Santa Cruz | 175 | 7. Sonoma | 314 | 7. Stanislaus | 93 | 7. Orange | 125 |
| 5. (tie) Riverside | 2 | 8. (tie) Nevada | 7 | 8. San Bernardino | 164 | 8. Santa Cruz | 295 | 8. Sonoma | 87 | 8. Ventura | 121 |
| 5. (tie) Santa Clara | 2 | 8. (tie) Sacramento | 7 | 9. Sutter | 144 | 9. Stanislaus | 228 | 9. Sutter | 85 | 9. San Bernardino | 108 |
| 10. 7-way tiec | 1 | 10. Humboldt | 6 | 10. Santa Clara | 132 | 10. Marin | 223 | 10. Santa Clara | 58 | 10. Stanislaus | 105 |
| Rank by percentage | |||||||||||
| 1. Nevada | 5.3 | 1. Nevada | 36.8 | 1. Sutter | 8.3 | 1. Nevada | 19.9 | 1. Sutter | 70.8 | 1. Sutter | 79.2 |
| 2. Santa Cruz | 3.6 | 2. Trinity | 33.3 | 2. Nevada | 6.5 | 2. Trinity | 18.1 | 2. San Francisco | 42.3 | 2. Mendocino | 68.6 |
| 3. Sutter | 3.6 | 3. Siskiyou | 26.7 | 3. Santa Cruz | 5.1 | 3. Siskiyou | 13.1 | 3. Santa Cruz | 36.5 | 3. Nevada | 62.1 |
| 4. Sonoma | 2.8 | 4. Mendocino | 19.0 | 4. Humboldt | 4.1 | 4. Humboldt | 13.0 | 4. Stanislaus | 33.9 | 4. Humboldt | 62.0 |
| 5. Humboldt | 2.6 | 5. Santa Cruz | 18.2 | 5. Sacramento | 2.5 | 5. Mendocino | 10.1 | 5. Nevada | 31.1 | 5. Santa Cruz | 52.1 |
| 6. Stanislaus | 1.8 | 6. Tuolumne | 16.7 | 6. Stanislaus | 2.4 | 6. Sutter | 9.8 | 6. Sacramento | 25.9 | 6. Trinity | 50.0 |
| 7. Sacramento | 1.4 | 7. Humboldt | 15.8 | 7. Sonoma | 2.1 | 7. Santa Cruz | 8.6 | 7. Sonoma | 24.6 | 7. Kings | 48.5 |
| 8. San Diego | 1.1 | 8. Marin | 12.3 | 8. San Diego | 1.7 | 8. Marin | 6.8 | 8. Humboldt | 23.2 | 8. Siskiyou | 48.1 |
| 9. San Francisco | 0.8 | 9. Tehama | 11.1 | 9. Riverside | 1.4 | 9. Tuolumne | 6.2 | 9. Riverside | 21.0 | 9. Sonoma | 45.2 |
| 10. Kern | 0.6 | 10. Del Norte | 11.1 | 10. San Francisco | 1.1 | 10. Butte | 5.9 | 10. San Bernardino | 17.6 | 10. San Francisco | 42.3 |
Note. PBE = personal belief exemption. Each list shows the 10 counties with the highest values for the vulnerability measure indicated. Tied statistics are assigned the same rank.
Number of kindergartners with ≥ 1 PBE on file.
Number of kindergartners with ≥ 1 PBE/100 kindergartners per year.
7 counties each with 1 school with crude PBE count > 20: Humboldt, Kern, Nevada, San Francisco, Stanislaus, Sutter, and Ventura.
Table 3 also allows an assessment of PBE-associated risk exposures across the state. For example, even in San Diego, a populous county with almost 1300 exempted kindergartners, only 6 schools had a crude PBE count above 20 in the 2010 kindergarten cohort. These 6 schools enrolled 704 kindergartners overall, of whom 189 had PBEs. The table also shows the 5 counties where more than half of exempted kindergartners are enrolled in schools with PBE rates in excess of 20 per 100: Sutter, Mendocino, Nevada, Humboldt, and Santa Cruz. Taken together, the county-level results shown in Tables 2 and 3 highlight the heterogeneity of California’s counties along multiple dimensions of PBE exposure and provide concrete metrics for identifying areas of particular PBE exposure risk.
DISCUSSION
Our results show growing levels of exposure among kindergarten students in California to other kindergartners with PBEs. Overall, the prevalence of PBEs rose from 2008 to 2010, with an increasing number of parents filing exemptions. We also found evidence of an uneven distribution of exempted children within schools, as shown by rising interaction and aggregation indices. If the interaction index and aggregation indices were equal to the PBE rate, this would imply that exempted kindergartners were uniformly distributed across schools. However, this was not the case in California; the aggregation index was higher than the PBE rate and increased over time, suggesting that exempted children are increasingly being exposed to other exempted children at school.
Statewide, the number of high-PBE schools is low but growing. More than 7000 kindergartners, including 2700 exempted kindergartners, are enrolled in schools with high PBE rates. Both the number and proportion of kindergartners enrolled in high-PBE schools are increasing over time. These patterns are consistent with a high risk of epidemic outbreaks in poorly protected subpopulations, similar to the 2008 measles outbreak in San Diego.
Parents continue to have concerns about vaccines despite extensive, rigorous evidence on safety and efficacy.5,8 Patterns of PBEs in California offer one clue about how attitudes and beliefs about vaccines spread within social groups. The high aggregation index across the state and particularly within some counties shows that intentionally unvaccinated children are often grouped within schools. Norms around vaccination and securing exemptions are likely to be shared in these communities, diffusing through parents’ social networks before and after the kindergarten enrollment process. Shared beliefs about vaccination and preferences for seeking exemptions may also incline parents toward selecting certain schools or neighborhoods.
At the same time, it is critical to recognize that a rising interaction index implies not only increased epidemiological exposure of adherent children to potentially undervaccinated children but increased social exposure as well. As social exposure to exempted children increases, adherent parents may find exemptions both more acceptable and more desirable. Understanding these diffusion and selection processes under different PBE exposure scenarios is important for the design of future interventions and warrants further study.
Our analysis of multiple measures of PBE exposure offers public health and education officials a concrete set of metrics with which to identify high-risk areas as targets for specific interventions. For example, in Figure 1 we mapped crude PBE counts (a) and the aggregation index (b) by county in 2010. A comparison of the 2 panels highlights the fact that higher crude PBE counts are found in the northern and southern population centers, whereas aggregation is highest in the San Francisco Bay area and the rural counties in the northwest and north central regions of the state. Interventions designed to address PBE exposure risks would probably vary for these 2 groups of counties. By contrast, some counties rank high on multiple PBE measures. Santa Cruz County, for example, ranks in the top 10 for all of the prevalence, exposure, and vulnerability measures shown in Tables 2 and 3 and would be a likely target for any intervention focused on reducing PBE rates.
FIGURE 1.
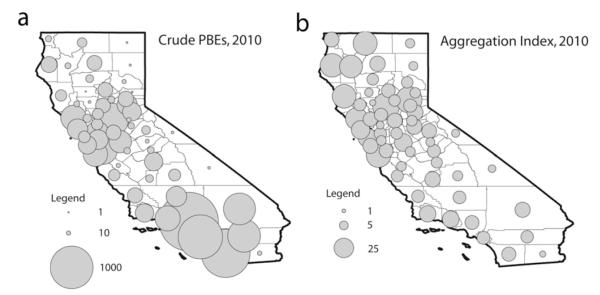
County-level prevalence and concentration of personal belief exemptions (PBEs) from mandated school entry vaccinations: California kindergartners, fall 2010.
Limitations
Our study has several important limitations. First, our analysis assumed that high PBE rates and high-PBE schools are associated with vaccine-preventable disease outbreak risk because kindergartners with PBEs are unvaccinated. To test this assumption, the California Department of Public Health conducted a pilot study in 2010 to evaluate the correlation between having a PBE and not being vaccinated. The results suggest that as many as 30% to 50% of exempted kindergartners have received 1 or more doses of at least 1 vaccine.31 Kindergartners with PBEs may be vaccinated for a variety of reasons; for example, parents may seek an exemption for only some of the mandated vaccines, or school officials may encourage parents whose children are not up to date or who lack vaccination documentation to sign a PBE waiver rather than enroll them with a conditional acceptance, which requires further follow-up by the school.
For the purposes of this study, we used conservative thresholds of 20 crude PBEs and a PBE rate of 20 to identify high-PBE schools. In future work, we plan to use findings from the California Department of Public Health pilot study to conduct sensitivity analyses and bound our exposure measures under different vaccination scenarios among exempted kindergartners.
Second, our data set was limited to schools with at least 10 kindergartners. Schools with kindergarten enrollments of fewer than 10 students are not included in the California Department of Public Health’s publicly available data. If schools with fewer than 10 kindergartners are more likely to have high PBE rates, then our estimates of prevalence and exposure may be too small. Comparisons with the annual kindergarten assessment results of the California Department of Health Services Immunization Branch for 2008 to 201032–34 indicate that our analyses excluded approximately 1000 schools each year (13% of schools) but only 5000 students (1% of the total kindergarten enrollment). The PBE rates we calculated were within 0.06 per 100 of the rates reported in the kindergarten assessment results, suggesting that any potential bias in our state- and county-level results is probably very small.
Finally, we were necessarily limited in our ability to closely link PBE exposures to epidemiological risk. Infectious disease transmission is a complex process. In the case of schoolchildren, exposure to vaccine-preventable diseases is affected not only by the prevalence and aggregation of potentially unvaccinated children within schools but also by school size, class size, the social mixing of vaccinated and unvaccinated children, and the transmissibility of each specific disease. With that broader context of vaccine-preventable disease outbreak risk, our intention here was to provide an analysis of rates of and trends in PBEs and engender further investigation.
Conclusions
The return of endemic measles to European countries that had previously eliminated the disease should serve as a cautionary tale in the United States about the dangers of sustained suboptimal rates of vaccination coverage in subpopulations.35 Measles is a clear example of a vaccine-preventable disease that can spread through clusters of unvaccinated children, even when population-level coverage seems adequate. In 2011 there were 215 identified measles cases in the United States, the highest number since 1996.36,37 Notable outbreaks of other vaccine-preventable diseases have occurred over the past few years as well.38,39
Survey data and qualitative research point to substantial (and growing) parental concerns about vaccine safety and efficacy.4–7 Our results indicate a growing number of parents who choose to enroll their children in school with PBEs. Rising PBE prevalence and the continued aggregation of children with exemptions in a small number of schools create pockets of vulnerable schoolchildren who are at risk for future outbreaks.
Herd immunity against vaccine-preventable childhood diseases is both a public good and a national asset. Although current rates of immunization coverage are adequate at the national level, there is increasing evidence that herd immunity in smaller localities such as states, counties, and schools has already been compromised by parents opting out of vaccine mandates.
Maintaining parental choice about child health, including the decision to opt out of vaccine mandates, is important. At the same time, new strategies are needed for health promotion campaigns, vaccine counseling practices, and exemption policies that will alleviate parental concerns, limit the spread of incorrect information about vaccine safety and efficacy, and ultimately minimize exemptions. Our analysis of PBE exposures in California kindergartens is one example of the kinds of tools that can assist policymakers in identifying vulnerable areas requiring focused vaccine promotion interventions.
Supplementary Material
Acknowledgments
This research was funded by the Robert Wood Johnson Foundation Health & Society Scholars Program at the University of Pennsylvania.
We thank Theresa Lee of the California Department of Public Health for assistance with data access and Andrew Hicks of the California Center for Population Research for statistical guidance.
Footnotes
Reprints can be ordered at http://www.ajph.org by clicking the “Reprints” link.
Contributors A. Buttenheim originated and designed the study, conducted data analyses, and wrote and revised the article. M. Jones assisted with study design and data analysis, created the maps, and wrote and revised the article. Y. Baras contributed to data management and analysis.
Human Participant Protection No protocol approval was needed for this study because publicly available secondary data were used.
Contributor Information
Alison Buttenheim, School of Nursing and the Leonard Davis Institute of Health Economics, University of Pennsylvania, Philadelphia..
Malia Jones, School of Public Health and the California Center for Population Research, University of California, Los Angeles..
Yelena Baras, School of Nursing, University of Pennsylvania..
References
- 1.Redd SC, Markowitz LE, Katz SL. Measles vaccine. In: Plotkin S, Orenstein W, editors. Vaccines. WB Saunders; Philadelphia, PA: 1999. pp. 222–266. [Google Scholar]
- 2.Katz SLHA. Summary and conclusions: measles elimination meeting. J Infect Dis. 2004;189(suppl 1):S43–S47. doi: 10.1086/377696. [DOI] [PubMed] [Google Scholar]
- 3.Zhou F. [Accessed May 17, 2012];Economic evaluation of the routine childhood immunization schedule in the United States. Available at: http://cdc.confex.com/cdc/nic2011/webprogram/Paper26209.html.
- 4.Sugerman DE, Barskey AE, Delea MG, et al. Measles outbreak in a highly vaccinated population, San Diego, 2008: role of the intentionally undervaccinated. Pediatrics. 2010;125(4):747–755. doi: 10.1542/peds.2009-1653. [DOI] [PubMed] [Google Scholar]
- 5.Freed GL, Clark SJ, Butchart AT, Singer DC, Davis MM. Parental vaccine safety concerns in 2009. Pediatrics. 2010;125(4):654–659. doi: 10.1542/peds.2009-1962. [DOI] [PubMed] [Google Scholar]
- 6.Omer SB, Salmon DA, Orenstein WA, deHart MP, Halsey N. Vaccine refusal, mandatory immunization, and the risks of vaccine-preventable diseases. N Engl J Med. 2009;360(19):1981–1988. doi: 10.1056/NEJMsa0806477. [DOI] [PubMed] [Google Scholar]
- 7.Gust DA, Strine TW, Maurice E, et al. Underimmunization among children: effects of vaccine safety concerns on immunization status. Pediatrics. 2004;114(1):e16–e22. doi: 10.1542/peds.114.1.e16. [DOI] [PubMed] [Google Scholar]
- 8.Thomson Reuters. [Accessed May 17, 2012];Thomson Reuters–NPR health poll, September 2011: vaccines. Available at: http://healthcare.thomsonreuters.com/npr/assets/NPR_report_vaccines.pdf.
- 9.Orenstein WA, Hinman AR. The immunization system in the United States–the role of school immunization laws. Vaccine. 1999;17(suppl 3):S19–S24. doi: 10.1016/s0264-410x(99)00290-x. [DOI] [PubMed] [Google Scholar]
- 10.California Dept of Public Health [Accessed May 17, 2012];California School ImmunizationLaw. Availableat: http://www.cdph.ca.gov/programs/immunize/Pages/CaliforniaImmunizationSchoolLaw.aspx.
- 11.California Immunization Handbook: School and Child Care Immunization Requirements for Schools and Child Care Programs. 7th ed California Dept of Health Services; Richmond, CA: 2003. [Google Scholar]
- 12.Johns Hopkins Bloomberg School of Public Health [Accessed May 17, 2012];Vaccine exemptions. Available at: http://www.vaccinesafety.edu/cc-ecem.htm.
- 13.California Dept of Public Health [Accessed May 17, 2012];Childhood immunization coverage in California, 2006–2008. Available at: http://www.cdph.ca.gov/programs/immunize/Documents/ChildhoodImmunizationCoverageCA2006-08.pdf.
- 14.Centers for Disease Control and Prevention [Accessed May 17, 2012];Vaccines and immunizations: glossary. Available at: http://www.cdc.gov/vaccines/about/terms/glossary.htm.
- 15.Atkinson W, Wolfe C, Hamborsky J, Beckenhaupt P. Epidemiology and Prevention of Vaccine-Preventable Diseases. Centers for Disease Control and Prevention; Atlanta, GA: 2011. [Google Scholar]
- 16.Centers for Disease Control and Prevention [Accessed May 17, 2012];History and epidemiology of global smallpox eradication. Available at: http://www.bt.cdc.gov/agent/smallpox/training/overview/pdf/eradicationhistory.pdf.
- 17.Hutchins SS, Bellini WJ, Coronado V, Jiles R, Wooten K, Deladisma A. Population immunity to measles in the United States, 1999. J Infect Dis. 2004;189(suppl 1):S91–S97. doi: 10.1086/377713. [DOI] [PubMed] [Google Scholar]
- 18.Centers for Disease Control and Prevention [Accessed May 17, 2012];Vaccines and immunizations: coverage with individual vaccines and vaccination series by state and local area, 2010. Available at: http://www.cdc.gov/vaccines/stats-surv/nis/data/tables_2010.htm.
- 19.Omer SB, Enger KS, Moulton LH, Halsey NA, Stokley S, Salmon DA. Geographic clustering of nonmedical exemptions to school immunization requirements and associations with geographic clustering of pertussis. Am J Epidemiol. 2008;168(12):1389–1396. doi: 10.1093/aje/kwn263. [DOI] [PubMed] [Google Scholar]
- 20.Glanz JM, McClure DL, Magid DJ, et al. Parental refusal of pertussis vaccination is associated with an increased risk of pertussis infection in children. Pediatrics. 2009;123(6):1446–1451. doi: 10.1542/peds.2008-2150. [DOI] [PubMed] [Google Scholar]
- 21.Glanz JM, McClure DL, Magid DJ, Daley MF, France EK, Hambidge SJ. Parental refusal of varicella vaccination and the associated risk of varicella infection in children. Arch Pediatr Adolesc Med. 2010;164(1):66–70. doi: 10.1001/archpediatrics.2009.244. [DOI] [PubMed] [Google Scholar]
- 22.Glanz JM, McClure DL, O’Leary ST, et al. Parental decline of pneumococcal vaccination and risk of pneumococcal related disease in children. Vaccine. 2011;29(5):994–999. doi: 10.1016/j.vaccine.2010.11.085. [DOI] [PMC free article] [PubMed] [Google Scholar]
- 23.Centers for Disease Control and Prevention Outbreak of measles–San Diego, California, January–February 2008. MMWR Morb Mortal Wkly Rep. 2008;57(8):203–206. [PubMed] [Google Scholar]
- 24.Lynfield R. Notes from the field: measles outbreak–Hennepin County, Minnesota, February–March 2011. MMWR Morb Mortal Wkly Rep. 2011;60(13):421. [PubMed] [Google Scholar]
- 25.Wallinga J, Heijne JCM, Kretzschmar M. A measles epidemic threshold in a highly vaccinated population. PLoS Med. 2005;2(11):e316. doi: 10.1371/journal.pmed.0020316. [DOI] [PMC free article] [PubMed] [Google Scholar]
- 26.Collier M. Notes from the field: measles outbreak–Indiana, June–July 2011. MMWR Morb Mortal Wkly Rep. 2011;60(34):1169. [PubMed] [Google Scholar]
- 27.Massey DS, Denton NA. The dimensions of residential segregation. Soc Forces. 1988;67(2):281–315. [Google Scholar]
- 28.Wallinga J, Levy-Bruhl D, Gay N, Wachmann C. Estimation of measles reproduction ratios and prospects for elimination of measles by vaccination in some Western European countries. Epidemiol Infect. 2001;127(2):281–295. doi: 10.1017/s095026880100601x. [DOI] [PMC free article] [PubMed] [Google Scholar]
- 29.Mossong J, Muller C. Estimation of the basic reproduction number of measles during an outbreak in a partially vaccinated population. Epidemiol Infect. 2000;124(2):273–278. doi: 10.1017/s0950268899003672. [DOI] [PMC free article] [PubMed] [Google Scholar]
- 30.van Boven M, Kretzschmar M, Wallinga J, O’Neill PD, Wichmann O, Hahné S. Estimation of measles vaccine efficacy and critical vaccination coverage in a highly vaccinated population. J R Soc Interface. 2010;7(52):1537–1544. doi: 10.1098/rsif.2010.0086. [DOI] [PMC free article] [PubMed] [Google Scholar]
- 31.Lee T, Sharifi M, Nickell S. [Accessed May 17, 2012];Vaccination status and school practices among California kindergartens with a high number of personal belief exemptors. Available at: http://cdc.confex.com/cdc/nic2010/webprogram/Paper22752.html.
- 32.California Dept of Health Services [Accessed May 17, 2012];2010 kindergarten assessment results. Available at: http://www. cdph.ca.gov/programs/immunize/Documents/2010KindergartenAssessmentReport.pdf.
- 33.California Dept of Health Services [Accessed May 17, 2012];2009 kindergarten assessment results. Available at: http://www.cdph.ca.gov/programs/immunize/Documents/2009KindergartenAssessmentReport.pdf.
- 34.California Dept of Health Services [Accessed May 17, 2012];2008 kindergarten assessment results. Available at: http://www.icphd.org/menu_file/2008_Kindergarten_Assessment_Report.pdf?u_id=1.
- 35.Muscat M, Bang H, Wohlfahrt J, Glismann S, Mølbak K. Measles in Europe: an epidemiological assessment. Lancet. 2009;373(9661):383–389. doi: 10.1016/S0140-6736(08)61849-8. [DOI] [PubMed] [Google Scholar]
- 36.Centers for Disease Control and Prevention Notifiable diseases and mortality tables. MMWR Morb Mort Wkly Rep. 2012;61(2):ND-16–ND-29. [Google Scholar]
- 37.Centers for Disease Control and Prevention Summary of notifiable diseases, United States 1996. MMWR Morb Mortal Wkly Rep. 1997;45(53):1–88. [PubMed] [Google Scholar]
- 38.Winter K, Harriman K, Schechter R, Yamada E, Talarico J, Chavez G. Notes from the field: pertussis–California, January–June 2010. MMWR Morb Mortal Wkly Rep. 2010;59(26):817. [Google Scholar]
- 39.Centers for Disease Control and Prevention [Accessed May 17, 2012];Pertussis (whooping cough) outbreaks. Available at: http://www.cdc.gov/pertussis/outbreaks.html.
Associated Data
This section collects any data citations, data availability statements, or supplementary materials included in this article.